Inventory of U.S. Greenhouse Gas Emissions and Sinks: … Summary ES-1 Executive Summary An...
29
Executive Summary ES-1 Executive Summary An emissions inventory that identifies and quantifies a country's anthropogenic 1 sources and sinks of greenhouse gases is essential for addressing climate change. This inventory adheres to both (1) a comprehensive and detailed set of methodologies for estimating sources and sinks of anthropogenic greenhouse gases, and (2) a common and consistent format that enables Parties to the United Nations Framework Convention on Climate Change (UNFCCC) to compare the relative contribution of different emission sources and greenhouse gases to climate change. In 1992, the United States signed and ratified the UNFCCC. As stated in Article 2 of the UNFCCC, “The ultimate objective of this Convention and any related legal instruments that the Conference of the Parties may adopt is to achieve, in accordance with the relevant provisions of the Convention, stabilization of greenhouse gas concentrations in the atmosphere at a level that would prevent dangerous anthropogenic interference with the climate system. Such a level should be achieved within a time-frame sufficient to allow ecosystems to adapt naturally to climate change, to ensure that food production is not threatened and to enable economic development to proceed in a sustainable manner.” 2 Parties to the Convention, by ratifying, “shall develop, periodically update, publish and make available…national inventories of anthropogenic emissions by sources and removals by sinks of all greenhouse gases not controlled by the Montreal Protocol, using comparable methodologies…” 3 The United States views this report as an opportunity to fulfill these commitments. This chapter summarizes the latest information on U.S. anthropogenic greenhouse gas emission trends from 1990 through 2016. To ensure that the U.S. emissions inventory is comparable to those of other UNFCCC Parties, the estimates presented here were calculated using methodologies consistent with those recommended in the 2006 Intergovernmental Panel on Climate Change (IPCC) Guidelines for National Greenhouse Gas Inventories (IPCC 2006). The structure of this report is consistent with the UNFCCC guidelines for inventory reporting, as discussed in Box ES-1. 4 Box ES-1: Methodological Approach for Estimating and Reporting U.S. Emissions and Removals In following the UNFCCC requirement under Article 4.1 to develop and submit national greenhouse gas emission inventories, the emissions and removals presented in this report and this chapter, are organized by source and sink categories and calculated using internationally-accepted methods provided by the IPCC in the 2006 IPCC Guidelines for National Greenhouse Gas Inventories (2006 IPCC Guidelines). Additionally, the calculated emissions and removals in a given year for the United States are presented in a common manner in line with the 1 The term “anthropogenic,” in this context, refers to greenhouse gas emissions and removals that are a direct result of human activities or are the result of natural processes that have been affected by human activities (IPCC 2006). 2 Article 2 of the Framework Convention on Climate Change published by the UNEP/WMO Information Unit on Climate Change. See <http://unfccc.int>. 3 Article 4(1)(a) of the United Nations Framework Convention on Climate Change (also identified in Article 12). Subsequent decisions by the Conference of the Parties elaborated the role of Annex I Parties in preparing national inventories. See <http://unfccc.int>. 4 See <http://unfccc.int/resource/docs/2013/cop19/eng/10a03.pdf>.
Transcript of Inventory of U.S. Greenhouse Gas Emissions and Sinks: … Summary ES-1 Executive Summary An...
Executive Summary ES-1
Executive Summary An emissions inventory that identifies and quantifies a country's anthropogenic1 sources and sinks of greenhouse
gases is essential for addressing climate change. This inventory adheres to both (1) a comprehensive and detailed set
of methodologies for estimating sources and sinks of anthropogenic greenhouse gases, and (2) a common and
consistent format that enables Parties to the United Nations Framework Convention on Climate Change (UNFCCC)
to compare the relative contribution of different emission sources and greenhouse gases to climate change.
In 1992, the United States signed and ratified the UNFCCC. As stated in Article 2 of the UNFCCC, “The ultimate
objective of this Convention and any related legal instruments that the Conference of the Parties may adopt is to
achieve, in accordance with the relevant provisions of the Convention, stabilization of greenhouse gas
concentrations in the atmosphere at a level that would prevent dangerous anthropogenic interference with the
climate system. Such a level should be achieved within a time-frame sufficient to allow ecosystems to adapt
naturally to climate change, to ensure that food production is not threatened and to enable economic development to
proceed in a sustainable manner.”2
Parties to the Convention, by ratifying, “shall develop, periodically update, publish and make available…national
inventories of anthropogenic emissions by sources and removals by sinks of all greenhouse gases not controlled by
the Montreal Protocol, using comparable methodologies…”3 The United States views this report as an opportunity
to fulfill these commitments.
This chapter summarizes the latest information on U.S. anthropogenic greenhouse gas emission trends from 1990
through 2016. To ensure that the U.S. emissions inventory is comparable to those of other UNFCCC Parties, the
estimates presented here were calculated using methodologies consistent with those recommended in the 2006
Intergovernmental Panel on Climate Change (IPCC) Guidelines for National Greenhouse Gas Inventories (IPCC
2006). The structure of this report is consistent with the UNFCCC guidelines for inventory reporting, as discussed in
Box ES-1.4
Box ES-1: Methodological Approach for Estimating and Reporting U.S. Emissions and Removals
In following the UNFCCC requirement under Article 4.1 to develop and submit national greenhouse gas emission
inventories, the emissions and removals presented in this report and this chapter, are organized by source and sink
categories and calculated using internationally-accepted methods provided by the IPCC in the 2006 IPCC
Guidelines for National Greenhouse Gas Inventories (2006 IPCC Guidelines). Additionally, the calculated
emissions and removals in a given year for the United States are presented in a common manner in line with the
1 The term “anthropogenic,” in this context, refers to greenhouse gas emissions and removals that are a direct result of human
activities or are the result of natural processes that have been affected by human activities (IPCC 2006). 2 Article 2 of the Framework Convention on Climate Change published by the UNEP/WMO Information Unit on Climate
Change. See <http://unfccc.int>. 3 Article 4(1)(a) of the United Nations Framework Convention on Climate Change (also identified in Article 12). Subsequent
decisions by the Conference of the Parties elaborated the role of Annex I Parties in preparing national inventories. See
<http://unfccc.int>. 4 See <http://unfccc.int/resource/docs/2013/cop19/eng/10a03.pdf>.
ES-2 Inventory of U.S. Greenhouse Gas Emissions and Sinks: 1990–2016
UNFCCC reporting guidelines for the reporting of inventories under this international agreement. The use of
consistent methods to calculate emissions and removals by all nations providing their inventories to the UNFCCC
ensures that these reports are comparable. The presentation of emissions and removals provided in this Inventory
does not preclude alternative examinations, but rather this Inventory presents emissions and removals in a common
format consistent with how countries are to report Inventories under the UNFCCC. The report itself, and this
chapter, follows this standardized format, and provides an explanation of the application of methods used to
calculate emissions and removals.
Box ES-2: EPA’s Greenhouse Gas Reporting Program
On October 30, 2009, the U.S. Environmental Protection Agency (EPA) promulgated a rule requiring annual
reporting of greenhouse gas data from large greenhouse gas emissions sources in the United States. Implementation
of the rule, codified at 40 CFR Part 98, is referred to as EPA’s Greenhouse Gas Reporting Program (GHGRP). The
rule applies to direct greenhouse gas emitters, fossil fuel suppliers, industrial gas suppliers, and facilities that inject
carbon dioxide (CO2) underground for sequestration or other reasons.5 Annual reporting is at the facility level,
except for certain suppliers of fossil fuels and industrial greenhouse gases.
EPA’s GHGRP dataset and the data presented in this Inventory report are complementary. The GHGRP dataset
continues to be an important resource for the Inventory, providing not only annual emissions information, but also
other annual information, such as activity data and emission factors that can improve and refine national emission
estimates and trends over time. GHGRP data also allow EPA to disaggregate national inventory estimates in new
ways that can highlight differences across regions and sub-categories of emissions, along with enhancing application
of QA/QC procedures and assessment of uncertainties.
EPA uses annual GHGRP data in a number of categories to improve the national estimates presented in this
Inventory consistent with IPCC guidance.6
ES.1 Background Information Greenhouse gases absorb infrared radiation, thereby trapping heat and making the planet warmer. The most
important greenhouse gases directly emitted by humans include carbon dioxide (CO2), methane (CH4), nitrous oxide
(N2O), and several other fluorine-containing halogenated substances. Although CO2, CH4, and N2O occur naturally
in the atmosphere, human activities have changed their atmospheric concentrations. From the pre-industrial era (i.e.,
ending about 1750) to 2016, concentrations of these greenhouse gases have increased globally by 44, 163, and 22
percent, respectively (IPCC 2013; NOAA/ESRL 2017a, 2017b, 2017c). This annual report estimates the total
national greenhouse gas emissions and removals associated with human activities across the United States.
Global Warming Potentials Gases in the atmosphere can contribute to climate change both directly and indirectly. Direct effects occur when the
gas itself absorbs radiation. Indirect radiative forcing occurs when chemical transformations of the substance
produce other greenhouse gases, when a gas influences the atmospheric lifetimes of other gases, and/or when a gas
affects atmospheric processes that alter the radiative balance of the earth (e.g., affect cloud formation or albedo).7
5 See <http://www.epa.gov/ghgreporting> and <http://ghgdata.epa.gov/ghgp/main.do>. 6 See <http://www.ipcc-nggip.iges.or.jp/public/tb/TFI_Technical_Bulletin_1.pdf>. 7 Albedo is a measure of the Earth’s reflectivity, and is defined as the fraction of the total solar radiation incident on a body that
is reflected by it.
Executive Summary ES-3
The IPCC developed the Global Warming Potential (GWP) concept to compare the ability of each greenhouse gas to
trap heat in the atmosphere relative to another gas.
The GWP of a greenhouse gas is defined as the ratio of the accumulated radiative forcing within a specific time
horizon caused by emitting 1 kilogram of the gas, relative to that of the reference gas CO2 (IPCC 2014). The
reference gas used is CO2, and therefore GWP-weighted emissions can be provided in million metric tons of CO2
equivalent (MMT CO2 Eq.).8,9 All gases in this Executive Summary are presented in units of MMT CO2 Eq.
Emissions by gas in unweighted mass kilotons are provided in the Trends chapter of this report.
UNFCCC reporting guidelines for national inventories require the use of GWP values from the IPCC Fourth
Assessment Report (AR4) (IPCC 2007).10 All estimates are provided throughout the report in both CO2 equivalents
and unweighted units. A comparison of emission values using the AR4 GWP values versus the SAR (IPCC 1996),
and the IPCC Fifth Assessment Report (AR5) (IPCC 2013) GWP values can be found in Chapter 1 and, in more
detail, in Annex 6.1 of this report. The GWP values used in this report are listed below in Table ES-1.
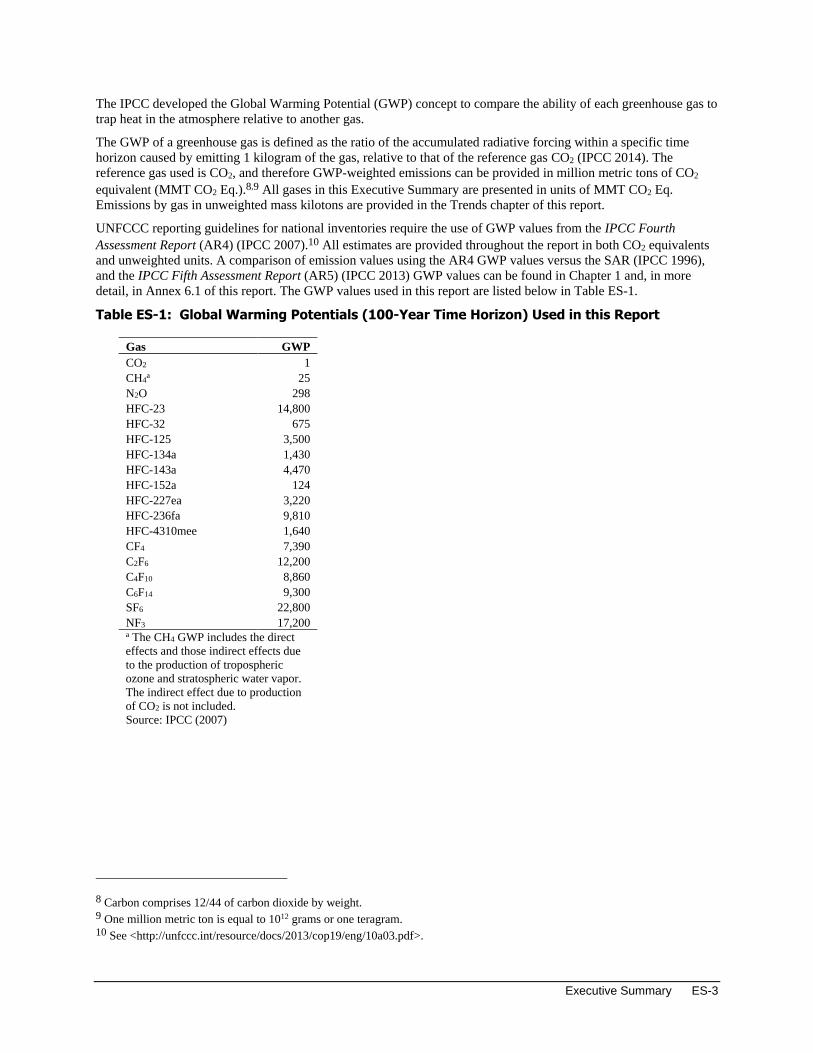
Table ES-1: Global Warming Potentials (100-Year Time Horizon) Used in this Report
Gas GWP
CO2 1
CH4a 25
N2O 298
HFC-23 14,800
HFC-32 675
HFC-125 3,500
HFC-134a 1,430
HFC-143a 4,470
HFC-152a 124
HFC-227ea 3,220
HFC-236fa 9,810
HFC-4310mee 1,640
CF4 7,390
C2F6 12,200
C4F10 8,860
C6F14 9,300
SF6 22,800
NF3 17,200
a The CH4 GWP includes the direct
effects and those indirect effects due
to the production of tropospheric
ozone and stratospheric water vapor.
The indirect effect due to production
of CO2 is not included.
Source: IPCC (2007)
8 Carbon comprises 12/44 of carbon dioxide by weight. 9 One million metric ton is equal to 1012 grams or one teragram. 10 See <http://unfccc.int/resource/docs/2013/cop19/eng/10a03.pdf>.
ES-4 Inventory of U.S. Greenhouse Gas Emissions and Sinks: 1990–2016
ES.2 Recent Trends in U.S. Greenhouse Gas Emissions and Sinks
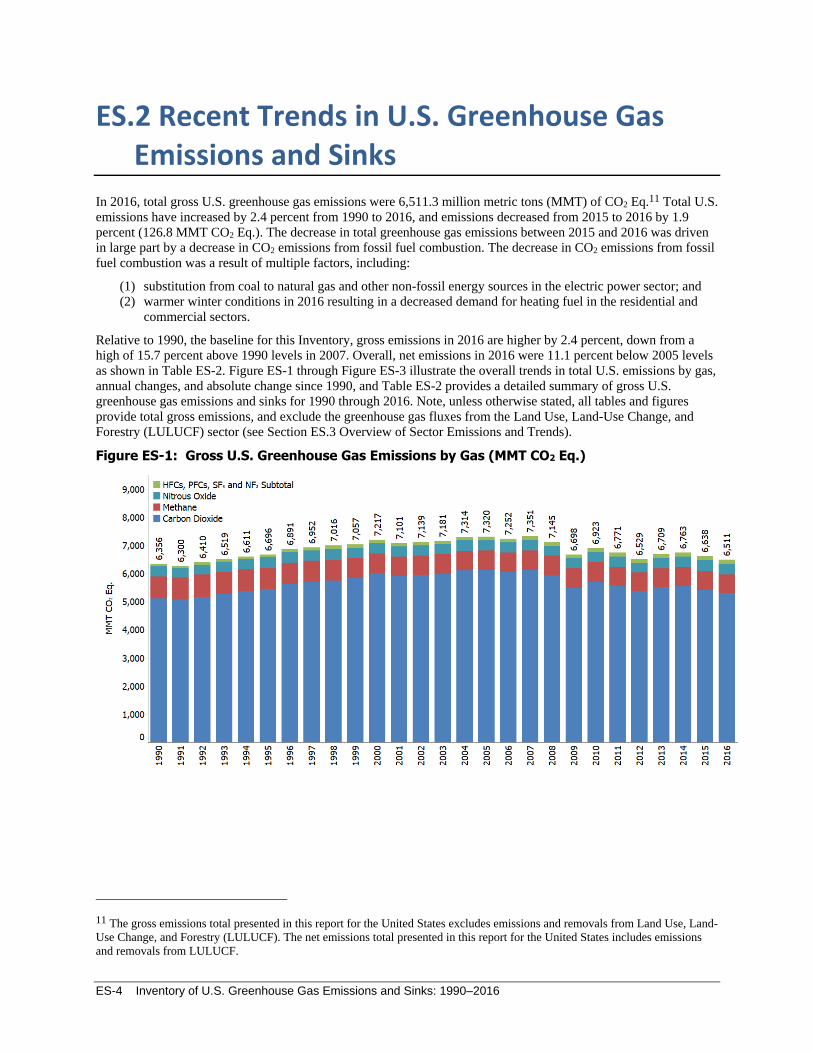
In 2016, total gross U.S. greenhouse gas emissions were 6,511.3 million metric tons (MMT) of CO2 Eq.11 Total U.S.
emissions have increased by 2.4 percent from 1990 to 2016, and emissions decreased from 2015 to 2016 by 1.9
percent (126.8 MMT CO2 Eq.). The decrease in total greenhouse gas emissions between 2015 and 2016 was driven
in large part by a decrease in CO2 emissions from fossil fuel combustion. The decrease in CO2 emissions from fossil
fuel combustion was a result of multiple factors, including:
(1) substitution from coal to natural gas and other non-fossil energy sources in the electric power sector; and
(2) warmer winter conditions in 2016 resulting in a decreased demand for heating fuel in the residential and
commercial sectors.
Relative to 1990, the baseline for this Inventory, gross emissions in 2016 are higher by 2.4 percent, down from a
high of 15.7 percent above 1990 levels in 2007. Overall, net emissions in 2016 were 11.1 percent below 2005 levels
as shown in Table ES-2. Figure ES-1 through Figure ES-3 illustrate the overall trends in total U.S. emissions by gas,
annual changes, and absolute change since 1990, and Table ES-2 provides a detailed summary of gross U.S.
greenhouse gas emissions and sinks for 1990 through 2016. Note, unless otherwise stated, all tables and figures
provide total gross emissions, and exclude the greenhouse gas fluxes from the Land Use, Land-Use Change, and
Forestry (LULUCF) sector (see Section ES.3 Overview of Sector Emissions and Trends).
Figure ES-1: Gross U.S. Greenhouse Gas Emissions by Gas (MMT CO2 Eq.)
11 The gross emissions total presented in this report for the United States excludes emissions and removals from Land Use, Land-
Use Change, and Forestry (LULUCF). The net emissions total presented in this report for the United States includes emissions
and removals from LULUCF.
Executive Summary ES-5
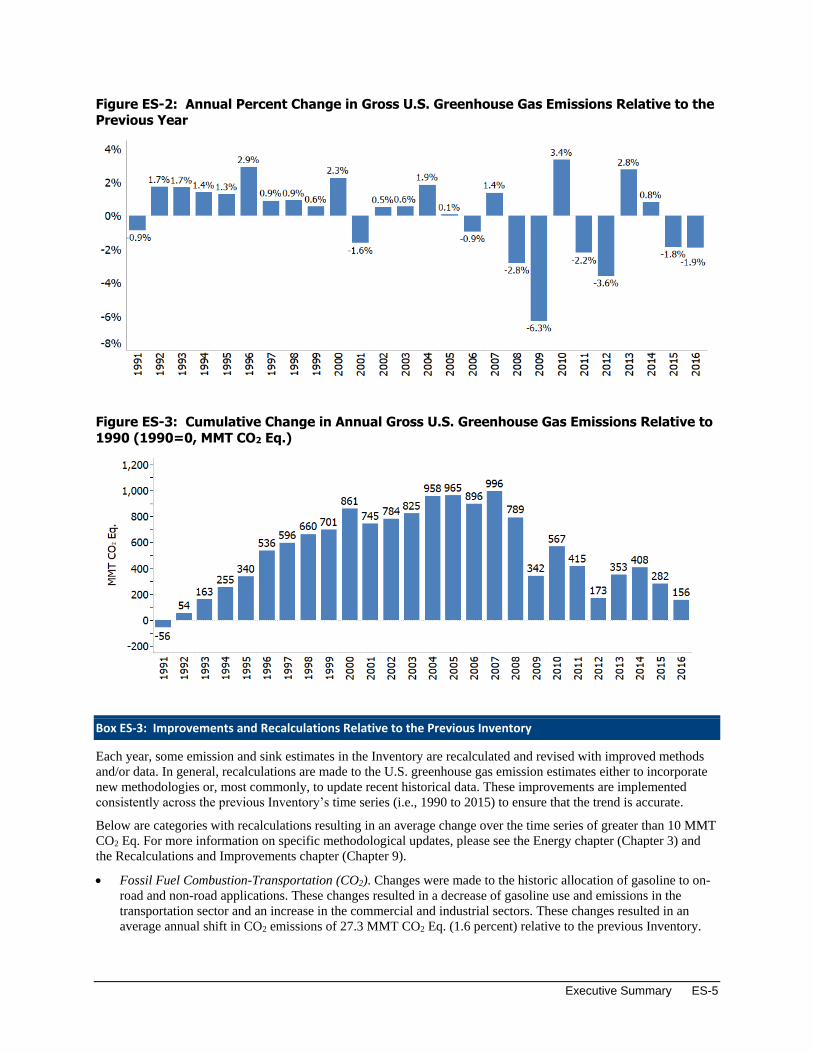
Figure ES-2: Annual Percent Change in Gross U.S. Greenhouse Gas Emissions Relative to the Previous Year
Figure ES-3: Cumulative Change in Annual Gross U.S. Greenhouse Gas Emissions Relative to 1990 (1990=0, MMT CO2 Eq.)
Box ES-3: Improvements and Recalculations Relative to the Previous Inventory
Each year, some emission and sink estimates in the Inventory are recalculated and revised with improved methods
and/or data. In general, recalculations are made to the U.S. greenhouse gas emission estimates either to incorporate
new methodologies or, most commonly, to update recent historical data. These improvements are implemented
consistently across the previous Inventory’s time series (i.e., 1990 to 2015) to ensure that the trend is accurate.
Below are categories with recalculations resulting in an average change over the time series of greater than 10 MMT
CO2 Eq. For more information on specific methodological updates, please see the Energy chapter (Chapter 3) and
the Recalculations and Improvements chapter (Chapter 9).
• Fossil Fuel Combustion-Transportation (CO2). Changes were made to the historic allocation of gasoline to on-
road and non-road applications. These changes resulted in a decrease of gasoline use and emissions in the
transportation sector and an increase in the commercial and industrial sectors. These changes resulted in an
average annual shift in CO2 emissions of 27.3 MMT CO2 Eq. (1.6 percent) relative to the previous Inventory.
ES-6 Inventory of U.S. Greenhouse Gas Emissions and Sinks: 1990–2016
• Petroleum Systems (CH4). Average decrease of 13.4 MMT CO2 Eq. (28 percent) for a given year relative to
the estimate provided in the previous Inventory, resulting primarily from recalculation of associated gas
venting and flaring emissions using a basin-level approach. In addition, recalculations of CO2 emissions for
petroleum systems resulted in an increase of 9.1 MMT CO2 (240 percent) for a given year relative to the
estimate provided in the previous Inventory, resulting primarily from reallocation of CO2 from flaring to
petroleum systems from natural gas systems. Further details on the methodological improvements can be
found in Section 3.6 of the Energy chapter (Chapter 3).
• Natural Gas Systems (CO2). Average decrease of 10.5 MMT CO2 Eq. (29 percent) for a given year relative
to the estimate provided in the previous Inventory, resulting primarily from reallocation of CO2 from
flaring to petroleum systems from natural gas systems. Further details on the methodological improvements
can be found in Section 3.7 of the Energy chapter (Chapter 3).
• Other improvements of note include recalculations of CH4 estimates from Municipal Solid Waste (MSW)
Landfills (See Section 7.1 of the Waste chapter).
In implementing improvements, the United States follows the 2006 IPCC Guidelines (IPCC 2006), which states,
“Both methodological changes and refinements over time are an essential part of improving inventory quality. It is
good practice to change or refine methods when: available data have changed; the previously used method is not
consistent with the IPCC guidelines for that category; a category has become key; the previously used method is
insufficient to reflect mitigation activities in a transparent manner; the capacity for inventory preparation has
increased; new inventory methods become available; and for correction of errors.”
In each Inventory, the results of all methodological changes and historical data updates are presented in the
Recalculations and Improvements chapter of this report; and detailed descriptions of each recalculation including
references for data, are provided within each source or sink’s description in the report, if applicable. Changes in
historical data are generally the result of changes in statistical data supplied by other agencies.
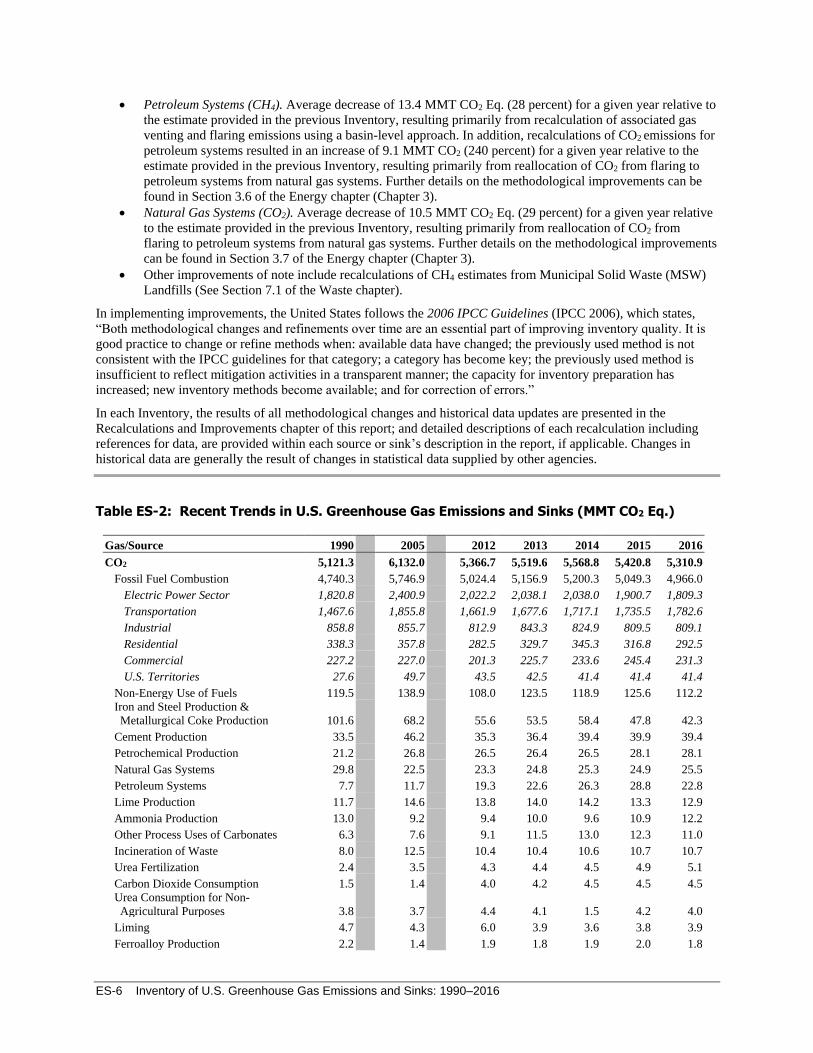
Table ES-2: Recent Trends in U.S. Greenhouse Gas Emissions and Sinks (MMT CO2 Eq.)
Gas/Source 1990 2005 2012 2013 2014 2015 2016
CO2 5,121.3 6,132.0 5,366.7 5,519.6 5,568.8 5,420.8 5,310.9
Fossil Fuel Combustion 4,740.3 5,746.9 5,024.4 5,156.9 5,200.3 5,049.3 4,966.0
Electric Power Sector 1,820.8 2,400.9 2,022.2 2,038.1 2,038.0 1,900.7 1,809.3
Transportation 1,467.6 1,855.8 1,661.9 1,677.6 1,717.1 1,735.5 1,782.6
Industrial 858.8 855.7 812.9 843.3 824.9 809.5 809.1
Residential 338.3 357.8 282.5 329.7 345.3 316.8 292.5
Commercial 227.2 227.0 201.3 225.7 233.6 245.4 231.3
U.S. Territories 27.6 49.7 43.5 42.5 41.4 41.4 41.4
Non-Energy Use of Fuels 119.5 138.9 108.0 123.5 118.9 125.6 112.2
Iron and Steel Production &
Metallurgical Coke Production 101.6 68.2 55.6 53.5 58.4 47.8 42.3
Cement Production 33.5 46.2 35.3 36.4 39.4 39.9 39.4
Petrochemical Production 21.2 26.8 26.5 26.4 26.5 28.1 28.1
Natural Gas Systems 29.8 22.5 23.3 24.8 25.3 24.9 25.5
Petroleum Systems 7.7 11.7 19.3 22.6 26.3 28.8 22.8
Lime Production 11.7 14.6 13.8 14.0 14.2 13.3 12.9
Ammonia Production 13.0 9.2 9.4 10.0 9.6 10.9 12.2
Other Process Uses of Carbonates 6.3 7.6 9.1 11.5 13.0 12.3 11.0
Incineration of Waste 8.0 12.5 10.4 10.4 10.6 10.7 10.7
Urea Fertilization 2.4 3.5 4.3 4.4 4.5 4.9 5.1
Carbon Dioxide Consumption 1.5 1.4 4.0 4.2 4.5 4.5 4.5
Urea Consumption for Non-
Agricultural Purposes 3.8 3.7 4.4 4.1 1.5 4.2 4.0
Liming 4.7 4.3 6.0 3.9 3.6 3.8 3.9
Ferroalloy Production 2.2 1.4 1.9 1.8 1.9 2.0 1.8
Executive Summary ES-7
Soda Ash Production 1.4 1.7 1.7 1.7 1.7 1.7 1.7
Titanium Dioxide Production 1.2 1.8 1.5 1.7 1.7 1.6 1.6
Aluminum Production 6.8 4.1 3.4 3.3 2.8 2.8 1.3
Glass Production 1.5 1.9 1.2 1.3 1.3 1.3 1.2
Phosphoric Acid Production 1.5 1.3 1.1 1.1 1.0 1.0 1.0
Zinc Production 0.6 1.0 1.5 1.4 1.0 0.9 0.9
Lead Production 0.5 0.6 0.5 0.5 0.5 0.5 0.5
Silicon Carbide Production and
Consumption 0.4 0.2 0.2 0.2 0.2 0.2 0.2
Abandoned Oil and Gas Wells + + + + + + +
Magnesium Production and Processing + + + + + + +
Wood Biomass, Ethanol, and Biodiesel
Consumptiona 219.4 230.7 287.7 316.4 324.3 310.4 309.3
International Bunker Fuelsb 103.5 113.1 105.8 99.8 103.4 110.9 116.6
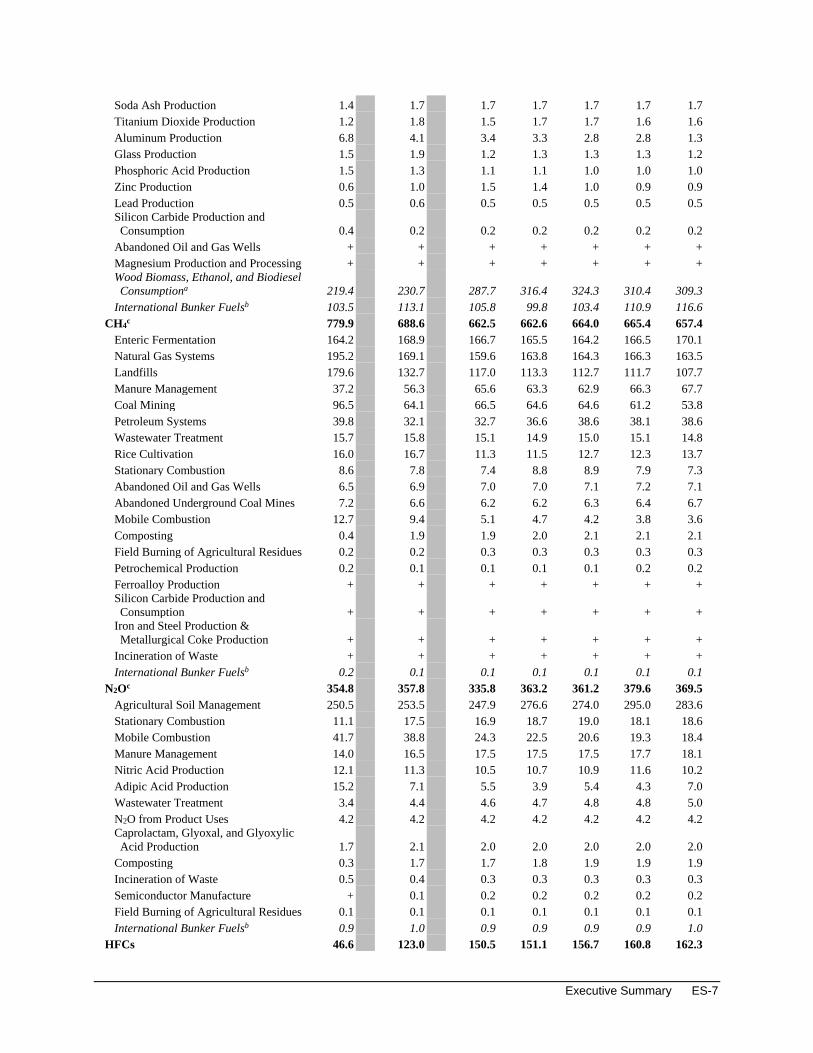
CH4c 779.9 688.6 662.5 662.6 664.0 665.4 657.4
Enteric Fermentation 164.2 168.9 166.7 165.5 164.2 166.5 170.1
Natural Gas Systems 195.2 169.1 159.6 163.8 164.3 166.3 163.5
Landfills 179.6 132.7 117.0 113.3 112.7 111.7 107.7
Manure Management 37.2 56.3 65.6 63.3 62.9 66.3 67.7
Coal Mining 96.5 64.1 66.5 64.6 64.6 61.2 53.8
Petroleum Systems 39.8 32.1 32.7 36.6 38.6 38.1 38.6
Wastewater Treatment 15.7 15.8 15.1 14.9 15.0 15.1 14.8
Rice Cultivation 16.0 16.7 11.3 11.5 12.7 12.3 13.7
Stationary Combustion 8.6 7.8 7.4 8.8 8.9 7.9 7.3
Abandoned Oil and Gas Wells 6.5 6.9 7.0 7.0 7.1 7.2 7.1
Abandoned Underground Coal Mines 7.2 6.6 6.2 6.2 6.3 6.4 6.7
Mobile Combustion 12.7 9.4 5.1 4.7 4.2 3.8 3.6
Composting 0.4 1.9 1.9 2.0 2.1 2.1 2.1
Field Burning of Agricultural Residues 0.2 0.2 0.3 0.3 0.3 0.3 0.3
Petrochemical Production 0.2 0.1 0.1 0.1 0.1 0.2 0.2
Ferroalloy Production + + + + + + +
Silicon Carbide Production and
Consumption + + + + + + +
Iron and Steel Production &
Metallurgical Coke Production + + + + + + +
Incineration of Waste + + + + + + +
International Bunker Fuelsb 0.2 0.1 0.1 0.1 0.1 0.1 0.1
N2Oc 354.8 357.8 335.8 363.2 361.2 379.6 369.5
Agricultural Soil Management 250.5 253.5 247.9 276.6 274.0 295.0 283.6
Stationary Combustion 11.1 17.5 16.9 18.7 19.0 18.1 18.6
Mobile Combustion 41.7 38.8 24.3 22.5 20.6 19.3 18.4
Manure Management 14.0 16.5 17.5 17.5 17.5 17.7 18.1
Nitric Acid Production 12.1 11.3 10.5 10.7 10.9 11.6 10.2
Adipic Acid Production 15.2 7.1 5.5 3.9 5.4 4.3 7.0
Wastewater Treatment 3.4 4.4 4.6 4.7 4.8 4.8 5.0
N2O from Product Uses 4.2 4.2 4.2 4.2 4.2 4.2 4.2
Caprolactam, Glyoxal, and Glyoxylic
Acid Production 1.7 2.1 2.0 2.0 2.0 2.0 2.0
Composting 0.3 1.7 1.7 1.8 1.9 1.9 1.9
Incineration of Waste 0.5 0.4 0.3 0.3 0.3 0.3 0.3
Semiconductor Manufacture + 0.1 0.2 0.2 0.2 0.2 0.2
Field Burning of Agricultural Residues 0.1 0.1 0.1 0.1 0.1 0.1 0.1
International Bunker Fuelsb 0.9 1.0 0.9 0.9 0.9 0.9 1.0
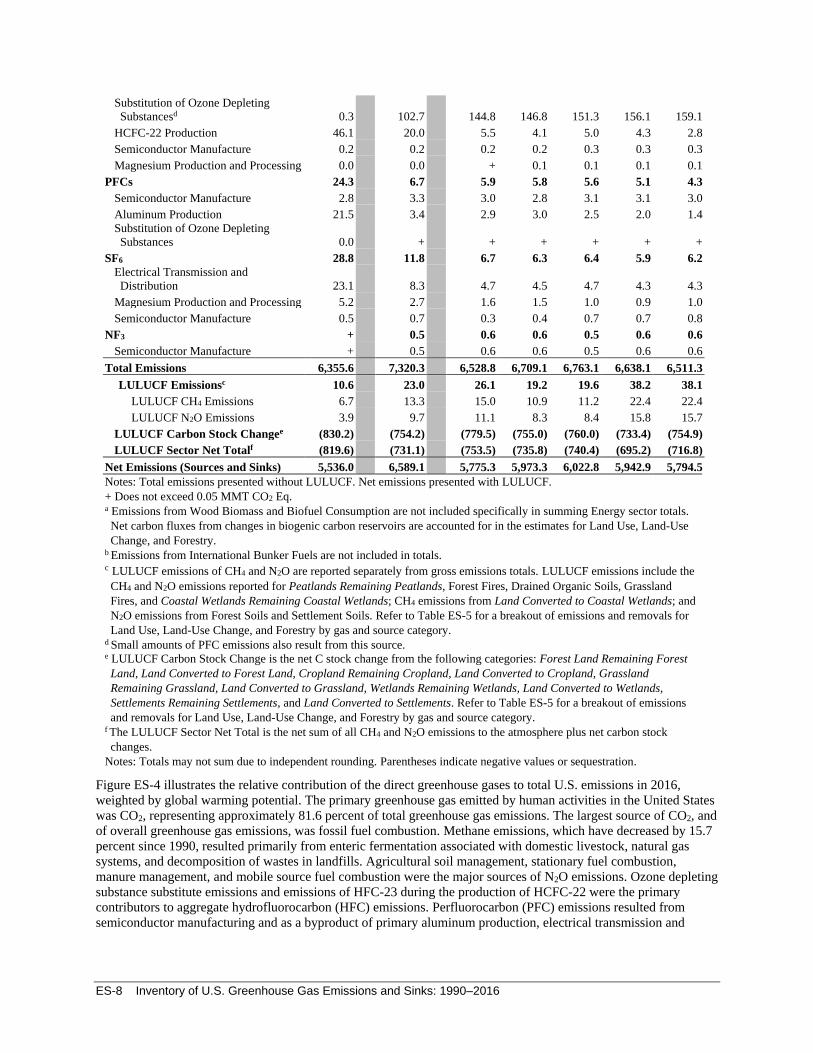
HFCs 46.6 123.0 150.5 151.1 156.7 160.8 162.3
ES-8 Inventory of U.S. Greenhouse Gas Emissions and Sinks: 1990–2016
Substitution of Ozone Depleting
Substancesd 0.3 102.7 144.8 146.8 151.3 156.1 159.1
HCFC-22 Production 46.1 20.0 5.5 4.1 5.0 4.3 2.8
Semiconductor Manufacture 0.2 0.2 0.2 0.2 0.3 0.3 0.3
Magnesium Production and Processing 0.0 0.0 + 0.1 0.1 0.1 0.1
PFCs 24.3 6.7 5.9 5.8 5.6 5.1 4.3
Semiconductor Manufacture 2.8 3.3 3.0 2.8 3.1 3.1 3.0
Aluminum Production 21.5 3.4 2.9 3.0 2.5 2.0 1.4
Substitution of Ozone Depleting
Substances 0.0 + + + + + +
SF6 28.8 11.8 6.7 6.3 6.4 5.9 6.2
Electrical Transmission and
Distribution 23.1 8.3 4.7 4.5 4.7 4.3 4.3
Magnesium Production and Processing 5.2 2.7 1.6 1.5 1.0 0.9 1.0
Semiconductor Manufacture 0.5 0.7 0.3 0.4 0.7 0.7 0.8
NF3 + 0.5 0.6 0.6 0.5 0.6 0.6
Semiconductor Manufacture + 0.5 0.6 0.6 0.5 0.6 0.6
Total Emissions 6,355.6 7,320.3 6,528.8 6,709.1 6,763.1 6,638.1 6,511.3
LULUCF Emissionsc 10.6 23.0 26.1 19.2 19.6 38.2 38.1
LULUCF CH4 Emissions 6.7 13.3 15.0 10.9 11.2 22.4 22.4
LULUCF N2O Emissions 3.9 9.7 11.1 8.3 8.4 15.8 15.7
LULUCF Carbon Stock Changee (830.2) (754.2) (779.5) (755.0) (760.0) (733.4) (754.9)
LULUCF Sector Net Totalf (819.6) (731.1) (753.5) (735.8) (740.4) (695.2) (716.8)
Net Emissions (Sources and Sinks) 5,536.0 6,589.1 5,775.3 5,973.3 6,022.8 5,942.9 5,794.5
Notes: Total emissions presented without LULUCF. Net emissions presented with LULUCF.
+ Does not exceed 0.05 MMT CO2 Eq. a Emissions from Wood Biomass and Biofuel Consumption are not included specifically in summing Energy sector totals.
Net carbon fluxes from changes in biogenic carbon reservoirs are accounted for in the estimates for Land Use, Land-Use
Change, and Forestry. b Emissions from International Bunker Fuels are not included in totals. c LULUCF emissions of CH4 and N2O are reported separately from gross emissions totals. LULUCF emissions include the
CH4 and N2O emissions reported for Peatlands Remaining Peatlands, Forest Fires, Drained Organic Soils, Grassland
Fires, and Coastal Wetlands Remaining Coastal Wetlands; CH4 emissions from Land Converted to Coastal Wetlands; and
N2O emissions from Forest Soils and Settlement Soils. Refer to Table ES-5 for a breakout of emissions and removals for
Land Use, Land-Use Change, and Forestry by gas and source category. d Small amounts of PFC emissions also result from this source. e LULUCF Carbon Stock Change is the net C stock change from the following categories: Forest Land Remaining Forest
Land, Land Converted to Forest Land, Cropland Remaining Cropland, Land Converted to Cropland, Grassland
Remaining Grassland, Land Converted to Grassland, Wetlands Remaining Wetlands, Land Converted to Wetlands,
Settlements Remaining Settlements, and Land Converted to Settlements. Refer to Table ES-5 for a breakout of emissions
and removals for Land Use, Land-Use Change, and Forestry by gas and source category. f The LULUCF Sector Net Total is the net sum of all CH4 and N2O emissions to the atmosphere plus net carbon stock
changes.
Notes: Totals may not sum due to independent rounding. Parentheses indicate negative values or sequestration.
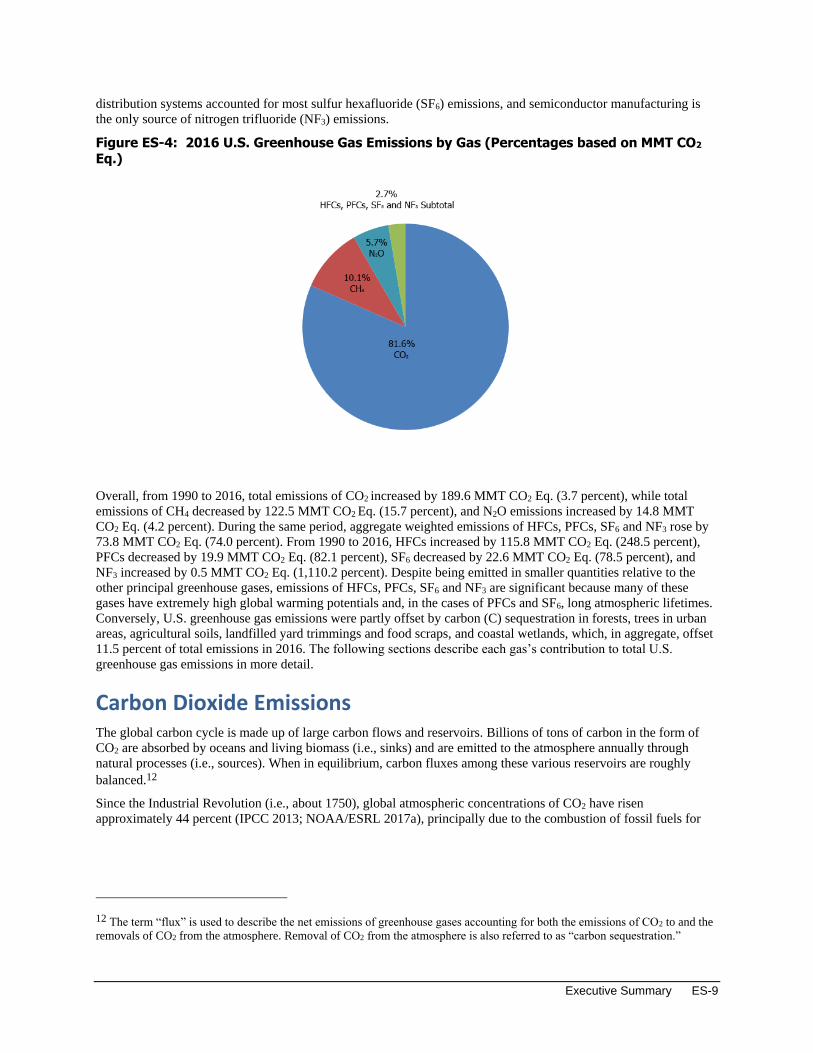
Figure ES-4 illustrates the relative contribution of the direct greenhouse gases to total U.S. emissions in 2016,
weighted by global warming potential. The primary greenhouse gas emitted by human activities in the United States
was CO2, representing approximately 81.6 percent of total greenhouse gas emissions. The largest source of CO2, and
of overall greenhouse gas emissions, was fossil fuel combustion. Methane emissions, which have decreased by 15.7
percent since 1990, resulted primarily from enteric fermentation associated with domestic livestock, natural gas
systems, and decomposition of wastes in landfills. Agricultural soil management, stationary fuel combustion,
manure management, and mobile source fuel combustion were the major sources of N2O emissions. Ozone depleting
substance substitute emissions and emissions of HFC-23 during the production of HCFC-22 were the primary
contributors to aggregate hydrofluorocarbon (HFC) emissions. Perfluorocarbon (PFC) emissions resulted from
semiconductor manufacturing and as a byproduct of primary aluminum production, electrical transmission and
Executive Summary ES-9
distribution systems accounted for most sulfur hexafluoride (SF6) emissions, and semiconductor manufacturing is
the only source of nitrogen trifluoride (NF3) emissions.
Figure ES-4: 2016 U.S. Greenhouse Gas Emissions by Gas (Percentages based on MMT CO2 Eq.)
Overall, from 1990 to 2016, total emissions of CO2 increased by 189.6 MMT CO2 Eq. (3.7 percent), while total
emissions of CH4 decreased by 122.5 MMT CO2 Eq. (15.7 percent), and N2O emissions increased by 14.8 MMT
CO2 Eq. (4.2 percent). During the same period, aggregate weighted emissions of HFCs, PFCs, SF6 and NF3 rose by
73.8 MMT CO2 Eq. (74.0 percent). From 1990 to 2016, HFCs increased by 115.8 MMT CO2 Eq. (248.5 percent),
PFCs decreased by 19.9 MMT CO2 Eq. (82.1 percent), SF6 decreased by 22.6 MMT CO2 Eq. (78.5 percent), and
NF3 increased by 0.5 MMT CO2 Eq. (1,110.2 percent). Despite being emitted in smaller quantities relative to the
other principal greenhouse gases, emissions of HFCs, PFCs, SF6 and NF3 are significant because many of these
gases have extremely high global warming potentials and, in the cases of PFCs and SF6, long atmospheric lifetimes.
Conversely, U.S. greenhouse gas emissions were partly offset by carbon (C) sequestration in forests, trees in urban
areas, agricultural soils, landfilled yard trimmings and food scraps, and coastal wetlands, which, in aggregate, offset
11.5 percent of total emissions in 2016. The following sections describe each gas’s contribution to total U.S.
greenhouse gas emissions in more detail.
Carbon Dioxide Emissions The global carbon cycle is made up of large carbon flows and reservoirs. Billions of tons of carbon in the form of
CO2 are absorbed by oceans and living biomass (i.e., sinks) and are emitted to the atmosphere annually through
natural processes (i.e., sources). When in equilibrium, carbon fluxes among these various reservoirs are roughly
balanced.12
Since the Industrial Revolution (i.e., about 1750), global atmospheric concentrations of CO2 have risen
approximately 44 percent (IPCC 2013; NOAA/ESRL 2017a), principally due to the combustion of fossil fuels for
12 The term “flux” is used to describe the net emissions of greenhouse gases accounting for both the emissions of CO2 to and the
removals of CO2 from the atmosphere. Removal of CO2 from the atmosphere is also referred to as “carbon sequestration.”
ES-10 Inventory of U.S. Greenhouse Gas Emissions and Sinks: 1990–2016
energy. Globally, approximately 32,294 MMT of CO2 were added to the atmosphere through the combustion of
fossil fuels in 2015, of which the United States accounted for approximately 15 percent.13
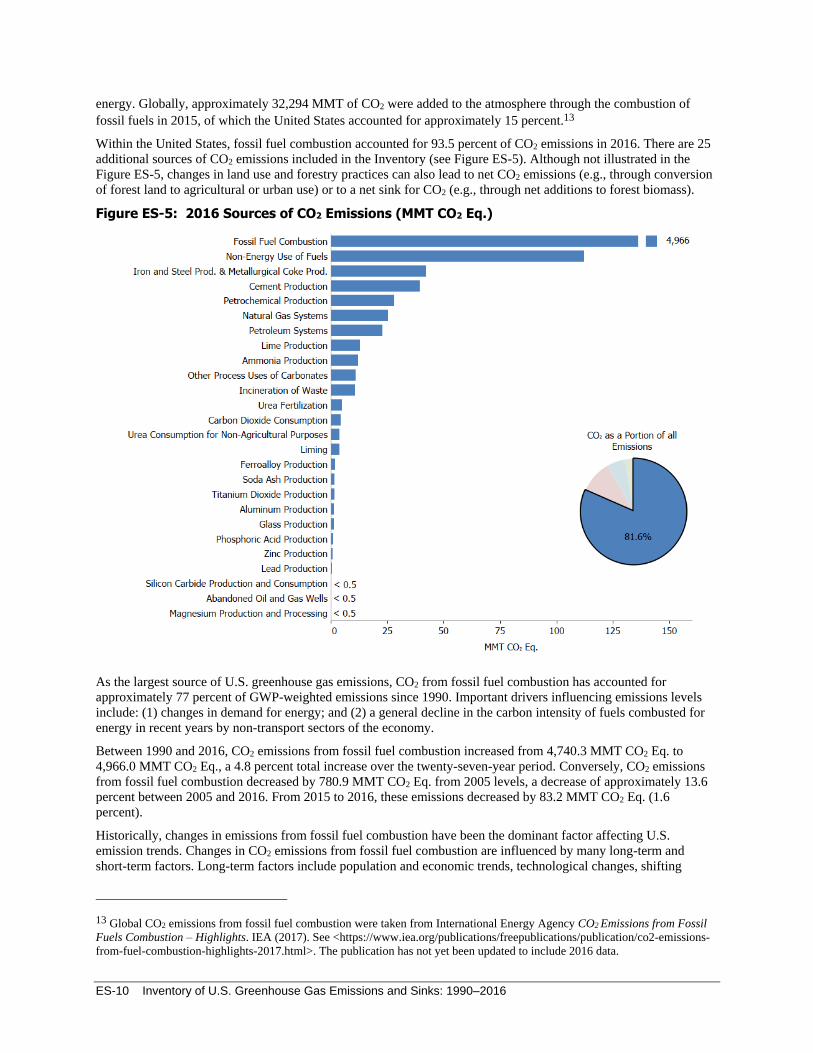
Within the United States, fossil fuel combustion accounted for 93.5 percent of CO2 emissions in 2016. There are 25
additional sources of CO2 emissions included in the Inventory (see Figure ES-5). Although not illustrated in the
Figure ES-5, changes in land use and forestry practices can also lead to net CO2 emissions (e.g., through conversion
of forest land to agricultural or urban use) or to a net sink for CO2 (e.g., through net additions to forest biomass).
Figure ES-5: 2016 Sources of CO2 Emissions (MMT CO2 Eq.)
As the largest source of U.S. greenhouse gas emissions, CO2 from fossil fuel combustion has accounted for
approximately 77 percent of GWP-weighted emissions since 1990. Important drivers influencing emissions levels
include: (1) changes in demand for energy; and (2) a general decline in the carbon intensity of fuels combusted for
energy in recent years by non-transport sectors of the economy.
Between 1990 and 2016, CO2 emissions from fossil fuel combustion increased from 4,740.3 MMT CO2 Eq. to
4,966.0 MMT CO2 Eq., a 4.8 percent total increase over the twenty-seven-year period. Conversely, CO2 emissions
from fossil fuel combustion decreased by 780.9 MMT CO2 Eq. from 2005 levels, a decrease of approximately 13.6
percent between 2005 and 2016. From 2015 to 2016, these emissions decreased by 83.2 MMT CO2 Eq. (1.6
percent).
Historically, changes in emissions from fossil fuel combustion have been the dominant factor affecting U.S.
emission trends. Changes in CO2 emissions from fossil fuel combustion are influenced by many long-term and
short-term factors. Long-term factors include population and economic trends, technological changes, shifting
13 Global CO2 emissions from fossil fuel combustion were taken from International Energy Agency CO2 Emissions from Fossil
Fuels Combustion – Highlights. IEA (2017). See <https://www.iea.org/publications/freepublications/publication/co2-emissions-
from-fuel-combustion-highlights-2017.html>. The publication has not yet been updated to include 2016 data.
Executive Summary ES-11
energy fuel choices, and various policies at the national, state, and local level. In the short term, the overall
consumption and mix of fossil fuels in the United States fluctuates primarily in response to changes in general
economic conditions, overall energy prices, the relative price of different fuels, weather, and the availability of non-
fossil alternatives.
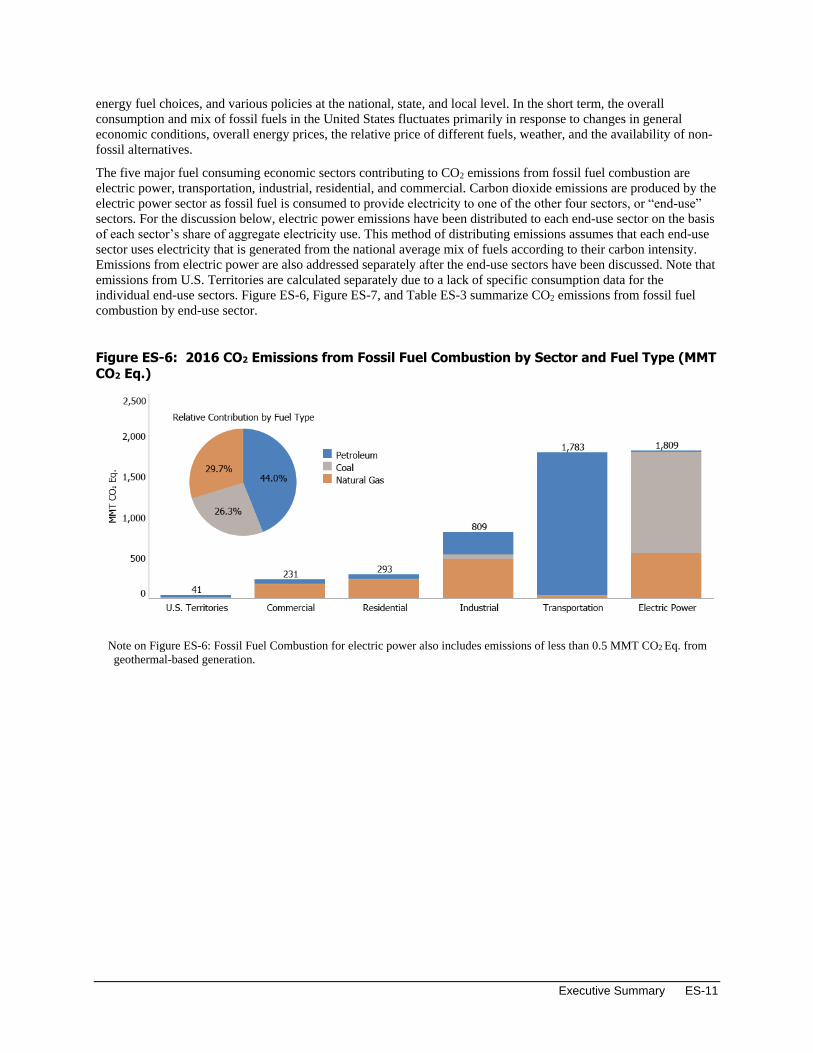
The five major fuel consuming economic sectors contributing to CO2 emissions from fossil fuel combustion are
electric power, transportation, industrial, residential, and commercial. Carbon dioxide emissions are produced by the
electric power sector as fossil fuel is consumed to provide electricity to one of the other four sectors, or “end-use”
sectors. For the discussion below, electric power emissions have been distributed to each end-use sector on the basis
of each sector’s share of aggregate electricity use. This method of distributing emissions assumes that each end-use
sector uses electricity that is generated from the national average mix of fuels according to their carbon intensity.
Emissions from electric power are also addressed separately after the end-use sectors have been discussed. Note that
emissions from U.S. Territories are calculated separately due to a lack of specific consumption data for the
individual end-use sectors. Figure ES-6, Figure ES-7, and Table ES-3 summarize CO2 emissions from fossil fuel
combustion by end-use sector.
Figure ES-6: 2016 CO2 Emissions from Fossil Fuel Combustion by Sector and Fuel Type (MMT CO2 Eq.)
Note on Figure ES-6: Fossil Fuel Combustion for electric power also includes emissions of less than 0.5 MMT CO2 Eq. from
geothermal-based generation.
ES-12 Inventory of U.S. Greenhouse Gas Emissions and Sinks: 1990–2016
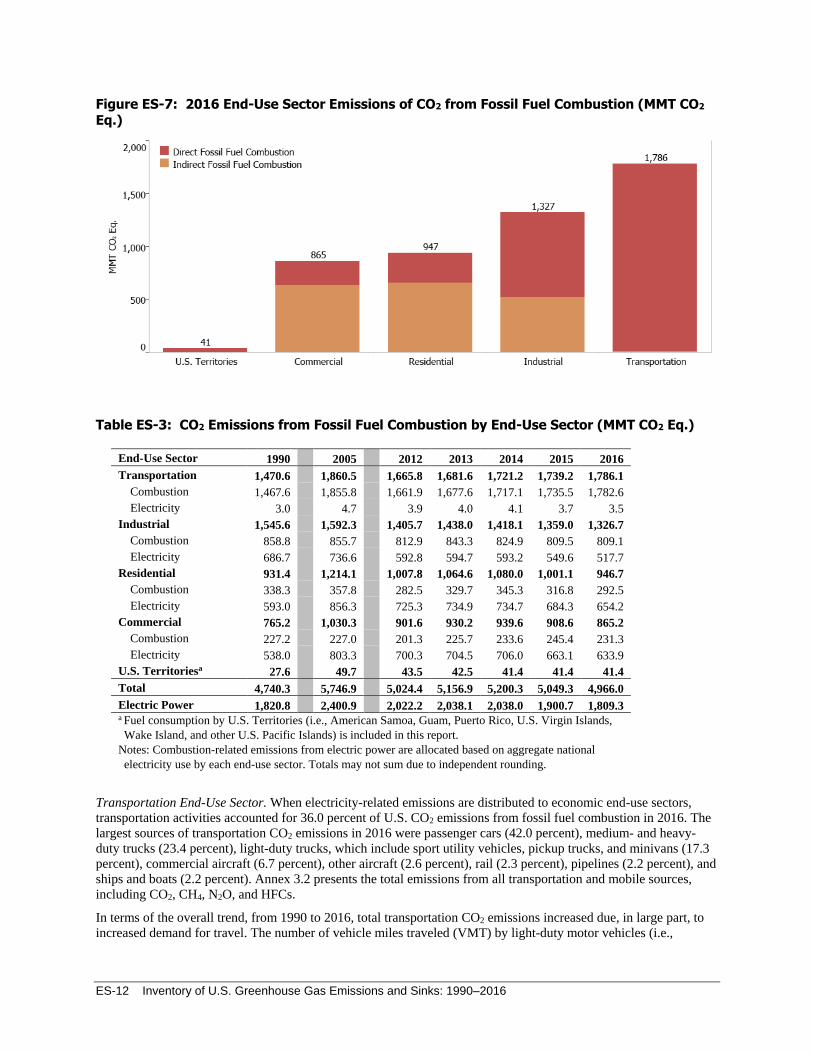
Figure ES-7: 2016 End-Use Sector Emissions of CO2 from Fossil Fuel Combustion (MMT CO2 Eq.)
Table ES-3: CO2 Emissions from Fossil Fuel Combustion by End-Use Sector (MMT CO2 Eq.)
End-Use Sector 1990 2005 2012 2013 2014 2015 2016
Transportation 1,470.6 1,860.5 1,665.8 1,681.6 1,721.2 1,739.2 1,786.1
Combustion 1,467.6 1,855.8 1,661.9 1,677.6 1,717.1 1,735.5 1,782.6
Electricity 3.0 4.7 3.9 4.0 4.1 3.7 3.5
Industrial 1,545.6 1,592.3 1,405.7 1,438.0 1,418.1 1,359.0 1,326.7
Combustion 858.8 855.7 812.9 843.3 824.9 809.5 809.1
Electricity 686.7 736.6 592.8 594.7 593.2 549.6 517.7
Residential 931.4 1,214.1 1,007.8 1,064.6 1,080.0 1,001.1 946.7
Combustion 338.3 357.8 282.5 329.7 345.3 316.8 292.5
Electricity 593.0 856.3 725.3 734.9 734.7 684.3 654.2
Commercial 765.2 1,030.3 901.6 930.2 939.6 908.6 865.2
Combustion 227.2 227.0 201.3 225.7 233.6 245.4 231.3
Electricity 538.0 803.3 700.3 704.5 706.0 663.1 633.9
U.S. Territoriesa 27.6 49.7 43.5 42.5 41.4 41.4 41.4
Total 4,740.3 5,746.9 5,024.4 5,156.9 5,200.3 5,049.3 4,966.0
Electric Power 1,820.8 2,400.9 2,022.2 2,038.1 2,038.0 1,900.7 1,809.3
a Fuel consumption by U.S. Territories (i.e., American Samoa, Guam, Puerto Rico, U.S. Virgin Islands,
Wake Island, and other U.S. Pacific Islands) is included in this report.
Notes: Combustion-related emissions from electric power are allocated based on aggregate national
electricity use by each end-use sector. Totals may not sum due to independent rounding.
Transportation End-Use Sector. When electricity-related emissions are distributed to economic end-use sectors,
transportation activities accounted for 36.0 percent of U.S. CO2 emissions from fossil fuel combustion in 2016. The
largest sources of transportation CO2 emissions in 2016 were passenger cars (42.0 percent), medium- and heavy-
duty trucks (23.4 percent), light-duty trucks, which include sport utility vehicles, pickup trucks, and minivans (17.3
percent), commercial aircraft (6.7 percent), other aircraft (2.6 percent), rail (2.3 percent), pipelines (2.2 percent), and
ships and boats (2.2 percent). Annex 3.2 presents the total emissions from all transportation and mobile sources,
including CO2, CH4, N2O, and HFCs.
In terms of the overall trend, from 1990 to 2016, total transportation CO2 emissions increased due, in large part, to
increased demand for travel. The number of vehicle miles traveled (VMT) by light-duty motor vehicles (i.e.,
Executive Summary ES-13
passenger cars and light-duty trucks) increased 44 percent from 1990 to 2016,14 as a result of a confluence of factors
including population growth, economic growth, urban sprawl, and low fuel prices during the beginning of this
period. Almost all of the energy consumed for transportation was supplied by petroleum-based products, with more
than half being related to gasoline consumption in automobiles and other highway vehicles. Other fuel uses,
especially diesel fuel for freight trucks and jet fuel for aircraft, accounted for the remainder.
Industrial End-Use Sector. Industrial CO2 emissions, resulting both directly from the combustion of fossil fuels and
indirectly from the generation of electricity that is used by industry, accounted for 27 percent of CO2 from fossil fuel
combustion in 2016. Approximately 61 percent of these emissions resulted from direct fossil fuel combustion to
produce steam and/or heat for industrial processes. The remaining emissions resulted from the use of electricity for
motors, electric furnaces, ovens, lighting, and other applications. In contrast to the other end-use sectors, emissions
from industry have declined since 1990. This decline is due to structural changes in the U.S. economy (i.e., shifts
from a manufacturing-based to a service-based economy), fuel switching, and efficiency improvements.
Residential and Commercial End-Use Sectors. The residential and commercial end-use sectors accounted for 19 and
17 percent, respectively, of CO2 emissions from fossil fuel combustion in 2016. Both sectors relied heavily on
electricity for meeting energy demands, with 69 and 73 percent, respectively, of their emissions attributable to
electricity use for lighting, heating, cooling, and operating appliances. The remaining emissions were due to the
consumption of natural gas and petroleum for heating and cooking. Emissions from the residential and commercial
end-use sectors have increased by 2 percent and 13 percent since 1990, respectively.
Electric Power. The United States relies on electricity to meet a significant portion of its energy demands.
Electricity generators used 33 percent of U.S. energy from fossil fuels and emitted 36 percent of the CO2 from fossil
fuel combustion in 2016. The type of energy source used to generate electricity is the main factor influencing
emissions.15 For example, some electricity is generated through non-fossil fuel options such as nuclear,
hydroelectric, wind, solar, or geothermal energy. See Figure ES-8 for trends in energy sources used to generate
electricity and impact on CO2 emissions.
Including all electricity generation modes, electric power sector generators relied on coal for approximately 30
percent of their total energy requirements in 2016. In addition, the coal used by electricity generators accounted for
93 percent of all coal consumed for energy in the United States in 2016.16 Recently, a decrease in the carbon
intensity of the mix of fuels consumed to generate electricity has occurred due to a decrease in coal consumption,
increased natural gas consumption, and increased reliance on non-fossil generation sources. Including all electricity
generation modes, electric power sector generators used natural gas for approximately 34 percent of their total
energy requirements in 2016.
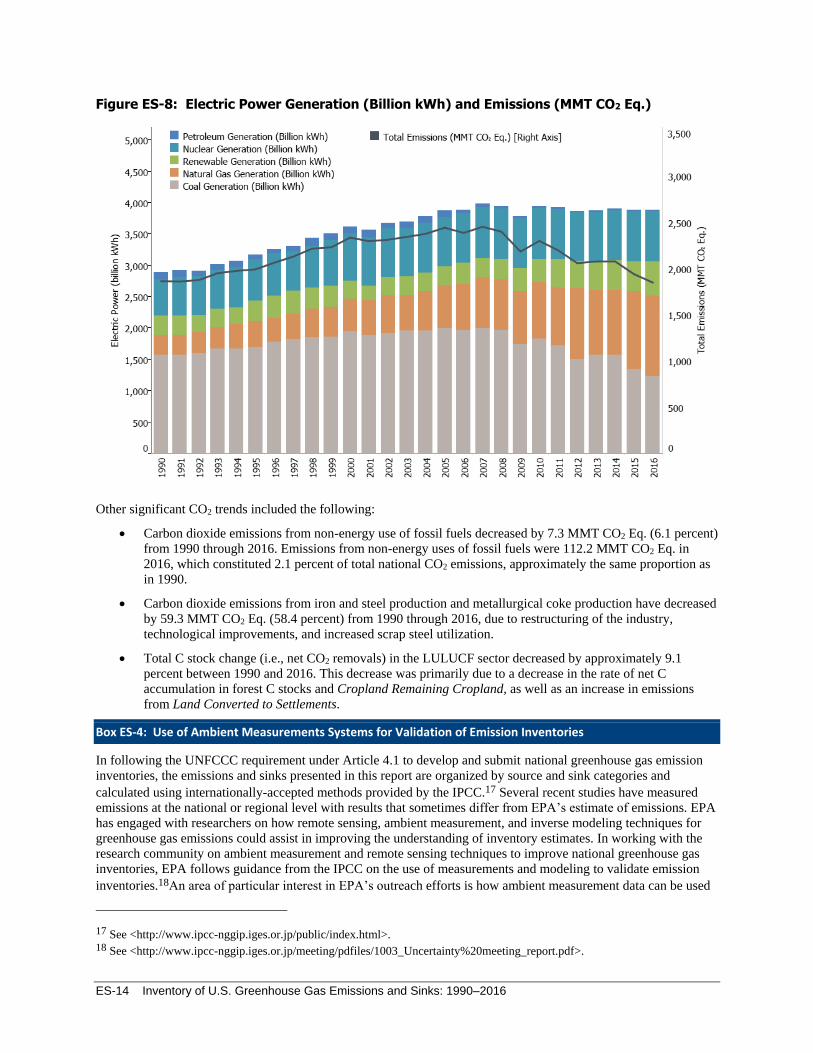
Across the time series, changes in electricity demand and the carbon intensity of fuels used for electric power have a
significant impact on CO2 emissions. While emissions from the electric power sector have decreased by
approximately 0.1 percent since 1990, the carbon intensity of the electric power sector, in terms of CO2 Eq. per
QBtu, input has significantly decreased—by 12 percent—during that same time-frame. This trend away from a
direct relationship between electric power and the resulting emissions is shown in Figure ES-8.
14 VMT estimates are based on data from FHWA Highway Statistics Table VM-1 (FHWA 1996 through 2017). In 2011, FHWA
changed its methods for estimating VMT by vehicle class, which led to a shift in VMT and emissions among on-road vehicle
classes in the 2007 to 2016 time period. In absence of these method changes, light-duty VMT growth between 1990 and 2016
would likely have been even higher. 15 In line with the reporting requirements for inventories submitted under the UNFCCC, CO2 emissions from biomass
combustion have been estimated separately from fossil fuel CO2 emissions and are not included in the electricity sector totals and
trends discussed in this section. Net carbon fluxes from changes in biogenic carbon reservoirs are accounted for in the estimates
for Land Use, Land-Use Change, and Forestry. 16 See Table 6.2 Coal Consumption by Sector of EIA 2018.
ES-14 Inventory of U.S. Greenhouse Gas Emissions and Sinks: 1990–2016
Figure ES-8: Electric Power Generation (Billion kWh) and Emissions (MMT CO2 Eq.)
Other significant CO2 trends included the following:
• Carbon dioxide emissions from non-energy use of fossil fuels decreased by 7.3 MMT CO2 Eq. (6.1 percent)
from 1990 through 2016. Emissions from non-energy uses of fossil fuels were 112.2 MMT CO2 Eq. in
2016, which constituted 2.1 percent of total national CO2 emissions, approximately the same proportion as
in 1990.
• Carbon dioxide emissions from iron and steel production and metallurgical coke production have decreased
by 59.3 MMT CO2 Eq. (58.4 percent) from 1990 through 2016, due to restructuring of the industry,
technological improvements, and increased scrap steel utilization.
• Total C stock change (i.e., net CO2 removals) in the LULUCF sector decreased by approximately 9.1
percent between 1990 and 2016. This decrease was primarily due to a decrease in the rate of net C
accumulation in forest C stocks and Cropland Remaining Cropland, as well as an increase in emissions
from Land Converted to Settlements.
Box ES-4: Use of Ambient Measurements Systems for Validation of Emission Inventories
In following the UNFCCC requirement under Article 4.1 to develop and submit national greenhouse gas emission
inventories, the emissions and sinks presented in this report are organized by source and sink categories and
calculated using internationally-accepted methods provided by the IPCC.17 Several recent studies have measured
emissions at the national or regional level with results that sometimes differ from EPA’s estimate of emissions. EPA
has engaged with researchers on how remote sensing, ambient measurement, and inverse modeling techniques for
greenhouse gas emissions could assist in improving the understanding of inventory estimates. In working with the
research community on ambient measurement and remote sensing techniques to improve national greenhouse gas
inventories, EPA follows guidance from the IPCC on the use of measurements and modeling to validate emission
inventories.18An area of particular interest in EPA’s outreach efforts is how ambient measurement data can be used
17 See <http://www.ipcc-nggip.iges.or.jp/public/index.html>. 18 See <http://www.ipcc-nggip.iges.or.jp/meeting/pdfiles/1003_Uncertainty%20meeting_report.pdf>.
Executive Summary ES-15
in a manner consistent with this Inventory report’s transparency on its calculation methodologies, and the ability of
these techniques to attribute emissions and removals from remote sensing to anthropogenic sources, as defined by
the IPCC for this report, versus natural sources and sinks.
In an effort to improve the ability to compare the national-level greenhouse gas inventory with measurement results
that may be at other scales, a team at Harvard University along with EPA and other coauthors developed a gridded
inventory of U.S. anthropogenic methane emissions with 0.1° x 0.1° spatial resolution, monthly temporal resolution,
and detailed scale-dependent error characterization. The Inventory is designed to be consistent with the 1990 to 2014
U.S. EPA Inventory of U.S. Greenhouse Gas Emissions and Sinks estimates for the year 2012, which presents
national totals for different source types.19
Methane Emissions Methane (CH4) is 25 times as effective as CO2 at trapping heat in the atmosphere (IPCC 2007). Over the last two
hundred and fifty years, the concentration of CH4 in the atmosphere increased by 163 percent (IPCC 2013;
NOAA/ESRL 2017b). Anthropogenic sources of CH4 include natural gas and petroleum systems, agricultural
activities, LULUCF, landfills, coal mining, wastewater treatment, stationary and mobile combustion, and certain
industrial processes (see Figure ES-9).
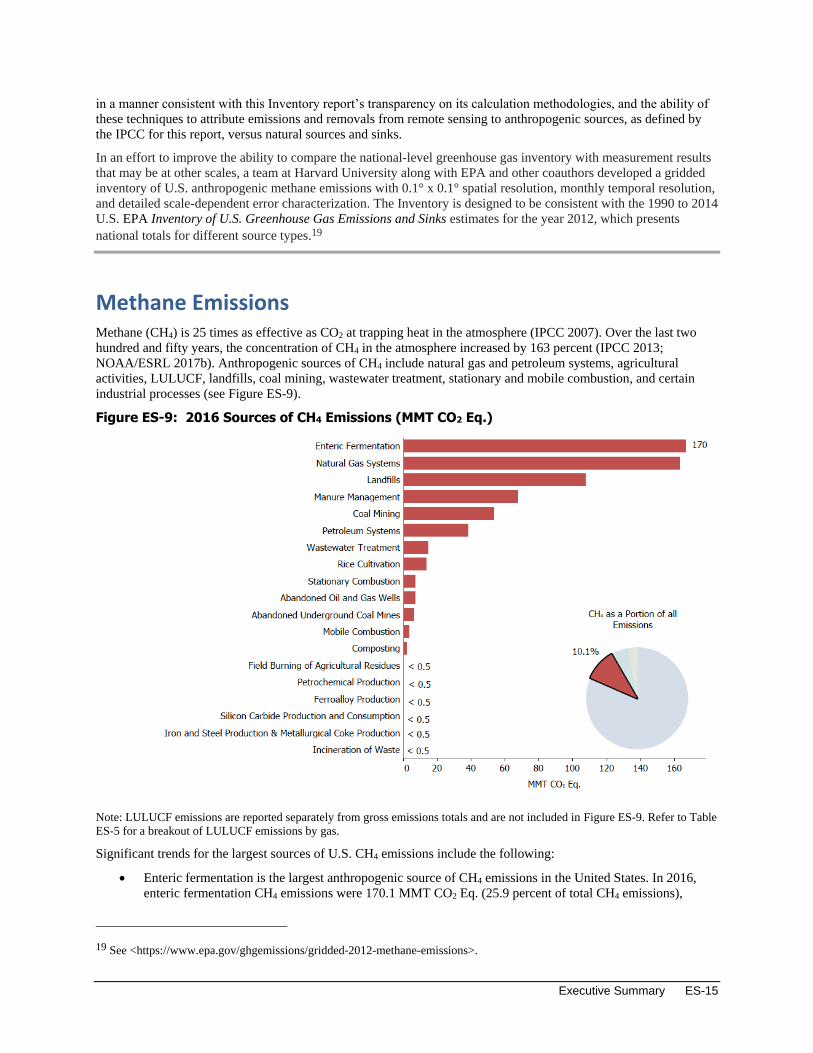
Figure ES-9: 2016 Sources of CH4 Emissions (MMT CO2 Eq.)
Note: LULUCF emissions are reported separately from gross emissions totals and are not included in Figure ES-9. Refer to Table
ES-5 for a breakout of LULUCF emissions by gas.
Significant trends for the largest sources of U.S. CH4 emissions include the following:
• Enteric fermentation is the largest anthropogenic source of CH4 emissions in the United States. In 2016,
enteric fermentation CH4 emissions were 170.1 MMT CO2 Eq. (25.9 percent of total CH4 emissions),
19 See <https://www.epa.gov/ghgemissions/gridded-2012-methane-emissions>.
ES-16 Inventory of U.S. Greenhouse Gas Emissions and Sinks: 1990–2016
which represents an increase of 6.0 MMT CO2 Eq. (3.6 percent) since 1990. This increase in emissions
from 1990 to 2016 generally follows the increasing trends in cattle populations.
• Natural gas systems were the second largest anthropogenic source category of CH4 emissions in the United
States in 2016 with 163.5 MMT CO2 Eq. of CH4 emitted into the atmosphere. Those emissions have
decreased by 31.6 MMT CO2 Eq. (16.2 percent) since 1990. The decrease in CH4 emissions is largely due
to the decrease in emissions from transmission, storage, and distribution. The decrease in transmission and
storage emissions is largely due to reduced compressor station emissions (including emissions from
compressors and fugitives). The decrease in distribution emissions is largely attributed to increased use of
plastic piping, which has lower emissions than other pipe materials, and station upgrades at metering and
regulating (M&R) stations.
• Landfills are the third largest anthropogenic source of CH4 emissions in the United States (107.7 MMT
CO2 Eq.), accounting for 16.4 percent of total CH4 emissions in 2016. From 1990 to 2016, CH4 emissions
from landfills decreased by 71.9 MMT CO2 Eq. (40.0 percent), with small increases occurring in some
interim years. This downward trend in emissions coincided with increased landfill gas collection and
control systems, and a reduction of decomposable materials (i.e., paper and paperboard, food scraps, and
yard trimmings) discarded in MSW landfills over the time series,20 which has more than offset the
additional CH4 emissions that would have resulted from an increase in the amount of municipal solid waste
landfilled.
Nitrous Oxide Emissions Nitrous oxide (N2O) is produced by biological processes that occur in soil and water and by a variety of
anthropogenic activities in the agricultural, energy, industrial, and waste management fields. While total N2O
emissions are much lower than CO2 emissions, N2O is nearly 300 times more powerful than CO2 at trapping heat in
the atmosphere (IPCC 2007). Since 1750, the global atmospheric concentration of N2O has risen by approximately
22 percent (IPCC 2013; NOAA/ESRL 2017c). The main anthropogenic activities producing N2O in the United
States are agricultural soil management, stationary fuel combustion, fuel combustion in motor vehicles, manure
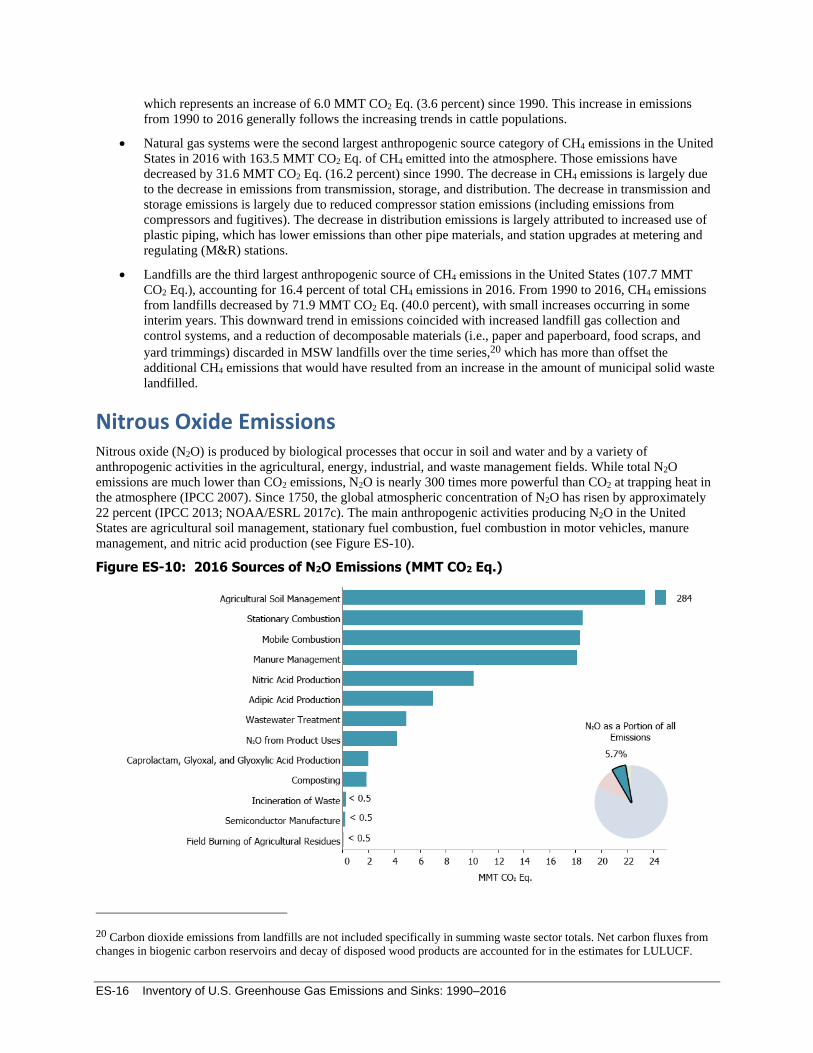
management, and nitric acid production (see Figure ES-10).
Figure ES-10: 2016 Sources of N2O Emissions (MMT CO2 Eq.)
20 Carbon dioxide emissions from landfills are not included specifically in summing waste sector totals. Net carbon fluxes from
changes in biogenic carbon reservoirs and decay of disposed wood products are accounted for in the estimates for LULUCF.
Executive Summary ES-17
Note: LULUCF emissions are reported separately from gross emissions totals and are not included in Figure ES-10. Refer to
Table ES-5 for a breakout of LULUCF emissions by gas.
Significant trends for the largest sources of U.S. emissions of N2O include the following:
• Agricultural soils accounted for approximately 76.7 percent of N2O emissions and 4.4 percent of total
emissions in the United States in 2016. Estimated emissions from this source in 2016 were 283.6 MMT
CO2 Eq. Annual N2O emissions from agricultural soils fluctuated between 1990 and 2016, although overall
emissions were 13.2 percent higher in 2016 than in 1990. Year-to-year fluctuations are largely a reflection
of annual variation in weather patterns, synthetic fertilizer use, and crop production.
• Nitrous oxide emissions from stationary combustion increased 7.5 MMT CO2 Eq. (67.5 percent) from 1990
through 2016. Nitrous oxide emissions from this source increased primarily as a result of an increase in the
number of coal fluidized bed boilers in the electric power sector.
• Nitrous oxide emissions from mobile combustion decreased by 23.3 MMT CO2 Eq. (55.9 percent) from
1990 through 2016, primarily as a result of N2O national emission control standards and emission control
technologies for on-road vehicles.
HFC, PFC, SF6, and NF3 Emissions Hydrofluorocarbons (HFCs) and perfluorocarbons (PFCs) are families of synthetic chemicals that are used as
alternatives to ozone depleting substances (ODS), which are being phased out under the Montreal Protocol and
Clean Air Act Amendments of 1990. Hydrofluorocarbons and PFCs do not deplete the stratospheric ozone layer,
and are therefore acceptable alternatives under the Montreal Protocol on Substances that Deplete the Ozone Layer.
These compounds, however, along with SF6 and NF3, are potent greenhouse gases. In addition to having high global
warming potentials, SF6 and PFCs have extremely long atmospheric lifetimes, resulting in their essentially
irreversible accumulation in the atmosphere once emitted. Sulfur hexafluoride is the most potent greenhouse gas the
IPCC has evaluated (IPCC 2013).
Other emissive sources of these gases include HCFC-22 production, electrical transmission and distribution systems,
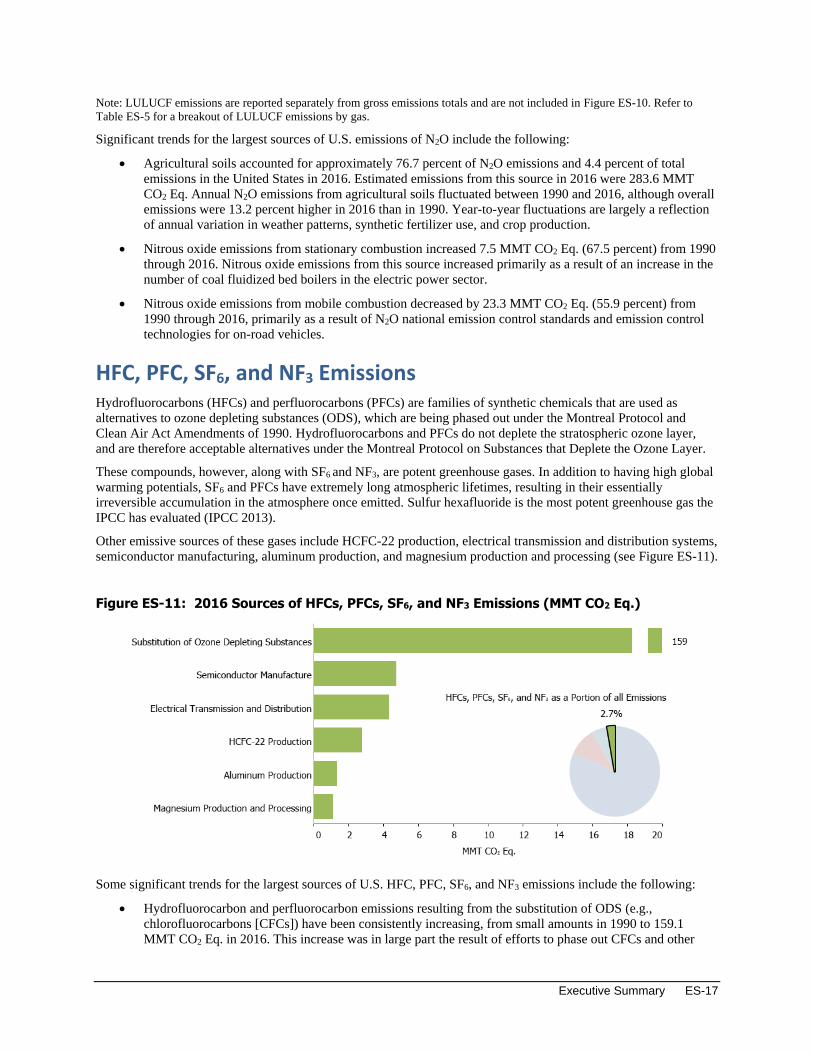
semiconductor manufacturing, aluminum production, and magnesium production and processing (see Figure ES-11).
Figure ES-11: 2016 Sources of HFCs, PFCs, SF6, and NF3 Emissions (MMT CO2 Eq.)
Some significant trends for the largest sources of U.S. HFC, PFC, SF6, and NF3 emissions include the following:
• Hydrofluorocarbon and perfluorocarbon emissions resulting from the substitution of ODS (e.g.,
chlorofluorocarbons [CFCs]) have been consistently increasing, from small amounts in 1990 to 159.1
MMT CO2 Eq. in 2016. This increase was in large part the result of efforts to phase out CFCs and other
ES-18 Inventory of U.S. Greenhouse Gas Emissions and Sinks: 1990–2016
ODS in the United States. In the short term, this trend is expected to continue, and will likely continue over
the next decade as hydrochlorofluorocarbons (HCFCs), which are interim substitutes in many applications,
are themselves phased out under the provisions of the Copenhagen Amendments to the Montreal Protocol.
• GWP-weighted PFC, HFC, SF6, and NF3 emissions from semiconductor manufacturing have increased by
32.8 percent from 1990 to 2016, due to competing factors of industrial growth and the adoption of emission
reduction technologies. Within that time span, emissions peaked at 9.0 MMT CO2 Eq. in 1999, the initial
year of EPA’s PFC Reduction/Climate Partnership for the Semiconductor Industry, but have since declined
to 4.7 MMT CO2 Eq. in 2016 (a 47.6 percent decrease relative to 1999).
• Sulfur hexafluoride emissions from electric power transmission and distribution systems decreased by 81.2
percent (18.8 MMT CO2 Eq.) from 1990 to 2016. There are two potential causes for this decrease: (1) a
sharp increase in the price of SF6 during the 1990s and (2) a growing awareness of the environmental
impact of SF6 emissions through programs such as EPA’s SF6 Emission Reduction Partnership for Electric
Power Systems.
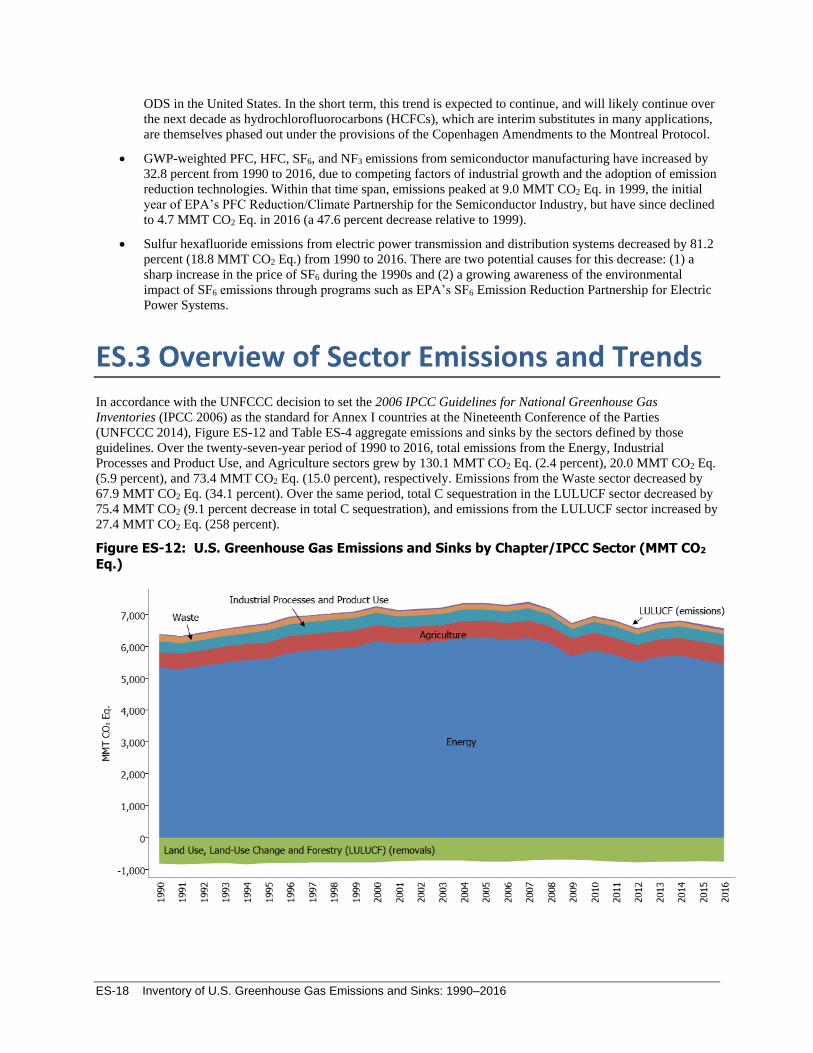
ES.3 Overview of Sector Emissions and Trends In accordance with the UNFCCC decision to set the 2006 IPCC Guidelines for National Greenhouse Gas
Inventories (IPCC 2006) as the standard for Annex I countries at the Nineteenth Conference of the Parties
(UNFCCC 2014), Figure ES-12 and Table ES-4 aggregate emissions and sinks by the sectors defined by those
guidelines. Over the twenty-seven-year period of 1990 to 2016, total emissions from the Energy, Industrial
Processes and Product Use, and Agriculture sectors grew by 130.1 MMT CO2 Eq. (2.4 percent), 20.0 MMT CO2 Eq.
(5.9 percent), and 73.4 MMT CO2 Eq. (15.0 percent), respectively. Emissions from the Waste sector decreased by
67.9 MMT CO2 Eq. (34.1 percent). Over the same period, total C sequestration in the LULUCF sector decreased by
75.4 MMT CO2 (9.1 percent decrease in total C sequestration), and emissions from the LULUCF sector increased by
27.4 MMT CO2 Eq. (258 percent).
Figure ES-12: U.S. Greenhouse Gas Emissions and Sinks by Chapter/IPCC Sector (MMT CO2 Eq.)
Executive Summary ES-19
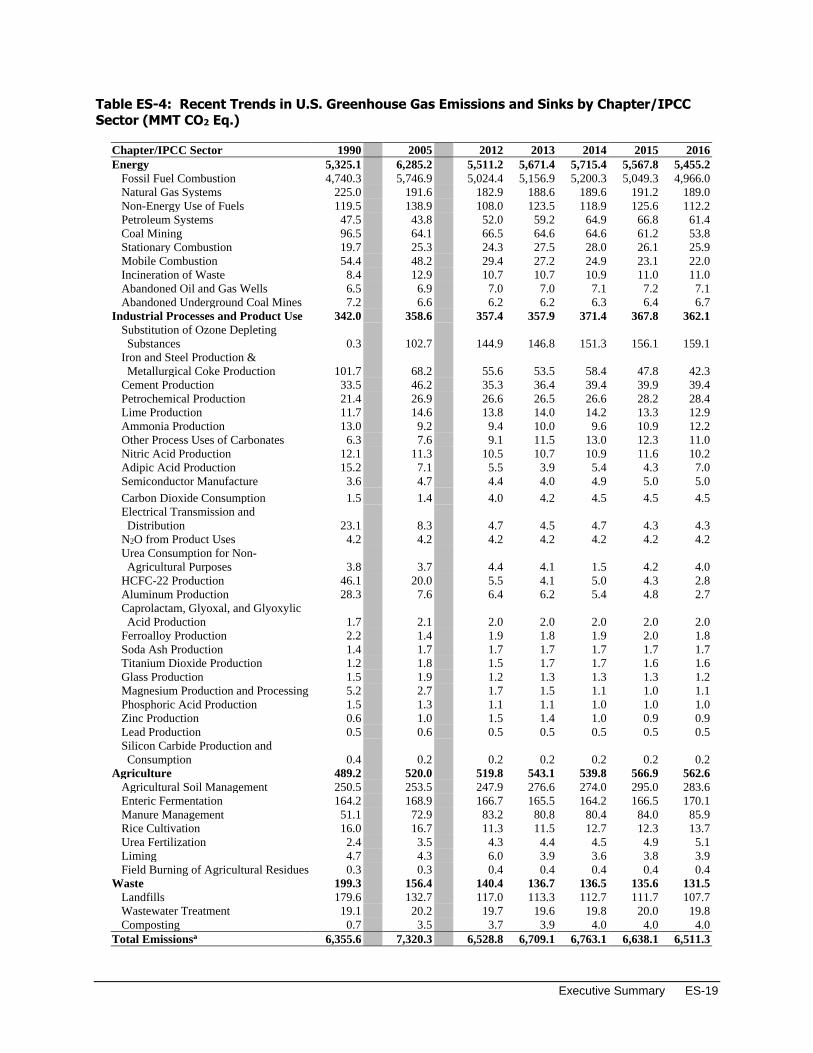
Table ES-4: Recent Trends in U.S. Greenhouse Gas Emissions and Sinks by Chapter/IPCC Sector (MMT CO2 Eq.)
Chapter/IPCC Sector 1990 2005 2012 2013 2014 2015 2016
Energy 5,325.1 6,285.2 5,511.2 5,671.4 5,715.4 5,567.8 5,455.2
Fossil Fuel Combustion 4,740.3 5,746.9 5,024.4 5,156.9 5,200.3 5,049.3 4,966.0
Natural Gas Systems 225.0 191.6 182.9 188.6 189.6 191.2 189.0
Non-Energy Use of Fuels 119.5 138.9 108.0 123.5 118.9 125.6 112.2
Petroleum Systems 47.5 43.8 52.0 59.2 64.9 66.8 61.4
Coal Mining 96.5 64.1 66.5 64.6 64.6 61.2 53.8
Stationary Combustion 19.7 25.3 24.3 27.5 28.0 26.1 25.9
Mobile Combustion 54.4 48.2 29.4 27.2 24.9 23.1 22.0
Incineration of Waste 8.4 12.9 10.7 10.7 10.9 11.0 11.0
Abandoned Oil and Gas Wells 6.5 6.9 7.0 7.0 7.1 7.2 7.1
Abandoned Underground Coal Mines 7.2 6.6 6.2 6.2 6.3 6.4 6.7
Industrial Processes and Product Use 342.0 358.6 357.4 357.9 371.4 367.8 362.1
Substitution of Ozone Depleting
Substances 0.3 102.7 144.9 146.8 151.3 156.1 159.1
Iron and Steel Production &
Metallurgical Coke Production 101.7 68.2 55.6 53.5 58.4 47.8 42.3
Cement Production 33.5 46.2 35.3 36.4 39.4 39.9 39.4
Petrochemical Production 21.4 26.9 26.6 26.5 26.6 28.2 28.4
Lime Production 11.7 14.6 13.8 14.0 14.2 13.3 12.9
Ammonia Production 13.0 9.2 9.4 10.0 9.6 10.9 12.2
Other Process Uses of Carbonates 6.3 7.6 9.1 11.5 13.0 12.3 11.0
Nitric Acid Production 12.1 11.3 10.5 10.7 10.9 11.6 10.2
Adipic Acid Production 15.2 7.1 5.5 3.9 5.4 4.3 7.0
Semiconductor Manufacture 3.6 4.7 4.4 4.0 4.9 5.0 5.0
Carbon Dioxide Consumption 1.5 1.4 4.0 4.2 4.5 4.5 4.5
Electrical Transmission and
Distribution 23.1 8.3 4.7 4.5 4.7 4.3 4.3
N2O from Product Uses 4.2 4.2 4.2 4.2 4.2 4.2 4.2
Urea Consumption for Non-
Agricultural Purposes 3.8 3.7 4.4 4.1 1.5 4.2 4.0
HCFC-22 Production 46.1 20.0 5.5 4.1 5.0 4.3 2.8
Aluminum Production 28.3 7.6 6.4 6.2 5.4 4.8 2.7
Caprolactam, Glyoxal, and Glyoxylic
Acid Production 1.7 2.1 2.0 2.0 2.0 2.0 2.0
Ferroalloy Production 2.2 1.4 1.9 1.8 1.9 2.0 1.8
Soda Ash Production 1.4 1.7 1.7 1.7 1.7 1.7 1.7
Titanium Dioxide Production 1.2 1.8 1.5 1.7 1.7 1.6 1.6
Glass Production 1.5 1.9 1.2 1.3 1.3 1.3 1.2
Magnesium Production and Processing 5.2 2.7 1.7 1.5 1.1 1.0 1.1
Phosphoric Acid Production 1.5 1.3 1.1 1.1 1.0 1.0 1.0
Zinc Production 0.6 1.0 1.5 1.4 1.0 0.9 0.9
Lead Production 0.5 0.6 0.5 0.5 0.5 0.5 0.5
Silicon Carbide Production and
Consumption 0.4 0.2 0.2 0.2 0.2 0.2 0.2
Agriculture 489.2 520.0 519.8 543.1 539.8 566.9 562.6
Agricultural Soil Management 250.5 253.5 247.9 276.6 274.0 295.0 283.6
Enteric Fermentation 164.2 168.9 166.7 165.5 164.2 166.5 170.1
Manure Management 51.1 72.9 83.2 80.8 80.4 84.0 85.9
Rice Cultivation 16.0 16.7 11.3 11.5 12.7 12.3 13.7
Urea Fertilization 2.4 3.5 4.3 4.4 4.5 4.9 5.1
Liming 4.7 4.3 6.0 3.9 3.6 3.8 3.9
Field Burning of Agricultural Residues 0.3 0.3 0.4 0.4 0.4 0.4 0.4
Waste 199.3 156.4 140.4 136.7 136.5 135.6 131.5
Landfills 179.6 132.7 117.0 113.3 112.7 111.7 107.7
Wastewater Treatment 19.1 20.2 19.7 19.6 19.8 20.0 19.8
Composting 0.7 3.5 3.7 3.9 4.0 4.0 4.0
Total Emissionsa 6,355.6 7,320.3 6,528.8 6,709.1 6,763.1 6,638.1 6,511.3
ES-20 Inventory of U.S. Greenhouse Gas Emissions and Sinks: 1990–2016
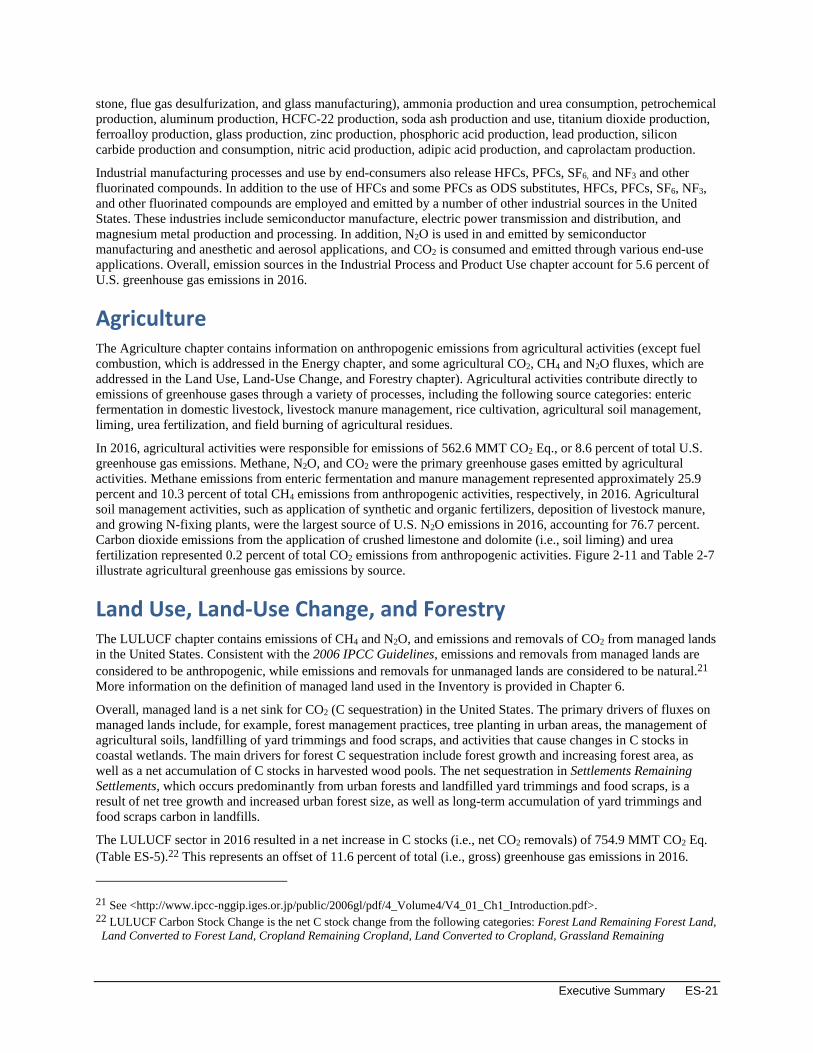
Land Use, Land-Use Change, and
Forestry (819.6) (731.1) (753.5) (735.8) (740.4) (695.2) (716.8)
Forest land (784.3) (730.0) (723.3) (733.3) (731.7) (709.9) (714.2)
Cropland 2.4 (0.7) 1.3 11.9 11.2 16.8 13.8
Grassland 13.8 25.3 0.8 18.5 14.7 33.6 21.0
Wetlands (4.0) (5.3) (4.1) (4.1) (4.1) (4.1) (4.2)
Settlements (47.6) (20.5) (28.3) (28.8) (30.5) (31.5) (33.2)
Net Emission (Sources and Sinks)b 5,536.0 6,589.1 5,775.3 5,973.3 6,022.8 5,942.9 5,794.5
Notes: Total emissions presented without LULUCF. Net emissions presented with LULUCF. a Total emissions without LULUCF. b Total emissions with LULUCF.
Notes: Totals may not sum due to independent rounding. Parentheses indicate negative values or sequestration.
Energy The Energy chapter contains emissions of all greenhouse gases resulting from stationary and mobile energy
activities including fuel combustion and fugitive fuel emissions, and the use of fossil fuels for non-energy purposes.
Energy-related activities, primarily fossil fuel combustion, accounted for the vast majority of U.S. CO2 emissions for
the period of 1990 through 2016.
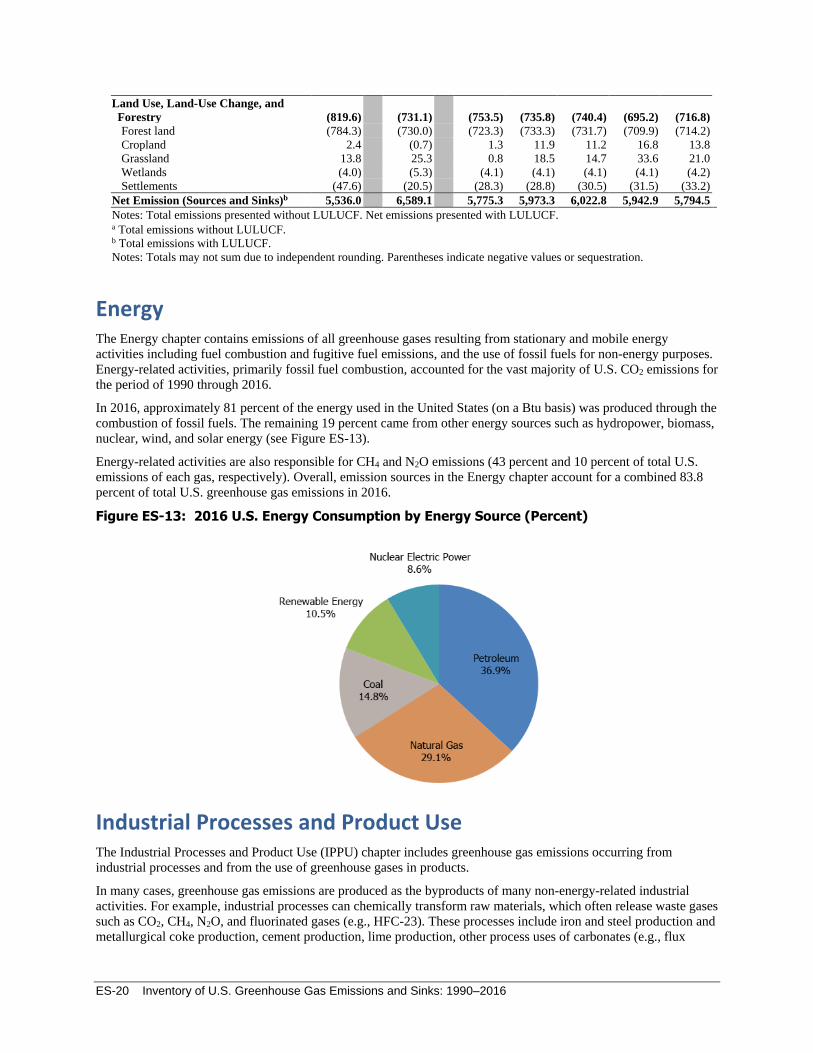
In 2016, approximately 81 percent of the energy used in the United States (on a Btu basis) was produced through the
combustion of fossil fuels. The remaining 19 percent came from other energy sources such as hydropower, biomass,
nuclear, wind, and solar energy (see Figure ES-13).
Energy-related activities are also responsible for CH4 and N2O emissions (43 percent and 10 percent of total U.S.
emissions of each gas, respectively). Overall, emission sources in the Energy chapter account for a combined 83.8
percent of total U.S. greenhouse gas emissions in 2016.
Figure ES-13: 2016 U.S. Energy Consumption by Energy Source (Percent)
Industrial Processes and Product Use The Industrial Processes and Product Use (IPPU) chapter includes greenhouse gas emissions occurring from
industrial processes and from the use of greenhouse gases in products.
In many cases, greenhouse gas emissions are produced as the byproducts of many non-energy-related industrial
activities. For example, industrial processes can chemically transform raw materials, which often release waste gases
such as CO2, CH4, N2O, and fluorinated gases (e.g., HFC-23). These processes include iron and steel production and
metallurgical coke production, cement production, lime production, other process uses of carbonates (e.g., flux
Executive Summary ES-21
stone, flue gas desulfurization, and glass manufacturing), ammonia production and urea consumption, petrochemical
production, aluminum production, HCFC-22 production, soda ash production and use, titanium dioxide production,
ferroalloy production, glass production, zinc production, phosphoric acid production, lead production, silicon
carbide production and consumption, nitric acid production, adipic acid production, and caprolactam production.
Industrial manufacturing processes and use by end-consumers also release HFCs, PFCs, SF6, and NF3 and other
fluorinated compounds. In addition to the use of HFCs and some PFCs as ODS substitutes, HFCs, PFCs, SF6, NF3,
and other fluorinated compounds are employed and emitted by a number of other industrial sources in the United
States. These industries include semiconductor manufacture, electric power transmission and distribution, and
magnesium metal production and processing. In addition, N2O is used in and emitted by semiconductor
manufacturing and anesthetic and aerosol applications, and CO2 is consumed and emitted through various end-use
applications. Overall, emission sources in the Industrial Process and Product Use chapter account for 5.6 percent of
U.S. greenhouse gas emissions in 2016.
Agriculture The Agriculture chapter contains information on anthropogenic emissions from agricultural activities (except fuel
combustion, which is addressed in the Energy chapter, and some agricultural CO2, CH4 and N2O fluxes, which are
addressed in the Land Use, Land-Use Change, and Forestry chapter). Agricultural activities contribute directly to
emissions of greenhouse gases through a variety of processes, including the following source categories: enteric
fermentation in domestic livestock, livestock manure management, rice cultivation, agricultural soil management,
liming, urea fertilization, and field burning of agricultural residues.
In 2016, agricultural activities were responsible for emissions of 562.6 MMT CO2 Eq., or 8.6 percent of total U.S.
greenhouse gas emissions. Methane, N2O, and CO2 were the primary greenhouse gases emitted by agricultural
activities. Methane emissions from enteric fermentation and manure management represented approximately 25.9
percent and 10.3 percent of total CH4 emissions from anthropogenic activities, respectively, in 2016. Agricultural
soil management activities, such as application of synthetic and organic fertilizers, deposition of livestock manure,
and growing N-fixing plants, were the largest source of U.S. N2O emissions in 2016, accounting for 76.7 percent.
Carbon dioxide emissions from the application of crushed limestone and dolomite (i.e., soil liming) and urea
fertilization represented 0.2 percent of total CO2 emissions from anthropogenic activities. Figure 2-11 and Table 2-7
illustrate agricultural greenhouse gas emissions by source.
Land Use, Land-Use Change, and Forestry The LULUCF chapter contains emissions of CH4 and N2O, and emissions and removals of CO2 from managed lands
in the United States. Consistent with the 2006 IPCC Guidelines, emissions and removals from managed lands are
considered to be anthropogenic, while emissions and removals for unmanaged lands are considered to be natural.21
More information on the definition of managed land used in the Inventory is provided in Chapter 6.
Overall, managed land is a net sink for CO2 (C sequestration) in the United States. The primary drivers of fluxes on
managed lands include, for example, forest management practices, tree planting in urban areas, the management of
agricultural soils, landfilling of yard trimmings and food scraps, and activities that cause changes in C stocks in
coastal wetlands. The main drivers for forest C sequestration include forest growth and increasing forest area, as
well as a net accumulation of C stocks in harvested wood pools. The net sequestration in Settlements Remaining
Settlements, which occurs predominantly from urban forests and landfilled yard trimmings and food scraps, is a
result of net tree growth and increased urban forest size, as well as long-term accumulation of yard trimmings and
food scraps carbon in landfills.
The LULUCF sector in 2016 resulted in a net increase in C stocks (i.e., net CO2 removals) of 754.9 MMT CO2 Eq.
(Table ES-5).22 This represents an offset of 11.6 percent of total (i.e., gross) greenhouse gas emissions in 2016.
21 See <http://www.ipcc-nggip.iges.or.jp/public/2006gl/pdf/4_Volume4/V4_01_Ch1_Introduction.pdf>. 22 LULUCF Carbon Stock Change is the net C stock change from the following categories: Forest Land Remaining Forest Land,
Land Converted to Forest Land, Cropland Remaining Cropland, Land Converted to Cropland, Grassland Remaining
ES-22 Inventory of U.S. Greenhouse Gas Emissions and Sinks: 1990–2016
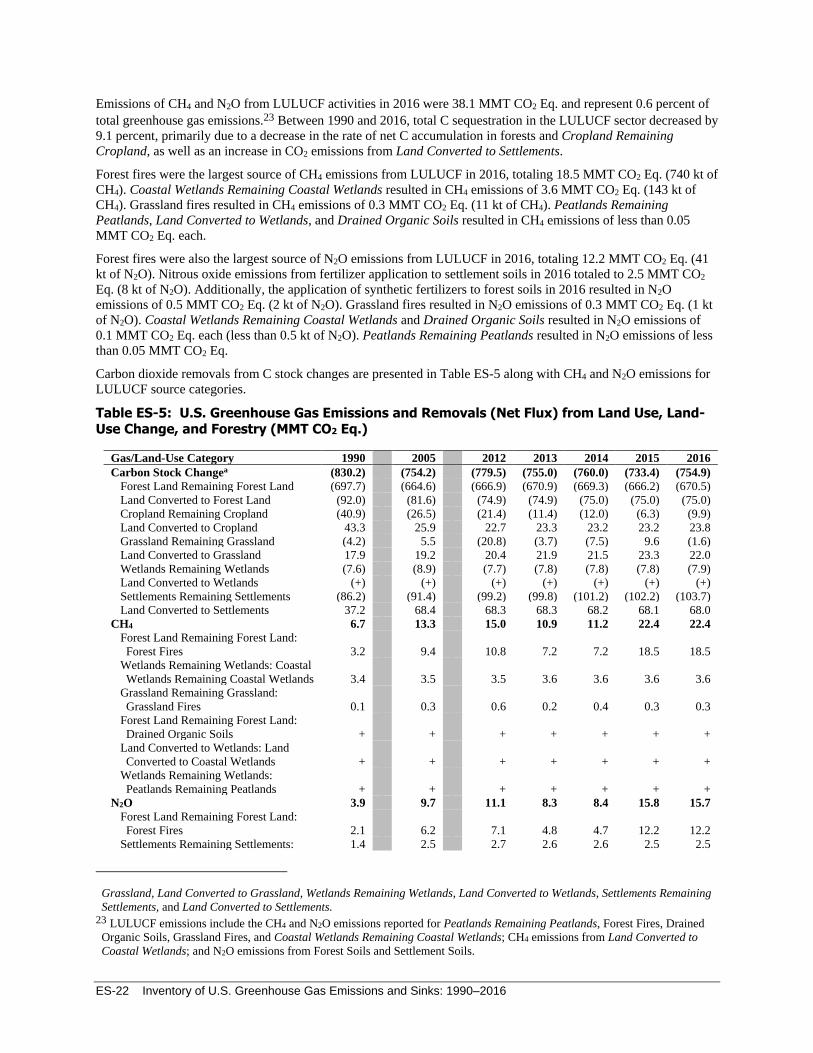
Emissions of CH4 and N2O from LULUCF activities in 2016 were 38.1 MMT CO2 Eq. and represent 0.6 percent of
total greenhouse gas emissions.23 Between 1990 and 2016, total C sequestration in the LULUCF sector decreased by
9.1 percent, primarily due to a decrease in the rate of net C accumulation in forests and Cropland Remaining
Cropland, as well as an increase in CO2 emissions from Land Converted to Settlements.
Forest fires were the largest source of CH4 emissions from LULUCF in 2016, totaling 18.5 MMT CO2 Eq. (740 kt of
CH4). Coastal Wetlands Remaining Coastal Wetlands resulted in CH4 emissions of 3.6 MMT CO2 Eq. (143 kt of
CH4). Grassland fires resulted in CH4 emissions of 0.3 MMT CO2 Eq. (11 kt of CH4). Peatlands Remaining
Peatlands, Land Converted to Wetlands, and Drained Organic Soils resulted in CH4 emissions of less than 0.05
MMT CO2 Eq. each.
Forest fires were also the largest source of N2O emissions from LULUCF in 2016, totaling 12.2 MMT CO2 Eq. (41
kt of N2O). Nitrous oxide emissions from fertilizer application to settlement soils in 2016 totaled to 2.5 MMT CO2
Eq. (8 kt of N2O). Additionally, the application of synthetic fertilizers to forest soils in 2016 resulted in N2O
emissions of 0.5 MMT CO2 Eq. (2 kt of N2O). Grassland fires resulted in N2O emissions of 0.3 MMT CO2 Eq. (1 kt
of N2O). Coastal Wetlands Remaining Coastal Wetlands and Drained Organic Soils resulted in N2O emissions of
0.1 MMT CO2 Eq. each (less than 0.5 kt of N2O). Peatlands Remaining Peatlands resulted in N2O emissions of less
than 0.05 MMT CO2 Eq.
Carbon dioxide removals from C stock changes are presented in Table ES-5 along with CH4 and N2O emissions for
LULUCF source categories.
Table ES-5: U.S. Greenhouse Gas Emissions and Removals (Net Flux) from Land Use, Land-Use Change, and Forestry (MMT CO2 Eq.)
Gas/Land-Use Category 1990 2005 2012 2013 2014 2015 2016
Carbon Stock Changea (830.2) (754.2) (779.5) (755.0) (760.0) (733.4) (754.9)
Forest Land Remaining Forest Land (697.7) (664.6) (666.9) (670.9) (669.3) (666.2) (670.5)
Land Converted to Forest Land (92.0) (81.6) (74.9) (74.9) (75.0) (75.0) (75.0)
Cropland Remaining Cropland (40.9) (26.5) (21.4) (11.4) (12.0) (6.3) (9.9)
Land Converted to Cropland 43.3 25.9 22.7 23.3 23.2 23.2 23.8
Grassland Remaining Grassland (4.2) 5.5 (20.8) (3.7) (7.5) 9.6 (1.6)
Land Converted to Grassland 17.9 19.2 20.4 21.9 21.5 23.3 22.0
Wetlands Remaining Wetlands (7.6) (8.9) (7.7) (7.8) (7.8) (7.8) (7.9)
Land Converted to Wetlands (+) (+) (+) (+) (+) (+) (+)
Settlements Remaining Settlements (86.2) (91.4) (99.2) (99.8) (101.2) (102.2) (103.7)
Land Converted to Settlements 37.2 68.4 68.3 68.3 68.2 68.1 68.0
CH4 6.7 13.3 15.0 10.9 11.2 22.4 22.4
Forest Land Remaining Forest Land:
Forest Fires 3.2 9.4 10.8 7.2 7.2 18.5 18.5
Wetlands Remaining Wetlands: Coastal
Wetlands Remaining Coastal Wetlands 3.4 3.5 3.5 3.6 3.6 3.6 3.6
Grassland Remaining Grassland:
Grassland Fires 0.1 0.3 0.6 0.2 0.4 0.3 0.3
Forest Land Remaining Forest Land:
Drained Organic Soils + + + + + + +
Land Converted to Wetlands: Land
Converted to Coastal Wetlands + + + + + + +
Wetlands Remaining Wetlands:
Peatlands Remaining Peatlands + + + + + + +
N2O 3.9 9.7 11.1 8.3 8.4 15.8 15.7
Forest Land Remaining Forest Land:
Forest Fires 2.1 6.2 7.1 4.8 4.7 12.2 12.2
Settlements Remaining Settlements: 1.4 2.5 2.7 2.6 2.6 2.5 2.5
Grassland, Land Converted to Grassland, Wetlands Remaining Wetlands, Land Converted to Wetlands, Settlements Remaining
Settlements, and Land Converted to Settlements. 23 LULUCF emissions include the CH4 and N2O emissions reported for Peatlands Remaining Peatlands, Forest Fires, Drained
Organic Soils, Grassland Fires, and Coastal Wetlands Remaining Coastal Wetlands; CH4 emissions from Land Converted to
Coastal Wetlands; and N2O emissions from Forest Soils and Settlement Soils.
Executive Summary ES-23
Settlement Soilsb
Forest Land Remaining Forest Land:
Forest Soilsc 0.1 0.5 0.5 0.5 0.5 0.5 0.5
Grassland Remaining Grassland:
Grassland Fires 0.1 0.3 0.6 0.2 0.4 0.3 0.3
Wetlands Remaining Wetlands: Coastal
Wetlands Remaining Coastal Wetlands 0.1 0.2 0.1 0.1 0.1 0.1 0.1
Forest Land Remaining Forest Land:
Drained Organic Soils 0.1 0.1 0.1 0.1 0.1 0.1 0.1
Wetlands Remaining Wetlands:
Peatlands Remaining Peatlands + + + + + + +
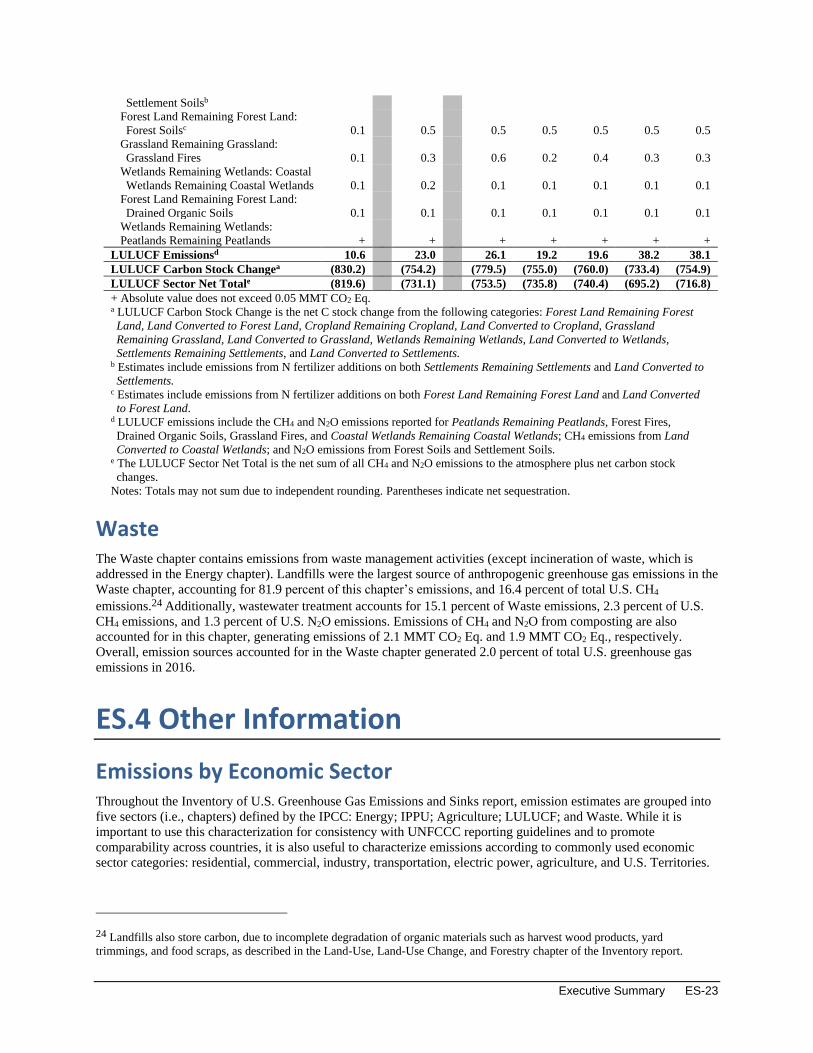
LULUCF Emissionsd 10.6 23.0 26.1 19.2 19.6 38.2 38.1
LULUCF Carbon Stock Changea (830.2) (754.2) (779.5) (755.0) (760.0) (733.4) (754.9)
LULUCF Sector Net Totale (819.6) (731.1) (753.5) (735.8) (740.4) (695.2) (716.8)
+ Absolute value does not exceed 0.05 MMT CO2 Eq. a LULUCF Carbon Stock Change is the net C stock change from the following categories: Forest Land Remaining Forest
Land, Land Converted to Forest Land, Cropland Remaining Cropland, Land Converted to Cropland, Grassland
Remaining Grassland, Land Converted to Grassland, Wetlands Remaining Wetlands, Land Converted to Wetlands,
Settlements Remaining Settlements, and Land Converted to Settlements. b Estimates include emissions from N fertilizer additions on both Settlements Remaining Settlements and Land Converted to
Settlements. c Estimates include emissions from N fertilizer additions on both Forest Land Remaining Forest Land and Land Converted
to Forest Land. d LULUCF emissions include the CH4 and N2O emissions reported for Peatlands Remaining Peatlands, Forest Fires,
Drained Organic Soils, Grassland Fires, and Coastal Wetlands Remaining Coastal Wetlands; CH4 emissions from Land
Converted to Coastal Wetlands; and N2O emissions from Forest Soils and Settlement Soils. e The LULUCF Sector Net Total is the net sum of all CH4 and N2O emissions to the atmosphere plus net carbon stock
changes.
Notes: Totals may not sum due to independent rounding. Parentheses indicate net sequestration.
Waste The Waste chapter contains emissions from waste management activities (except incineration of waste, which is
addressed in the Energy chapter). Landfills were the largest source of anthropogenic greenhouse gas emissions in the
Waste chapter, accounting for 81.9 percent of this chapter’s emissions, and 16.4 percent of total U.S. CH4
emissions.24 Additionally, wastewater treatment accounts for 15.1 percent of Waste emissions, 2.3 percent of U.S.
CH4 emissions, and 1.3 percent of U.S. N2O emissions. Emissions of CH4 and N2O from composting are also
accounted for in this chapter, generating emissions of 2.1 MMT CO2 Eq. and 1.9 MMT CO2 Eq., respectively.
Overall, emission sources accounted for in the Waste chapter generated 2.0 percent of total U.S. greenhouse gas
emissions in 2016.
ES.4 Other Information
Emissions by Economic Sector Throughout the Inventory of U.S. Greenhouse Gas Emissions and Sinks report, emission estimates are grouped into
five sectors (i.e., chapters) defined by the IPCC: Energy; IPPU; Agriculture; LULUCF; and Waste. While it is
important to use this characterization for consistency with UNFCCC reporting guidelines and to promote
comparability across countries, it is also useful to characterize emissions according to commonly used economic
sector categories: residential, commercial, industry, transportation, electric power, agriculture, and U.S. Territories.
24 Landfills also store carbon, due to incomplete degradation of organic materials such as harvest wood products, yard
trimmings, and food scraps, as described in the Land-Use, Land-Use Change, and Forestry chapter of the Inventory report.
ES-24 Inventory of U.S. Greenhouse Gas Emissions and Sinks: 1990–2016
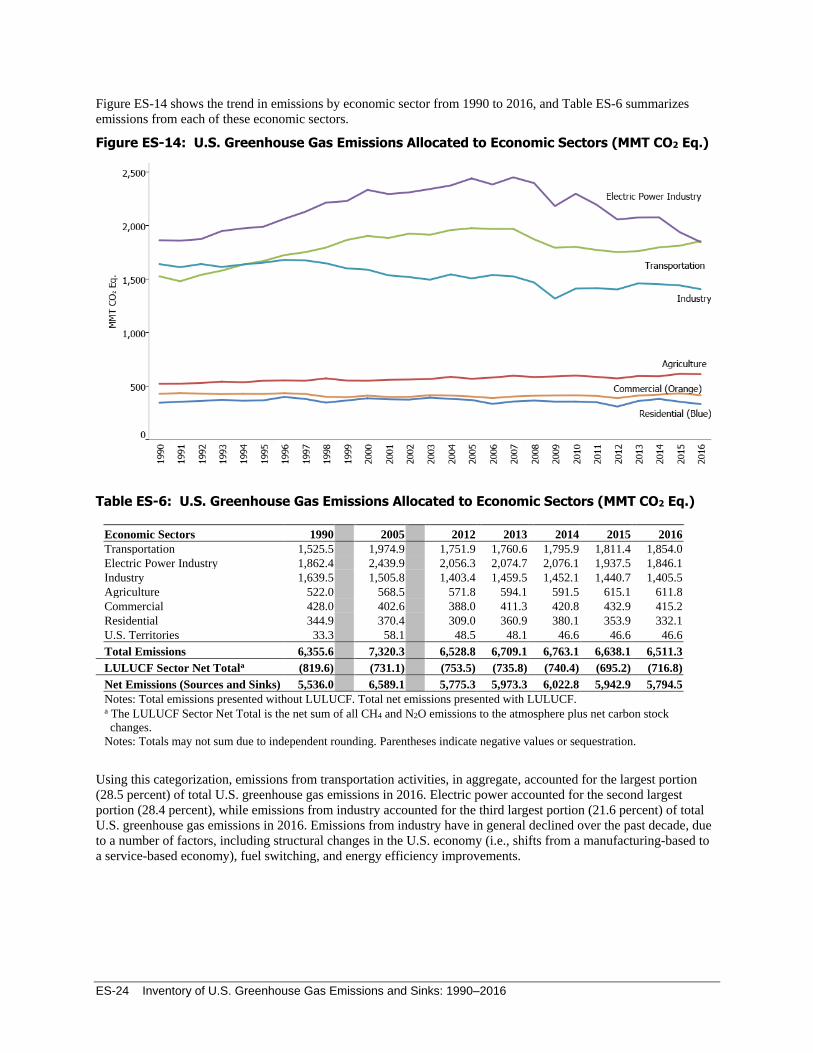
Figure ES-14 shows the trend in emissions by economic sector from 1990 to 2016, and Table ES-6 summarizes
emissions from each of these economic sectors.
Figure ES-14: U.S. Greenhouse Gas Emissions Allocated to Economic Sectors (MMT CO2 Eq.)
Table ES-6: U.S. Greenhouse Gas Emissions Allocated to Economic Sectors (MMT CO2 Eq.)
Economic Sectors 1990 2005 2012 2013 2014 2015 2016
Transportation 1,525.5 1,974.9 1,751.9 1,760.6 1,795.9 1,811.4 1,854.0
Electric Power Industry 1,862.4 2,439.9 2,056.3 2,074.7 2,076.1 1,937.5 1,846.1
Industry 1,639.5 1,505.8 1,403.4 1,459.5 1,452.1 1,440.7 1,405.5
Agriculture 522.0 568.5 571.8 594.1 591.5 615.1 611.8
Commercial 428.0 402.6 388.0 411.3 420.8 432.9 415.2
Residential 344.9 370.4 309.0 360.9 380.1 353.9 332.1
U.S. Territories 33.3 58.1 48.5 48.1 46.6 46.6 46.6
Total Emissions 6,355.6 7,320.3 6,528.8 6,709.1 6,763.1 6,638.1 6,511.3
LULUCF Sector Net Totala (819.6) (731.1) (753.5) (735.8) (740.4) (695.2) (716.8)
Net Emissions (Sources and Sinks) 5,536.0 6,589.1 5,775.3 5,973.3 6,022.8 5,942.9 5,794.5
Notes: Total emissions presented without LULUCF. Total net emissions presented with LULUCF. a The LULUCF Sector Net Total is the net sum of all CH4 and N2O emissions to the atmosphere plus net carbon stock
changes.
Notes: Totals may not sum due to independent rounding. Parentheses indicate negative values or sequestration.
Using this categorization, emissions from transportation activities, in aggregate, accounted for the largest portion
(28.5 percent) of total U.S. greenhouse gas emissions in 2016. Electric power accounted for the second largest
portion (28.4 percent), while emissions from industry accounted for the third largest portion (21.6 percent) of total
U.S. greenhouse gas emissions in 2016. Emissions from industry have in general declined over the past decade, due
to a number of factors, including structural changes in the U.S. economy (i.e., shifts from a manufacturing-based to
a service-based economy), fuel switching, and energy efficiency improvements.
Executive Summary ES-25
The remaining 21.6 percent of U.S. greenhouse gas emissions were contributed by, in order of magnitude, the
agriculture, commercial, and residential sectors, plus emissions from U.S. Territories.25 Activities related to
agriculture accounted for 9.4 percent of U.S. emissions; unlike other economic sectors, agricultural sector emissions
were dominated by N2O emissions from agricultural soil management and CH4 emissions from enteric fermentation.
The commercial and residential sectors accounted for 6.4 percent and 5.1 percent of emissions, respectively, and
U.S. Territories accounted for 0.7 percent of emissions; emissions from these sectors primarily consisted of CO2
emissions from fossil fuel combustion. CO2 was also emitted and sequestered by a variety of activities related to
forest management practices, tree planting in urban areas, the management of agricultural soils, landfilling of yard
trimmings, and changes in C stocks in coastal wetlands.
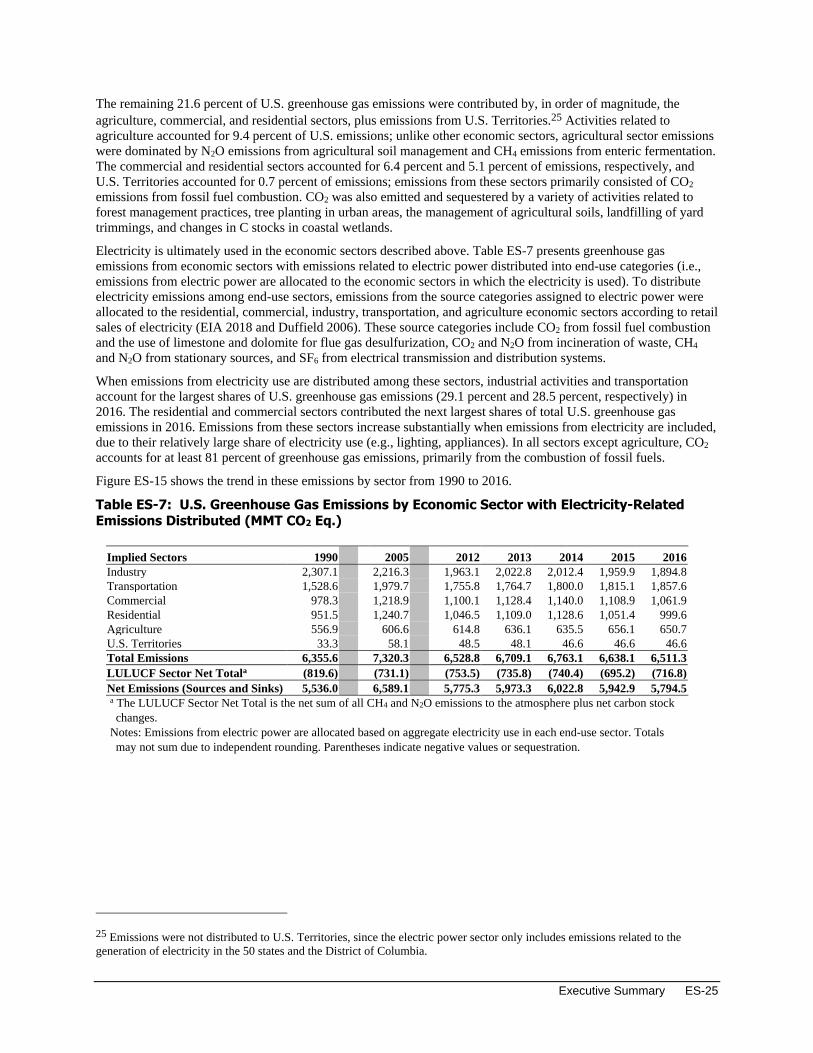
Electricity is ultimately used in the economic sectors described above. Table ES-7 presents greenhouse gas
emissions from economic sectors with emissions related to electric power distributed into end-use categories (i.e.,
emissions from electric power are allocated to the economic sectors in which the electricity is used). To distribute
electricity emissions among end-use sectors, emissions from the source categories assigned to electric power were
allocated to the residential, commercial, industry, transportation, and agriculture economic sectors according to retail
sales of electricity (EIA 2018 and Duffield 2006). These source categories include CO2 from fossil fuel combustion
and the use of limestone and dolomite for flue gas desulfurization, CO2 and N2O from incineration of waste, CH4
and N2O from stationary sources, and SF6 from electrical transmission and distribution systems.
When emissions from electricity use are distributed among these sectors, industrial activities and transportation
account for the largest shares of U.S. greenhouse gas emissions (29.1 percent and 28.5 percent, respectively) in
2016. The residential and commercial sectors contributed the next largest shares of total U.S. greenhouse gas
emissions in 2016. Emissions from these sectors increase substantially when emissions from electricity are included,
due to their relatively large share of electricity use (e.g., lighting, appliances). In all sectors except agriculture, CO2
accounts for at least 81 percent of greenhouse gas emissions, primarily from the combustion of fossil fuels.
Figure ES-15 shows the trend in these emissions by sector from 1990 to 2016.
Table ES-7: U.S. Greenhouse Gas Emissions by Economic Sector with Electricity-Related Emissions Distributed (MMT CO2 Eq.)
Implied Sectors 1990 2005 2012 2013 2014 2015 2016
Industry 2,307.1 2,216.3 1,963.1 2,022.8 2,012.4 1,959.9 1,894.8 Transportation 1,528.6 1,979.7 1,755.8 1,764.7 1,800.0 1,815.1 1,857.6 Commercial 978.3 1,218.9 1,100.1 1,128.4 1,140.0 1,108.9 1,061.9 Residential 951.5 1,240.7 1,046.5 1,109.0 1,128.6 1,051.4 999.6 Agriculture 556.9 606.6 614.8 636.1 635.5 656.1 650.7 U.S. Territories 33.3 58.1 48.5 48.1 46.6 46.6 46.6 Total Emissions 6,355.6 7,320.3 6,528.8 6,709.1 6,763.1 6,638.1 6,511.3 LULUCF Sector Net Totala (819.6) (731.1) (753.5) (735.8) (740.4) (695.2) (716.8) Net Emissions (Sources and Sinks) 5,536.0 6,589.1 5,775.3 5,973.3 6,022.8 5,942.9 5,794.5
a The LULUCF Sector Net Total is the net sum of all CH4 and N2O emissions to the atmosphere plus net carbon stock
changes.
Notes: Emissions from electric power are allocated based on aggregate electricity use in each end-use sector. Totals
may not sum due to independent rounding. Parentheses indicate negative values or sequestration.
25 Emissions were not distributed to U.S. Territories, since the electric power sector only includes emissions related to the
generation of electricity in the 50 states and the District of Columbia.
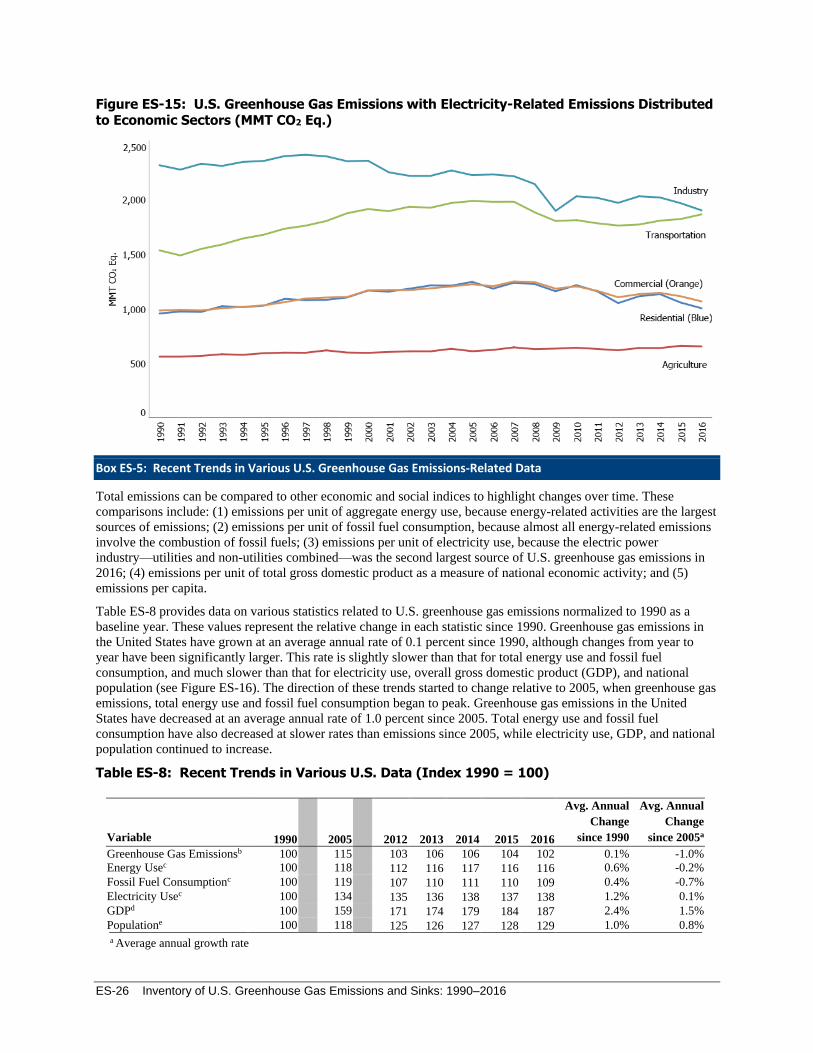
ES-26 Inventory of U.S. Greenhouse Gas Emissions and Sinks: 1990–2016
Figure ES-15: U.S. Greenhouse Gas Emissions with Electricity-Related Emissions Distributed to Economic Sectors (MMT CO2 Eq.)
Box ES-5: Recent Trends in Various U.S. Greenhouse Gas Emissions-Related Data
Total emissions can be compared to other economic and social indices to highlight changes over time. These
comparisons include: (1) emissions per unit of aggregate energy use, because energy-related activities are the largest
sources of emissions; (2) emissions per unit of fossil fuel consumption, because almost all energy-related emissions
involve the combustion of fossil fuels; (3) emissions per unit of electricity use, because the electric power
industry—utilities and non-utilities combined—was the second largest source of U.S. greenhouse gas emissions in
2016; (4) emissions per unit of total gross domestic product as a measure of national economic activity; and (5)
emissions per capita.
Table ES-8 provides data on various statistics related to U.S. greenhouse gas emissions normalized to 1990 as a
baseline year. These values represent the relative change in each statistic since 1990. Greenhouse gas emissions in
the United States have grown at an average annual rate of 0.1 percent since 1990, although changes from year to
year have been significantly larger. This rate is slightly slower than that for total energy use and fossil fuel
consumption, and much slower than that for electricity use, overall gross domestic product (GDP), and national
population (see Figure ES-16). The direction of these trends started to change relative to 2005, when greenhouse gas
emissions, total energy use and fossil fuel consumption began to peak. Greenhouse gas emissions in the United
States have decreased at an average annual rate of 1.0 percent since 2005. Total energy use and fossil fuel
consumption have also decreased at slower rates than emissions since 2005, while electricity use, GDP, and national
population continued to increase.
Table ES-8: Recent Trends in Various U.S. Data (Index 1990 = 100)
Variable 1990 2005 2012 2013 2014 2015 2016
Avg. Annual
Change
since 1990
Avg. Annual
Change
since 2005a
Greenhouse Gas Emissionsb 100 115 103 106 106 104 102 0.1%
-1.0% Energy Usec 100 118 112 116 117 116 116 0.6% -0.2% Fossil Fuel Consumptionc 100 119 107 110 111 110 109 0.4% -0.7% Electricity Usec 100 134 135 136 138 137 138 1.2% 0.1% GDPd 100 159 171 174 179 184 187 2.4% 1.5% Populatione 100 118 125 126 127 128 129 1.0% 0.8% a Average annual growth rate
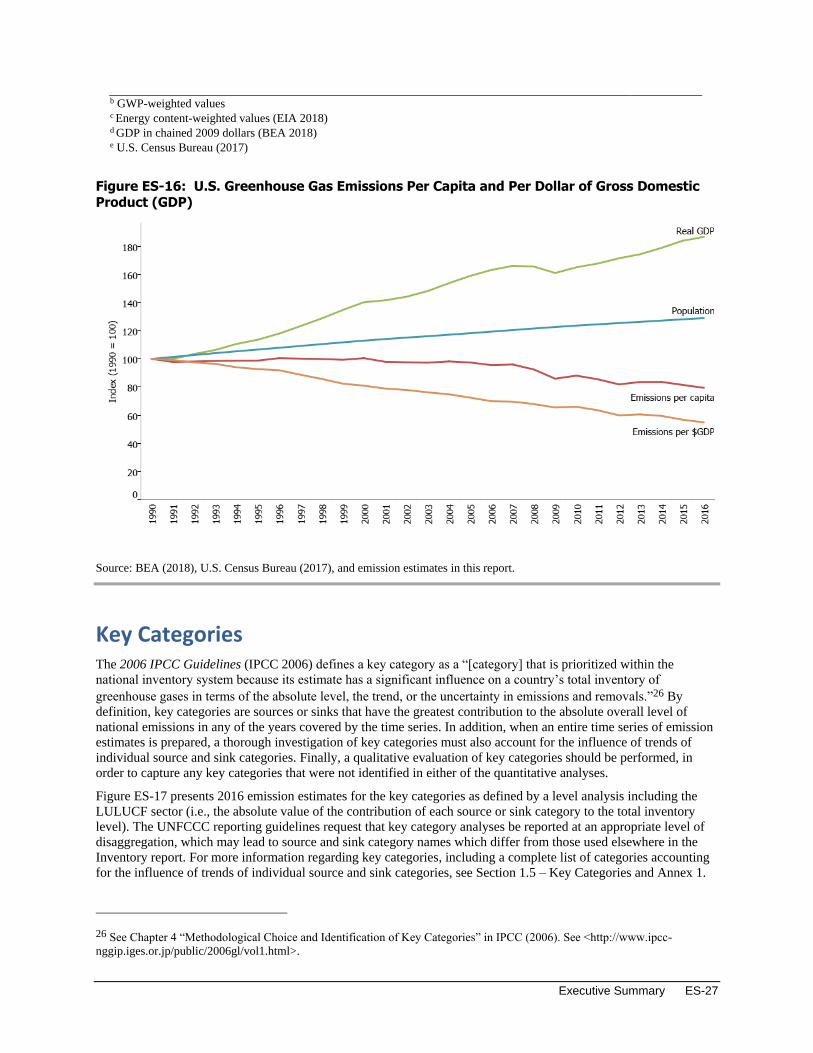
Executive Summary ES-27
b GWP-weighted values c Energy content-weighted values (EIA 2018) d GDP in chained 2009 dollars (BEA 2018) e U.S. Census Bureau (2017)
Figure ES-16: U.S. Greenhouse Gas Emissions Per Capita and Per Dollar of Gross Domestic Product (GDP)
Source: BEA (2018), U.S. Census Bureau (2017), and emission estimates in this report.
Key Categories The 2006 IPCC Guidelines (IPCC 2006) defines a key category as a “[category] that is prioritized within the
national inventory system because its estimate has a significant influence on a country’s total inventory of
greenhouse gases in terms of the absolute level, the trend, or the uncertainty in emissions and removals.”26 By
definition, key categories are sources or sinks that have the greatest contribution to the absolute overall level of
national emissions in any of the years covered by the time series. In addition, when an entire time series of emission
estimates is prepared, a thorough investigation of key categories must also account for the influence of trends of
individual source and sink categories. Finally, a qualitative evaluation of key categories should be performed, in
order to capture any key categories that were not identified in either of the quantitative analyses.
Figure ES-17 presents 2016 emission estimates for the key categories as defined by a level analysis including the
LULUCF sector (i.e., the absolute value of the contribution of each source or sink category to the total inventory
level). The UNFCCC reporting guidelines request that key category analyses be reported at an appropriate level of
disaggregation, which may lead to source and sink category names which differ from those used elsewhere in the
Inventory report. For more information regarding key categories, including a complete list of categories accounting
for the influence of trends of individual source and sink categories, see Section 1.5 – Key Categories and Annex 1.
26 See Chapter 4 “Methodological Choice and Identification of Key Categories” in IPCC (2006). See <http://www.ipcc-
nggip.iges.or.jp/public/2006gl/vol1.html>.
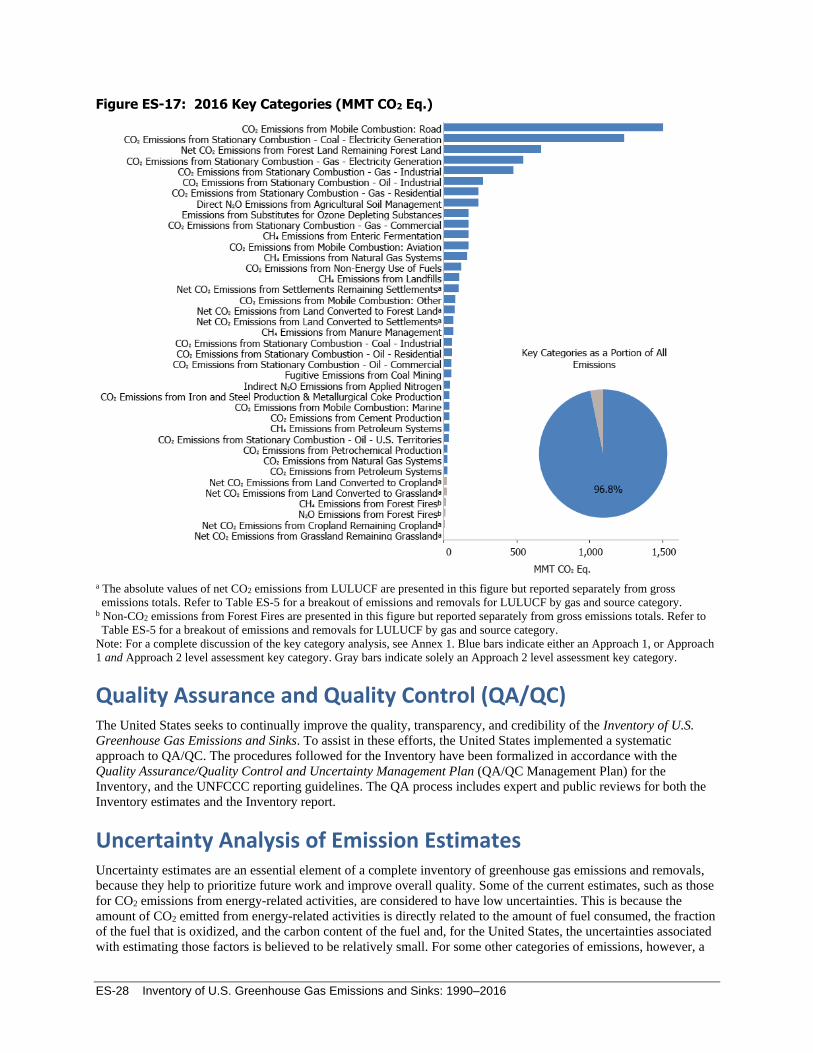
ES-28 Inventory of U.S. Greenhouse Gas Emissions and Sinks: 1990–2016
Figure ES-17: 2016 Key Categories (MMT CO2 Eq.)
a The absolute values of net CO2 emissions from LULUCF are presented in this figure but reported separately from gross
emissions totals. Refer to Table ES-5 for a breakout of emissions and removals for LULUCF by gas and source category. b Non-CO2 emissions from Forest Fires are presented in this figure but reported separately from gross emissions totals. Refer to
Table ES-5 for a breakout of emissions and removals for LULUCF by gas and source category.
Note: For a complete discussion of the key category analysis, see Annex 1. Blue bars indicate either an Approach 1, or Approach
1 and Approach 2 level assessment key category. Gray bars indicate solely an Approach 2 level assessment key category.
Quality Assurance and Quality Control (QA/QC) The United States seeks to continually improve the quality, transparency, and credibility of the Inventory of U.S.
Greenhouse Gas Emissions and Sinks. To assist in these efforts, the United States implemented a systematic
approach to QA/QC. The procedures followed for the Inventory have been formalized in accordance with the
Quality Assurance/Quality Control and Uncertainty Management Plan (QA/QC Management Plan) for the
Inventory, and the UNFCCC reporting guidelines. The QA process includes expert and public reviews for both the
Inventory estimates and the Inventory report.
Uncertainty Analysis of Emission Estimates Uncertainty estimates are an essential element of a complete inventory of greenhouse gas emissions and removals,
because they help to prioritize future work and improve overall quality. Some of the current estimates, such as those
for CO2 emissions from energy-related activities, are considered to have low uncertainties. This is because the
amount of CO2 emitted from energy-related activities is directly related to the amount of fuel consumed, the fraction
of the fuel that is oxidized, and the carbon content of the fuel and, for the United States, the uncertainties associated
with estimating those factors is believed to be relatively small. For some other categories of emissions, however, a

Executive Summary ES-29
lack of data or an incomplete understanding of how emissions are generated increases the uncertainty or systematic
error associated with the estimates presented. Recognizing the benefit of conducting an uncertainty analysis, the
UNFCCC reporting guidelines follow the recommendations of the 2006 IPCC Guidelines (IPCC 2006), Volume 1,
Chapter 3 and require that countries provide single estimates of uncertainty for source and sink categories.
In addition to quantitative uncertainty assessments provided in accordance with UNFCCC reporting guidelines, a
qualitative discussion of uncertainty is presented for all source and sink categories. Within the discussion of each
emission source, specific factors affecting the uncertainty surrounding the estimates are discussed.