Inventory of U.S. Greenhouse Gas Emissions and Sinks: 1990 ...
Introduction 1-1
1. Introduction This report presents estimates by the United States government of U.S. anthropogenic greenhouse gas emissions and
sinks for the years 1990 through 2015. A summary of these estimates is provided in Table 2-1 and Table 2-2 by gas
and source category in the Trends in Greenhouse Gas Emissions chapter. The emission estimates in these tables are
presented on both a full molecular mass basis and on a Global Warming Potential (GWP) weighted basis1 in order to
show the relative contribution of each gas to global average radiative forcing. This report also discusses the methods
and data used to calculate these emission estimates.
In 1992, the United States signed and ratified the United Nations Framework Convention on Climate Change
(UNFCCC). As stated in Article 2 of the UNFCCC, “The ultimate objective of this Convention and any related legal
instruments that the Conference of the Parties may adopt is to achieve, in accordance with the relevant provisions of
the Convention, stabilization of greenhouse gas concentrations in the atmosphere at a level that would prevent
dangerous anthropogenic interference with the climate system. Such a level should be achieved within a time-frame
sufficient to allow ecosystems to adapt naturally to climate change, to ensure that food production is not threatened
and to enable economic development to proceed in a sustainable manner.”2,3
Parties to the Convention, by ratifying, “shall develop, periodically update, publish and make available…national
inventories of anthropogenic emissions by sources and removals by sinks of all greenhouse gases not controlled by
the Montreal Protocol, using comparable methodologies…”4 The United States views this report as an opportunity
to fulfill these commitments under the UNFCCC.
In 1988, preceding the creation of the UNFCCC, the World Meteorological Organization (WMO) and the United
Nations Environment Programme (UNEP) jointly established the Intergovernmental Panel on Climate Change
(IPCC). The role of the IPCC is to assess on a comprehensive, objective, open and transparent basis the scientific,
technical and socio-economic information relevant to understanding the scientific basis of risk of human-induced
climate change, its potential impacts and options for adaptation and mitigation (IPCC 2014). Under Working Group
1 of the IPCC, nearly 140 scientists and national experts from more than thirty countries collaborated in the creation
of the Revised 1996 IPCC Guidelines for National Greenhouse Gas Inventories (IPCC/UNEP/OECD/IEA 1997) to
ensure that the emission inventories submitted to the UNFCCC are consistent and comparable between nations. The
IPCC Good Practice Guidance and Uncertainty Management in National Greenhouse Gas Inventories and the
IPCC Good Practice Guidance for Land Use, Land-Use Change, and Forestry further expanded upon the
methodologies in the Revised 1996 IPCC Guidelines. In 2006, the IPCC accepted the 2006 Guidelines for National
Greenhouse Gas Inventories at its Twenty-Fifth Session (Mauritius, April 2006). The 2006 IPCC Guidelines built
1 More information provided in “Global Warming Potentials” section of this chapter on the use of IPCC Fourth Assessment
Report (AR4) GWP values. 2 The term “anthropogenic,” in this context, refers to greenhouse gas emissions and removals that are a direct result of human
activities or are the result of natural processes that have been affected by human activities (IPCC 2006). 3 Article 2 of the Framework Convention on Climate Change published by the UNEP/WMO Information Unit on Climate
Change. See <http://unfccc.int>. (UNEP/WMO 2000) 4 Article 4(1)(a) of the United Nations Framework Convention on Climate Change (also identified in Article 12). Subsequent
decisions by the Conference of the Parties elaborated the role of Annex I Parties in preparing national inventories. See
<http://unfccc.int>.
1-2 Inventory of U.S. Greenhouse Gas Emissions and Sinks: 1990–2015
upon the previous bodies of work and include new sources and gases “…as well as updates to the previously
published methods whenever scientific and technical knowledge have improved since the previous guidelines were
issued.” The UNFCCC adopted the 2006 IPCC Guidelines as the standard methodological approach for Annex I
countries at the Nineteenth Conference of the Parties (Warsaw, November 11-23, 2013). This report presents
information in accordance with these guidelines.
Overall, this Inventory of anthropogenic greenhouse gas emissions and sinks provides a common and consistent
mechanism through which Parties to the UNFCCC can estimate emissions and compare the relative contribution of
individual sources, gases, and nations to climate change. The Inventory provides a national estimate of sources and
sinks for the United States, including all states and U.S. Territories.5 The structure of this report is consistent with
the current UNFCCC Guidelines on Annual Inventories (UNFCCC 2014) for Parties included in Annex I of the
Convention.
Box 1-1: Methodological Approach for Estimating and Reporting U.S. Emissions and Sinks
In following the UNFCCC requirement under Article 4.1 to develop and submit national greenhouse gas emissions
inventories, the gross emissions total presented in this report for the United States excludes emissions and sinks
from LULUCF. The net emissions total presented in this report for the United States includes emissions and sinks
from LULUCF. All emissions and sinks are calculated using internationally-accepted methods consistent with the
IPCC Guidelines.6 Additionally, the calculated emissions and sinks in a given year for the United States are
presented in a common manner in line with the UNFCCC reporting guidelines for the reporting of inventories under
this international agreement.7 The use of consistent methods to calculate emissions and sinks by all nations
providing their inventories to the UNFCCC ensures that these reports are comparable. In this regard, U.S. emissions
and sinks reported in this Inventory are comparable to emissions and sinks reported by other countries. The report
itself follows this standardized format, and provides an explanation of the IPCC methods used to calculate emissions
and sinks, and the manner in which those calculations are conducted.
On October 30, 2009, the U.S. Environmental Protection Agency (EPA) published a rule for the mandatory
reporting of greenhouse gases from large greenhouse gas emissions sources in the United States. Implementation of
40 CFR Part 98 is referred to as the EPA’s GHGRP. 40 CFR Part 98 applies to direct greenhouse gas emitters, fossil
fuel suppliers, industrial gas suppliers, and facilities that inject CO2 underground for sequestration or other reasons.8
Reporting is at the facility level, except for certain suppliers of fossil fuels and industrial greenhouse gases. The
GHGRP dataset and the data presented in this Inventory are complementary.
The GHGRP dataset continues to be an important resource for the Inventory, providing not only annual emissions
information, but also other annual information, such as activity data and emissions factors that can improve and
refine national emission estimates and trends over time. GHGRP data also allow EPA to disaggregate national
Inventory estimates in new ways that can highlight differences across regions and sub-categories of emissions. The
GHGRP will continue to enhance QA/QC procedures and assessment of uncertainties.
EPA continues to analyze the data on an annual basis to improve the national estimates presented in this Inventory
and uses that data for a number of categories consistent with IPCC guidance.9 EPA has integrated GHGRP
information for several categories10 this year and also identifies other categories11 where EPA plans to integrate
5 U.S. Territories include American Samoa, Guam, Puerto Rico, U.S. Virgin Islands, Wake Island, and other U.S. Pacific Islands. 6 See <http://www.ipcc-nggip.iges.or.jp/public/index.html>. 7 See <http://unfccc.int/resource/docs/2013/cop19/eng/10a03.pdf>. 8 See <https://www.epa.gov/ghgreporting>. 9 See <http://www.ipcc-nggip.iges.or.jp/public/tb/TFI_Technical_Bulletin_1.pdf> 10 Energy Sector (Coal Mining, Stationary Combustion [Industrial Combustion Disaggregation], and Oil and Gas Systems);
Industrial Processes and Product Use (Adipic Acid Production, Aluminum Production, Carbon Dioxide Consumption, Electrical
Transmission and Distribution, HCFC-22 Production, Lime Production, Magnesium Production and Processing, ODS
Substitutes, Nitric Acid Production, Petrochemical Production, Semiconductor Manufacture); and Waste (Landfills). 11 Industrial Process and Product Use (Ammonia Production, Cement Production, and Other Fluorinated Gas Production)
Introduction 1-3
additional GHGRP data in the next edition of this report (see those categories Planned Improvement sections for
details).
1.1 Background Information
Science For over the past 200 years, the burning of fossil fuels such as coal and oil, deforestation, land-use changes, and
other sources have caused the concentrations of heat-trapping "greenhouse gases" to increase significantly in our
atmosphere (NOAA 2017). These gases in the atmosphere absorb some of the energy being radiated from the
surface of the Earth that would otherwise be lost to space, essentially acting like a blanket that makes the Earth's
surface warmer than it would be otherwise.
Greenhouse gases are necessary to life as we know it. Without greenhouse gases to create the natural heat-trapping
properties of the atmosphere, the planet's surface would be about 60 degrees Fahrenheit cooler than present
(USGCRP 2014). Carbon dioxide is also necessary for plant growth. With emissions from biological and geological
sources, there is a natural level of greenhouse gases that is maintained in the atmosphere. Human emissions of
greenhouse gases and subsequent changes in atmospheric concentrations alters the balance of energy transfers
between space and the earth system (IPCC 2013). A gauge of these changes is called radiative forcing, which is a
measure of a substance’s total net effect on the global energy balance for which a positive number represents a
warming effect and a negative number represents a cooling effect (IPCC 2013). IPCC concluded in its most recent
scientific assessment report that it is extremely likely that human influences have been the dominant cause of
warming since the mid-20th century (IPCC 2013).
As concentrations of greenhouse gases continue to increase in from man-made sources, the Earth's temperature is
climbing above past levels. The Earth's average land and ocean surface temperature has increased by about 1.2 to
1.9 degrees Fahrenheit since 1880. The last three decades have each been the warmest decade successively at the
Earth’s surface since 1850 (IPCC 2013). Other aspects of the climate are also changing such as rainfall patterns,
snow and ice cover, and sea level. If greenhouse gas concentrations continue to increase, climate models predict that
the average temperature at the Earth's surface is likely to increase from 0.5 to 8.6 degrees Fahrenheit above 1986
through 2005 levels by the end of this century, depending on future emissions and the responsiveness of the climate
system (IPCC 2013).
For further information on greenhouse gases, radiative forcing, and implications for climate change, see the recent
scientific assessment reports from the IPCC,12 the U.S. Global Change Research Program (USGCRP),13 and the
National Academies of Sciences, Engineering, and Medicine (NAS).14
Greenhouse Gases Although the Earth’s atmosphere consists mainly of oxygen and nitrogen, neither plays a significant role in
enhancing the greenhouse effect because both are essentially transparent to terrestrial radiation. The greenhouse
effect is primarily a function of the concentration of water vapor, carbon dioxide (CO2), methane (CH4), nitrous
oxide (N2O), and other trace gases in the atmosphere that absorb the terrestrial radiation leaving the surface of the
Earth (IPCC 2013).
Naturally occurring greenhouse gases include water vapor, CO2, CH4, N2O, and ozone (O3). Several classes of
halogenated substances that contain fluorine, chlorine, or bromine are also greenhouse gases, but they are, for the
most part, solely a product of industrial activities. Chlorofluorocarbons (CFCs) and hydrochlorofluorocarbons
12 See <http://www.ipcc.ch/report/ar5> 13 See <http://nca2014.globalchange.gov> 14 See <http://nas-sites.org/americasclimatechoices/>
1-4 Inventory of U.S. Greenhouse Gas Emissions and Sinks: 1990–2015
(HCFCs) are halocarbons that contain chlorine, while halocarbons that contain bromine are referred to as
bromofluorocarbons (i.e., halons). As stratospheric ozone depleting substances, CFCs, HCFCs, and halons are
covered under the Montreal Protocol on Substances that Deplete the Ozone Layer. The UNFCCC defers to this
earlier international treaty. Consequently, Parties to the UNFCCC are not required to include these gases in national
greenhouse gas inventories.15 Some other fluorine-containing halogenated substances—hydrofluorocarbons (HFCs),
perfluorocarbons (PFCs), sulfur hexafluoride (SF6), and nitrogen trifluoride (NF3)—do not deplete stratospheric
ozone but are potent greenhouse gases. These latter substances are addressed by the UNFCCC and accounted for in
national greenhouse gas inventories.
There are also several other substances that influence the global radiation budget but are short-lived and therefore
not well-mixed, leading to spatially variable radiative forcing effects. These substances include carbon monoxide
(CO), nitrogen dioxide (NO2), sulfur dioxide (SO2), and tropospheric (ground level) ozone (O3). Tropospheric ozone
is formed from chemical reactions in the atmosphere of precursor pollutants, which include volatile organic
compounds (VOCs, including CH4) and nitrogen oxides (NOx), in the presence of ultraviolet light (sunlight).
Aerosols are extremely small particles or liquid droplets suspended in the Earth’s atmosphere that are often
composed of sulfur compounds, carbonaceous combustion products (e.g., black carbon), crustal materials (e.g., dust)
and other human induced pollutants. They can affect the absorptive characteristics of the atmosphere (e.g., scattering
incoming sunlight away from the Earth’s surface, or, in the case of black carbon, absorb sunlight) and can play a
role in affecting cloud formation and lifetime, as well as the radiative forcing of clouds and precipitation patterns.
Comparatively, however, while the understanding of aerosols has increased in recent years, they still account for the
largest contribution to uncertainty estimates in global energy budgets (IPCC 2013).
Carbon dioxide, CH4, and N2O are continuously emitted to and removed from the atmosphere by natural processes
on Earth. Anthropogenic activities, however, can cause additional quantities of these and other greenhouse gases to
be emitted or sequestered, thereby changing their global average atmospheric concentrations. Natural activities such
as respiration by plants or animals and seasonal cycles of plant growth and decay are examples of processes that
only cycle carbon or nitrogen between the atmosphere and organic biomass. Such processes, except when directly or
indirectly perturbed out of equilibrium by anthropogenic activities, generally do not alter average atmospheric
greenhouse gas concentrations over decadal timeframes. Climatic changes resulting from anthropogenic activities,
however, could have positive or negative feedback effects on these natural systems. Atmospheric concentrations of
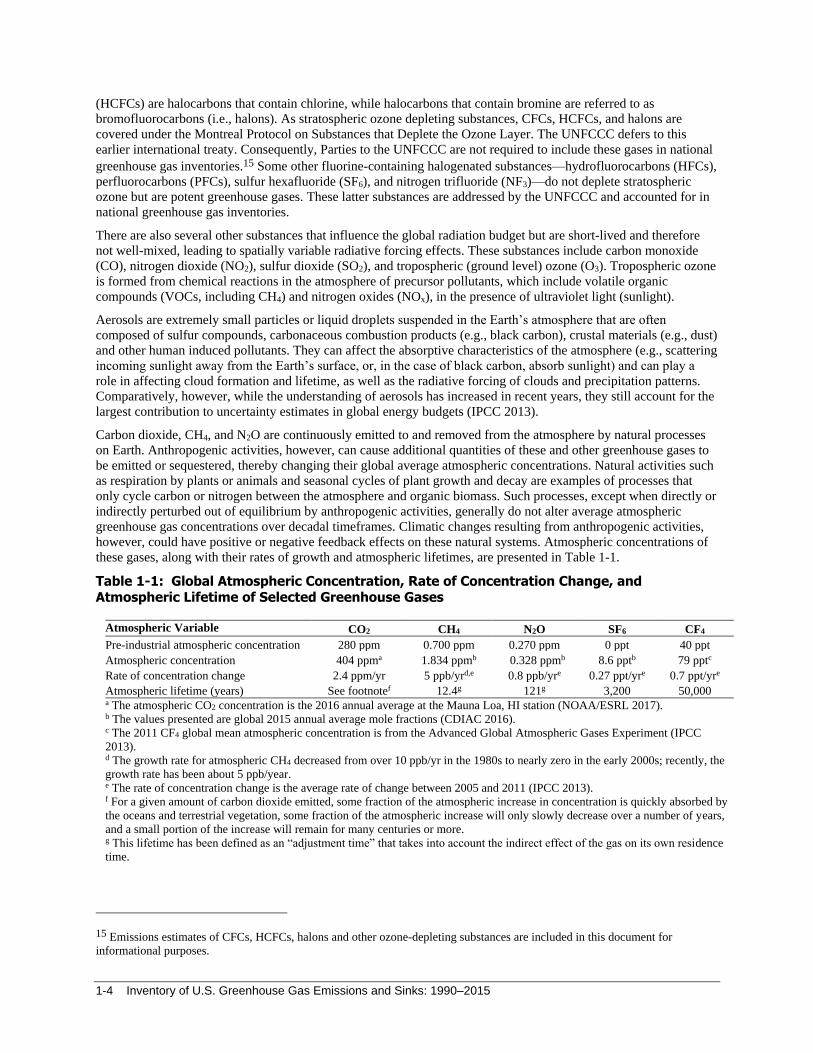
these gases, along with their rates of growth and atmospheric lifetimes, are presented in Table 1-1.
Table 1-1: Global Atmospheric Concentration, Rate of Concentration Change, and Atmospheric Lifetime of Selected Greenhouse Gases
Atmospheric Variable CO2 CH4 N2O SF6 CF4
Pre-industrial atmospheric concentration 280 ppm 0.700 ppm 0.270 ppm 0 ppt 40 ppt
Atmospheric concentration 404 ppma 1.834 ppmb 0.328 ppmb 8.6 pptb 79 pptc
Rate of concentration change 2.4 ppm/yr 5 ppb/yrd,e 0.8 ppb/yre 0.27 ppt/yre 0.7 ppt/yre
Atmospheric lifetime (years) See footnotef 12.4g 121g 3,200 50,000
a The atmospheric CO2 concentration is the 2016 annual average at the Mauna Loa, HI station (NOAA/ESRL 2017). b The values presented are global 2015 annual average mole fractions (CDIAC 2016). c The 2011 CF4 global mean atmospheric concentration is from the Advanced Global Atmospheric Gases Experiment (IPCC
2013). d The growth rate for atmospheric CH4 decreased from over 10 ppb/yr in the 1980s to nearly zero in the early 2000s; recently, the
growth rate has been about 5 ppb/year. e The rate of concentration change is the average rate of change between 2005 and 2011 (IPCC 2013). f For a given amount of carbon dioxide emitted, some fraction of the atmospheric increase in concentration is quickly absorbed by
the oceans and terrestrial vegetation, some fraction of the atmospheric increase will only slowly decrease over a number of years,
and a small portion of the increase will remain for many centuries or more. g This lifetime has been defined as an “adjustment time” that takes into account the indirect effect of the gas on its own residence
time.
15 Emissions estimates of CFCs, HCFCs, halons and other ozone-depleting substances are included in this document for
informational purposes.
Introduction 1-5
Source: Pre-industrial atmospheric concentrations, atmospheric lifetime, and rate of concentration changes for CH4, N2O, SF6, and
CF4 are from IPCC (2013). The rate of concentration change for CO2 is an average of the rates from 2011 through 2016 has
fluctuated between 1.9 to 3.0 ppm per year over this period (NOAA/ESRL 2017).
A brief description of each greenhouse gas, its sources, and its role in the atmosphere is given below. The following
section then explains the concept of GWPs, which are assigned to individual gases as a measure of their relative
average global radiative forcing effect.
Water Vapor (H2O). Water vapor is the largest contributor to the natural greenhouse effect. Water vapor is
fundamentally different from other greenhouse gases in that it can condense and rain out when it reaches high
concentrations, and the total amount of water vapor in the atmosphere is in part a function of the Earth’s
temperature. While some human activities such as evaporation from irrigated crops or power plant cooling release
water vapor into the air, this has been determined to have a negligible effect on climate (IPCC 2013). The lifetime of
water vapor in the troposphere is on the order of 10 days. Water vapor can also contribute to cloud formation, and
clouds can have both warming and cooling effects by either trapping or reflecting heat. Because of the relationship
between water vapor levels and temperature, water vapor and clouds serve as a feedback to climate change, such
that for any given increase in other greenhouse gases, the total warming is greater than would happen in the absence
of water vapor. Aircraft emissions of water vapor can create contrails, which may also develop into contrail-induced
cirrus clouds, with complex regional and temporal net radiative forcing effects that currently have a low level of
scientific certainty (IPCC 2013).
Carbon Dioxide (CO2). In nature, carbon is cycled between various atmospheric, oceanic, land biotic, marine biotic,
and mineral reservoirs. The largest fluxes occur between the atmosphere and terrestrial biota, and between the
atmosphere and surface water of the oceans. In the atmosphere, carbon predominantly exists in its oxidized form as
CO2. Atmospheric CO2 is part of this global carbon cycle, and therefore its fate is a complex function of
geochemical and biological processes. Carbon dioxide concentrations in the atmosphere increased from
approximately 280 parts per million by volume (ppmv) in pre-industrial times to 404 ppmv in 2016, a 44 percent
increase (IPCC 2013 and NOAA/ESRL 2017).16,17 The IPCC definitively states that “the increase of CO2 … is
caused by anthropogenic emissions from the use of fossil fuel as a source of energy and from land use and land use
changes, in particular agriculture” (IPCC 2013). The predominant source of anthropogenic CO2 emissions is the
combustion of fossil fuels. Forest clearing, other biomass burning, and some non-energy production processes (e.g.,
cement production) also emit notable quantities of CO2. In its Fifth Assessment Report, the IPCC stated “it is
extremely likely that more than half of the observed increase in global average surface temperature from 1951 to
2010 was caused by the anthropogenic increase in greenhouse gas concentrations and other anthropogenic forcings
together,” of which CO2 is the most important (IPCC 2013).
Methane (CH4). Methane is primarily produced through anaerobic decomposition of organic matter in biological
systems. Agricultural processes such as wetland rice cultivation, enteric fermentation in animals, and the
decomposition of animal wastes emit CH4, as does the decomposition of municipal solid wastes. Methane is also
emitted during the production and distribution of natural gas and petroleum, and is released as a by-product of coal
mining and incomplete fossil fuel combustion. Atmospheric concentrations of CH4 have increased by about 162
percent since 1750, from a pre-industrial value of about 700 ppb to 1,834 ppb in 201518 although the rate of increase
decreased to near zero in the early 2000s, and has recently increased again to about 5 ppb/year. The IPCC has
estimated that slightly more than half of the current CH4 flux to the atmosphere is anthropogenic, from human
activities such as agriculture, fossil fuel use, and waste disposal (IPCC 2007).
Methane is primarily removed from the atmosphere through a reaction with the hydroxyl radical (OH) and is
ultimately converted to CO2. Minor removal processes also include reaction with chlorine in the marine boundary
layer, a soil sink, and stratospheric reactions. Increasing emissions of CH4 reduce the concentration of OH, a
feedback that increases the atmospheric lifetime of CH4 (IPCC 2013). Methane’s reactions in the atmosphere also
16 The pre-industrial period is considered as the time preceding the year 1750 (IPCC 2013). 17 Carbon dioxide concentrations during the last 1,000 years of the pre-industrial period (i.e., 750 to 1750), a time of relative
climate stability, fluctuated by about 10 ppmv around 280 ppmv (IPCC 2013). 18 This value is the global 2015 annual average mole fraction (CDIAC 2016).
1-6 Inventory of U.S. Greenhouse Gas Emissions and Sinks: 1990–2015
lead to production of tropospheric ozone and stratospheric water vapor, both of which also contribute to climate
change.
Nitrous Oxide (N2O). Anthropogenic sources of N2O emissions include agricultural soils, especially production of
nitrogen-fixing crops and forages, the use of synthetic and manure fertilizers, and manure deposition by livestock;
fossil fuel combustion, especially from mobile combustion; adipic (nylon) and nitric acid production; wastewater
treatment and waste incineration; and biomass burning. The atmospheric concentration of N2O has increased by 21
percent since 1750, from a pre-industrial value of about 270 ppb to 328 ppb in 2015,19 a concentration that has not
been exceeded during the last 800 thousand years. Nitrous oxide is primarily removed from the atmosphere by the
photolytic action of sunlight in the stratosphere (IPCC 2013).
Ozone (O3). Ozone is present in both the upper stratosphere,20 where it shields the Earth from harmful levels of
ultraviolet radiation, and at lower concentrations in the troposphere,21 where it is the main component of
anthropogenic photochemical “smog.” During the last two decades, emissions of anthropogenic chlorine and
bromine-containing halocarbons, such as CFCs, have depleted stratospheric ozone concentrations. This loss of
ozone in the stratosphere has resulted in negative radiative forcing, representing an indirect effect of anthropogenic
emissions of chlorine and bromine compounds (IPCC 2013). The depletion of stratospheric ozone and its radiative
forcing was expected to reach a maximum in about 2000 before starting to recover.
The past increase in tropospheric ozone, which is also a greenhouse gas, is estimated to provide the fourth largest
increase in direct radiative forcing since the pre-industrial era, behind CO2, black carbon, and CH4. Tropospheric
ozone is produced from complex chemical reactions of volatile organic compounds (including CH4) mixing with
NOx in the presence of sunlight. The tropospheric concentrations of ozone and these other pollutants are short-lived
and, therefore, spatially variable (IPCC 2013).
Halocarbons, Sulfur Hexafluoride, and Nitrogen Trifluoride. Halocarbons are, for the most part, man-made
chemicals that have direct radiative forcing effects and could also have an indirect effect. Halocarbons that contain
chlorine (CFCs, HCFCs, methyl chloroform, and carbon tetrachloride) and bromine (halons, methyl bromide, and
hydrobromofluorocarbons) result in stratospheric ozone depletion and are therefore controlled under the Montreal
Protocol on Substances that Deplete the Ozone Layer. Although most CFCs and HCFCs are potent global warming
gases, their net radiative forcing effect on the atmosphere is reduced because they cause stratospheric ozone
depletion, which itself is a greenhouse gas but which also shields the Earth from harmful levels of ultraviolet
radiation. Under the Montreal Protocol, the United States phased out the production and importation of halons by
1994 and of CFCs by 1996. Under the Copenhagen Amendments to the Protocol, a cap was placed on the production
and importation of HCFCs by non-Article 522 countries, including the U.S., beginning in 1996, and then followed by
intermediate requirements and a complete phase-out by the year 2030. While ozone depleting gases covered under
the Montreal Protocol and its Amendments are not covered by the UNFCCC, they are reported in this Inventory
under Annex 6.2 for informational purposes.
Hydrofluorocarbons, PFCs, SF6, and NF3 are not ozone depleting substances. The most common HFCs are,
however, powerful greenhouse gases. Hydrofluorocarbons are primarily used as replacements for ozone depleting
substances but also emitted as a by-product of the HCFC-22 (chlorodifluoromethane) manufacturing process.
Currently, they have a small aggregate radiative forcing impact, but it is anticipated that without further controls
19 This value is the global 2015 annual average (CDIAC 2016). 20 The stratosphere is the layer from the troposphere up to roughly 50 kilometers. In the lower regions the temperature is nearly
constant but in the upper layer the temperature increases rapidly because of sunlight absorption by the ozone layer. The ozone-
layer is the part of the stratosphere from 19 kilometers up to 48 kilometers where the concentration of ozone reaches up to 10
parts per million. 21 The troposphere is the layer from the ground up to 11 kilometers near the poles and up to 16 kilometers in equatorial regions
(i.e., the lowest layer of the atmosphere where people live). It contains roughly 80 percent of the mass of all gases in the
atmosphere and is the site for most weather processes, including most of the water vapor and clouds. 22 Article 5 of the Montreal Protocol covers several groups of countries, especially developing countries, with low consumption
rates of ozone depleting substances. Developing countries with per capita consumption of less than 0.3 kg of certain ozone
depleting substances (weighted by their ozone depleting potential) receive financial assistance and a grace period of ten
additional years in the phase-out of ozone depleting substances.
Introduction 1-7
their contribution to overall radiative forcing will increase (IPCC 2013). An amendment to the Montreal Protocol
was adopted in 2016 which includes obligations for Parties to phase down the production and consumption of HFCs.
Perfluorocarbons, SF6, and NF3 are predominantly emitted from various industrial processes including aluminum
smelting, semiconductor manufacturing, electric power transmission and distribution, and magnesium casting.
Currently, the radiative forcing impact of PFCs, SF6, and NF3 is also small, but they have a significant growth rate,
extremely long atmospheric lifetimes, and are strong absorbers of infrared radiation, and therefore have the potential
to influence climate far into the future (IPCC 2013).
Carbon Monoxide (CO). Carbon monoxide has an indirect radiative forcing effect by elevating concentrations of
CH4 and tropospheric ozone through chemical reactions with other atmospheric constituents (e.g., the hydroxyl
radical, OH) that would otherwise assist in destroying CH4 and tropospheric ozone. Carbon monoxide is created
when carbon-containing fuels are burned incompletely. Through natural processes in the atmosphere, it is eventually
oxidized to CO2. Carbon monoxide concentrations are both short-lived in the atmosphere and spatially variable.
Nitrogen Oxides (NOx). The primary climate change effects of nitrogen oxides (i.e., NO and NO2) are indirect.
Warming effects can occur due to reactions leading to the formation of ozone in the troposphere, but cooling effects
can occur due to the role of NOx as a precursor to nitrate particles (i.e., aerosols) and due to destruction of
stratospheric ozone when emitted from very high altitude aircraft.23 Additionally, NOx emissions are also likely to
decrease CH4 concentrations, thus having a negative radiative forcing effect (IPCC 2013). Nitrogen oxides are
created from lightning, soil microbial activity, biomass burning (both natural and anthropogenic fires) fuel
combustion, and, in the stratosphere, from the photo-degradation of N2O. Concentrations of NOx are both relatively
short-lived in the atmosphere and spatially variable.
Non-methane Volatile Organic Compounds (NMVOCs). Non-methane volatile organic compounds include
substances such as propane, butane, and ethane. These compounds participate, along with NOx, in the formation of
tropospheric ozone and other photochemical oxidants. NMVOCs are emitted primarily from transportation and
industrial processes, as well as biomass burning and non-industrial consumption of organic solvents. Concentrations
of NMVOCs tend to be both short-lived in the atmosphere and spatially variable.
Aerosols. Aerosols are extremely small particles or liquid droplets found in the atmosphere that are either directly
emitted into or are created through chemical reactions in the Earth’s atmosphere. Aerosols or their chemical
precursors can be emitted by natural events such as dust storms, biogenic or volcanic activity, or by anthropogenic
processes such as transportation, coal combustion, cement manufacturing, waste incineration, or biomass burning.
Various categories of aerosols exist from both natural and anthropogenic sources, such as soil dust, sea salt, biogenic
aerosols, sulfates, nitrates, volcanic aerosols, industrial dust, and carbonaceous24 aerosols (e.g., black carbon,
organic carbon). Aerosols can be removed from the atmosphere relatively rapidly by precipitation or through more
complex processes under dry conditions.
Aerosols affect radiative forcing differently than greenhouse gases. Their radiative effects occur through direct and
indirect mechanisms: directly by scattering and absorbing solar radiation (and to a lesser extent scattering,
absorption, and emission of terrestrial radiation); and indirectly by increasing cloud droplets and ice crystals that
modify the formation, precipitation efficiency, and radiative properties of clouds (IPCC 2013). Despite advances in
understanding of cloud-aerosol interactions, the contribution of aerosols to radiative forcing are difficult to quantify
because aerosols generally have short atmospheric lifetimes, and have number concentrations, size distributions, and
compositions that vary regionally, spatially, and temporally (IPCC 2013).
The net effect of aerosols on the Earth’s radiative forcing is believed to be negative (i.e., net cooling effect on the
climate). In fact, “despite the large uncertainty ranges on aerosol forcing, there is high confidence that aerosols have
offset a substantial portion of GHG forcing” (IPCC 2013).25 Although because they remain in the atmosphere for
23 NOx emissions injected higher in the stratosphere, primarily from fuel combustion emissions from high altitude supersonic
aircraft, can lead to stratospheric ozone depletion. 24 Carbonaceous aerosols are aerosols that are comprised mainly of organic substances and forms of black carbon (or soot)
(IPCC 2013). 25 The IPCC (2013) defines high confidence as an indication of strong scientific evidence and agreement in this statement.
1-8 Inventory of U.S. Greenhouse Gas Emissions and Sinks: 1990–2015
only days to weeks, their concentrations respond rapidly to changes in emissions.26 Not all aerosols have a cooling
effect. Current research suggests that another constituent of aerosols, black carbon, has a positive radiative forcing
by heating the Earth’s atmosphere and causing surface warming when deposited on ice and snow (IPCC 2013).
Black carbon also influences cloud development, but the direction and magnitude of this forcing is an area of active
research.
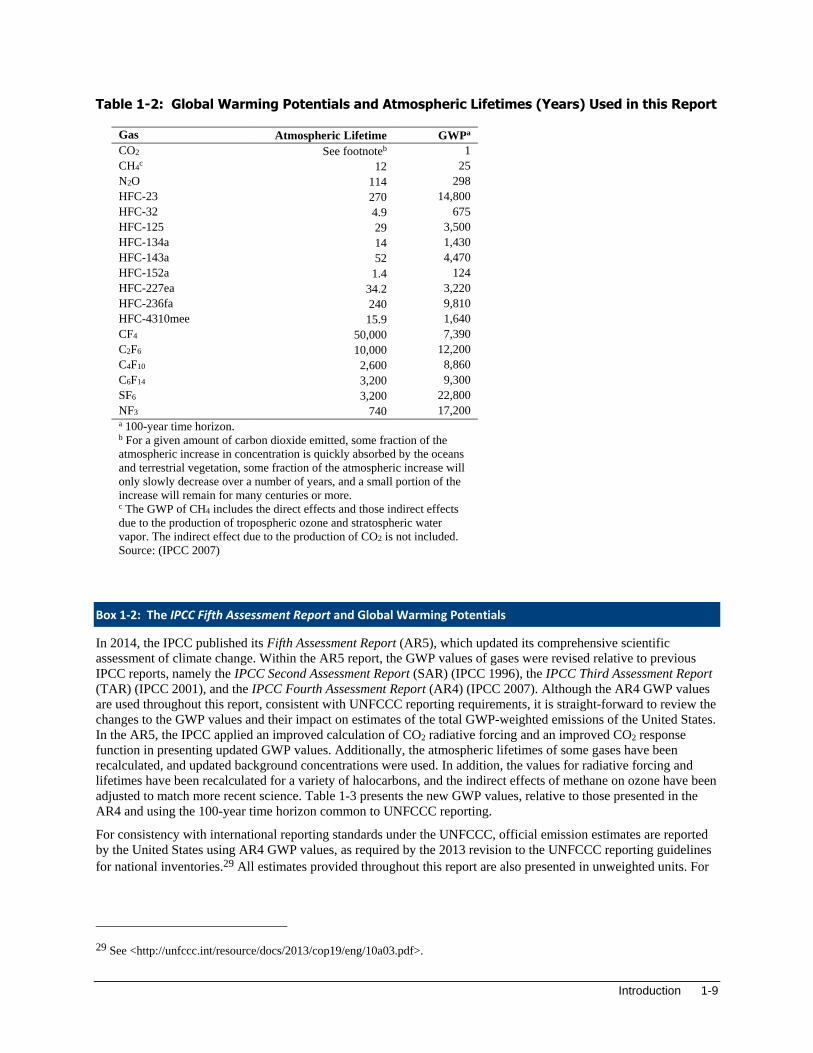
Global Warming Potentials A global warming potential is a quantified measure of the globally averaged relative radiative forcing impacts of a
particular greenhouse gas (see Table 1-2). It is defined as the accumulated radiative forcing within a specific time
horizon caused by emitting 1 kilogram (kg) of the gas, relative to that of the reference gas CO2 (IPCC 2014). Direct
radiative effects occur when the gas itself absorbs radiation. Indirect radiative forcing occurs when chemical
transformations involving the original gas produce a gas or gases that are greenhouse gases, or when a gas
influences other radiatively important processes such as the atmospheric lifetimes of other gases. The reference gas
used is CO2, and therefore GWP-weighted emissions are measured in million metric tons of CO2 equivalent (MMT
CO2 Eq.).27 The relationship between kilotons (kt) of a gas and MMT CO2 Eq. can be expressed as follows:
𝑀𝑀𝑇 𝐶𝑂2 𝐸𝑞. = (𝑘𝑡 𝑜𝑓 𝑔𝑎𝑠)×(𝐺𝑊𝑃)× (𝑀𝑀𝑇
1,000 𝑘𝑡)
where,
MMT CO2 Eq. = Million metric tons of CO2 equivalent
kt = kilotons (equivalent to a thousand metric tons)
GWP = Global warming potential
MMT = Million metric tons
GWP values allow for a comparison of the impacts of emissions and reductions of different gases. According to the
IPCC, GWPs typically have an uncertainty of ±35 percent. Parties to the UNFCCC have also agreed to use GWPs
based upon a 100-year time horizon, although other time horizon values are available.
…the global warming potential values used by Parties included in Annex I to the Convention (Annex I
Parties) to calculate the carbon dioxide equivalence of anthropogenic emissions by sources and removals
by sinks of greenhouse gases shall be those listed in the column entitled “Global warming potential for
given time horizon” in table 2.14 of the errata to the contribution of Working Group I to the Fourth
Assessment Report of the Intergovernmental Panel on Climate Change, based on the effects of greenhouse
gases over a 100-year time horizon...28
Greenhouse gases with relatively long atmospheric lifetimes (e.g., CO2, CH4, N2O, HFCs, PFCs, SF6, NF3) tend to
be evenly distributed throughout the atmosphere, and consequently global average concentrations can be
determined. The short-lived gases such as water vapor, carbon monoxide, tropospheric ozone, ozone precursors
(e.g., NOx, and NMVOCs), and tropospheric aerosols (e.g., SO2 products and carbonaceous particles), however,
vary regionally, and consequently it is difficult to quantify their global radiative forcing impacts. Parties to the
UNFCCC have not agreed upon GWP values for these gases that are short-lived and spatially inhomogeneous in the
atmosphere.
26 Volcanic activity can inject significant quantities of aerosol producing sulfur dioxide and other sulfur compounds into the
stratosphere, which can result in a longer negative forcing effect (i.e., a few years) (IPCC 2013). 27 Carbon comprises 12/44ths of carbon dioxide by weight. 28 Framework Convention on Climate Change; Available online at: <http://unfccc.int/resource/docs/2013/cop19/eng/10a03.pdf>;
31 January 2014; Report of the Conference of the Parties at its nineteenth session; held in Warsaw from 11 to 23 November
2013; Addendum; Part two: Action taken by the Conference of the Parties at its nineteenth session; Decision 24/CP.19; Revision
of the UNFCCC reporting guidelines on annual inventories for Parties included in Annex I to the Convention; p. 2. (UNFCCC
2014).
Introduction 1-9
Table 1-2: Global Warming Potentials and Atmospheric Lifetimes (Years) Used in this Report
Gas Atmospheric Lifetime GWPa
CO2 See footnoteb 1
CH4c 12 25
N2O 114 298
HFC-23 270 14,800
HFC-32 4.9 675
HFC-125 29 3,500
HFC-134a 14 1,430
HFC-143a 52 4,470
HFC-152a 1.4 124
HFC-227ea 34.2 3,220
HFC-236fa 240 9,810
HFC-4310mee 15.9 1,640
CF4 50,000 7,390
C2F6 10,000 12,200
C4F10 2,600 8,860
C6F14 3,200 9,300
SF6 3,200 22,800
NF3 740 17,200
a 100-year time horizon. b For a given amount of carbon dioxide emitted, some fraction of the
atmospheric increase in concentration is quickly absorbed by the oceans
and terrestrial vegetation, some fraction of the atmospheric increase will
only slowly decrease over a number of years, and a small portion of the
increase will remain for many centuries or more. c The GWP of CH4 includes the direct effects and those indirect effects
due to the production of tropospheric ozone and stratospheric water
vapor. The indirect effect due to the production of CO2 is not included.
Source: (IPCC 2007)
Box 1-2: The IPCC Fifth Assessment Report and Global Warming Potentials
In 2014, the IPCC published its Fifth Assessment Report (AR5), which updated its comprehensive scientific
assessment of climate change. Within the AR5 report, the GWP values of gases were revised relative to previous
IPCC reports, namely the IPCC Second Assessment Report (SAR) (IPCC 1996), the IPCC Third Assessment Report
(TAR) (IPCC 2001), and the IPCC Fourth Assessment Report (AR4) (IPCC 2007). Although the AR4 GWP values
are used throughout this report, consistent with UNFCCC reporting requirements, it is straight-forward to review the
changes to the GWP values and their impact on estimates of the total GWP-weighted emissions of the United States.
In the AR5, the IPCC applied an improved calculation of CO2 radiative forcing and an improved CO2 response
function in presenting updated GWP values. Additionally, the atmospheric lifetimes of some gases have been
recalculated, and updated background concentrations were used. In addition, the values for radiative forcing and
lifetimes have been recalculated for a variety of halocarbons, and the indirect effects of methane on ozone have been
adjusted to match more recent science. Table 1-3 presents the new GWP values, relative to those presented in the
AR4 and using the 100-year time horizon common to UNFCCC reporting.
For consistency with international reporting standards under the UNFCCC, official emission estimates are reported
by the United States using AR4 GWP values, as required by the 2013 revision to the UNFCCC reporting guidelines
for national inventories.29 All estimates provided throughout this report are also presented in unweighted units. For
29 See <http://unfccc.int/resource/docs/2013/cop19/eng/10a03.pdf>.
1-10 Inventory of U.S. Greenhouse Gas Emissions and Sinks: 1990–2015
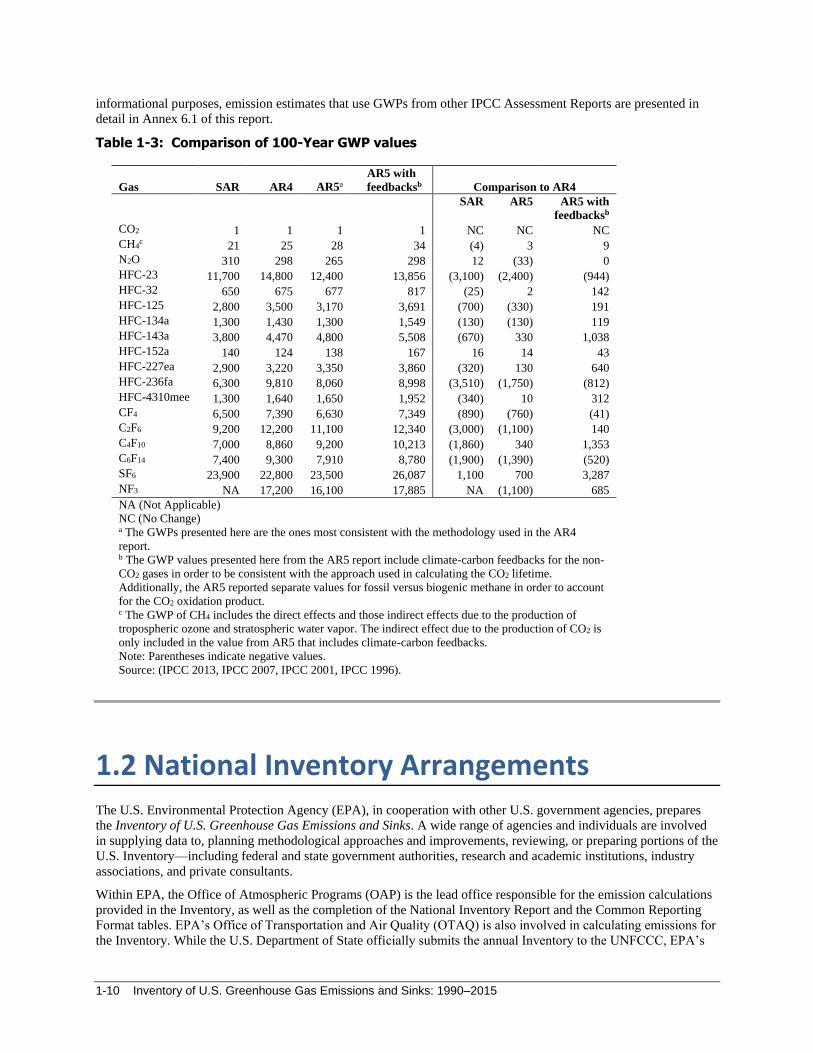
informational purposes, emission estimates that use GWPs from other IPCC Assessment Reports are presented in
detail in Annex 6.1 of this report.
Table 1-3: Comparison of 100-Year GWP values
Gas SAR AR4 AR5a
AR5 with
feedbacksb Comparison to AR4
SAR AR5 AR5 with
feedbacksb
CO2 1 1 1 1 NC NC NC
CH4c 21 25 28 34 (4) 3 9
N2O 310 298 265 298 12 (33) 0
HFC-23 11,700 14,800 12,400 13,856 (3,100) (2,400) (944)
HFC-32 650 675 677 817 (25) 2 142
HFC-125 2,800 3,500 3,170 3,691 (700) (330) 191
HFC-134a 1,300 1,430 1,300 1,549 (130) (130) 119
HFC-143a 3,800 4,470 4,800 5,508 (670) 330 1,038
HFC-152a 140 124 138 167 16 14 43
HFC-227ea 2,900 3,220 3,350 3,860 (320) 130 640
HFC-236fa 6,300 9,810 8,060 8,998 (3,510) (1,750) (812)
HFC-4310mee 1,300 1,640 1,650 1,952 (340) 10 312
CF4 6,500 7,390 6,630 7,349 (890) (760) (41)
C2F6 9,200 12,200 11,100 12,340 (3,000) (1,100) 140
C4F10 7,000 8,860 9,200 10,213 (1,860) 340 1,353
C6F14 7,400 9,300 7,910 8,780 (1,900) (1,390) (520)
SF6 23,900 22,800 23,500 26,087 1,100 700 3,287
NF3 NA 17,200 16,100 17,885 NA (1,100) 685
NA (Not Applicable)
NC (No Change) a The GWPs presented here are the ones most consistent with the methodology used in the AR4
report. b The GWP values presented here from the AR5 report include climate-carbon feedbacks for the non-
CO2 gases in order to be consistent with the approach used in calculating the CO2 lifetime.
Additionally, the AR5 reported separate values for fossil versus biogenic methane in order to account
for the CO2 oxidation product. c The GWP of CH4 includes the direct effects and those indirect effects due to the production of
tropospheric ozone and stratospheric water vapor. The indirect effect due to the production of CO2 is
only included in the value from AR5 that includes climate-carbon feedbacks.
Note: Parentheses indicate negative values.
Source: (IPCC 2013, IPCC 2007, IPCC 2001, IPCC 1996).
1.2 National Inventory Arrangements The U.S. Environmental Protection Agency (EPA), in cooperation with other U.S. government agencies, prepares
the Inventory of U.S. Greenhouse Gas Emissions and Sinks. A wide range of agencies and individuals are involved
in supplying data to, planning methodological approaches and improvements, reviewing, or preparing portions of the
U.S. Inventory—including federal and state government authorities, research and academic institutions, industry
associations, and private consultants.
Within EPA, the Office of Atmospheric Programs (OAP) is the lead office responsible for the emission calculations
provided in the Inventory, as well as the completion of the National Inventory Report and the Common Reporting
Format tables. EPA’s Office of Transportation and Air Quality (OTAQ) is also involved in calculating emissions for
the Inventory. While the U.S. Department of State officially submits the annual Inventory to the UNFCCC, EPA’s
Introduction 1-11
OAP serves as the Inventory focal point for technical questions and comments on the U.S. Inventory. The staff of
EPA coordinate the annual methodological choice, activity data collection, and emission calculations at the
individual source category level. EPA, the inventory coordinator, compiles the entire Inventory into the proper
reporting format for submission to the UNFCCC, and is responsible for the collection and consistency of cross-
cutting issues in the Inventory.
Several other government agencies contribute to the collection and analysis of the underlying activity data used in
the Inventory calculations. Formal and informal relationships exist between EPA and other U.S. agencies that
provide official data for use in the Inventory. The U.S. Department of Energy’s Energy Information Administration
provides national fuel consumption data and the U.S. Department of Defense provides military fuel consumption
and bunker fuels. Informal relationships also exist with other U.S. agencies to provide activity data for use in EPA’s
emission calculations. These include: the U.S. Department of Agriculture, National Oceanic and Atmospheric
Administration, the U.S. Geological Survey, the Federal Highway Administration, the Department of
Transportation, the Bureau of Transportation Statistics, the Department of Commerce, the National Agricultural
Statistics Service, and the Federal Aviation Administration. Academic and research centers also provide activity
data and calculations to EPA, as well as individual companies participating in voluntary outreach efforts with EPA.
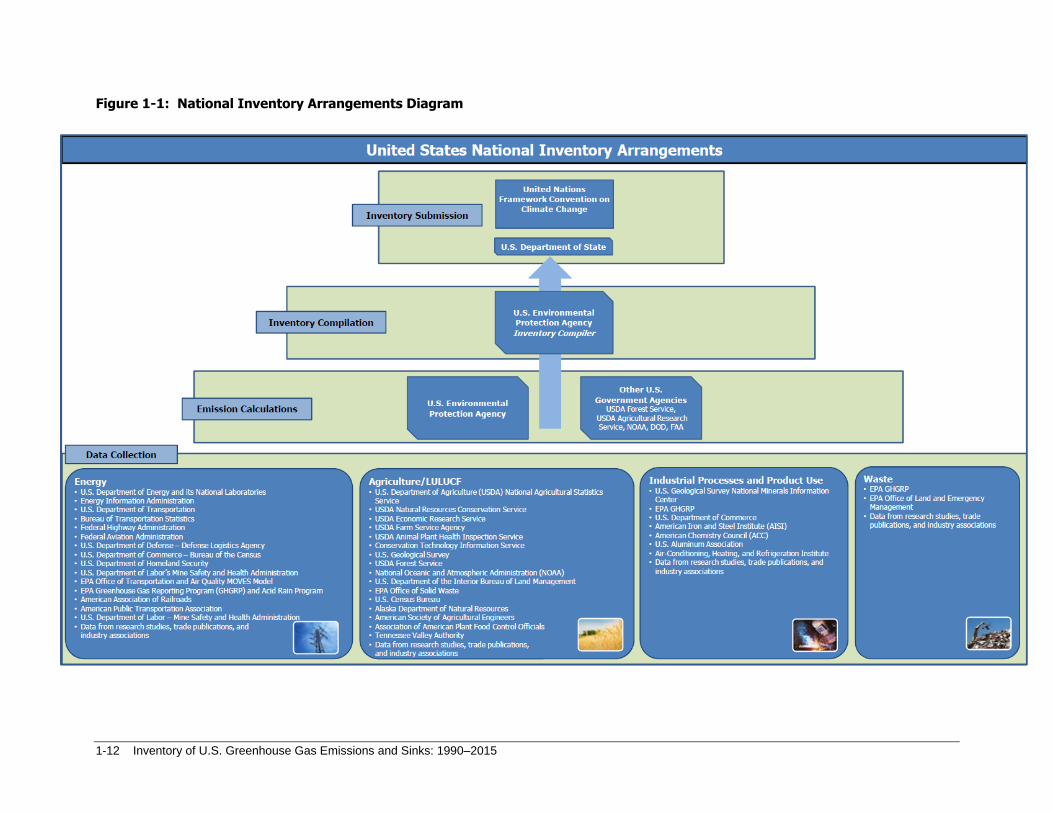
Finally, the U.S. Department of State officially submits the Inventory to the UNFCCC each April. Figure 1-1
diagrams the National Inventory Arrangements.
1-12 Inventory of U.S. Greenhouse Gas Emissions and Sinks: 1990–2015
Figure 1-1: National Inventory Arrangements Diagram
Introduction 1-13
1.3 Inventory Process This section describes EPA’s approach to preparing the annual U.S. Inventory, which consists of a National
Inventory Report (NIR) and Common Reporting Format (CRF) tables. The inventory coordinator at EPA is
responsible for compiling all emission estimates and ensuring consistency and quality throughout the NIR and CRF
tables. Emission calculations for individual sources are the responsibility of individual source leads, who are most
familiar with each source category and the unique characteristics of its emissions profile. The individual source
leads determine the most appropriate methodology and collect the best activity data to use in the emission
calculations, based upon their expertise in the source category, as well as coordinating with researchers and
contractors familiar with the sources. A multi-stage process for collecting information from the individual source
leads and producing the Inventory is undertaken annually to compile all information and data.
Methodology Development, Data Collection, and Emissions and Sink Estimation Source leads at EPA collect input data and, as necessary, evaluate or develop the estimation methodology for the
individual source categories. Because EPA has been preparing the Inventory for many years, for most source
categories, the methodology for the previous year is applied to the new “current” year of the Inventory, and
inventory analysts collect any new data or update data that have changed from the previous year. If estimates for a
new source category are being developed for the first time, or if the methodology is changing for an existing source
category (e.g., the United States is implementing a higher Tiered approach for that source category), then the source
category lead will develop a new methodology, gather the most appropriate activity data and emission factors (or in
some cases direct emission measurements) for the entire time series, and conduct a special source-specific review
process involving relevant experts from industry, government, and universities.
Once the methodology is in place and the data are collected, the individual source leads calculate emissions and sink
estimates. The source leads then update or create the relevant text and accompanying annexes for the Inventory.
Source leads are also responsible for completing the relevant sectoral background tables of the CRF, conducting
quality assurance and quality control (QA/QC) checks, and uncertainty analyses.
The treatment of confidential business information (CBI) in the Inventory is based on EPA internal guidelines, as
well as regulations1 applicable to the data used. EPA has specific procedures in place to safeguard CBI during the
inventory compilation process. When information derived from CBI data is used for development of inventory
calculations, EPA procedures ensure that these confidential data are sufficiently aggregated to protect confidentiality
while still providing useful information for analysis. For example, within the Energy and Industrial Process and
Product Use (IPPU) sectors, EPA has used aggregated facility-level data from the Greenhous Gas Reporting
Program (GHGRP) to develop, inform, and/or quality-assure U.S. emissions estimates. In 2014, the EPA’s GHGRP,
with industry engagement, compiled criteria that would be used for aggregating its confidential data to shield the
underlying CBI from public disclosure.2 In the Inventory, EPA is publishing only data values that meet the GHGRP
aggregation criteria.3 Specific uses of aggregated facility-level data are described in the respective methodological
sections within those chapters. In addition, EPA also uses historical data reported voluntarily to EPA via various
1 40 CFR part 2, Subpart B titled “Confidentiality of Business Information” which is the regulation establishing rules governing
handling of data entitled to confidentiality treatment. See <https://www.ecfr.gov/cgi-bin/text-
idx?SID=a764235c9eadf9afe05fe04c07a28939&mc=true&node=sp40.1.2.b&rgn=div6>. 2 Federal Register Notice on “Greenhouse Gas Reporting Program: Publication of Aggregated Greenhouse Gas Data.” See pp, 79
and 110 of notice at <https://www.gpo.gov/fdsys/pkg/FR-2014-06-09/pdf/2014-13425.pdf>. 3 U.S. EPA Greenhouse Gas Reporting Program. Developments on Publication of Aggregated Greenhouse Gas Data, November
25, 2014. See <http://www.epa.gov/ghgreporting/confidential-business-information-ghg-reporting>.
1-14 Inventory of U.S. Greenhouse Gas Emissions and Sinks: 1990–2015
voluntary initiatives with U.S. industry (e.g., EPA Voluntary Aluminum Industrial Partnership (VAIP)) and follows
guidelines established under the voluntary programs for managing confidential business information.
Summary Data Compilation and Storage The inventory coordinator at EPA collects the source categories’ descriptive text and Annexes, and also aggregates
the emission estimates into a summary spreadsheet that links the individual source category spreadsheets together.
This summary sheet contains all of the essential data in one central location, in formats commonly used in the
Inventory document. In addition to the data from each source category, national trend and related data are also
gathered in the summary sheet for use in the Executive Summary, Introduction, and Recent Trends sections of the
Inventory report. Electronic copies of each year’s summary spreadsheet, which contains all the emission and sink
estimates for the United States, are kept on a central server at EPA under the jurisdiction of the inventory
coordinator.
National Inventory Report Preparation The NIR is compiled from the sections developed by each individual source lead. In addition, the inventory
coordinator prepares a brief overview of each chapter that summarizes the emissions from all sources discussed in
the chapters. The inventory coordinator then carries out a key category analysis for the Inventory, consistent with the
2006 IPCC Guidelines for National Greenhouse Gas Inventories, and in accordance with the reporting requirements
of the UNFCCC. Also at this time, the Introduction, Executive Summary, and Recent Trends sections are drafted, to
reflect the trends for the most recent year of the current Inventory. The analysis of trends necessitates gathering
supplemental data, including weather and temperature conditions, economic activity and gross domestic product,
population, atmospheric conditions, and the annual consumption of electricity, energy, and fossil fuels. Changes in
these data are used to explain the trends observed in greenhouse gas emissions in the United States. Furthermore,
specific factors that affect individual sectors are researched and discussed. Many of the factors that affect emissions
are included in the Inventory document as separate analyses or side discussions in boxes within the text. Text boxes
are also created to examine the data aggregated in different ways than in the remainder of the document, such as a
focus on transportation activities or emissions from electricity generation. The document is prepared to match the
specification of the UNFCCC reporting guidelines for National Inventory Reports.
Common Reporting Format Table Compilation The CRF tables are compiled from individual tables completed by each individual source lead, which contain source
emissions and activity data. The inventory coordinator integrates the source data into the UNFCCC’s “CRF
Reporter” for the United States, assuring consistency across all sectoral tables. The summary reports for emissions,
methods, and emission factors used, the overview tables for completeness and quality of estimates, the recalculation
tables, the notation key completion tables, and the emission trends tables are then completed by the inventory
coordinator. Internal automated quality checks on the CRF Reporter, as well as reviews by the source leads, are
completed for the entire time series of CRF tables before submission.
QA/QC and Uncertainty QA/QC and uncertainty analyses are supervised by the QA/QC and uncertainty coordinators, who have general
oversight over the implementation of the QA/QC plan and the overall uncertainty analysis for the Inventory (see
sections on QA/QC and Uncertainty, below). These coordinators work closely with the source leads to ensure that a
consistent QA/QC plan and uncertainty analysis is implemented across all inventory sources. The inventory QA/QC
plan, detailed in a following section, is consistent with the quality assurance procedures outlined by EPA and IPCC.
The QA/QC and uncertainty findings also inform overall improvement planning, and specific improvements are
noted in the Planned Improvements sections of respective categories.
Introduction 1-15
Expert, Public, and UNFCCC Review Periods During the 30-day Expert Review period, a first draft of the document is sent to a select list of technical experts
outside of EPA who are not directly involved in preparing estimates. The purpose of the Expert Review is to
encourage feedback on the methodological and data sources used in the current Inventory, especially for sources
which have experienced any changes since the previous Inventory.
Once comments are received and addressed, a second draft of the document is released for public review by
publishing a notice in the U.S. Federal Register and posting the document on the EPA Web site. The Public Review
period allows for a 30-day comment period and is open to the entire U.S. public. Comments may require further
discussion with experts and/or additional research, and specific Inventory improvements requiring further analysis
as a result of comments are noted in categories Planned Improvement sections. See those sections for specific
details. EPA publishes comments received with publication of the report on its website.
Following completion and submission of the report to the UNFCCC, the report also undergoes review by an
independent international team of experts for adherence to UNFCCC reporting guidelines and IPCC Guidance.4
Feedback from these review processes all contribute to improving inventory quality over time.
Final Submittal to UNFCCC and Document Printing After the final revisions to incorporate any comments from the Expert Review and Public Review periods, EPA
prepares the final National Inventory Report and the accompanying Common Reporting Format Reporter database.
The U.S. Department of State sends the official submission of the U.S. Inventory to the UNFCCC. The document is
then formatted and posted online, available for the public.5
1.4 Methodology and Data Sources Emissions of greenhouse gases from various source and sink categories have been estimated using methodologies
that are consistent with the 2006 IPCC Guidelines for National Greenhouse Gas Inventories (IPCC 2006). To a
great extent, this report makes use of published official economic and physical statistics for activity data and
emission factors. Depending on the emission source category, activity data can include fuel consumption or
deliveries, vehicle-miles traveled, raw material processed, etc. Emission factors are factors that relate quantities of
emissions to an activity. For more information on data sources see Section 1.2 above, Box 1-1 on use of GHGRP
data, and categories’ methodology sections for more information on data sources. In addition to official statistics, the
report utilizes findings from academic studies, trade association surveys and statistical reports, along with expert
judgement, consistent with 2006 IPCC Guidelines.
The IPCC methodologies provided in the 2006 IPCC Guidelines represent foundational methodologies for a variety
of source categories, and many of these methodologies continue to be improved and refined as new research and
data become available. This report uses the IPCC methodologies when applicable, and supplements them with other
available country-specific methodologies and data where possible. Choices made regarding the methodologies and
data sources used are provided in conjunction with the discussion of each source category in the main body of the
report. Complete documentation is provided in the annexes on the detailed methodologies and data sources utilized
in the calculation of each source category.
Box 1-3: IPCC Reference Approach
The UNFCCC reporting guidelines require countries to complete a "top-down" reference approach for estimating
CO2 emissions from fossil fuel combustion in addition to their “bottom-up” sectoral methodology. This estimation
method uses alternative methodologies and different data sources than those contained in that section of the Energy
4 See <http://unfccc.int/national_reports/annex_i_ghg_inventories/review_process/items/2762.php>. 5 See <http://epa.gov/climatechange/ghgemissions/usinventoryreport.html>.
1-16 Inventory of U.S. Greenhouse Gas Emissions and Sinks: 1990–2015
chapter. The reference approach estimates fossil fuel consumption by adjusting national aggregate fuel production
data for imports, exports, and stock changes rather than relying on end-user consumption surveys (see Annex 4 of
this report). The reference approach assumes that once carbon-based fuels are brought into a national economy, they
are either saved in some way (e.g., stored in products, kept in fuel stocks, or left unoxidized in ash) or combusted,
and therefore the carbon in them is oxidized and released into the atmosphere. Accounting for actual consumption of
fuels at the sectoral or sub-national level is not required.
1.5 Key Categories The 2006 IPCC Guidelines (IPCC 2006) defines a key category as a “[category] that is prioritized within the
national inventory system because its estimate has a significant influence on a country’s total inventory of
greenhouse gases in terms of the absolute level, the trend, or the uncertainty in emissions and removals.”6 By
definition, key categories include those categories that have the greatest contribution to the absolute level of national
emissions. In addition, when an entire time series of emission and removal estimates is prepared, a thorough
investigation of key categories must also account for the influence of trends and uncertainties of individual source
and sink categories. This analysis can identify source and sink categories that diverge from the overall trend in
national emissions. Finally, a qualitative evaluation of key categories is performed to capture any categories that
were not identified in any of the quantitative analyses.
Approach 1, as defined in the 2006 IPCC Guidelines (IPCC 2006), was implemented to identify the key categories
for the United States. This analysis was performed twice; one analysis included sources and sinks from the Land
Use, Land-Use Change, and Forestry (LULUCF) sector, the other analysis did not include the LULUCF categories.
Following Approach 1, Approach 2, as defined in the 2006 IPCC Guidelines (IPCC 2006), was then implemented to
identify any additional key categories not already identified in Approach 1 assessment. This analysis, which includes
each source category’s uncertainty assessments (or proxies) in its calculations, was also performed twice to include
or exclude LULUCF categories.
In addition to conducting Approach 1 and 2 level and trend assessments, a qualitative assessment of the source
categories, as described in the 2006 IPCC Guidelines (IPCC 2006), was conducted to capture any key categories that
were not identified by either quantitative method. For this inventory, no additional categories were identified using
criteria recommend by IPCC, but EPA continues to update its qualitative assessment on an annual basis.
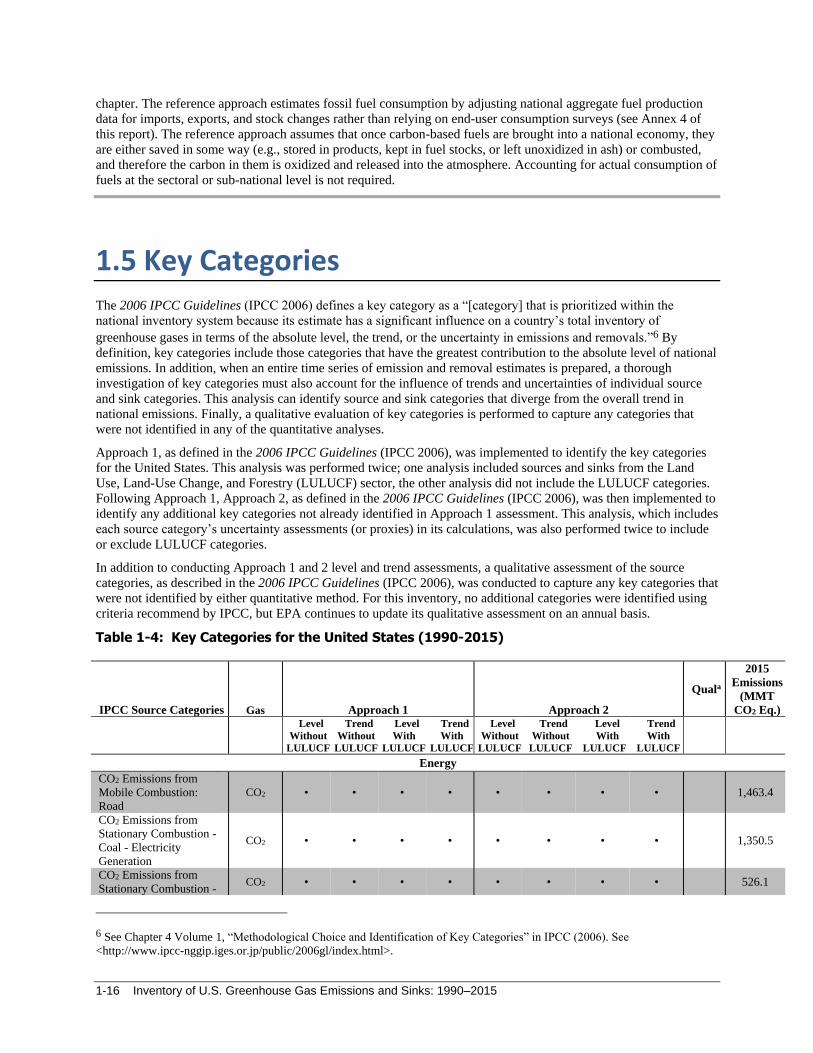
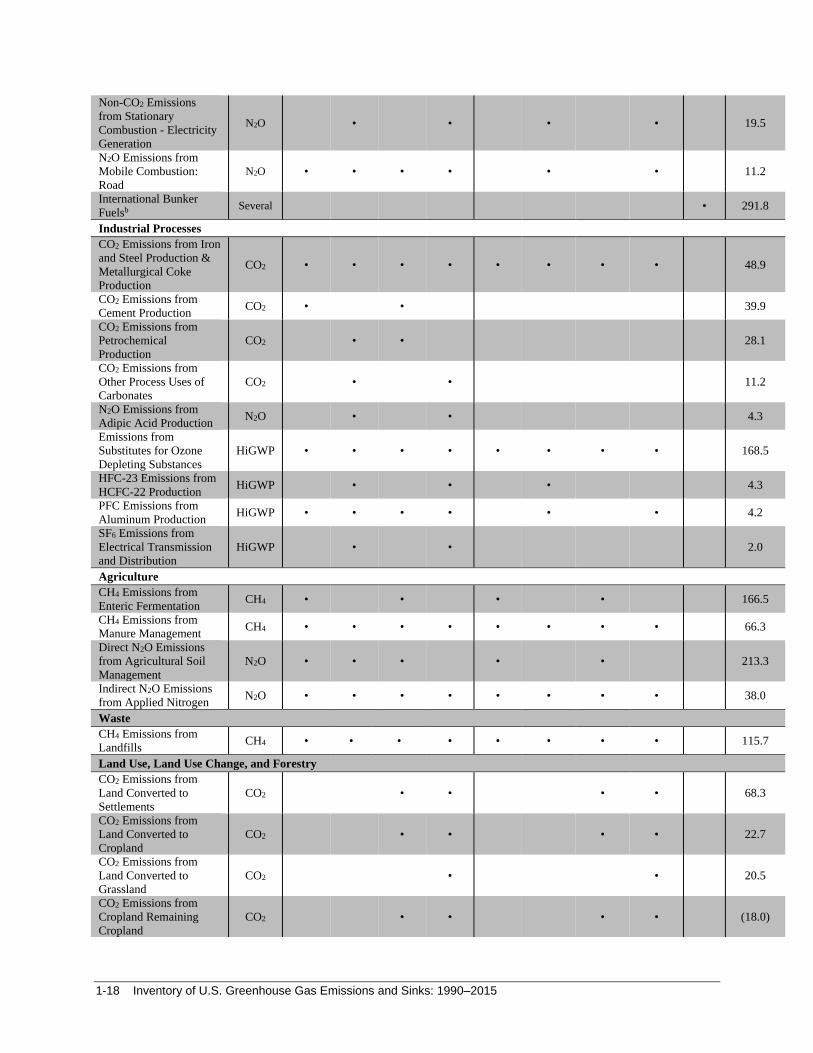
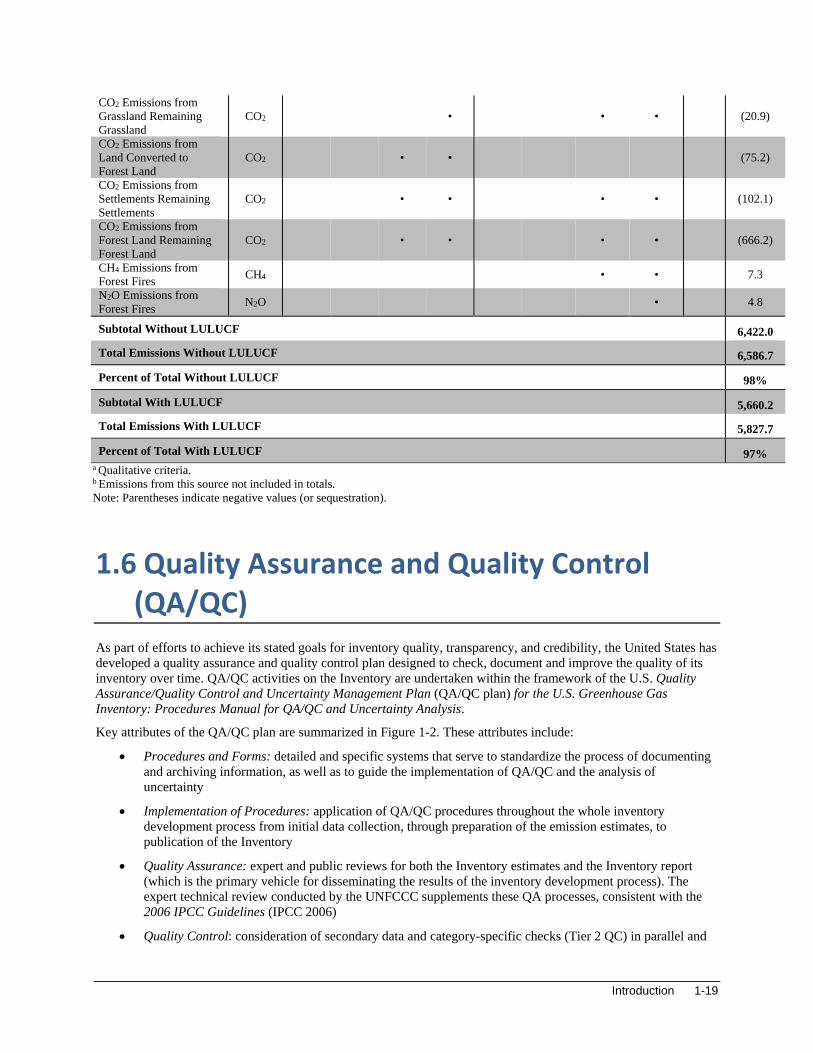
Table 1-4: Key Categories for the United States (1990-2015)
6 See Chapter 4 Volume 1, “Methodological Choice and Identification of Key Categories” in IPCC (2006). See
<http://www.ipcc-nggip.iges.or.jp/public/2006gl/index.html>.
IPCC Source Categories Gas Approach 1 Approach 2
Quala
2015
Emissions
(MMT
CO2 Eq.)
Level
Without
LULUCF
Trend
Without
LULUCF
Level
With
LULUCF
Trend
With
LULUCF
Level
Without
LULUCF
Trend
Without
LULUCF
Level
With
LULUCF
Trend
With
LULUCF
Energy
CO2 Emissions from
Mobile Combustion:
Road
CO2 • • • • • • • • 1,463.4
CO2 Emissions from
Stationary Combustion -
Coal - Electricity
Generation
CO2 • • • • • • • • 1,350.5
CO2 Emissions from
Stationary Combustion - CO2 • • • • • • • • 526.1
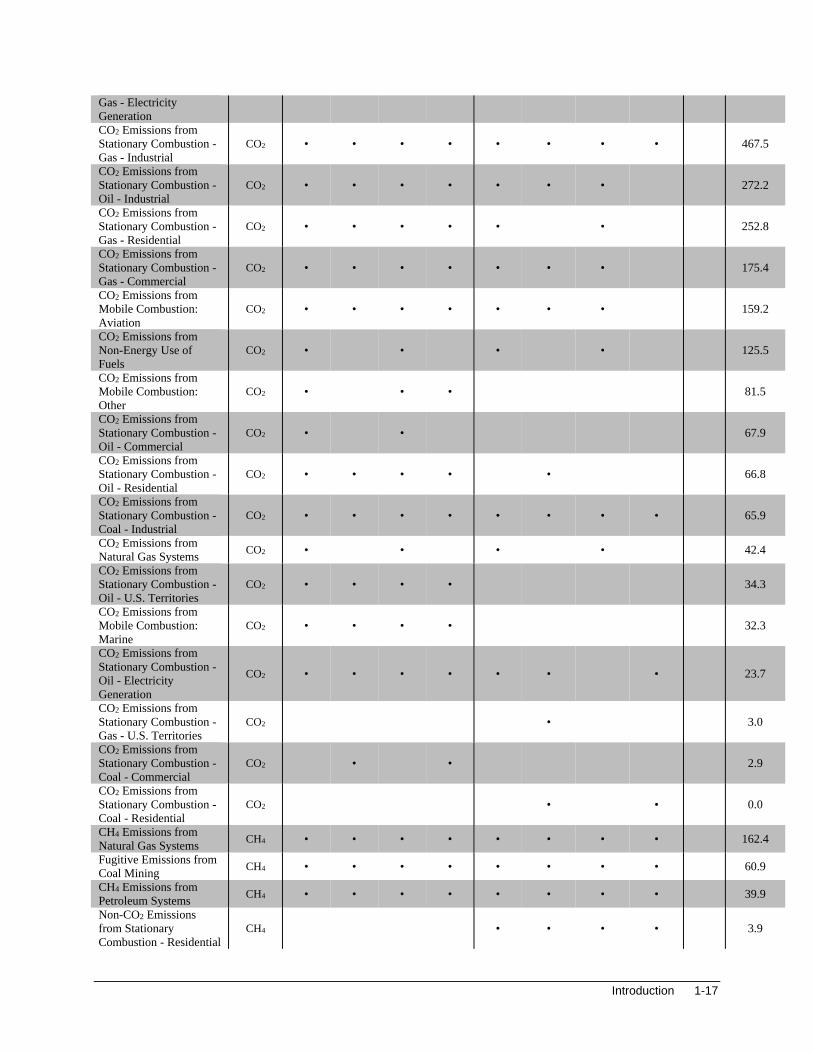
Introduction 1-17
Gas - Electricity
Generation
CO2 Emissions from
Stationary Combustion -
Gas - Industrial
CO2 • • • • • • • • 467.5
CO2 Emissions from
Stationary Combustion -
Oil - Industrial
CO2 • • • • • • • 272.2
CO2 Emissions from
Stationary Combustion -
Gas - Residential
CO2 • • • • • • 252.8
CO2 Emissions from
Stationary Combustion -
Gas - Commercial
CO2 • • • • • • • 175.4
CO2 Emissions from
Mobile Combustion:
Aviation
CO2 • • • • • • • 159.2
CO2 Emissions from
Non-Energy Use of
Fuels
CO2 • • • • 125.5
CO2 Emissions from
Mobile Combustion:
Other
CO2 • • • 81.5
CO2 Emissions from
Stationary Combustion -
Oil - Commercial
CO2 • • 67.9
CO2 Emissions from
Stationary Combustion -
Oil - Residential
CO2 • • • • • 66.8
CO2 Emissions from
Stationary Combustion -
Coal - Industrial
CO2 • • • • • • • • 65.9
CO2 Emissions from
Natural Gas Systems CO2 • • • • 42.4
CO2 Emissions from
Stationary Combustion -
Oil - U.S. Territories
CO2 • • • • 34.3
CO2 Emissions from
Mobile Combustion:
Marine
CO2 • • • • 32.3
CO2 Emissions from
Stationary Combustion -
Oil - Electricity
Generation
CO2 • • • • • • • 23.7
CO2 Emissions from
Stationary Combustion -
Gas - U.S. Territories
CO2 • 3.0
CO2 Emissions from
Stationary Combustion -
Coal - Commercial
CO2 • • 2.9
CO2 Emissions from
Stationary Combustion -
Coal - Residential
CO2 • • 0.0
CH4 Emissions from
Natural Gas Systems CH4 • • • • • • • • 162.4
Fugitive Emissions from
Coal Mining CH4 • • • • • • • • 60.9
CH4 Emissions from
Petroleum Systems CH4 • • • • • • • • 39.9
Non-CO2 Emissions
from Stationary
Combustion - Residential
CH4 • • • • 3.9
1-18 Inventory of U.S. Greenhouse Gas Emissions and Sinks: 1990–2015
Non-CO2 Emissions
from Stationary
Combustion - Electricity
Generation
N2O • • • • 19.5
N2O Emissions from
Mobile Combustion:
Road
N2O • • • • • • 11.2
International Bunker
Fuelsb Several • 291.8
Industrial Processes
CO2 Emissions from Iron
and Steel Production &
Metallurgical Coke
Production
CO2 • • • • • • • • 48.9
CO2 Emissions from
Cement Production CO2 • • 39.9
CO2 Emissions from
Petrochemical
Production
CO2 • • 28.1
CO2 Emissions from
Other Process Uses of
Carbonates
CO2 • • 11.2
N2O Emissions from
Adipic Acid Production N2O • • 4.3
Emissions from
Substitutes for Ozone
Depleting Substances
HiGWP • • • • • • • • 168.5
HFC-23 Emissions from
HCFC-22 Production HiGWP • • • 4.3
PFC Emissions from
Aluminum Production HiGWP • • • • • • 4.2
SF6 Emissions from
Electrical Transmission
and Distribution
HiGWP • • 2.0
Agriculture
CH4 Emissions from
Enteric Fermentation CH4 • • • • 166.5
CH4 Emissions from
Manure Management CH4 • • • • • • • • 66.3
Direct N2O Emissions
from Agricultural Soil
Management
N2O • • • • • 213.3
Indirect N2O Emissions
from Applied Nitrogen N2O • • • • • • • • 38.0
Waste
CH4 Emissions from
Landfills CH4 • • • • • • • • 115.7
Land Use, Land Use Change, and Forestry
CO2 Emissions from
Land Converted to
Settlements
CO2 • • • • 68.3
CO2 Emissions from
Land Converted to
Cropland
CO2 • • • • 22.7
CO2 Emissions from
Land Converted to
Grassland
CO2 • • 20.5
CO2 Emissions from
Cropland Remaining
Cropland
CO2 • • • • (18.0)
Introduction 1-19
1.6 Quality Assurance and Quality Control (QA/QC)
As part of efforts to achieve its stated goals for inventory quality, transparency, and credibility, the United States has
developed a quality assurance and quality control plan designed to check, document and improve the quality of its
inventory over time. QA/QC activities on the Inventory are undertaken within the framework of the U.S. Quality
Assurance/Quality Control and Uncertainty Management Plan (QA/QC plan) for the U.S. Greenhouse Gas
Inventory: Procedures Manual for QA/QC and Uncertainty Analysis.
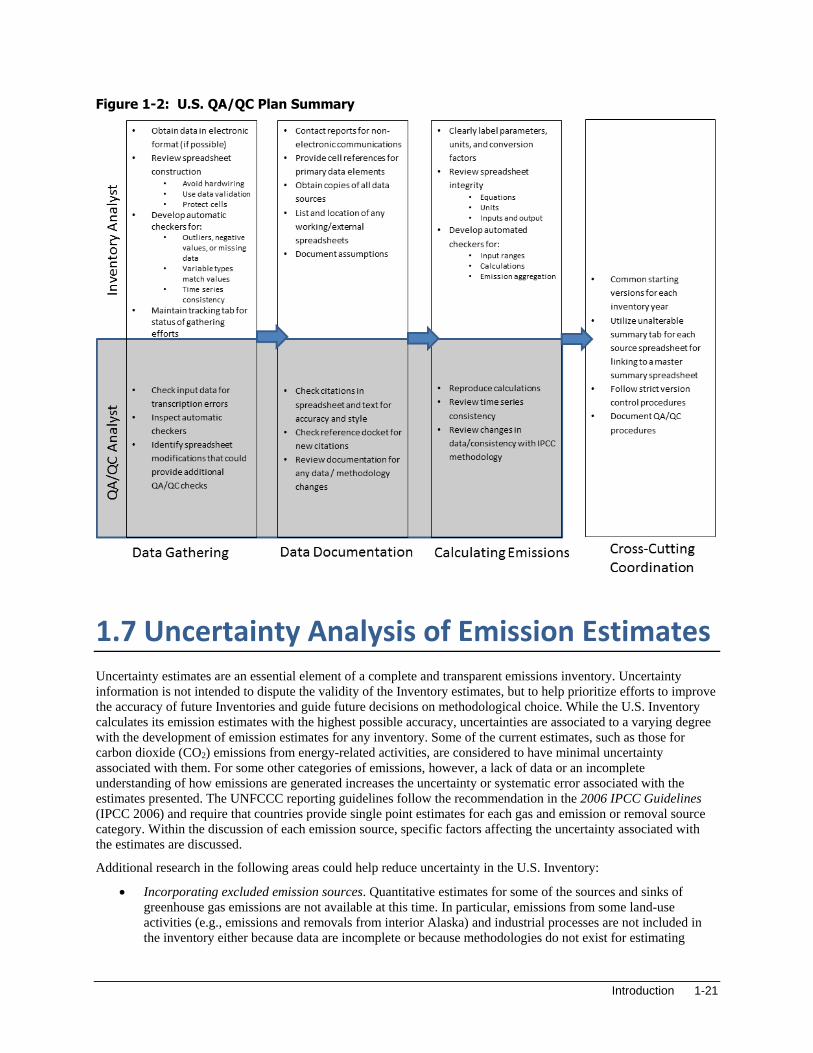
Key attributes of the QA/QC plan are summarized in Figure 1-2. These attributes include:
• Procedures and Forms: detailed and specific systems that serve to standardize the process of documenting
and archiving information, as well as to guide the implementation of QA/QC and the analysis of
uncertainty
• Implementation of Procedures: application of QA/QC procedures throughout the whole inventory
development process from initial data collection, through preparation of the emission estimates, to
publication of the Inventory
• Quality Assurance: expert and public reviews for both the Inventory estimates and the Inventory report
(which is the primary vehicle for disseminating the results of the inventory development process). The
expert technical review conducted by the UNFCCC supplements these QA processes, consistent with the
2006 IPCC Guidelines (IPCC 2006)
• Quality Control: consideration of secondary data and category-specific checks (Tier 2 QC) in parallel and
CO2 Emissions from
Grassland Remaining
Grassland
CO2 • • • (20.9)
CO2 Emissions from
Land Converted to
Forest Land
CO2 • • (75.2)
CO2 Emissions from
Settlements Remaining
Settlements
CO2 • • • • (102.1)
CO2 Emissions from
Forest Land Remaining
Forest Land
CO2 • • • • (666.2)
CH4 Emissions from
Forest Fires CH4 • • 7.3
N2O Emissions from
Forest Fires N2O • 4.8
Subtotal Without LULUCF 6,422.0
Total Emissions Without LULUCF 6,586.7
Percent of Total Without LULUCF 98%
Subtotal With LULUCF 5,660.2
Total Emissions With LULUCF 5,827.7
Percent of Total With LULUCF 97% a Qualitative criteria. b Emissions from this source not included in totals.
Note: Parentheses indicate negative values (or sequestration).
1-20 Inventory of U.S. Greenhouse Gas Emissions and Sinks: 1990–2015
coordination with the uncertainty assessment; the development of protocols and templates, which provides
for more structured communication and integration with the suppliers of secondary information
• General (Tier 1) and Category-specific (Tier 2) Checks: quality controls and checks, as recommended by
IPCC Good Practice Guidance and 2006 IPCC Guidelines (IPCC 2006)
• Record Keeping: provisions to track which procedures have been followed, the results of the QA/QC,
uncertainty analysis, and feedback mechanisms for corrective action based on the results of the
investigations which provide for continual data quality improvement and guided research efforts
• Multi-Year Implementation: a schedule for coordinating the application of QA/QC procedures across
multiple years, especially for category-specific QC
• Interaction and Coordination: promoting communication within the EPA, across Federal agencies and
departments, state government programs, and research institutions and consulting firms involved in
supplying data or preparing estimates for the Inventory. The QA/QC Management Plan itself is intended to
be revised and reflect new information that becomes available as the program develops, methods are
improved, or additional supporting documents become necessary.
In addition, based on the national QA/QC plan for the Inventory, source-specific QA/QC plans have been developed
for a number of sources. These plans follow the procedures outlined in the national QA/QC plan, tailoring the
procedures to the specific text and spreadsheets of the individual sources. For each greenhouse gas emissions source
or sink included in this Inventory, a minimum of a Tier 1 QA/QC analysis has been undertaken. Where QA/QC
activities for a particular source go beyond the minimum Tier 1 level, and include category-specific checks (Tier 2)
further explanation is provided within the respective source category text. Similarly, responses or updates based on
comments from the expert, public and the international technical expert reviews (e.g., UNFCCC) are also addressed
within the respective source category sections in each chapter.
The quality control activities described in the U.S. QA/QC plan occur throughout the inventory process; QA/QC is
not separate from, but is an integral part of, preparing the Inventory. Quality control—in the form of both good
practices (such as documentation procedures) and checks on whether good practices and procedures are being
followed—is applied at every stage of inventory development and document preparation. In addition, quality
assurance occurs during the expert review and the public review, in addition to the UNFCCC expert technical
review. While all phases significantly contribute to improving inventory quality, the public review phase is also
essential for promoting the openness of the inventory development process and the transparency of the inventory
data and methods.
The QA/QC plan guides the process of ensuring inventory quality by describing data and methodology checks,
developing processes governing peer review and public comments, and developing guidance on conducting an
analysis of the uncertainty surrounding the emission estimates. The QA/QC procedures also include feedback loops
and provide for corrective actions that are designed to improve the inventory estimates over time.
Introduction 1-21
Figure 1-2: U.S. QA/QC Plan Summary
1.7 Uncertainty Analysis of Emission Estimates Uncertainty estimates are an essential element of a complete and transparent emissions inventory. Uncertainty
information is not intended to dispute the validity of the Inventory estimates, but to help prioritize efforts to improve
the accuracy of future Inventories and guide future decisions on methodological choice. While the U.S. Inventory
calculates its emission estimates with the highest possible accuracy, uncertainties are associated to a varying degree
with the development of emission estimates for any inventory. Some of the current estimates, such as those for
carbon dioxide (CO2) emissions from energy-related activities, are considered to have minimal uncertainty
associated with them. For some other categories of emissions, however, a lack of data or an incomplete
understanding of how emissions are generated increases the uncertainty or systematic error associated with the
estimates presented. The UNFCCC reporting guidelines follow the recommendation in the 2006 IPCC Guidelines
(IPCC 2006) and require that countries provide single point estimates for each gas and emission or removal source
category. Within the discussion of each emission source, specific factors affecting the uncertainty associated with
the estimates are discussed.
Additional research in the following areas could help reduce uncertainty in the U.S. Inventory:
• Incorporating excluded emission sources. Quantitative estimates for some of the sources and sinks of
greenhouse gas emissions are not available at this time. In particular, emissions from some land-use
activities (e.g., emissions and removals from interior Alaska) and industrial processes are not included in
the inventory either because data are incomplete or because methodologies do not exist for estimating
1-22 Inventory of U.S. Greenhouse Gas Emissions and Sinks: 1990–2015
emissions from these source categories. See Annex 5 of this report for a discussion of the sources of
greenhouse gas emissions and sinks excluded from this report.
• Improving the accuracy of emission factors. Further research is needed in some cases to improve the
accuracy of emission factors used to calculate emissions from a variety of sources. For example, the
accuracy of current emission factors applied to CH4 and N2O emissions from stationary and mobile
combustion is highly uncertain.
• Collecting detailed activity data. Although methodologies exist for estimating emissions for some sources,
problems arise in obtaining activity data at a level of detail where more technology or process-specific
emission factors can be applied.
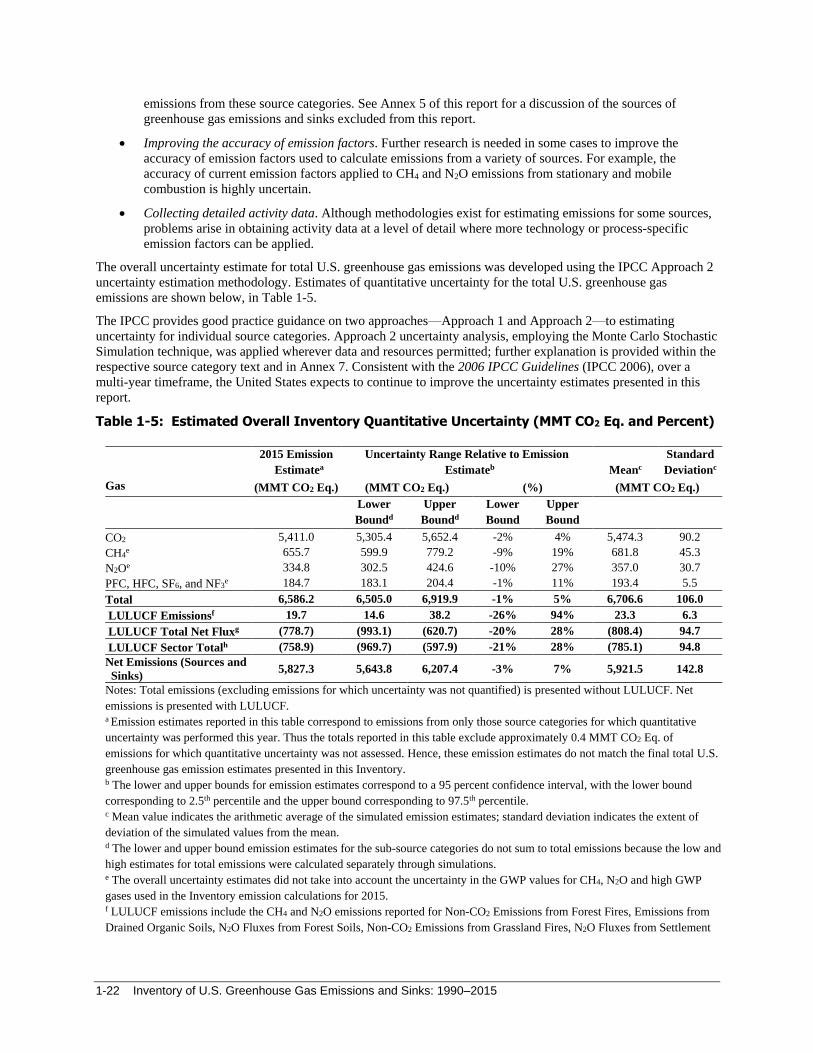
The overall uncertainty estimate for total U.S. greenhouse gas emissions was developed using the IPCC Approach 2
uncertainty estimation methodology. Estimates of quantitative uncertainty for the total U.S. greenhouse gas
emissions are shown below, in Table 1-5.
The IPCC provides good practice guidance on two approaches—Approach 1 and Approach 2—to estimating
uncertainty for individual source categories. Approach 2 uncertainty analysis, employing the Monte Carlo Stochastic
Simulation technique, was applied wherever data and resources permitted; further explanation is provided within the
respective source category text and in Annex 7. Consistent with the 2006 IPCC Guidelines (IPCC 2006), over a
multi-year timeframe, the United States expects to continue to improve the uncertainty estimates presented in this
report.
Table 1-5: Estimated Overall Inventory Quantitative Uncertainty (MMT CO2 Eq. and Percent)
2015 Emission
Estimatea
Uncertainty Range Relative to Emission
Estimateb Meanc
Standard
Deviationc
Gas (MMT CO2 Eq.) (MMT CO2 Eq.) (%) (MMT CO2 Eq.)
Lower
Boundd
Upper
Boundd
Lower
Bound
Upper
Bound
CO2 5,411.0 5,305.4 5,652.4 -2% 4% 5,474.3 90.2
CH4e 655.7 599.9 779.2 -9% 19% 681.8 45.3
N2Oe 334.8 302.5 424.6 -10% 27% 357.0 30.7
PFC, HFC, SF6, and NF3e 184.7 183.1 204.4 -1% 11% 193.4 5.5
Total 6,586.2 6,505.0 6,919.9 -1% 5% 6,706.6 106.0
LULUCF Emissionsf 19.7 14.6 38.2 -26% 94% 23.3 6.3
LULUCF Total Net Fluxg (778.7) (993.1) (620.7) -20% 28% (808.4) 94.7
LULUCF Sector Totalh (758.9) (969.7) (597.9) -21% 28% (785.1) 94.8
Net Emissions (Sources and
Sinks) 5,827.3 5,643.8 6,207.4 -3% 7% 5,921.5 142.8
Notes: Total emissions (excluding emissions for which uncertainty was not quantified) is presented without LULUCF. Net
emissions is presented with LULUCF. a Emission estimates reported in this table correspond to emissions from only those source categories for which quantitative
uncertainty was performed this year. Thus the totals reported in this table exclude approximately 0.4 MMT CO2 Eq. of
emissions for which quantitative uncertainty was not assessed. Hence, these emission estimates do not match the final total U.S.
greenhouse gas emission estimates presented in this Inventory. b The lower and upper bounds for emission estimates correspond to a 95 percent confidence interval, with the lower bound
corresponding to 2.5th percentile and the upper bound corresponding to 97.5th percentile. c Mean value indicates the arithmetic average of the simulated emission estimates; standard deviation indicates the extent of
deviation of the simulated values from the mean. d The lower and upper bound emission estimates for the sub-source categories do not sum to total emissions because the low and
high estimates for total emissions were calculated separately through simulations. e The overall uncertainty estimates did not take into account the uncertainty in the GWP values for CH4, N2O and high GWP
gases used in the Inventory emission calculations for 2015. f LULUCF emissions include the CH4 and N2O emissions reported for Non-CO2 Emissions from Forest Fires, Emissions from
Drained Organic Soils, N2O Fluxes from Forest Soils, Non-CO2 Emissions from Grassland Fires, N2O Fluxes from Settlement
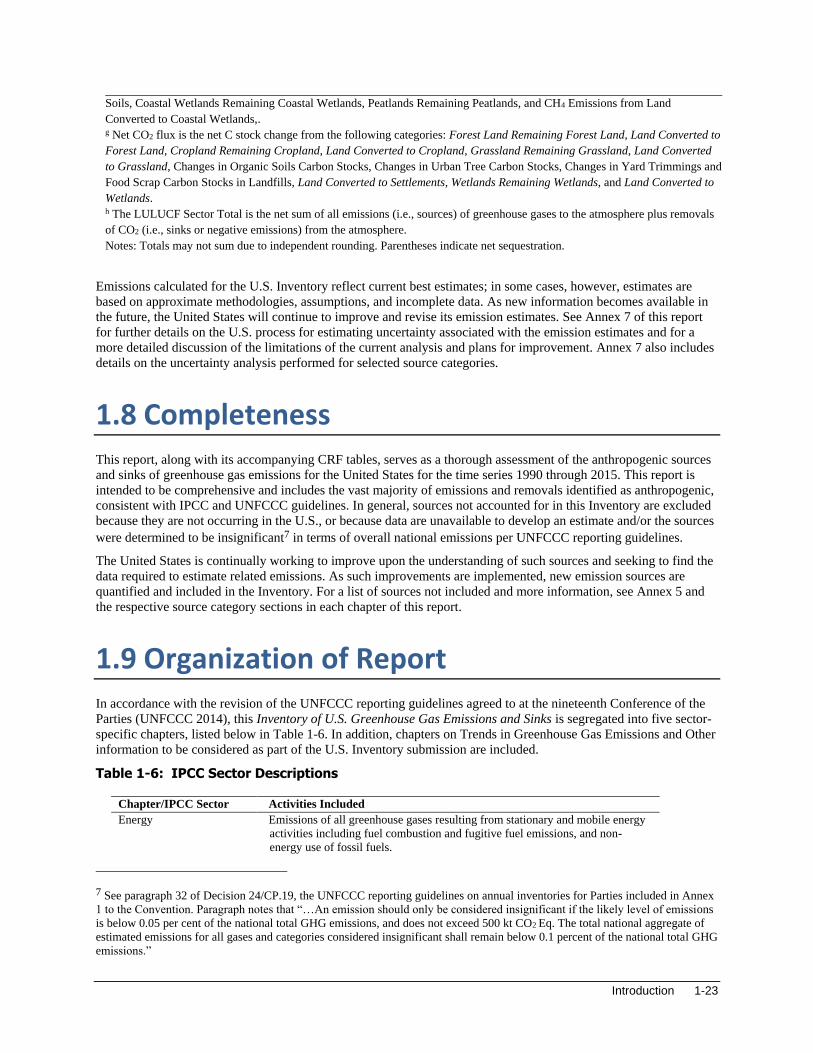
Introduction 1-23
Soils, Coastal Wetlands Remaining Coastal Wetlands, Peatlands Remaining Peatlands, and CH4 Emissions from Land
Converted to Coastal Wetlands,. g Net CO2 flux is the net C stock change from the following categories: Forest Land Remaining Forest Land, Land Converted to
Forest Land, Cropland Remaining Cropland, Land Converted to Cropland, Grassland Remaining Grassland, Land Converted
to Grassland, Changes in Organic Soils Carbon Stocks, Changes in Urban Tree Carbon Stocks, Changes in Yard Trimmings and
Food Scrap Carbon Stocks in Landfills, Land Converted to Settlements, Wetlands Remaining Wetlands, and Land Converted to
Wetlands. h The LULUCF Sector Total is the net sum of all emissions (i.e., sources) of greenhouse gases to the atmosphere plus removals
of CO2 (i.e., sinks or negative emissions) from the atmosphere.
Notes: Totals may not sum due to independent rounding. Parentheses indicate net sequestration.
Emissions calculated for the U.S. Inventory reflect current best estimates; in some cases, however, estimates are
based on approximate methodologies, assumptions, and incomplete data. As new information becomes available in
the future, the United States will continue to improve and revise its emission estimates. See Annex 7 of this report
for further details on the U.S. process for estimating uncertainty associated with the emission estimates and for a
more detailed discussion of the limitations of the current analysis and plans for improvement. Annex 7 also includes
details on the uncertainty analysis performed for selected source categories.
1.8 Completeness This report, along with its accompanying CRF tables, serves as a thorough assessment of the anthropogenic sources
and sinks of greenhouse gas emissions for the United States for the time series 1990 through 2015. This report is
intended to be comprehensive and includes the vast majority of emissions and removals identified as anthropogenic,
consistent with IPCC and UNFCCC guidelines. In general, sources not accounted for in this Inventory are excluded
because they are not occurring in the U.S., or because data are unavailable to develop an estimate and/or the sources
were determined to be insignificant7 in terms of overall national emissions per UNFCCC reporting guidelines.
The United States is continually working to improve upon the understanding of such sources and seeking to find the
data required to estimate related emissions. As such improvements are implemented, new emission sources are
quantified and included in the Inventory. For a list of sources not included and more information, see Annex 5 and
the respective source category sections in each chapter of this report.
1.9 Organization of Report In accordance with the revision of the UNFCCC reporting guidelines agreed to at the nineteenth Conference of the
Parties (UNFCCC 2014), this Inventory of U.S. Greenhouse Gas Emissions and Sinks is segregated into five sector-
specific chapters, listed below in Table 1-6. In addition, chapters on Trends in Greenhouse Gas Emissions and Other
information to be considered as part of the U.S. Inventory submission are included.
Table 1-6: IPCC Sector Descriptions
Chapter/IPCC Sector Activities Included
Energy Emissions of all greenhouse gases resulting from stationary and mobile energy
activities including fuel combustion and fugitive fuel emissions, and non-
energy use of fossil fuels.
7 See paragraph 32 of Decision 24/CP.19, the UNFCCC reporting guidelines on annual inventories for Parties included in Annex
1 to the Convention. Paragraph notes that “…An emission should only be considered insignificant if the likely level of emissions
is below 0.05 per cent of the national total GHG emissions, and does not exceed 500 kt CO2 Eq. The total national aggregate of
estimated emissions for all gases and categories considered insignificant shall remain below 0.1 percent of the national total GHG
emissions.”
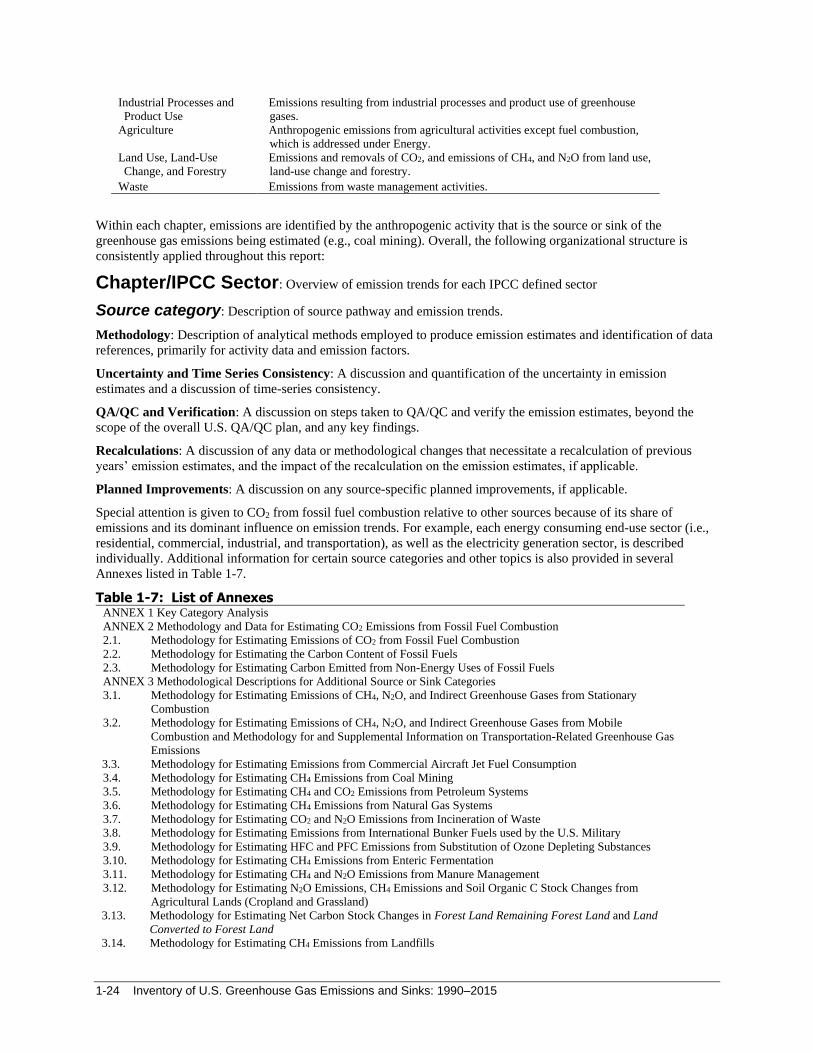
1-24 Inventory of U.S. Greenhouse Gas Emissions and Sinks: 1990–2015
Industrial Processes and
Product Use
Emissions resulting from industrial processes and product use of greenhouse
gases.
Agriculture Anthropogenic emissions from agricultural activities except fuel combustion,
which is addressed under Energy.
Land Use, Land-Use
Change, and Forestry
Emissions and removals of CO2, and emissions of CH4, and N2O from land use,
land-use change and forestry.
Waste Emissions from waste management activities.
Within each chapter, emissions are identified by the anthropogenic activity that is the source or sink of the
greenhouse gas emissions being estimated (e.g., coal mining). Overall, the following organizational structure is
consistently applied throughout this report:
Chapter/IPCC Sector: Overview of emission trends for each IPCC defined sector
Source category: Description of source pathway and emission trends.
Methodology: Description of analytical methods employed to produce emission estimates and identification of data
references, primarily for activity data and emission factors.
Uncertainty and Time Series Consistency: A discussion and quantification of the uncertainty in emission
estimates and a discussion of time-series consistency.
QA/QC and Verification: A discussion on steps taken to QA/QC and verify the emission estimates, beyond the
scope of the overall U.S. QA/QC plan, and any key findings.
Recalculations: A discussion of any data or methodological changes that necessitate a recalculation of previous
years’ emission estimates, and the impact of the recalculation on the emission estimates, if applicable.
Planned Improvements: A discussion on any source-specific planned improvements, if applicable.
Special attention is given to CO2 from fossil fuel combustion relative to other sources because of its share of
emissions and its dominant influence on emission trends. For example, each energy consuming end-use sector (i.e.,
residential, commercial, industrial, and transportation), as well as the electricity generation sector, is described
individually. Additional information for certain source categories and other topics is also provided in several
Annexes listed in Table 1-7.
Table 1-7: List of Annexes ANNEX 1 Key Category Analysis
ANNEX 2 Methodology and Data for Estimating CO2 Emissions from Fossil Fuel Combustion
2.1. Methodology for Estimating Emissions of CO2 from Fossil Fuel Combustion
2.2. Methodology for Estimating the Carbon Content of Fossil Fuels
2.3. Methodology for Estimating Carbon Emitted from Non-Energy Uses of Fossil Fuels
ANNEX 3 Methodological Descriptions for Additional Source or Sink Categories
3.1. Methodology for Estimating Emissions of CH4, N2O, and Indirect Greenhouse Gases from Stationary
Combustion
3.2. Methodology for Estimating Emissions of CH4, N2O, and Indirect Greenhouse Gases from Mobile
Combustion and Methodology for and Supplemental Information on Transportation-Related Greenhouse Gas
Emissions
3.3. Methodology for Estimating Emissions from Commercial Aircraft Jet Fuel Consumption
3.4. Methodology for Estimating CH4 Emissions from Coal Mining
3.5. Methodology for Estimating CH4 and CO2 Emissions from Petroleum Systems
3.6. Methodology for Estimating CH4 Emissions from Natural Gas Systems
3.7. Methodology for Estimating CO2 and N2O Emissions from Incineration of Waste
3.8. Methodology for Estimating Emissions from International Bunker Fuels used by the U.S. Military
3.9. Methodology for Estimating HFC and PFC Emissions from Substitution of Ozone Depleting Substances
3.10. Methodology for Estimating CH4 Emissions from Enteric Fermentation
3.11. Methodology for Estimating CH4 and N2O Emissions from Manure Management
3.12. Methodology for Estimating N2O Emissions, CH4 Emissions and Soil Organic C Stock Changes from
Agricultural Lands (Cropland and Grassland)
3.13. Methodology for Estimating Net Carbon Stock Changes in Forest Land Remaining Forest Land and Land
Converted to Forest Land
3.14. Methodology for Estimating CH4 Emissions from Landfills
Introduction 1-25
ANNEX 4 IPCC Reference Approach for Estimating CO2 Emissions from Fossil Fuel Combustion
ANNEX 5 Assessment of the Sources and Sinks of Greenhouse Gas Emissions Not Included
ANNEX 6 Additional Information
6.1. Global Warming Potential Values
6.2. Ozone Depleting Substance Emissions
6.3. Sulfur Dioxide Emissions
6.4. Complete List of Source Categories
6.5. Constants, Units, and Conversions
6.6. Abbreviations
6.7. Chemical Formulas
ANNEX 7 Uncertainty
7.1. Overview
7.2. Methodology and Results
7.3. Reducing Uncertainty
7.4. Planned Improvements
7.5. Additional Information on Uncertainty Analyses by Source
ANNEX 8 QA/QC Procedures 8.1. Background
8.2. Purpose
8.3. Assessment Factors