
Inventory of U.S. Greenhouse Gas Emissions and … · Revisions to Natural Gas and Petroleum...
29
April 2017 Page 1 of 29 Inventory of U.S. Greenhouse Gas Emissions and Sinks 1990-2015: Revisions to Natural Gas and Petroleum Systems Production Emissions This memo describes revisions to emission sources in the natural gas and petroleum systems production segments for the 2017 Inventory of U.S. Greenhouse Gas Emissions and Sinks (GHGI), including revisions to condensate tanks, oil tanks, and oil well associated gas (sections 1-4), well counts (section 5), equipment counts (section 6), liquids unloading (section 7), and gathering and boosting (G&B) station episodic events (section 8). Many of the updates described in this memo use data from the EPA’s Greenhouse Gas Reporting Program (GHGRP). Subpart W of the GHGRP collects annual operating and emissions data on sources including production storage tanks, associated gas venting and flaring, and equipment that may leak (e.g., separators, heaters, dehydrators, and compressors) from onshore natural gas and petroleum systems facilities who meet a reporting threshold of 25,000 metric tons of CO2 equivalent (MT CO2e) emissions. Onshore production facilities in subpart W are defined as a unique combination of operator and basin of operation. Facilities that meet the subpart W reporting threshold have been reporting since 2011; currently, five years of subpart W reporting data are publicly available, covering reporting year (RY) 2011 through RY2015. 1 1. Previous GHGI Methodology for Production Tanks and Oil Well Venting and Flaring The previous (2016 and earlier) GHGI methodology for tank emissions and oil well venting and flaring emissions is depicted in Figure 1 below. The previous GHGI calculated tank emissions from oil production by applying an oil tank emission factor (EF) to 20% of stripper well production and 100% of non-stripper oil well production, and applied a well venting EF (e.g., casinghead gas emissions) to the remainder of stripper well production (80%). For gas production, the previous GHGI methodology estimated tank emissions by applying the condensate tank EF to condensate production in each region, and well venting or flaring emissions are not applicable. The specific methodologies for each are discussed in detail below. The methane (CH4) EFs for both condensate and oil tanks were based on throughput (units of standard cubic feet per barrel of production, scf/bbl). These previous GHGI CH4 EFs were developed from default sample runs available through E&P Tank 2 (sometimes referred to as API TankCalc). These runs used data sampled from tanks in various regions in the United States with hydrocarbon gravities from 17 to 64˚ API and separator pressures and temperatures ranging from 4 to 870 psig and 40 to 180˚F, respectively. The EPA determined an uncontrolled methane emission rate and EF for each sample run. 1 The GHGRP subpart W data used in the analyses discussed in this memorandum are those reported to the EPA as of August 13, 2016. 2 API. April, 2000. API PUBL 4697: Production Tank Emissions Model (E&P Tank).
Transcript of Inventory of U.S. Greenhouse Gas Emissions and … · Revisions to Natural Gas and Petroleum...
April 2017
Page 1 of 29
Inventory of U.S. Greenhouse Gas Emissions and Sinks 1990-2015: Revisions to Natural Gas and Petroleum Systems Production
Emissions
This memo describes revisions to emission sources in the natural gas and petroleum systems production segments for the 2017 Inventory of U.S. Greenhouse Gas Emissions and Sinks (GHGI), including revisions to condensate tanks, oil tanks, and oil well associated gas (sections 1-4), well counts (section 5), equipment counts (section 6), liquids unloading (section 7), and gathering and boosting (G&B) station episodic events (section 8). Many of the updates described in this memo use data from the EPA’s Greenhouse Gas Reporting Program (GHGRP). Subpart W of the GHGRP collects annual operating and emissions data on sources including production storage tanks, associated gas venting and flaring, and equipment that may leak (e.g., separators, heaters, dehydrators, and compressors) from onshore natural gas and petroleum systems facilities who meet a reporting threshold of 25,000 metric tons of CO2 equivalent (MT CO2e) emissions. Onshore production facilities in subpart W are defined as a unique combination of operator and basin of operation. Facilities that meet the subpart W reporting threshold have been reporting since 2011; currently, five years of subpart W reporting data are publicly available, covering reporting year (RY) 2011 through RY2015.1
1. Previous GHGI Methodology for Production Tanks and Oil Well
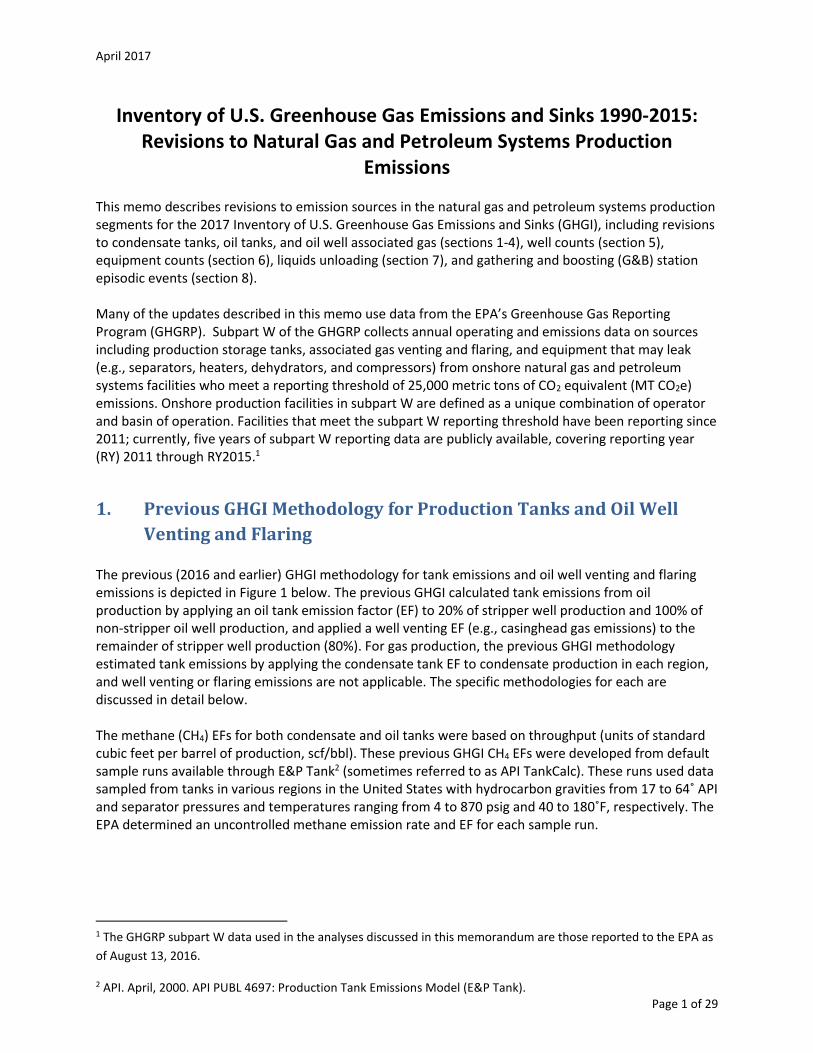
Venting and Flaring The previous (2016 and earlier) GHGI methodology for tank emissions and oil well venting and flaring emissions is depicted in Figure 1 below. The previous GHGI calculated tank emissions from oil production by applying an oil tank emission factor (EF) to 20% of stripper well production and 100% of non-stripper oil well production, and applied a well venting EF (e.g., casinghead gas emissions) to the remainder of stripper well production (80%). For gas production, the previous GHGI methodology estimated tank emissions by applying the condensate tank EF to condensate production in each region, and well venting or flaring emissions are not applicable. The specific methodologies for each are discussed in detail below. The methane (CH4) EFs for both condensate and oil tanks were based on throughput (units of standard cubic feet per barrel of production, scf/bbl). These previous GHGI CH4 EFs were developed from default sample runs available through E&P Tank2 (sometimes referred to as API TankCalc). These runs used data sampled from tanks in various regions in the United States with hydrocarbon gravities from 17 to 64˚ API and separator pressures and temperatures ranging from 4 to 870 psig and 40 to 180˚F, respectively. The EPA determined an uncontrolled methane emission rate and EF for each sample run.
1 The GHGRP subpart W data used in the analyses discussed in this memorandum are those reported to the EPA as
of August 13, 2016.
2 API. April, 2000. API PUBL 4697: Production Tank Emissions Model (E&P Tank).
April 2017
Page 2 of 29
Figure 1. Current GHGI Calculation Methodology for Storage Tanks and Stripper Well Venting For condensate tanks in previous GHGIs, the EPA calculated the uncontrolled EF by averaging the uncontrolled EFs from tank sample runs that have hydrocarbon throughput with API gravity equal to or above 45. From this data, the EPA then calculated a controlled condensate tank EF assuming 80% control efficiency. Separately, measurement data were available for malfunctioning dump valve emissions in the midcontinent and southwest NEMS regions; these data showed that measured tank emissions were much higher than expected (e.g., when comparing to software emissions estimates) and the difference was attributed to malfunctioning dump valves. For those regions, the condensate tank uncontrolled and controlled EFs were adjusted to include the emissions from malfunctioning dump valves. The malfunctioning dump valve factor was not applied to other NEMS regions. For oil tanks in previous GHGIs, the EPA calculated an uncontrolled EF by averaging the uncontrolled EFs from tank sample runs that have hydrocarbon throughput with API gravity below 45. As was the case for condensate tanks, limited regional data were available on malfunctioning dump valve emissions for oil tanks. Petroleum emissions are not calculated at a regional level, and the emissions from malfunctioning dump valves were incorporated into the oil tank EF for the United States. The EPA did not calculate a separate EF for controlled oil tanks for the GHGI. However, the previous GHGI did account for combustion emissions from flares based on calculated oil tank emissions. Flared emissions from oil tanks were calculated by multiplying the oil tank emissions by 2.2%, and then multiplying this volume by a CH4 EF of 20 scf per mcf of flared emissions. The flared emissions contribution were less than 0.05% of oil tank emissions. Table 7 and Table 8 present the previous GHGI EFs for oil and condensate tanks. Previous GHGIs estimated emissions for stripper well venting by applying a well venting EF to 80% of the stripper well oil production, which is calculated based on the counts of stripper wells. The EPA developed the stripper well venting EF with the following assumptions: the gas-to-oil ratio (GOR) equaled five scf of gas per barrel of crude oil, a stripper well produces an average of 2.1 barrels per day,
April 2017
Page 3 of 29
and that 61.2% of the gas is CH4.3 This translated to CH4 emissions of 2,345 scfy per stripper well or 3.1 scf/bbl. The associated activity data (throughput) in previous GHGIs for each emission source were unique to the source category: for condensate tanks, the activity data were condensate production as reported by the Department of Energy’s Energy Information Administration (EIA), and for oil tanks and stripper well venting, the activity data were based on crude oil production as reported by EIA, and stripper well counts and average stripper well production from the Interstate Oil and Gas Compact Commission. The condensate production was subdivided to account for condensate stored in controlled versus uncontrolled tanks; the previous GHGI methodology assumes that 50% of condensate throughput goes to controlled tanks and 50% goes to uncontrolled tanks. Crude oil production was subdivided into production from non-stripper and stripper wells. The oil tank activity data included total crude oil production from all non-stripper wells and 20% of the crude oil production from stripper wells, and the stripper well venting activity data included the remaining 80% of stripper well crude oil production. The previous GHGI methodology described above accounts for the majority of emissions from condensate and oil tanks in the production segment, whether located at well pad sites or natural gas gathering and boosting (G&B) stations. The flashing loss component of a condensate tank EF developed by the modeling described above is usually significant (compared to working and breathing losses), and drives the order of magnitude of the EF. As such, it is important to note that flashing losses mainly occur during the first transfer of pressurized field condensate to atmospheric conditions, which may happen at a well pad or G&B station. As discussed in EPA’s memorandum “Inventory of U.S. GHG Emissions and Sinks 1990-2014: Revision to Gathering and Boosting Station Emissions” (April 2016), revisions implemented in the 2016 GHGI based on the 2015 Marchese et al. study introduced potential minor double counting of some emissions from upstream tanks in natural gas systems since the new G&B facility-level EF includes flashing losses from condensate tanks that receive pressurized field condensate, and such losses were already accounted for by the nature of the existing GHGI methodology. These considerations were addressed with the final 2017 GHGI revisions.
2. Available Subpart W Data for Production Tanks and Associated Gas
2.1 Production Tanks Production storage tank data reported under subpart W are specific to onshore oil and gas production operations, defined as “all equipment on a single well-pad or associated with a single well-pad.” Subpart W uses the term “production storage tanks” to refer to both condensate and oil tanks. However, certain data reported at the sub-basin level can be used to classify production type as gas or oil (further discussed below). Production storage tank emission calculation and reporting requirements differ for tanks storing hydrocarbon liquids from separators or wells with throughput greater than or equal to 10 barrels per day (bbl/day) (herein referred to as large tanks) versus those tanks storing hydrocarbon liquids from separators or wells with throughput less than 10 bbl/day (herein referred to as small tanks). The RY2015 subpart W data includes new data elements that were not reported in prior years (RY2011–2014). In particular, the total number of tanks not on well pads (but associated with a single well-pad) were included in the reported tank counts starting in RY2015. Note that emissions from all tanks, including
3 ICF. October 1999. “Estimates of Methane Emissions from the U.S. Oil Industry.”
April 2017
Page 4 of 29
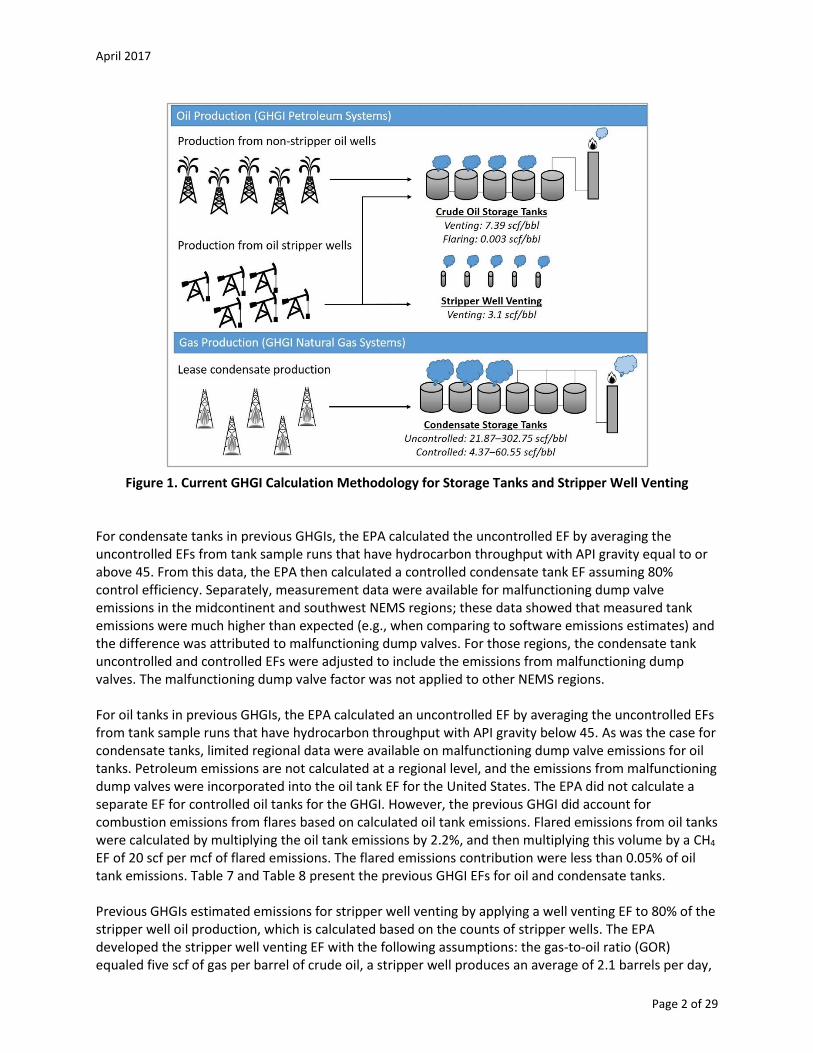
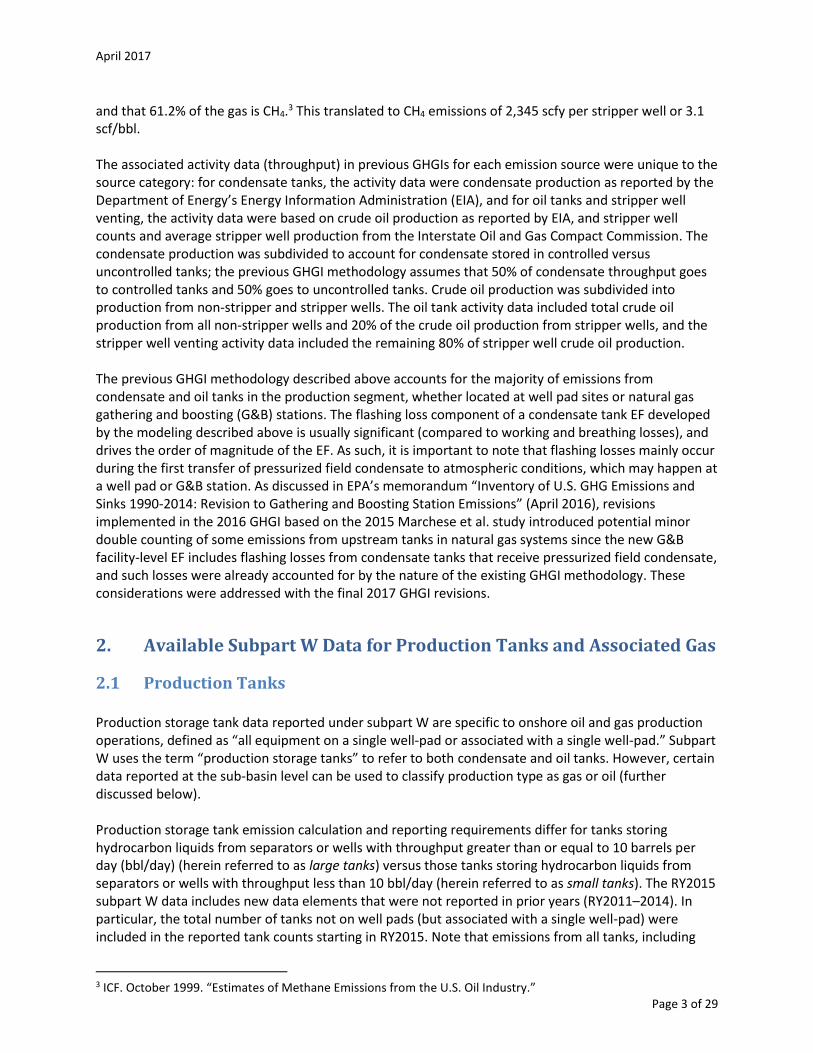
tanks that are not on well pads but are associated with a single well pad, were reported for all years (RY2011-2015). Table 1 and Table 2 below summarize the relevant information available for large and small production storage tanks for each reporting year and indicate whether the data are reported at a basin-level or sub-basin level.
Table 1. Available Subpart W Data for Large Production Storage Tanks
Reporting Year(s)
Throughput (bbl/yr)
Tank Count CH4 Emissions
Total Vent to
Atmosphere Flare
Control
Vapor Recovery Control
Venting Tanks
Tanks with Flaring
Tanks with Vapor
Recovery
Malfunctioning Dump Valves (d)
2011–2014 Yes (a) No (b) No (b) No (c) No (c) Yes Yes No Yes
2015 Yes Yes Yes Yes Yes Yes Yes Yes Yes
Reporting Basis
Sub-Basin Sub-Basin Sub-Basin Sub-Basin Sub-Basin Sub-Basin Sub-Basin Sub-Basin Sub-Basin
a. RY2014 reporting included data elements for RY2011-2013 that were previously deferred from reporting. b. The total count was reported for tanks on well pads, but not for tanks off well pads. c. For tanks not on well pads, a combined count of tanks that use a flare or vapor recovery were reported, but
the counts were not reported separately. d. The total number of separators with malfunctioning dump valves is reported, but counts of tanks or wells
associated with the separators is not reported.
Table 2. Available Subpart W Data for Small Production Storage Tanks
Reporting Year(s)
Throughput (bbl/yr)
Tank Count CH4 Emissions
Total Vent to
Atmosphere Flare
Control
Vapor Recovery Control
Venting Tanks
Tanks with Flaring
Tanks with Vapor
Recovery
Malfunctioning Dump Valves
2011–2014 Yes No (a) No No No Yes Yes No No
2015 Yes Yes No (b) Yes No (b) No (b) Yes No (b) No
Reporting Basis
Basin Sub-Basin Sub-Basin Sub-Basin Sub-Basin Sub-Basin Sub-Basin Sub-Basin N/A
a. The total count was reported for tanks on well pads, but not for tanks off well pads. b. The count of tanks that did not control emissions with flares is reported; this value comprises tanks that vent
directly to the atmosphere or use a vapor recovery system. N/A – Not applicable
Subpart W provides separate methodologies for reporters to calculate emissions from large and small tanks. Emissions from large tanks in subpart W are calculated by applying one of two calculation methodologies for RY2015. Reporters may use a software program, such as AspenTech HYSYS or API E&P Tank, to calculate emissions or may assume that all CH4 in the liquid and gas is emitted from the tank (based on applying certain assumptions for gas and liquid composition). Emissions from small tanks in subpart W are calculated by multiplying a population EF by the number of separators or wells. The small tank population EF was developed using GHGI condensate and oil tank EFs, coupled with an average throughput of 2.2 bbl/day (based on GHGI stripper well data). The subpart W calculation methodologies are summarized in Appendix A. Section 3 presents analyses used in the development of the 2017 GHGI methodology for condensate and oil tanks and related sources. As discussed above, RY2015 provides a level of granularity and several data elements that are not available in previous RYs. The revisions considered for the 2017 GHGI were therefore generally developed using RY2015 data to apply to previous years.
April 2017
Page 5 of 29
2.2 Associated Gas Associated gas venting or flaring is defined in subpart W as “the venting or flaring of natural gas which originates at wellheads that also produce hydrocarbon liquids and occurs either in a discrete gaseous phase at the wellhead or is released from the liquid hydrocarbon phase by separation. This does not include venting or flaring resulting from activities that are reported elsewhere, including tank venting, well completions, and well workovers.” This generally refers to venting of gas from oil wells, when, for example, a pipeline is not available to collect the gas for sales. Facilities calculate associated gas emissions by determining the gas-to-oil ratio (GOR) for a well, and assuming that all gas is released based on the liquid throughput. Facilities may also subtract the volume of associated gas that is sent to sales from their estimate. Facilities report the number of wells that vent or flare associated gas, along with the emissions from each activity. The data reported for RY2011-2015 are similar, except that data are reported in more granularity for RY2015. Basin-level data are reported for RY2011-RY2014, while sub-basin level data are reported starting in RY2015. Differences in the reporting-level do not affect the analyses presented below, because data are currently evaluated at a national level. The subpart W calculation methodologies are summarized in Appendix A. The data collected under subpart W associated gas venting and flaring is most comparable to the previous GHGI methodology for “stripper well venting.” A stripper well according to GHGI data sources is defined as producing less than 10 barrels per day of oil, which is the same as the subpart W throughput threshold definition for small tanks. However, associated gas data reported under subpart W may include venting or flaring from non-stripper wells and/or stripper wells.
3. 2017 Revisions to Production Segment Tank Emissions Based on stakeholder feedback, EPA implemented a throughput-based approach to calculate tank emissions in the final 2017 GHGI. National condensate and oil production data (obtained from EIA) were coupled with subpart W-based AFs (percent of production sent to tanks, and percent of total throughput sent to each tank category), then combined with subpart W-based tank category-specific EFs (scf/bbl). This approach is similar to the previous GHGI methodology which is on a throughput basis. The tank basis option which was considered but not implemented in the final 2017 GHGI is discussed in Appendix B of this memo.
3.1 Activity Factor Development Activity factors were developed for each of the large and small tank categories in subpart W. The EPA conducted the following steps to calculate activity factors: Step 1: Apportion the reported tank throughput and tank count data between gas and oil production using the subpart W formation type that is part of the sub-basin ID. Data reported in sub-basins with high permeability gas, shale gas, coal seam, or other tight reservoir rock formation types were assigned to gas production. Data reported in sub-basins with the oil formation type were assigned to oil production. The result of this step is total throughput and tank counts for the categories of large condensate tanks, small condensate tanks, large oil tanks, and small oil tanks. Step 2: For each reporting facility/sub-basin combination, apportion the reported throughput data by tank category (tanks that use a flare, a vapor recovery unit (VRU), or are uncontrolled), using the number of tanks reported in each category and assuming that throughput for each facility is equivalent for each tank within a sub-basin (for large tanks) or basin (for small tanks). Throughput is not reported at
April 2017
Page 6 of 29
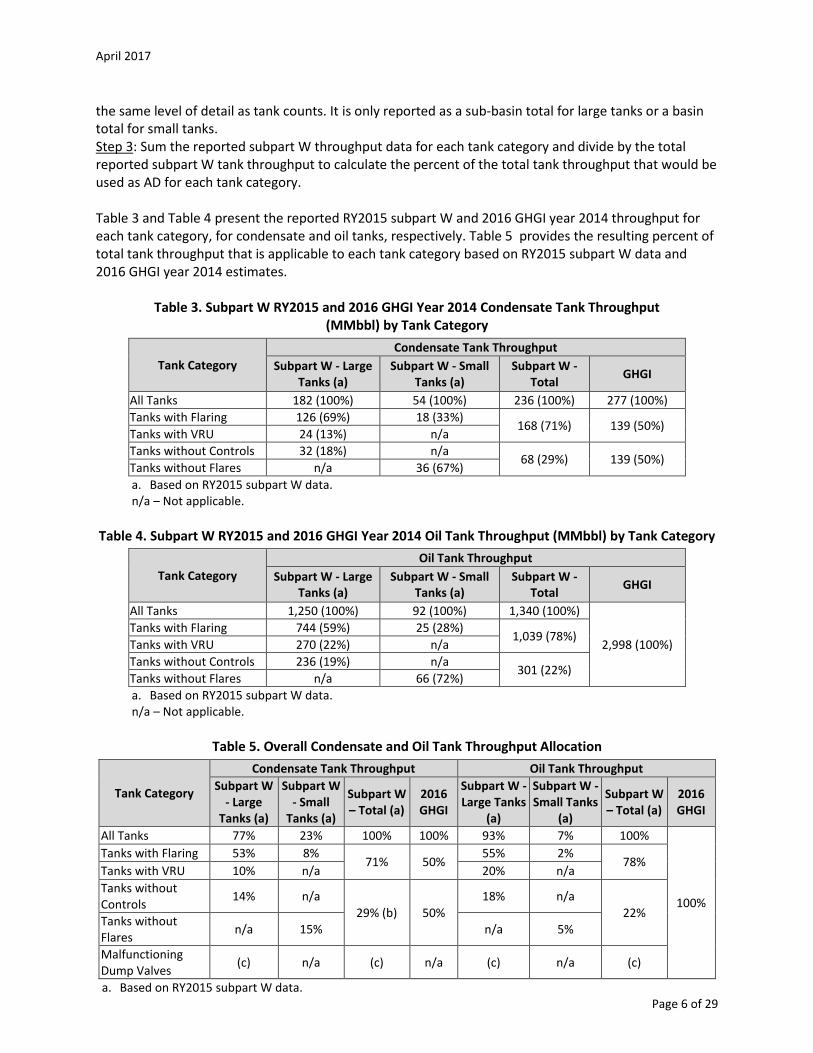
the same level of detail as tank counts. It is only reported as a sub-basin total for large tanks or a basin total for small tanks. Step 3: Sum the reported subpart W throughput data for each tank category and divide by the total reported subpart W tank throughput to calculate the percent of the total tank throughput that would be used as AD for each tank category. Table 3 and Table 4 present the reported RY2015 subpart W and 2016 GHGI year 2014 throughput for each tank category, for condensate and oil tanks, respectively. Table 5 provides the resulting percent of total tank throughput that is applicable to each tank category based on RY2015 subpart W data and 2016 GHGI year 2014 estimates.
Table 3. Subpart W RY2015 and 2016 GHGI Year 2014 Condensate Tank Throughput (MMbbl) by Tank Category
Tank Category
Condensate Tank Throughput
Subpart W - Large Tanks (a)
Subpart W - Small Tanks (a)
Subpart W - Total
GHGI
All Tanks 182 (100%) 54 (100%) 236 (100%) 277 (100%)
Tanks with Flaring 126 (69%) 18 (33%) 168 (71%) 139 (50%)
Tanks with VRU 24 (13%) n/a
Tanks without Controls 32 (18%) n/a 68 (29%) 139 (50%)
Tanks without Flares n/a 36 (67%)
a. Based on RY2015 subpart W data. n/a – Not applicable.
Table 4. Subpart W RY2015 and 2016 GHGI Year 2014 Oil Tank Throughput (MMbbl) by Tank Category
Tank Category
Oil Tank Throughput
Subpart W - Large Tanks (a)
Subpart W - Small Tanks (a)
Subpart W - Total
GHGI
All Tanks 1,250 (100%) 92 (100%) 1,340 (100%)
2,998 (100%)
Tanks with Flaring 744 (59%) 25 (28%) 1,039 (78%)
Tanks with VRU 270 (22%) n/a
Tanks without Controls 236 (19%) n/a 301 (22%)
Tanks without Flares n/a 66 (72%)
a. Based on RY2015 subpart W data. n/a – Not applicable.
Table 5. Overall Condensate and Oil Tank Throughput Allocation
Tank Category
Condensate Tank Throughput Oil Tank Throughput
Subpart W - Large
Tanks (a)
Subpart W - Small
Tanks (a)
Subpart W – Total (a)
2016 GHGI
Subpart W - Large Tanks
(a)
Subpart W - Small Tanks
(a)
Subpart W – Total (a)
2016 GHGI
All Tanks 77% 23% 100% 100% 93% 7% 100%
100%
Tanks with Flaring 53% 8% 71% 50%
55% 2% 78%
Tanks with VRU 10% n/a 20% n/a
Tanks without Controls
14% n/a
29% (b) 50%
18% n/a
22% Tanks without Flares
n/a 15% n/a 5%
Malfunctioning Dump Valves
(c) n/a (c) n/a (c) n/a (c)
a. Based on RY2015 subpart W data.
April 2017
Page 7 of 29
b. While the small tank category “tanks without flares” may include small tanks that use a VRU, for comparison to the GHGI, this table assumes that this reported category of tanks is uncontrolled.
c. The total throughput for large condensate tanks (i.e., 77% of throughput) and large oil tanks (i.e., 93% of throughput) is applicable to malfunctioning dump valves due to the malfunctioning dump valve EF methodology which applies a throughput-based EF to all large tank throughput (see the following Large Tank EF Development section).
n/a – Not applicable.
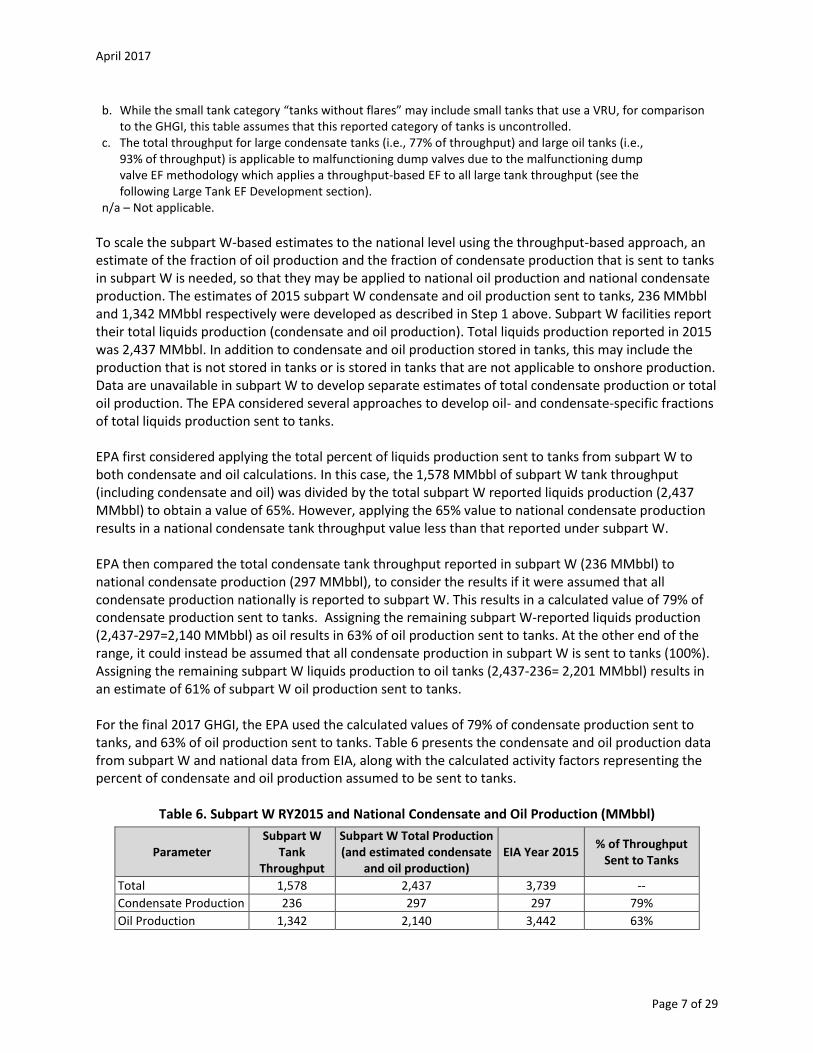
To scale the subpart W-based estimates to the national level using the throughput-based approach, an estimate of the fraction of oil production and the fraction of condensate production that is sent to tanks in subpart W is needed, so that they may be applied to national oil production and national condensate production. The estimates of 2015 subpart W condensate and oil production sent to tanks, 236 MMbbl and 1,342 MMbbl respectively were developed as described in Step 1 above. Subpart W facilities report their total liquids production (condensate and oil production). Total liquids production reported in 2015 was 2,437 MMbbl. In addition to condensate and oil production stored in tanks, this may include the production that is not stored in tanks or is stored in tanks that are not applicable to onshore production. Data are unavailable in subpart W to develop separate estimates of total condensate production or total oil production. The EPA considered several approaches to develop oil- and condensate-specific fractions of total liquids production sent to tanks. EPA first considered applying the total percent of liquids production sent to tanks from subpart W to both condensate and oil calculations. In this case, the 1,578 MMbbl of subpart W tank throughput (including condensate and oil) was divided by the total subpart W reported liquids production (2,437 MMbbl) to obtain a value of 65%. However, applying the 65% value to national condensate production results in a national condensate tank throughput value less than that reported under subpart W. EPA then compared the total condensate tank throughput reported in subpart W (236 MMbbl) to national condensate production (297 MMbbl), to consider the results if it were assumed that all condensate production nationally is reported to subpart W. This results in a calculated value of 79% of condensate production sent to tanks. Assigning the remaining subpart W-reported liquids production (2,437-297=2,140 MMbbl) as oil results in 63% of oil production sent to tanks. At the other end of the range, it could instead be assumed that all condensate production in subpart W is sent to tanks (100%). Assigning the remaining subpart W liquids production to oil tanks (2,437-236= 2,201 MMbbl) results in an estimate of 61% of subpart W oil production sent to tanks. For the final 2017 GHGI, the EPA used the calculated values of 79% of condensate production sent to tanks, and 63% of oil production sent to tanks. Table 6 presents the condensate and oil production data from subpart W and national data from EIA, along with the calculated activity factors representing the percent of condensate and oil production assumed to be sent to tanks.
Table 6. Subpart W RY2015 and National Condensate and Oil Production (MMbbl)
Parameter Subpart W
Tank Throughput
Subpart W Total Production (and estimated condensate
and oil production) EIA Year 2015
% of Throughput Sent to Tanks
Total 1,578 2,437 3,739 --
Condensate Production 236 297 297 79%
Oil Production 1,342 2,140 3,442 63%
April 2017
Page 8 of 29
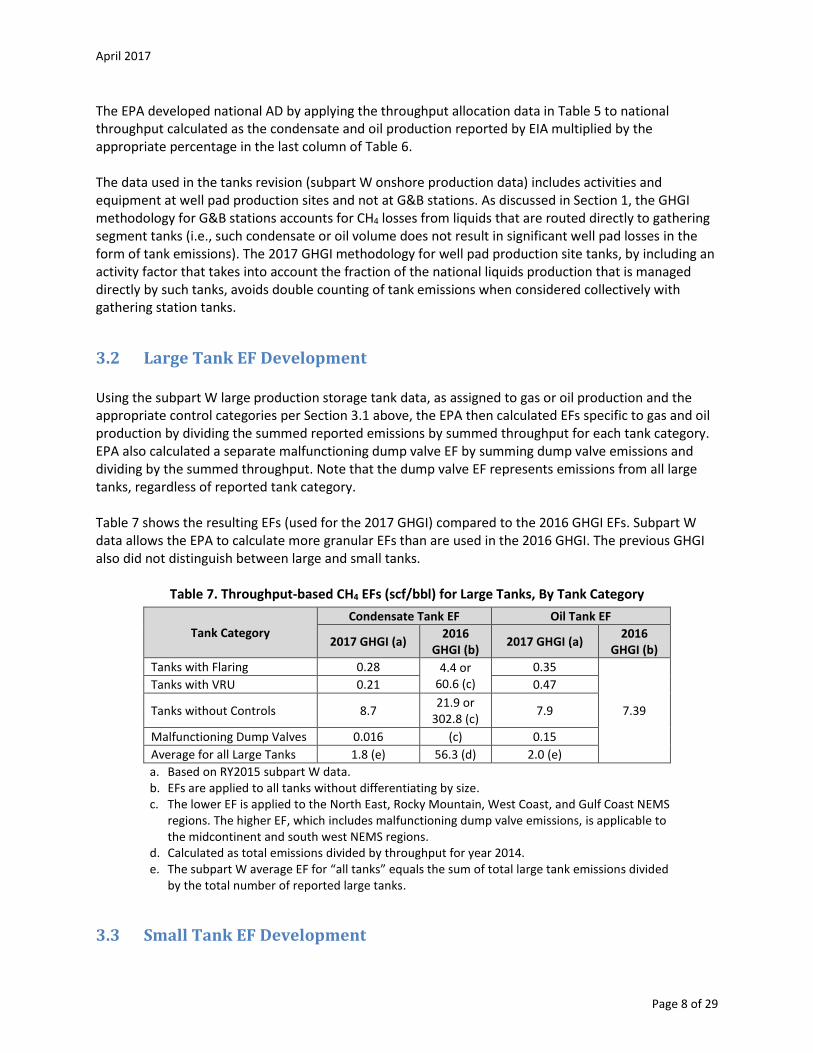
The EPA developed national AD by applying the throughput allocation data in Table 5 to national throughput calculated as the condensate and oil production reported by EIA multiplied by the appropriate percentage in the last column of Table 6. The data used in the tanks revision (subpart W onshore production data) includes activities and equipment at well pad production sites and not at G&B stations. As discussed in Section 1, the GHGI methodology for G&B stations accounts for CH4 losses from liquids that are routed directly to gathering segment tanks (i.e., such condensate or oil volume does not result in significant well pad losses in the form of tank emissions). The 2017 GHGI methodology for well pad production site tanks, by including an activity factor that takes into account the fraction of the national liquids production that is managed directly by such tanks, avoids double counting of tank emissions when considered collectively with gathering station tanks.
3.2 Large Tank EF Development Using the subpart W large production storage tank data, as assigned to gas or oil production and the appropriate control categories per Section 3.1 above, the EPA then calculated EFs specific to gas and oil production by dividing the summed reported emissions by summed throughput for each tank category. EPA also calculated a separate malfunctioning dump valve EF by summing dump valve emissions and dividing by the summed throughput. Note that the dump valve EF represents emissions from all large tanks, regardless of reported tank category. Table 7 shows the resulting EFs (used for the 2017 GHGI) compared to the 2016 GHGI EFs. Subpart W data allows the EPA to calculate more granular EFs than are used in the 2016 GHGI. The previous GHGI also did not distinguish between large and small tanks.
Table 7. Throughput-based CH4 EFs (scf/bbl) for Large Tanks, By Tank Category
Tank Category
Condensate Tank EF Oil Tank EF
2017 GHGI (a) 2016
GHGI (b) 2017 GHGI (a)
2016 GHGI (b)
Tanks with Flaring 0.28 4.4 or 60.6 (c)
0.35
7.39
Tanks with VRU 0.21 0.47
Tanks without Controls 8.7 21.9 or
302.8 (c) 7.9
Malfunctioning Dump Valves 0.016 (c) 0.15
Average for all Large Tanks 1.8 (e) 56.3 (d) 2.0 (e)
a. Based on RY2015 subpart W data. b. EFs are applied to all tanks without differentiating by size. c. The lower EF is applied to the North East, Rocky Mountain, West Coast, and Gulf Coast NEMS
regions. The higher EF, which includes malfunctioning dump valve emissions, is applicable to the midcontinent and south west NEMS regions.
d. Calculated as total emissions divided by throughput for year 2014. e. The subpart W average EF for “all tanks” equals the sum of total large tank emissions divided
by the total number of reported large tanks.
3.3 Small Tank EF Development
April 2017
Page 9 of 29
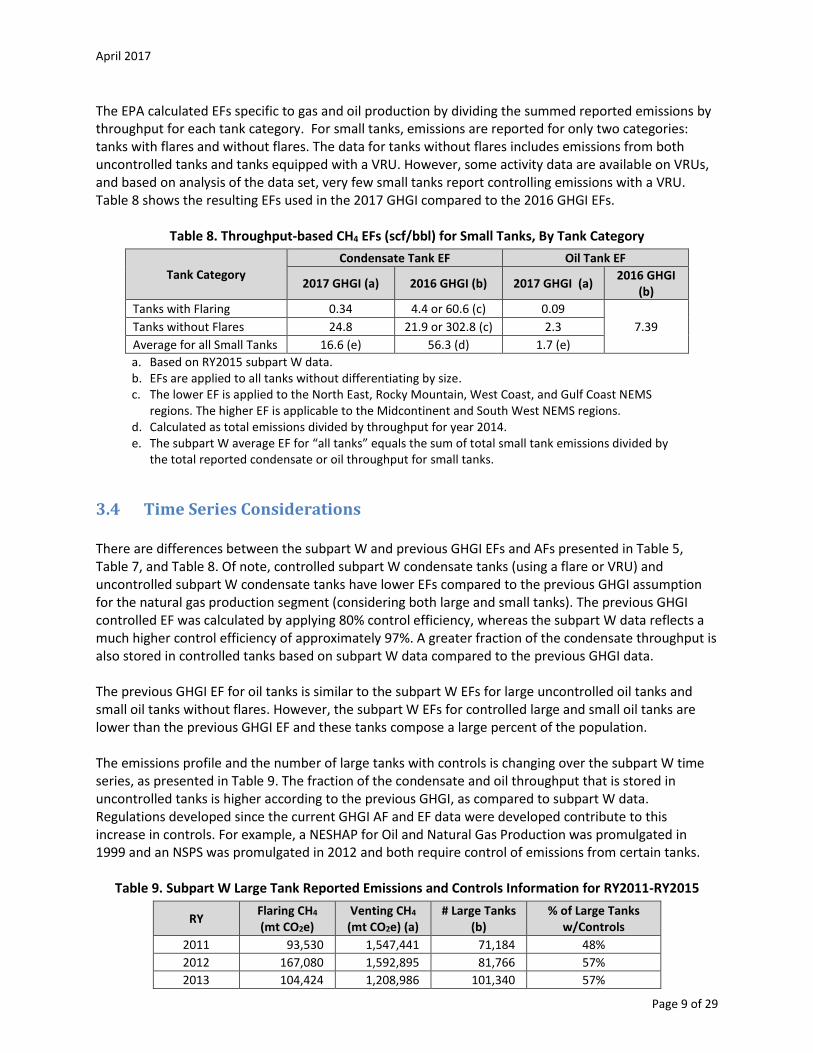
The EPA calculated EFs specific to gas and oil production by dividing the summed reported emissions by throughput for each tank category. For small tanks, emissions are reported for only two categories: tanks with flares and without flares. The data for tanks without flares includes emissions from both uncontrolled tanks and tanks equipped with a VRU. However, some activity data are available on VRUs, and based on analysis of the data set, very few small tanks report controlling emissions with a VRU. Table 8 shows the resulting EFs used in the 2017 GHGI compared to the 2016 GHGI EFs.
Table 8. Throughput-based CH4 EFs (scf/bbl) for Small Tanks, By Tank Category
Tank Category
Condensate Tank EF Oil Tank EF
2017 GHGI (a) 2016 GHGI (b) 2017 GHGI (a) 2016 GHGI
(b)
Tanks with Flaring 0.34 4.4 or 60.6 (c) 0.09
7.39 Tanks without Flares 24.8 21.9 or 302.8 (c) 2.3
Average for all Small Tanks 16.6 (e) 56.3 (d) 1.7 (e)
a. Based on RY2015 subpart W data. b. EFs are applied to all tanks without differentiating by size. c. The lower EF is applied to the North East, Rocky Mountain, West Coast, and Gulf Coast NEMS
regions. The higher EF is applicable to the Midcontinent and South West NEMS regions. d. Calculated as total emissions divided by throughput for year 2014. e. The subpart W average EF for “all tanks” equals the sum of total small tank emissions divided by
the total reported condensate or oil throughput for small tanks.
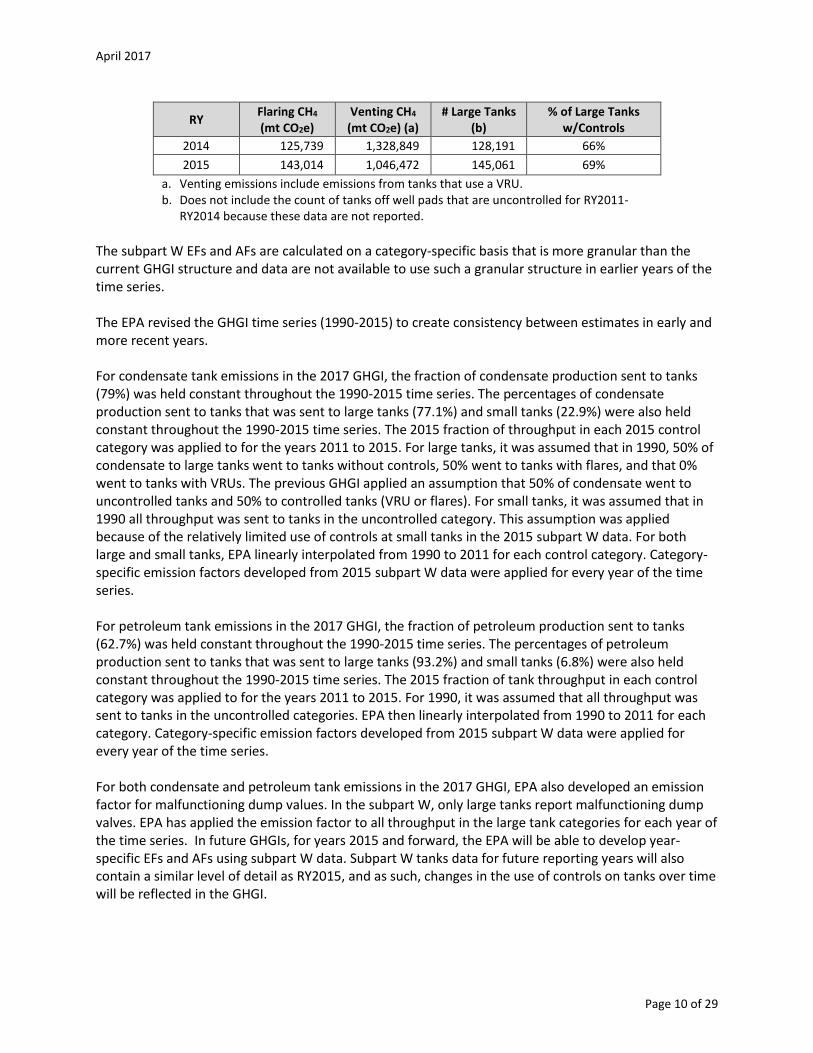
3.4 Time Series Considerations There are differences between the subpart W and previous GHGI EFs and AFs presented in Table 5, Table 7, and Table 8. Of note, controlled subpart W condensate tanks (using a flare or VRU) and uncontrolled subpart W condensate tanks have lower EFs compared to the previous GHGI assumption for the natural gas production segment (considering both large and small tanks). The previous GHGI controlled EF was calculated by applying 80% control efficiency, whereas the subpart W data reflects a much higher control efficiency of approximately 97%. A greater fraction of the condensate throughput is also stored in controlled tanks based on subpart W data compared to the previous GHGI data. The previous GHGI EF for oil tanks is similar to the subpart W EFs for large uncontrolled oil tanks and small oil tanks without flares. However, the subpart W EFs for controlled large and small oil tanks are lower than the previous GHGI EF and these tanks compose a large percent of the population. The emissions profile and the number of large tanks with controls is changing over the subpart W time series, as presented in Table 9. The fraction of the condensate and oil throughput that is stored in uncontrolled tanks is higher according to the previous GHGI, as compared to subpart W data. Regulations developed since the current GHGI AF and EF data were developed contribute to this increase in controls. For example, a NESHAP for Oil and Natural Gas Production was promulgated in 1999 and an NSPS was promulgated in 2012 and both require control of emissions from certain tanks.
Table 9. Subpart W Large Tank Reported Emissions and Controls Information for RY2011-RY2015
RY Flaring CH4 (mt CO2e)
Venting CH4 (mt CO2e) (a)
# Large Tanks (b)
% of Large Tanks w/Controls
2011 93,530 1,547,441 71,184 48%
2012 167,080 1,592,895 81,766 57%
2013 104,424 1,208,986 101,340 57%
April 2017
Page 10 of 29
RY Flaring CH4 (mt CO2e)
Venting CH4 (mt CO2e) (a)
# Large Tanks (b)
% of Large Tanks w/Controls
2014 125,739 1,328,849 128,191 66%
2015 143,014 1,046,472 145,061 69%
a. Venting emissions include emissions from tanks that use a VRU. b. Does not include the count of tanks off well pads that are uncontrolled for RY2011-
RY2014 because these data are not reported.
The subpart W EFs and AFs are calculated on a category-specific basis that is more granular than the current GHGI structure and data are not available to use such a granular structure in earlier years of the time series. The EPA revised the GHGI time series (1990-2015) to create consistency between estimates in early and more recent years. For condensate tank emissions in the 2017 GHGI, the fraction of condensate production sent to tanks (79%) was held constant throughout the 1990-2015 time series. The percentages of condensate production sent to tanks that was sent to large tanks (77.1%) and small tanks (22.9%) were also held constant throughout the 1990-2015 time series. The 2015 fraction of throughput in each 2015 control category was applied to for the years 2011 to 2015. For large tanks, it was assumed that in 1990, 50% of condensate to large tanks went to tanks without controls, 50% went to tanks with flares, and that 0% went to tanks with VRUs. The previous GHGI applied an assumption that 50% of condensate went to uncontrolled tanks and 50% to controlled tanks (VRU or flares). For small tanks, it was assumed that in 1990 all throughput was sent to tanks in the uncontrolled category. This assumption was applied because of the relatively limited use of controls at small tanks in the 2015 subpart W data. For both large and small tanks, EPA linearly interpolated from 1990 to 2011 for each control category. Category-specific emission factors developed from 2015 subpart W data were applied for every year of the time series. For petroleum tank emissions in the 2017 GHGI, the fraction of petroleum production sent to tanks (62.7%) was held constant throughout the 1990-2015 time series. The percentages of petroleum production sent to tanks that was sent to large tanks (93.2%) and small tanks (6.8%) were also held constant throughout the 1990-2015 time series. The 2015 fraction of tank throughput in each control category was applied to for the years 2011 to 2015. For 1990, it was assumed that all throughput was sent to tanks in the uncontrolled categories. EPA then linearly interpolated from 1990 to 2011 for each category. Category-specific emission factors developed from 2015 subpart W data were applied for every year of the time series. For both condensate and petroleum tank emissions in the 2017 GHGI, EPA also developed an emission factor for malfunctioning dump values. In the subpart W, only large tanks report malfunctioning dump valves. EPA has applied the emission factor to all throughput in the large tank categories for each year of the time series. In future GHGIs, for years 2015 and forward, the EPA will be able to develop year-specific EFs and AFs using subpart W data. Subpart W tanks data for future reporting years will also contain a similar level of detail as RY2015, and as such, changes in the use of controls on tanks over time will be reflected in the GHGI.
April 2017
Page 11 of 29
4. 2017 Revision to Oil Well Associated Gas Venting and Flaring
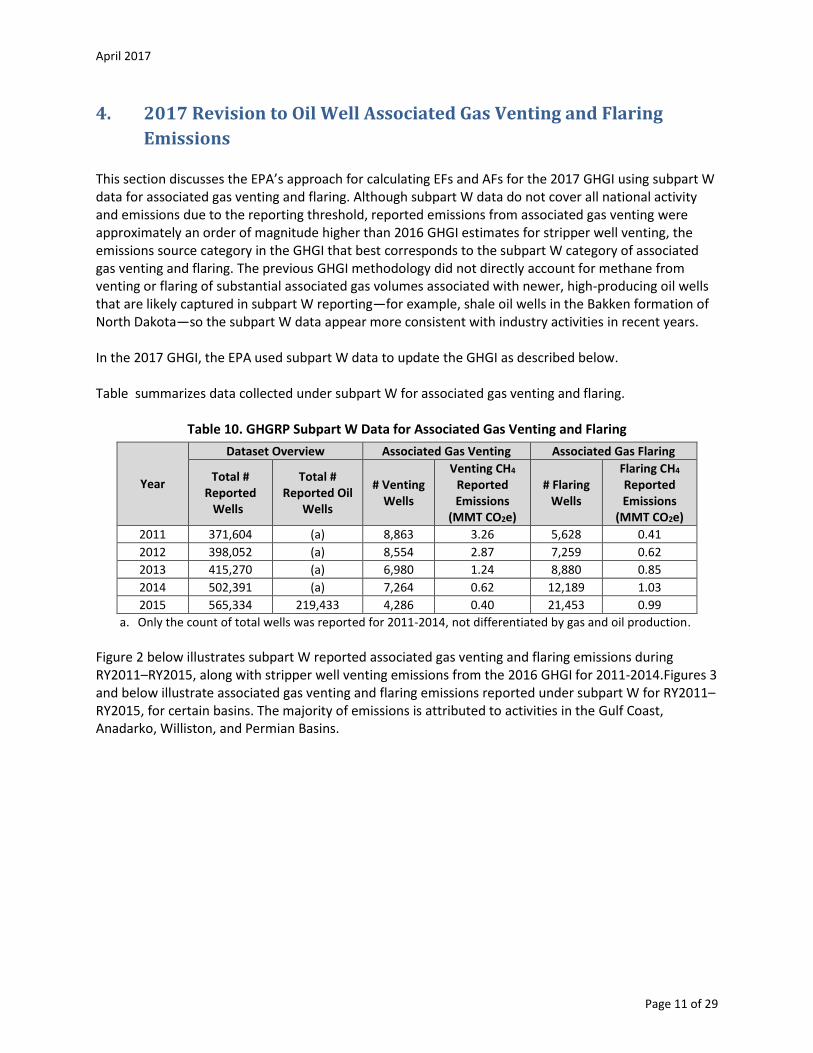
Emissions This section discusses the EPA’s approach for calculating EFs and AFs for the 2017 GHGI using subpart W data for associated gas venting and flaring. Although subpart W data do not cover all national activity and emissions due to the reporting threshold, reported emissions from associated gas venting were approximately an order of magnitude higher than 2016 GHGI estimates for stripper well venting, the emissions source category in the GHGI that best corresponds to the subpart W category of associated gas venting and flaring. The previous GHGI methodology did not directly account for methane from venting or flaring of substantial associated gas volumes associated with newer, high-producing oil wells that are likely captured in subpart W reporting—for example, shale oil wells in the Bakken formation of North Dakota—so the subpart W data appear more consistent with industry activities in recent years. In the 2017 GHGI, the EPA used subpart W data to update the GHGI as described below. Table summarizes data collected under subpart W for associated gas venting and flaring.
Table 10. GHGRP Subpart W Data for Associated Gas Venting and Flaring
Year
Dataset Overview Associated Gas Venting Associated Gas Flaring
Total # Reported
Wells
Total # Reported Oil
Wells
# Venting Wells
Venting CH4 Reported Emissions
(MMT CO2e)
# Flaring Wells
Flaring CH4 Reported Emissions
(MMT CO2e)
2011 371,604 (a) 8,863 3.26 5,628 0.41
2012 398,052 (a) 8,554 2.87 7,259 0.62
2013 415,270 (a) 6,980 1.24 8,880 0.85
2014 502,391 (a) 7,264 0.62 12,189 1.03
2015 565,334 219,433 4,286 0.40 21,453 0.99
a. Only the count of total wells was reported for 2011-2014, not differentiated by gas and oil production.
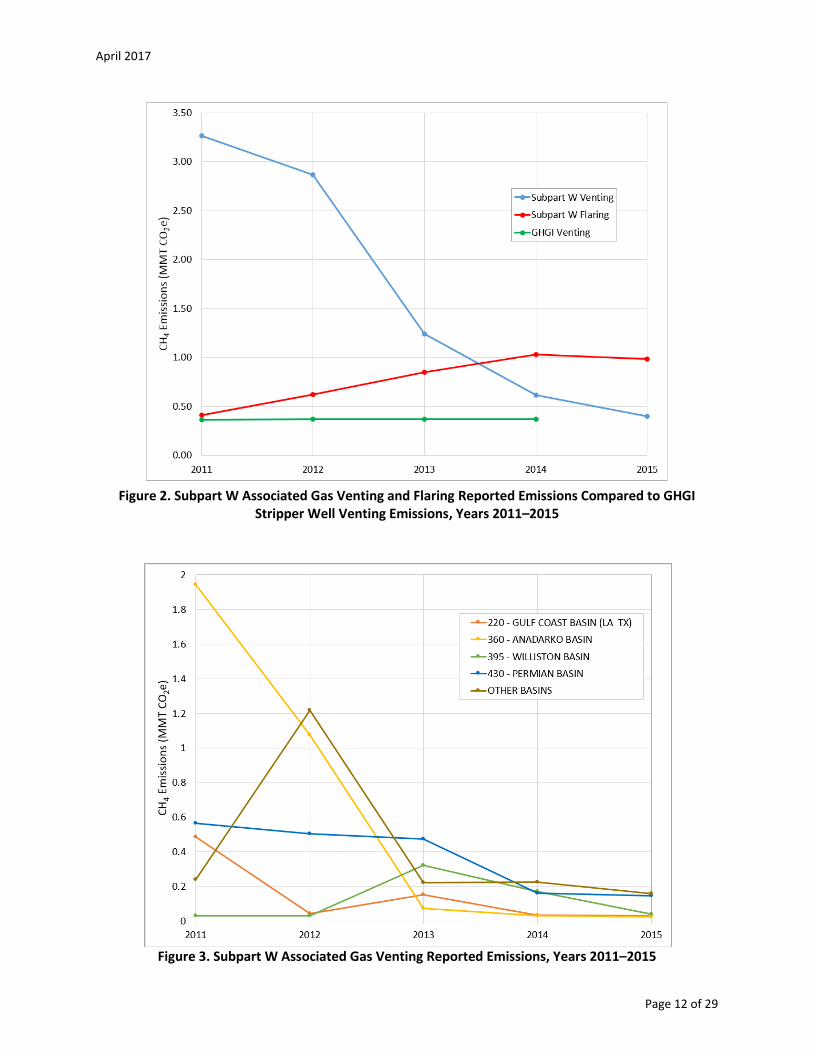
Figure 2 below illustrates subpart W reported associated gas venting and flaring emissions during RY2011–RY2015, along with stripper well venting emissions from the 2016 GHGI for 2011-2014.Figures 3 and below illustrate associated gas venting and flaring emissions reported under subpart W for RY2011–RY2015, for certain basins. The majority of emissions is attributed to activities in the Gulf Coast, Anadarko, Williston, and Permian Basins.
April 2017
Page 12 of 29
Figure 2. Subpart W Associated Gas Venting and Flaring Reported Emissions Compared to GHGI
Stripper Well Venting Emissions, Years 2011–2015
Figure 3. Subpart W Associated Gas Venting Reported Emissions, Years 2011–2015
April 2017
Page 13 of 29
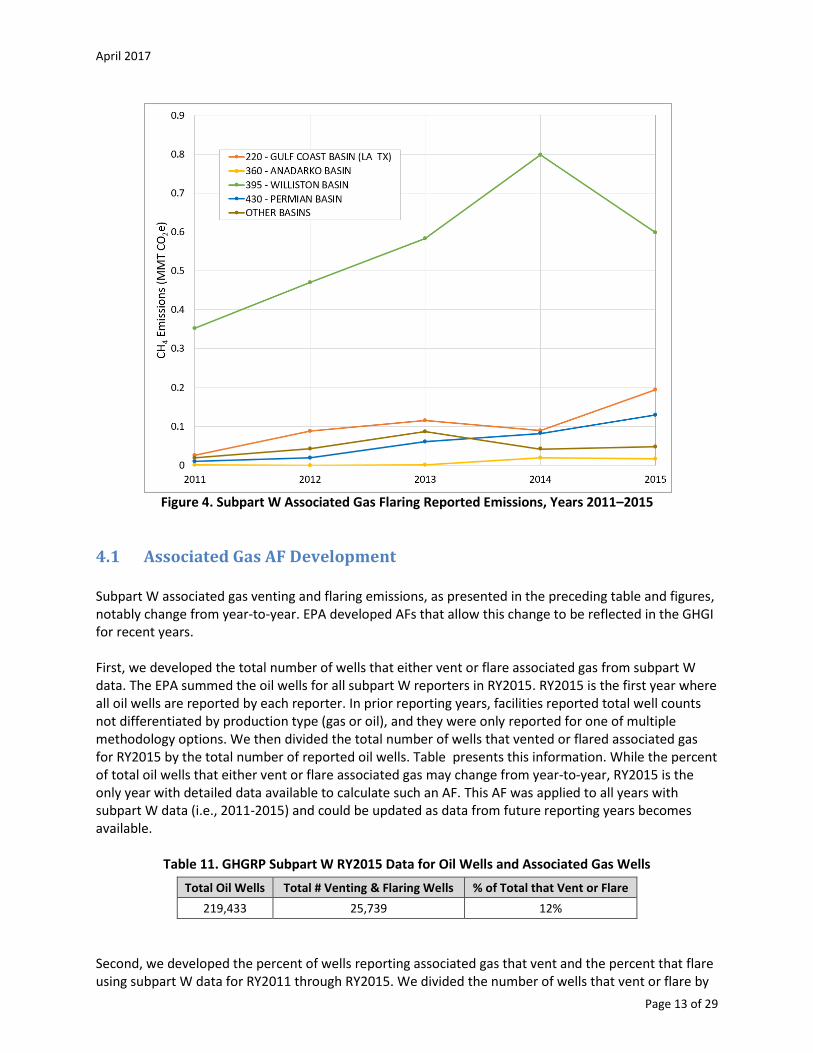
Figure 4. Subpart W Associated Gas Flaring Reported Emissions, Years 2011–2015
4.1 Associated Gas AF Development Subpart W associated gas venting and flaring emissions, as presented in the preceding table and figures, notably change from year-to-year. EPA developed AFs that allow this change to be reflected in the GHGI for recent years. First, we developed the total number of wells that either vent or flare associated gas from subpart W data. The EPA summed the oil wells for all subpart W reporters in RY2015. RY2015 is the first year where all oil wells are reported by each reporter. In prior reporting years, facilities reported total well counts not differentiated by production type (gas or oil), and they were only reported for one of multiple methodology options. We then divided the total number of wells that vented or flared associated gas for RY2015 by the total number of reported oil wells. Table presents this information. While the percent of total oil wells that either vent or flare associated gas may change from year-to-year, RY2015 is the only year with detailed data available to calculate such an AF. This AF was applied to all years with subpart W data (i.e., 2011-2015) and could be updated as data from future reporting years becomes available.
Table 11. GHGRP Subpart W RY2015 Data for Oil Wells and Associated Gas Wells
Total Oil Wells Total # Venting & Flaring Wells % of Total that Vent or Flare
219,433 25,739 12%
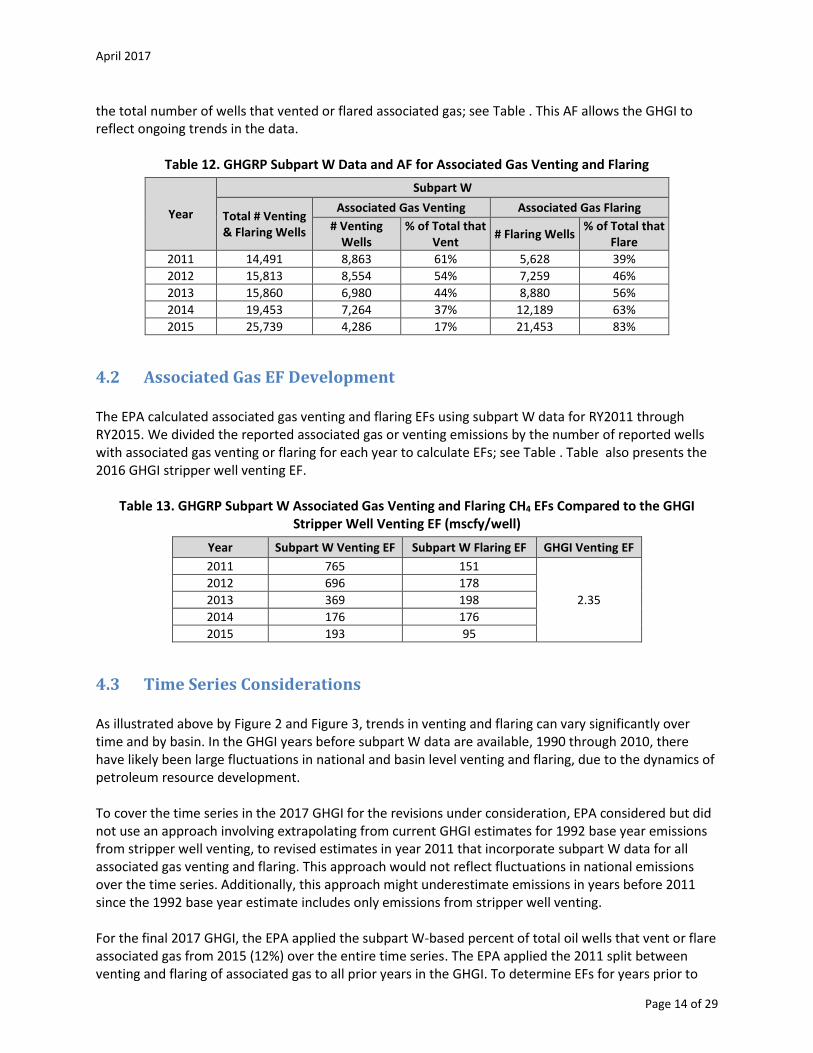
Second, we developed the percent of wells reporting associated gas that vent and the percent that flare using subpart W data for RY2011 through RY2015. We divided the number of wells that vent or flare by
April 2017
Page 14 of 29
the total number of wells that vented or flared associated gas; see Table . This AF allows the GHGI to reflect ongoing trends in the data.
Table 12. GHGRP Subpart W Data and AF for Associated Gas Venting and Flaring
Year
Subpart W
Total # Venting & Flaring Wells
Associated Gas Venting Associated Gas Flaring
# Venting Wells
% of Total that Vent
# Flaring Wells % of Total that
Flare
2011 14,491 8,863 61% 5,628 39%
2012 15,813 8,554 54% 7,259 46%
2013 15,860 6,980 44% 8,880 56%
2014 19,453 7,264 37% 12,189 63%
2015 25,739 4,286 17% 21,453 83%
4.2 Associated Gas EF Development The EPA calculated associated gas venting and flaring EFs using subpart W data for RY2011 through RY2015. We divided the reported associated gas or venting emissions by the number of reported wells with associated gas venting or flaring for each year to calculate EFs; see Table . Table also presents the 2016 GHGI stripper well venting EF.
Table 13. GHGRP Subpart W Associated Gas Venting and Flaring CH4 EFs Compared to the GHGI Stripper Well Venting EF (mscfy/well)
Year Subpart W Venting EF Subpart W Flaring EF GHGI Venting EF
2011 765 151
2.35
2012 696 178
2013 369 198
2014 176 176
2015 193 95
4.3 Time Series Considerations As illustrated above by Figure 2 and Figure 3, trends in venting and flaring can vary significantly over time and by basin. In the GHGI years before subpart W data are available, 1990 through 2010, there have likely been large fluctuations in national and basin level venting and flaring, due to the dynamics of petroleum resource development. To cover the time series in the 2017 GHGI for the revisions under consideration, EPA considered but did not use an approach involving extrapolating from current GHGI estimates for 1992 base year emissions from stripper well venting, to revised estimates in year 2011 that incorporate subpart W data for all associated gas venting and flaring. This approach would not reflect fluctuations in national emissions over the time series. Additionally, this approach might underestimate emissions in years before 2011 since the 1992 base year estimate includes only emissions from stripper well venting. For the final 2017 GHGI, the EPA applied the subpart W-based percent of total oil wells that vent or flare associated gas from 2015 (12%) over the entire time series. The EPA applied the 2011 split between venting and flaring of associated gas to all prior years in the GHGI. To determine EFs for years prior to
April 2017
Page 15 of 29
2011, the EPA applied the 2011 subpart W EFs. For 2011-2015, EPA used year-specific AD and EF from subpart W. The EPA continues to seek stakeholder feedback on potential approaches or data sources that could be used to improve the time series for associated gas venting and flaring. For example, it may be possible to reflect impacts of state regulations in the time series.
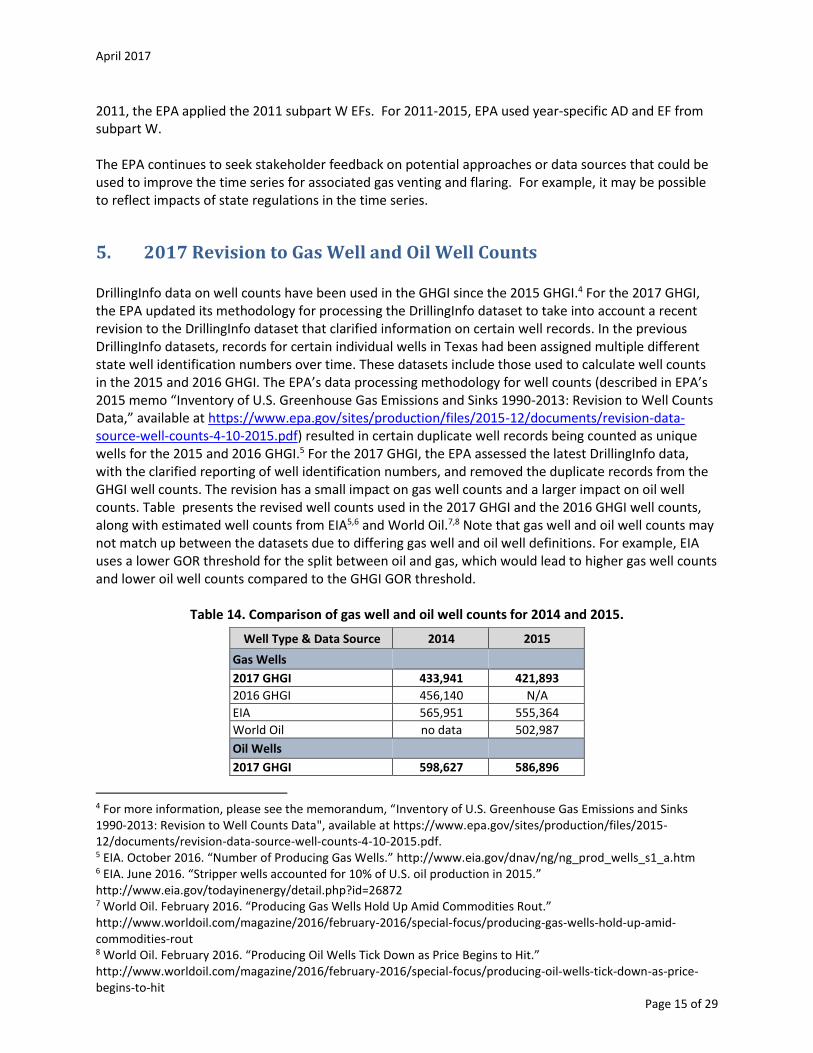
5. 2017 Revision to Gas Well and Oil Well Counts DrillingInfo data on well counts have been used in the GHGI since the 2015 GHGI.4 For the 2017 GHGI, the EPA updated its methodology for processing the DrillingInfo dataset to take into account a recent revision to the DrillingInfo dataset that clarified information on certain well records. In the previous DrillingInfo datasets, records for certain individual wells in Texas had been assigned multiple different state well identification numbers over time. These datasets include those used to calculate well counts in the 2015 and 2016 GHGI. The EPA’s data processing methodology for well counts (described in EPA’s 2015 memo “Inventory of U.S. Greenhouse Gas Emissions and Sinks 1990-2013: Revision to Well Counts Data,” available at https://www.epa.gov/sites/production/files/2015-12/documents/revision-data-source-well-counts-4-10-2015.pdf) resulted in certain duplicate well records being counted as unique wells for the 2015 and 2016 GHGI.5 For the 2017 GHGI, the EPA assessed the latest DrillingInfo data, with the clarified reporting of well identification numbers, and removed the duplicate records from the GHGI well counts. The revision has a small impact on gas well counts and a larger impact on oil well counts. Table presents the revised well counts used in the 2017 GHGI and the 2016 GHGI well counts, along with estimated well counts from EIA5,6 and World Oil.7,8 Note that gas well and oil well counts may not match up between the datasets due to differing gas well and oil well definitions. For example, EIA uses a lower GOR threshold for the split between oil and gas, which would lead to higher gas well counts and lower oil well counts compared to the GHGI GOR threshold.
Table 14. Comparison of gas well and oil well counts for 2014 and 2015.
Well Type & Data Source 2014 2015
Gas Wells
2017 GHGI 433,941 421,893
2016 GHGI 456,140 N/A
EIA 565,951 555,364
World Oil no data 502,987
Oil Wells
2017 GHGI 598,627 586,896
4 For more information, please see the memorandum, “Inventory of U.S. Greenhouse Gas Emissions and Sinks 1990-2013: Revision to Well Counts Data", available at https://www.epa.gov/sites/production/files/2015-12/documents/revision-data-source-well-counts-4-10-2015.pdf. 5 EIA. October 2016. “Number of Producing Gas Wells.” http://www.eia.gov/dnav/ng/ng_prod_wells_s1_a.htm 6 EIA. June 2016. “Stripper wells accounted for 10% of U.S. oil production in 2015.” http://www.eia.gov/todayinenergy/detail.php?id=26872 7 World Oil. February 2016. “Producing Gas Wells Hold Up Amid Commodities Rout.” http://www.worldoil.com/magazine/2016/february-2016/special-focus/producing-gas-wells-hold-up-amid-commodities-rout 8 World Oil. February 2016. “Producing Oil Wells Tick Down as Price Begins to Hit.” http://www.worldoil.com/magazine/2016/february-2016/special-focus/producing-oil-wells-tick-down-as-price-begins-to-hit
April 2017
Page 16 of 29
Well Type & Data Source 2014 2015
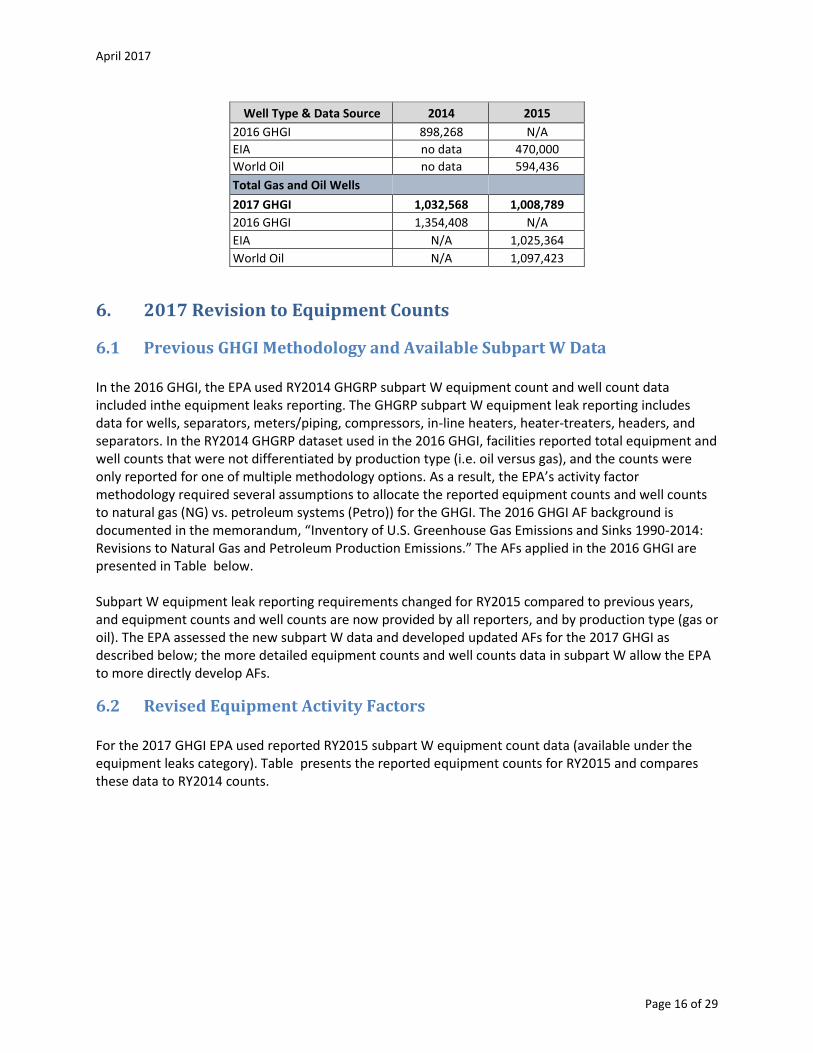
2016 GHGI 898,268 N/A
EIA no data 470,000
World Oil no data 594,436
Total Gas and Oil Wells
2017 GHGI 1,032,568 1,008,789
2016 GHGI 1,354,408 N/A
EIA N/A 1,025,364
World Oil N/A 1,097,423
6. 2017 Revision to Equipment Counts
6.1 Previous GHGI Methodology and Available Subpart W Data In the 2016 GHGI, the EPA used RY2014 GHGRP subpart W equipment count and well count data included inthe equipment leaks reporting. The GHGRP subpart W equipment leak reporting includes data for wells, separators, meters/piping, compressors, in-line heaters, heater-treaters, headers, and separators. In the RY2014 GHGRP dataset used in the 2016 GHGI, facilities reported total equipment and well counts that were not differentiated by production type (i.e. oil versus gas), and the counts were only reported for one of multiple methodology options. As a result, the EPA’s activity factor methodology required several assumptions to allocate the reported equipment counts and well counts to natural gas (NG) vs. petroleum systems (Petro)) for the GHGI. The 2016 GHGI AF background is documented in the memorandum, “Inventory of U.S. Greenhouse Gas Emissions and Sinks 1990-2014: Revisions to Natural Gas and Petroleum Production Emissions.” The AFs applied in the 2016 GHGI are presented in Table below. Subpart W equipment leak reporting requirements changed for RY2015 compared to previous years, and equipment counts and well counts are now provided by all reporters, and by production type (gas or oil). The EPA assessed the new subpart W data and developed updated AFs for the 2017 GHGI as described below; the more detailed equipment counts and well counts data in subpart W allow the EPA to more directly develop AFs.
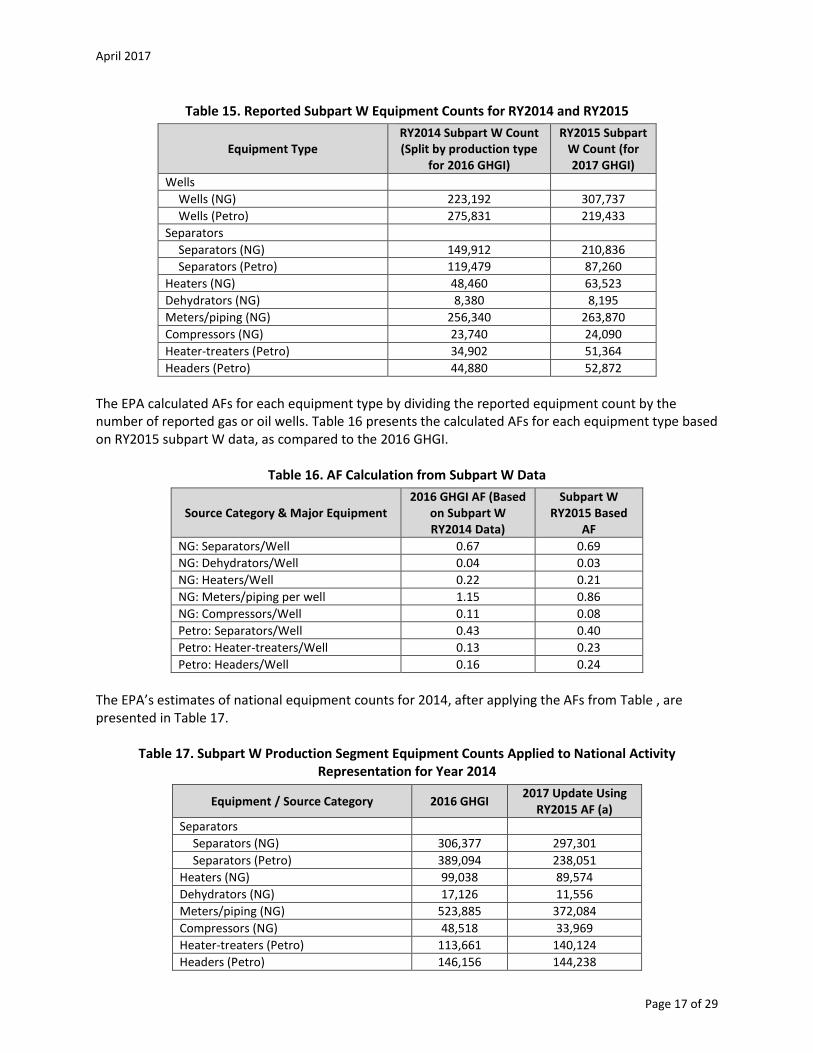
6.2 Revised Equipment Activity Factors For the 2017 GHGI EPA used reported RY2015 subpart W equipment count data (available under the equipment leaks category). Table presents the reported equipment counts for RY2015 and compares these data to RY2014 counts.
April 2017
Page 17 of 29
Table 15. Reported Subpart W Equipment Counts for RY2014 and RY2015
Equipment Type RY2014 Subpart W Count (Split by production type
for 2016 GHGI)
RY2015 Subpart W Count (for 2017 GHGI)
Wells
Wells (NG) 223,192 307,737
Wells (Petro) 275,831 219,433
Separators
Separators (NG) 149,912 210,836
Separators (Petro) 119,479 87,260
Heaters (NG) 48,460 63,523
Dehydrators (NG) 8,380 8,195
Meters/piping (NG) 256,340 263,870
Compressors (NG) 23,740 24,090
Heater-treaters (Petro) 34,902 51,364
Headers (Petro) 44,880 52,872
The EPA calculated AFs for each equipment type by dividing the reported equipment count by the number of reported gas or oil wells. Table 16 presents the calculated AFs for each equipment type based on RY2015 subpart W data, as compared to the 2016 GHGI.
Table 16. AF Calculation from Subpart W Data
Source Category & Major Equipment 2016 GHGI AF (Based
on Subpart W RY2014 Data)
Subpart W RY2015 Based
AF
NG: Separators/Well 0.67 0.69
NG: Dehydrators/Well 0.04 0.03
NG: Heaters/Well 0.22 0.21
NG: Meters/piping per well 1.15 0.86
NG: Compressors/Well 0.11 0.08
Petro: Separators/Well 0.43 0.40
Petro: Heater-treaters/Well 0.13 0.23
Petro: Headers/Well 0.16 0.24
The EPA’s estimates of national equipment counts for 2014, after applying the AFs from Table , are presented in Table 17.
Table 17. Subpart W Production Segment Equipment Counts Applied to National Activity Representation for Year 2014
Equipment / Source Category 2016 GHGI 2017 Update Using
RY2015 AF (a)
Separators
Separators (NG) 306,377 297,301
Separators (Petro) 389,094 238,051
Heaters (NG) 99,038 89,574
Dehydrators (NG) 17,126 11,556
Meters/piping (NG) 523,885 372,084
Compressors (NG) 48,518 33,969
Heater-treaters (Petro) 113,661 140,124
Headers (Petro) 146,156 144,238
April 2017
Page 18 of 29
a. Equipment counts are calculated using the revised 2014 national gas well (433,941) and oil well (598,627) counts, as discussed in section 6.
In addition, for the 2017 GHGI, EPA used the latest subpart W data on equipment counts for other production sources that previously used subpart W data, such as pneumatic controllers and pumps, using the same approach as the 2016 GHGI. Well count data associated with these sources are not reported by production type in 2015 (i.e. the same information for data relevant to the GHGI is available for 2015 as for 2014 for these sources) so the method has not changed for these sources.
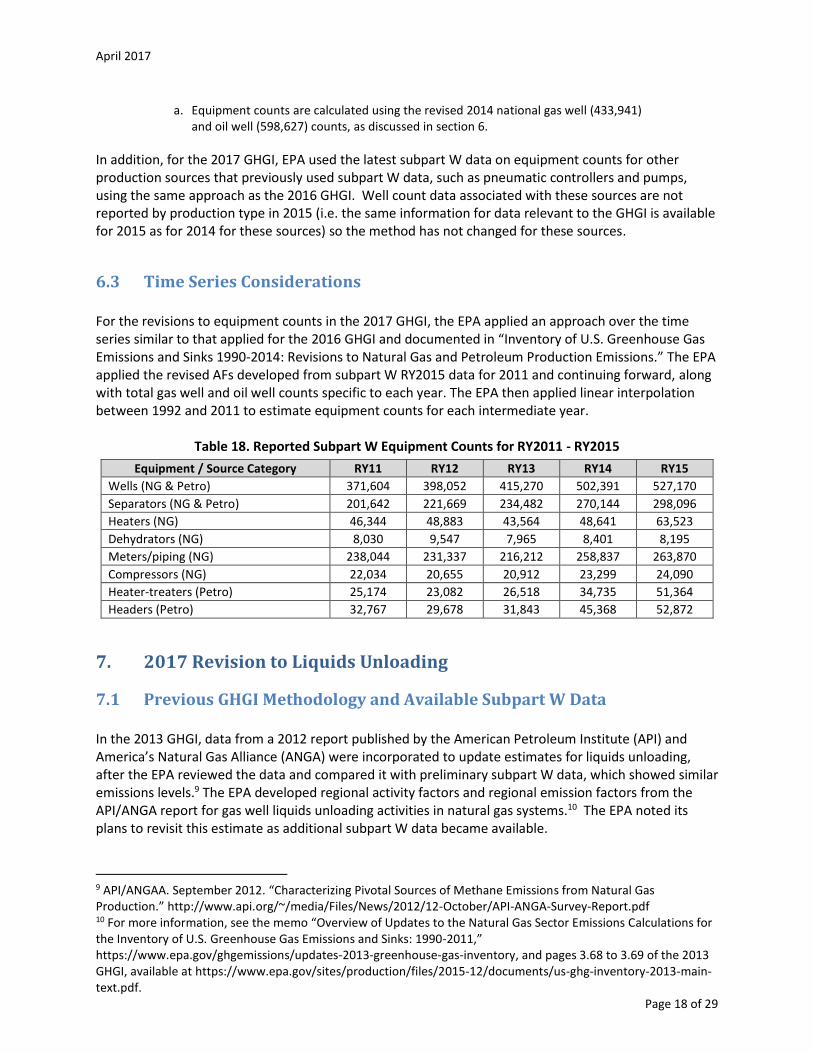
6.3 Time Series Considerations For the revisions to equipment counts in the 2017 GHGI, the EPA applied an approach over the time series similar to that applied for the 2016 GHGI and documented in “Inventory of U.S. Greenhouse Gas Emissions and Sinks 1990-2014: Revisions to Natural Gas and Petroleum Production Emissions.” The EPA applied the revised AFs developed from subpart W RY2015 data for 2011 and continuing forward, along with total gas well and oil well counts specific to each year. The EPA then applied linear interpolation between 1992 and 2011 to estimate equipment counts for each intermediate year.
Table 18. Reported Subpart W Equipment Counts for RY2011 - RY2015
Equipment / Source Category RY11 RY12 RY13 RY14 RY15
Wells (NG & Petro) 371,604 398,052 415,270 502,391 527,170
Separators (NG & Petro) 201,642 221,669 234,482 270,144 298,096
Heaters (NG) 46,344 48,883 43,564 48,641 63,523
Dehydrators (NG) 8,030 9,547 7,965 8,401 8,195
Meters/piping (NG) 238,044 231,337 216,212 258,837 263,870
Compressors (NG) 22,034 20,655 20,912 23,299 24,090
Heater-treaters (Petro) 25,174 23,082 26,518 34,735 51,364
Headers (Petro) 32,767 29,678 31,843 45,368 52,872
7. 2017 Revision to Liquids Unloading
7.1 Previous GHGI Methodology and Available Subpart W Data In the 2013 GHGI, data from a 2012 report published by the American Petroleum Institute (API) and America’s Natural Gas Alliance (ANGA) were incorporated to update estimates for liquids unloading, after the EPA reviewed the data and compared it with preliminary subpart W data, which showed similar emissions levels.9 The EPA developed regional activity factors and regional emission factors from the API/ANGA report for gas well liquids unloading activities in natural gas systems.10 The EPA noted its plans to revisit this estimate as additional subpart W data became available.
9 API/ANGAA. September 2012. “Characterizing Pivotal Sources of Methane Emissions from Natural Gas Production.” http://www.api.org/~/media/Files/News/2012/12-October/API-ANGA-Survey-Report.pdf 10 For more information, see the memo “Overview of Updates to the Natural Gas Sector Emissions Calculations for the Inventory of U.S. Greenhouse Gas Emissions and Sinks: 1990-2011,” https://www.epa.gov/ghgemissions/updates-2013-greenhouse-gas-inventory, and pages 3.68 to 3.69 of the 2013 GHGI, available at https://www.epa.gov/sites/production/files/2015-12/documents/us-ghg-inventory-2013-main-text.pdf.
April 2017
Page 19 of 29
Liquids unloading data are reported under subpart W of the GHGRP, including the number of wells vented, the number of unloading events, whether plunger lifts were used, and CH4 emissions. Well counts are reported under the equipment leak reporting section of subpart W, and the 2015 reporting year data distinguishes between oil and gas well counts, which improves the data available to develop activity data for liquids unloading. The EPA assessed the subpart W data and developed revised EFs and AFs for the 2017 GHGI.
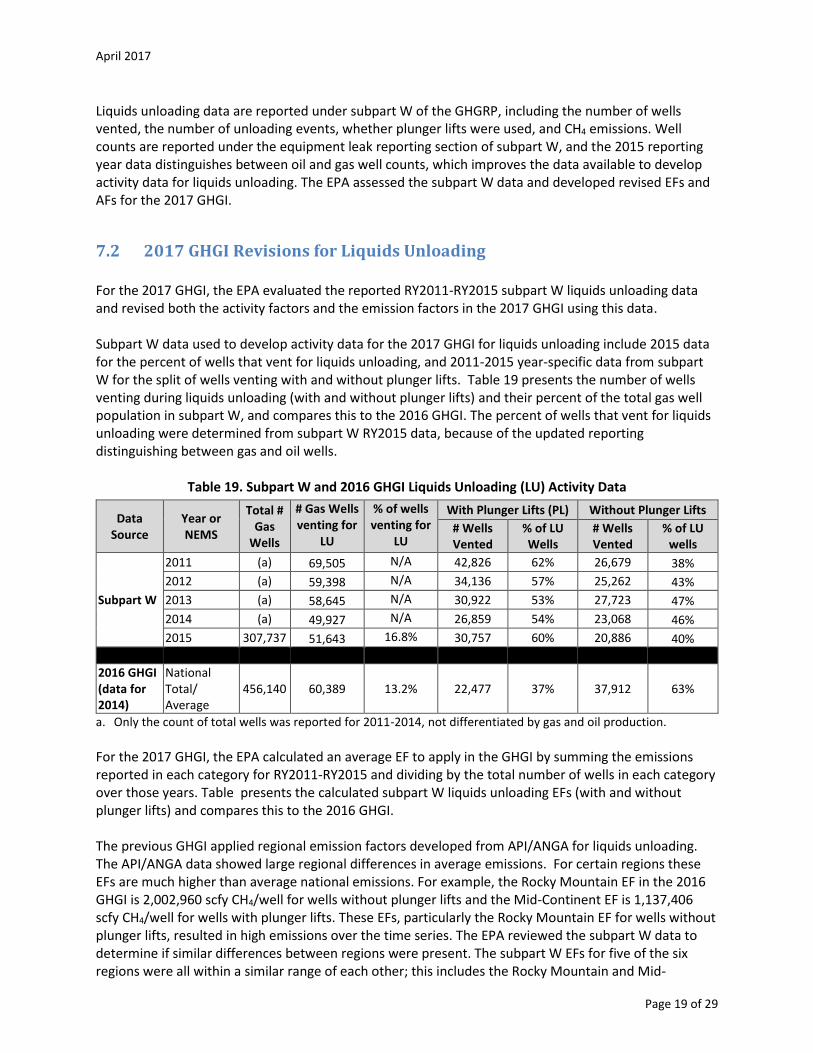
7.2 2017 GHGI Revisions for Liquids Unloading For the 2017 GHGI, the EPA evaluated the reported RY2011-RY2015 subpart W liquids unloading data and revised both the activity factors and the emission factors in the 2017 GHGI using this data. Subpart W data used to develop activity data for the 2017 GHGI for liquids unloading include 2015 data for the percent of wells that vent for liquids unloading, and 2011-2015 year-specific data from subpart W for the split of wells venting with and without plunger lifts. Table 19 presents the number of wells venting during liquids unloading (with and without plunger lifts) and their percent of the total gas well population in subpart W, and compares this to the 2016 GHGI. The percent of wells that vent for liquids unloading were determined from subpart W RY2015 data, because of the updated reporting distinguishing between gas and oil wells.
Table 19. Subpart W and 2016 GHGI Liquids Unloading (LU) Activity Data
Data Source
Year or NEMS
Total # Gas
Wells
# Gas Wells venting for
LU
% of wells venting for
LU
With Plunger Lifts (PL) Without Plunger Lifts
# Wells Vented
% of LU Wells
# Wells Vented
% of LU wells
Subpart W
2011 (a) 69,505 N/A 42,826 62% 26,679 38%
2012 (a) 59,398 N/A 34,136 57% 25,262 43%
2013 (a) 58,645 N/A 30,922 53% 27,723 47%
2014 (a) 49,927 N/A 26,859 54% 23,068 46%
2015 307,737 51,643 16.8% 30,757 60% 20,886 40%
2016 GHGI (data for 2014)
National Total/ Average
456,140 60,389 13.2% 22,477 37% 37,912 63%
a. Only the count of total wells was reported for 2011-2014, not differentiated by gas and oil production.
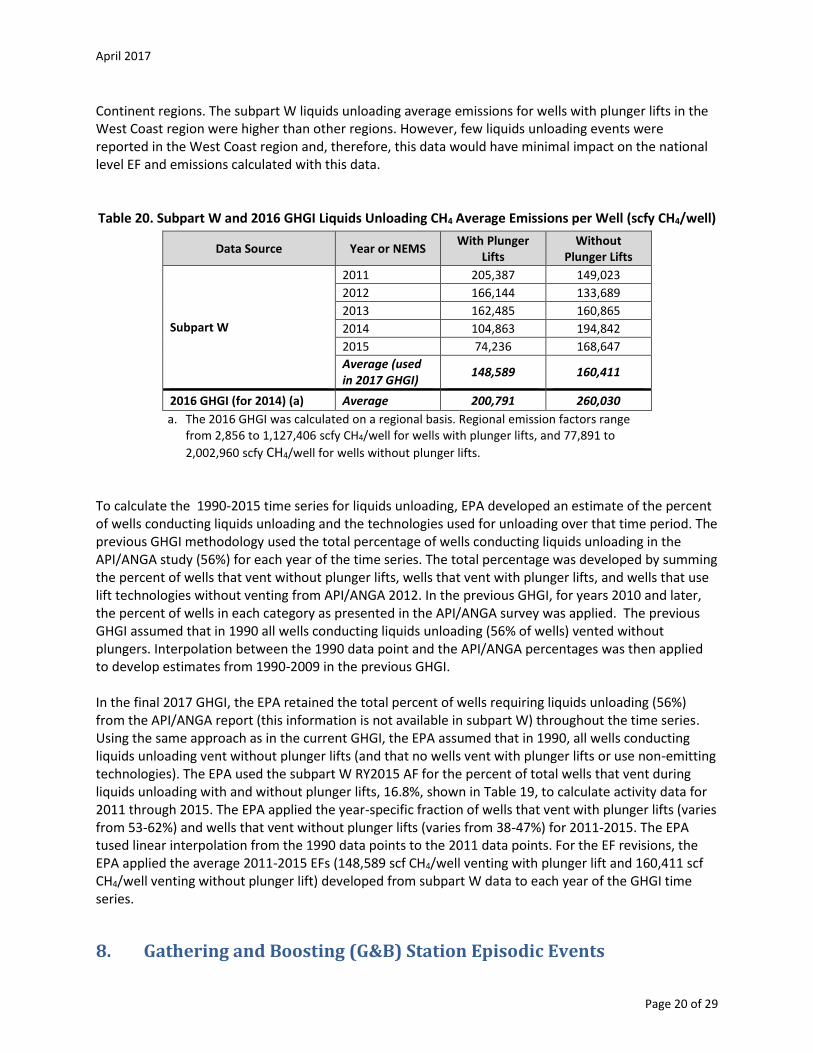
For the 2017 GHGI, the EPA calculated an average EF to apply in the GHGI by summing the emissions reported in each category for RY2011-RY2015 and dividing by the total number of wells in each category over those years. Table presents the calculated subpart W liquids unloading EFs (with and without plunger lifts) and compares this to the 2016 GHGI. The previous GHGI applied regional emission factors developed from API/ANGA for liquids unloading. The API/ANGA data showed large regional differences in average emissions. For certain regions these EFs are much higher than average national emissions. For example, the Rocky Mountain EF in the 2016 GHGI is 2,002,960 scfy CH4/well for wells without plunger lifts and the Mid-Continent EF is 1,137,406 scfy CH4/well for wells with plunger lifts. These EFs, particularly the Rocky Mountain EF for wells without plunger lifts, resulted in high emissions over the time series. The EPA reviewed the subpart W data to determine if similar differences between regions were present. The subpart W EFs for five of the six regions were all within a similar range of each other; this includes the Rocky Mountain and Mid-
April 2017
Page 20 of 29
Continent regions. The subpart W liquids unloading average emissions for wells with plunger lifts in the West Coast region were higher than other regions. However, few liquids unloading events were reported in the West Coast region and, therefore, this data would have minimal impact on the national level EF and emissions calculated with this data. Table 20. Subpart W and 2016 GHGI Liquids Unloading CH4 Average Emissions per Well (scfy CH4/well)
Data Source Year or NEMS With Plunger
Lifts Without
Plunger Lifts
Subpart W
2011 205,387 149,023
2012 166,144 133,689
2013 162,485 160,865
2014 104,863 194,842
2015 74,236 168,647
Average (used in 2017 GHGI)
148,589 160,411
2016 GHGI (for 2014) (a) Average 200,791 260,030
a. The 2016 GHGI was calculated on a regional basis. Regional emission factors range from 2,856 to 1,127,406 scfy CH4/well for wells with plunger lifts, and 77,891 to
2,002,960 scfy CH4/well for wells without plunger lifts.
To calculate the 1990-2015 time series for liquids unloading, EPA developed an estimate of the percent of wells conducting liquids unloading and the technologies used for unloading over that time period. The previous GHGI methodology used the total percentage of wells conducting liquids unloading in the API/ANGA study (56%) for each year of the time series. The total percentage was developed by summing the percent of wells that vent without plunger lifts, wells that vent with plunger lifts, and wells that use lift technologies without venting from API/ANGA 2012. In the previous GHGI, for years 2010 and later, the percent of wells in each category as presented in the API/ANGA survey was applied. The previous GHGI assumed that in 1990 all wells conducting liquids unloading (56% of wells) vented without plungers. Interpolation between the 1990 data point and the API/ANGA percentages was then applied to develop estimates from 1990-2009 in the previous GHGI. In the final 2017 GHGI, the EPA retained the total percent of wells requiring liquids unloading (56%) from the API/ANGA report (this information is not available in subpart W) throughout the time series. Using the same approach as in the current GHGI, the EPA assumed that in 1990, all wells conducting liquids unloading vent without plunger lifts (and that no wells vent with plunger lifts or use non-emitting technologies). The EPA used the subpart W RY2015 AF for the percent of total wells that vent during liquids unloading with and without plunger lifts, 16.8%, shown in Table 19, to calculate activity data for 2011 through 2015. The EPA applied the year-specific fraction of wells that vent with plunger lifts (varies from 53-62%) and wells that vent without plunger lifts (varies from 38-47%) for 2011-2015. The EPA tused linear interpolation from the 1990 data points to the 2011 data points. For the EF revisions, the EPA applied the average 2011-2015 EFs (148,589 scf CH4/well venting with plunger lift and 160,411 scf CH4/well venting without plunger lift) developed from subpart W data to each year of the GHGI time series.
8. Gathering and Boosting (G&B) Station Episodic Events
April 2017
Page 21 of 29
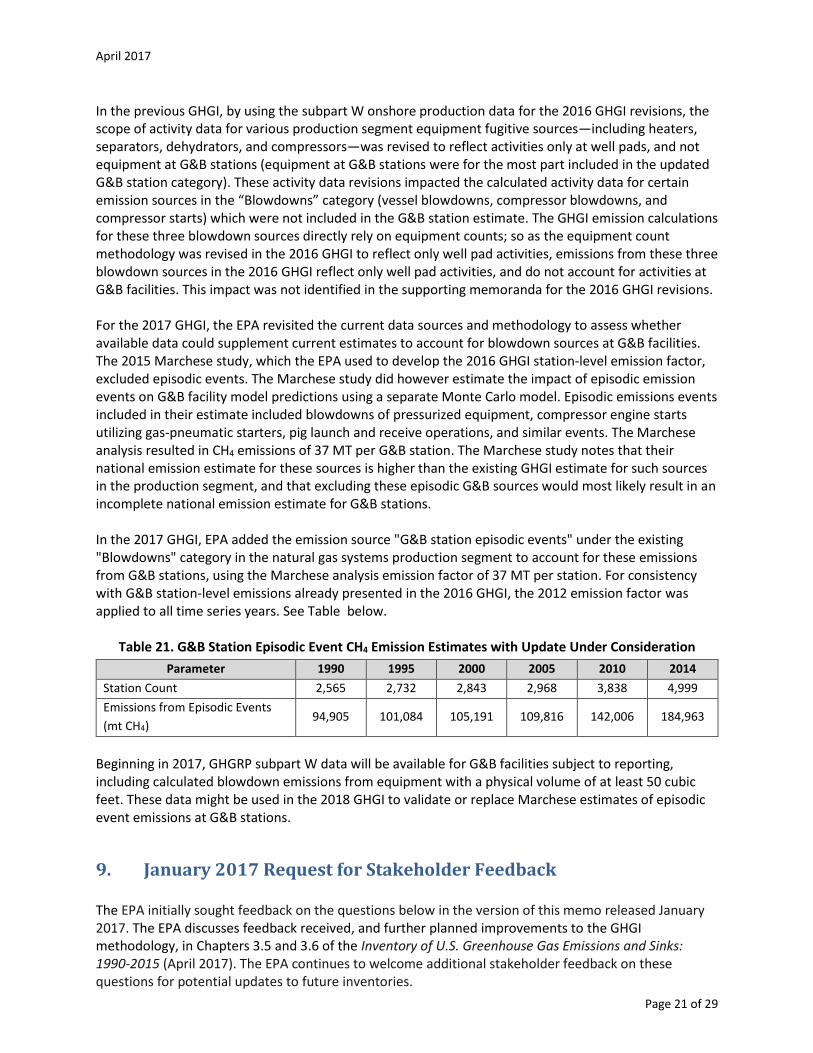
In the previous GHGI, by using the subpart W onshore production data for the 2016 GHGI revisions, the scope of activity data for various production segment equipment fugitive sources—including heaters, separators, dehydrators, and compressors—was revised to reflect activities only at well pads, and not equipment at G&B stations (equipment at G&B stations were for the most part included in the updated G&B station category). These activity data revisions impacted the calculated activity data for certain emission sources in the “Blowdowns” category (vessel blowdowns, compressor blowdowns, and compressor starts) which were not included in the G&B station estimate. The GHGI emission calculations for these three blowdown sources directly rely on equipment counts; so as the equipment count methodology was revised in the 2016 GHGI to reflect only well pad activities, emissions from these three blowdown sources in the 2016 GHGI reflect only well pad activities, and do not account for activities at G&B facilities. This impact was not identified in the supporting memoranda for the 2016 GHGI revisions. For the 2017 GHGI, the EPA revisited the current data sources and methodology to assess whether available data could supplement current estimates to account for blowdown sources at G&B facilities. The 2015 Marchese study, which the EPA used to develop the 2016 GHGI station-level emission factor, excluded episodic events. The Marchese study did however estimate the impact of episodic emission events on G&B facility model predictions using a separate Monte Carlo model. Episodic emissions events included in their estimate included blowdowns of pressurized equipment, compressor engine starts utilizing gas-pneumatic starters, pig launch and receive operations, and similar events. The Marchese analysis resulted in CH4 emissions of 37 MT per G&B station. The Marchese study notes that their national emission estimate for these sources is higher than the existing GHGI estimate for such sources in the production segment, and that excluding these episodic G&B sources would most likely result in an incomplete national emission estimate for G&B stations. In the 2017 GHGI, EPA added the emission source "G&B station episodic events" under the existing "Blowdowns" category in the natural gas systems production segment to account for these emissions from G&B stations, using the Marchese analysis emission factor of 37 MT per station. For consistency with G&B station-level emissions already presented in the 2016 GHGI, the 2012 emission factor was applied to all time series years. See Table below.
Table 21. G&B Station Episodic Event CH4 Emission Estimates with Update Under Consideration
Parameter 1990 1995 2000 2005 2010 2014
Station Count 2,565 2,732 2,843 2,968 3,838 4,999
Emissions from Episodic Events
(mt CH4) 94,905 101,084 105,191 109,816 142,006 184,963
Beginning in 2017, GHGRP subpart W data will be available for G&B facilities subject to reporting, including calculated blowdown emissions from equipment with a physical volume of at least 50 cubic feet. These data might be used in the 2018 GHGI to validate or replace Marchese estimates of episodic event emissions at G&B stations.
9. January 2017 Request for Stakeholder Feedback The EPA initially sought feedback on the questions below in the version of this memo released January 2017. The EPA discusses feedback received, and further planned improvements to the GHGI methodology, in Chapters 3.5 and 3.6 of the Inventory of U.S. Greenhouse Gas Emissions and Sinks: 1990-2015 (April 2017). The EPA continues to welcome additional stakeholder feedback on these questions for potential updates to future inventories.
April 2017
Page 22 of 29
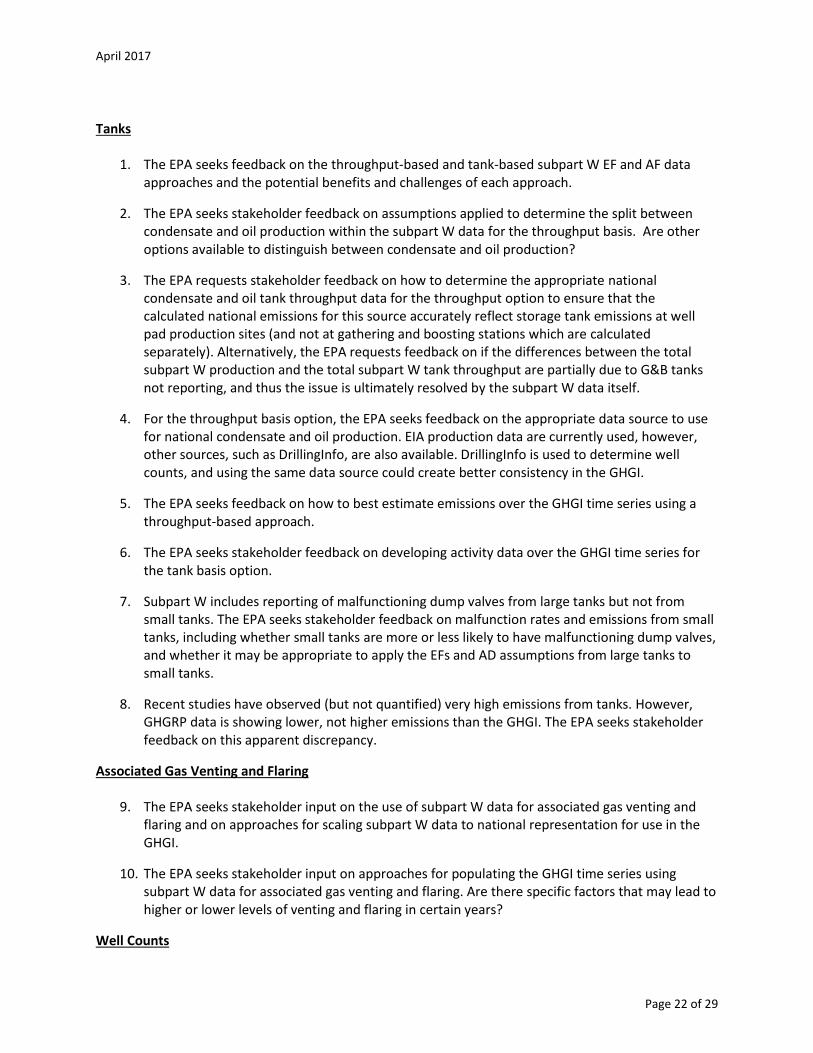
Tanks
1. The EPA seeks feedback on the throughput-based and tank-based subpart W EF and AF data approaches and the potential benefits and challenges of each approach.
2. The EPA seeks stakeholder feedback on assumptions applied to determine the split between condensate and oil production within the subpart W data for the throughput basis. Are other options available to distinguish between condensate and oil production?
3. The EPA requests stakeholder feedback on how to determine the appropriate national condensate and oil tank throughput data for the throughput option to ensure that the calculated national emissions for this source accurately reflect storage tank emissions at well pad production sites (and not at gathering and boosting stations which are calculated separately). Alternatively, the EPA requests feedback on if the differences between the total subpart W production and the total subpart W tank throughput are partially due to G&B tanks not reporting, and thus the issue is ultimately resolved by the subpart W data itself.
4. For the throughput basis option, the EPA seeks feedback on the appropriate data source to use for national condensate and oil production. EIA production data are currently used, however, other sources, such as DrillingInfo, are also available. DrillingInfo is used to determine well counts, and using the same data source could create better consistency in the GHGI.
5. The EPA seeks feedback on how to best estimate emissions over the GHGI time series using a throughput-based approach.
6. The EPA seeks stakeholder feedback on developing activity data over the GHGI time series for the tank basis option.
7. Subpart W includes reporting of malfunctioning dump valves from large tanks but not from small tanks. The EPA seeks stakeholder feedback on malfunction rates and emissions from small tanks, including whether small tanks are more or less likely to have malfunctioning dump valves, and whether it may be appropriate to apply the EFs and AD assumptions from large tanks to small tanks.
8. Recent studies have observed (but not quantified) very high emissions from tanks. However, GHGRP data is showing lower, not higher emissions than the GHGI. The EPA seeks stakeholder feedback on this apparent discrepancy.
Associated Gas Venting and Flaring
9. The EPA seeks stakeholder input on the use of subpart W data for associated gas venting and flaring and on approaches for scaling subpart W data to national representation for use in the GHGI.
10. The EPA seeks stakeholder input on approaches for populating the GHGI time series using subpart W data for associated gas venting and flaring. Are there specific factors that may lead to higher or lower levels of venting and flaring in certain years?
Well Counts
April 2017
Page 23 of 29
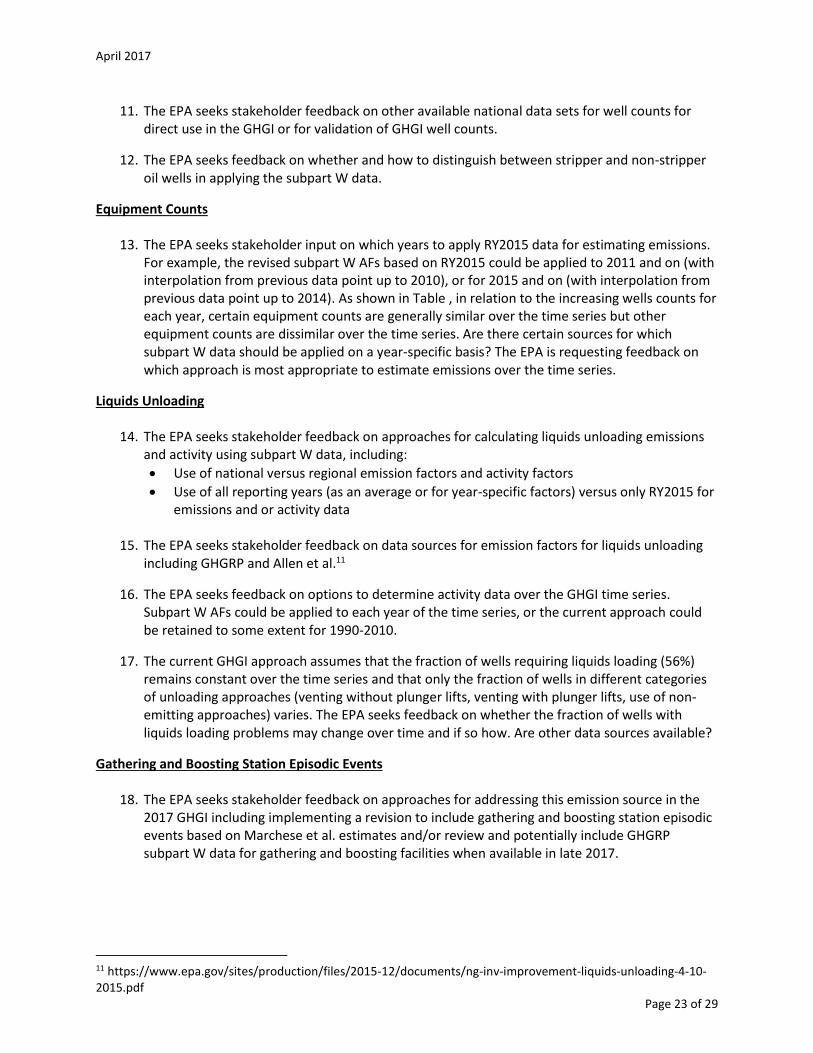
11. The EPA seeks stakeholder feedback on other available national data sets for well counts for direct use in the GHGI or for validation of GHGI well counts.
12. The EPA seeks feedback on whether and how to distinguish between stripper and non-stripper oil wells in applying the subpart W data.
Equipment Counts
13. The EPA seeks stakeholder input on which years to apply RY2015 data for estimating emissions. For example, the revised subpart W AFs based on RY2015 could be applied to 2011 and on (with interpolation from previous data point up to 2010), or for 2015 and on (with interpolation from previous data point up to 2014). As shown in Table , in relation to the increasing wells counts for each year, certain equipment counts are generally similar over the time series but other equipment counts are dissimilar over the time series. Are there certain sources for which subpart W data should be applied on a year-specific basis? The EPA is requesting feedback on which approach is most appropriate to estimate emissions over the time series.
Liquids Unloading
14. The EPA seeks stakeholder feedback on approaches for calculating liquids unloading emissions and activity using subpart W data, including:
Use of national versus regional emission factors and activity factors
Use of all reporting years (as an average or for year-specific factors) versus only RY2015 for emissions and or activity data
15. The EPA seeks stakeholder feedback on data sources for emission factors for liquids unloading
including GHGRP and Allen et al.11
16. The EPA seeks feedback on options to determine activity data over the GHGI time series. Subpart W AFs could be applied to each year of the time series, or the current approach could be retained to some extent for 1990-2010.
17. The current GHGI approach assumes that the fraction of wells requiring liquids loading (56%) remains constant over the time series and that only the fraction of wells in different categories of unloading approaches (venting without plunger lifts, venting with plunger lifts, use of non-emitting approaches) varies. The EPA seeks feedback on whether the fraction of wells with liquids loading problems may change over time and if so how. Are other data sources available?
Gathering and Boosting Station Episodic Events
18. The EPA seeks stakeholder feedback on approaches for addressing this emission source in the 2017 GHGI including implementing a revision to include gathering and boosting station episodic events based on Marchese et al. estimates and/or review and potentially include GHGRP subpart W data for gathering and boosting facilities when available in late 2017.
11 https://www.epa.gov/sites/production/files/2015-12/documents/ng-inv-improvement-liquids-unloading-4-10-2015.pdf
April 2017
Page 24 of 29
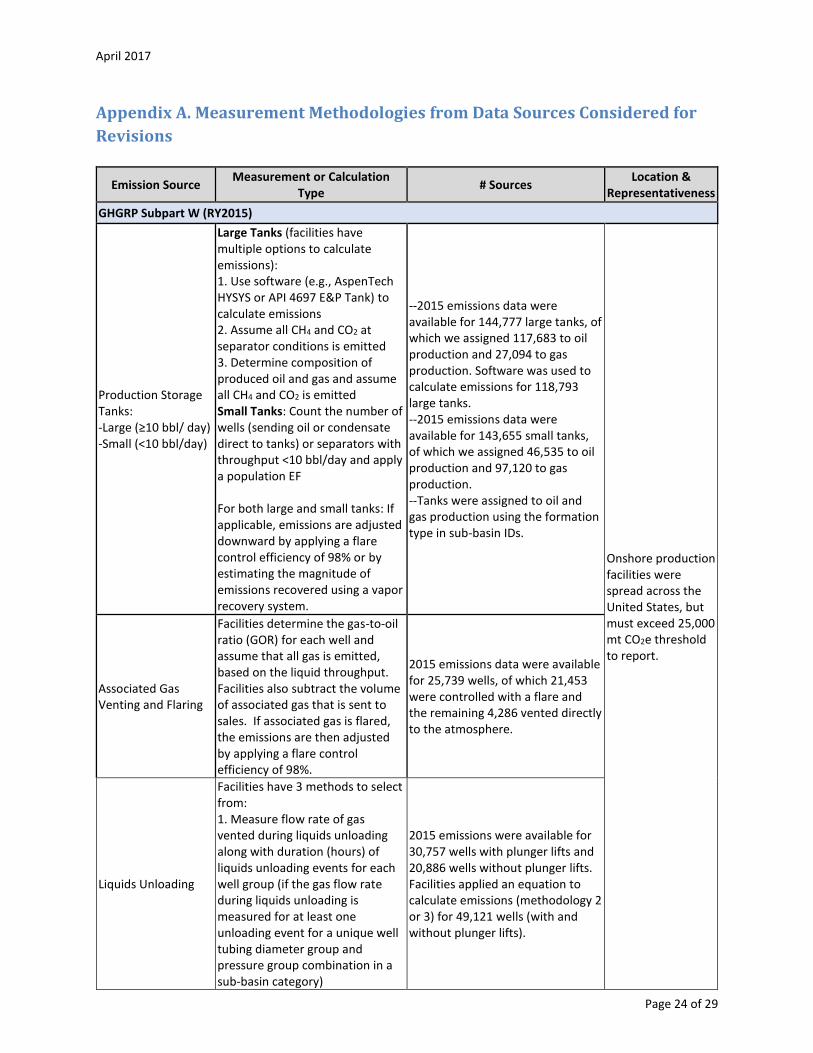
Appendix A. Measurement Methodologies from Data Sources Considered for
Revisions
Emission Source Measurement or Calculation
Type # Sources
Location & Representativeness
GHGRP Subpart W (RY2015)
Production Storage Tanks: -Large (≥10 bbl/ day) -Small (<10 bbl/day)
Large Tanks (facilities have multiple options to calculate emissions): 1. Use software (e.g., AspenTech HYSYS or API 4697 E&P Tank) to calculate emissions 2. Assume all CH4 and CO2 at separator conditions is emitted 3. Determine composition of produced oil and gas and assume all CH4 and CO2 is emitted Small Tanks: Count the number of wells (sending oil or condensate direct to tanks) or separators with throughput <10 bbl/day and apply a population EF For both large and small tanks: If applicable, emissions are adjusted downward by applying a flare control efficiency of 98% or by estimating the magnitude of emissions recovered using a vapor recovery system.
--2015 emissions data were available for 144,777 large tanks, of which we assigned 117,683 to oil production and 27,094 to gas production. Software was used to calculate emissions for 118,793 large tanks. --2015 emissions data were available for 143,655 small tanks, of which we assigned 46,535 to oil production and 97,120 to gas production. --Tanks were assigned to oil and gas production using the formation type in sub-basin IDs.
Onshore production facilities were spread across the United States, but must exceed 25,000 mt CO2e threshold to report.
Associated Gas Venting and Flaring
Facilities determine the gas-to-oil ratio (GOR) for each well and assume that all gas is emitted, based on the liquid throughput. Facilities also subtract the volume of associated gas that is sent to sales. If associated gas is flared, the emissions are then adjusted by applying a flare control efficiency of 98%.
2015 emissions data were available for 25,739 wells, of which 21,453 were controlled with a flare and the remaining 4,286 vented directly to the atmosphere.
Liquids Unloading
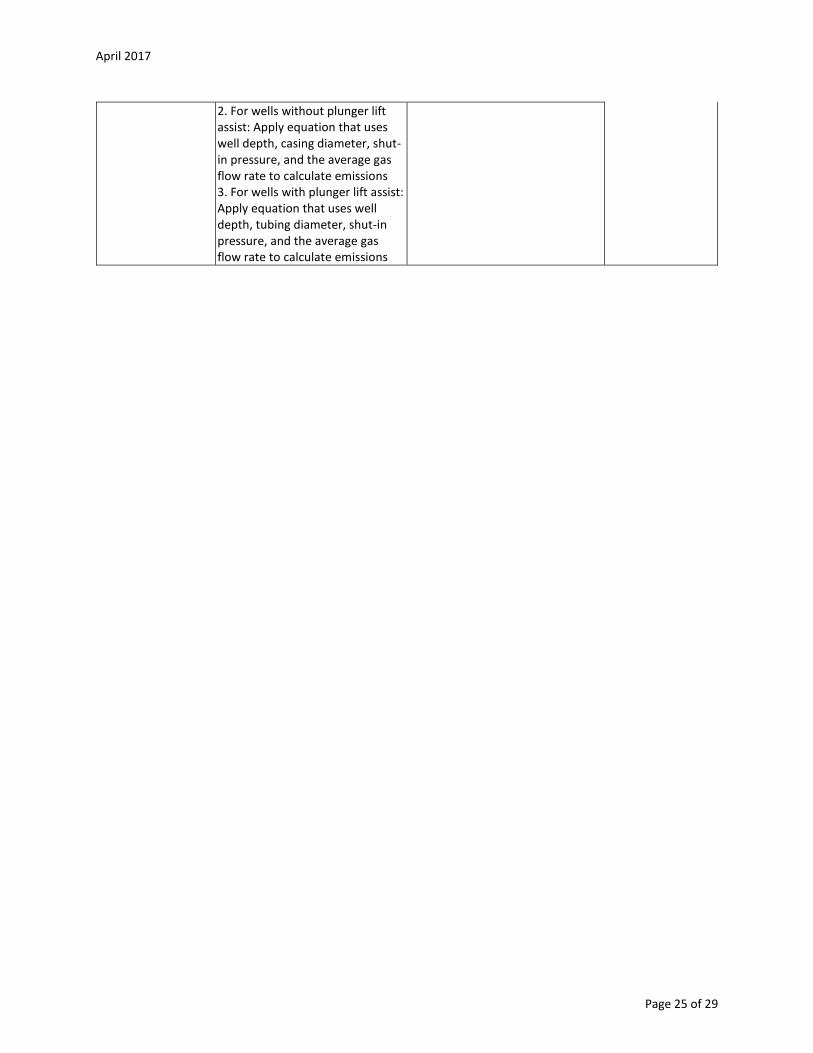
Facilities have 3 methods to select from: 1. Measure flow rate of gas vented during liquids unloading along with duration (hours) of liquids unloading events for each well group (if the gas flow rate during liquids unloading is measured for at least one unloading event for a unique well tubing diameter group and pressure group combination in a sub-basin category)
2015 emissions were available for 30,757 wells with plunger lifts and 20,886 wells without plunger lifts. Facilities applied an equation to calculate emissions (methodology 2 or 3) for 49,121 wells (with and without plunger lifts).
April 2017
Page 25 of 29
2. For wells without plunger lift assist: Apply equation that uses well depth, casing diameter, shut-in pressure, and the average gas flow rate to calculate emissions 3. For wells with plunger lift assist: Apply equation that uses well depth, tubing diameter, shut-in pressure, and the average gas flow rate to calculate emissions
April 2017
Page 26 of 29
Appendix B: Additional Detail on Tank Basis Option Based on stakeholder feedback, to calculate tank emissions, EPA implemented the throughput-based approach described in Section 3.1 in the final 2017 GHGI. The EPA previously solicited stakeholder feedback on the tank basis option described below, and included this approach in the public review draft of the 2017 GHGI, but did not implement this approach in the final 2017 GHGI.
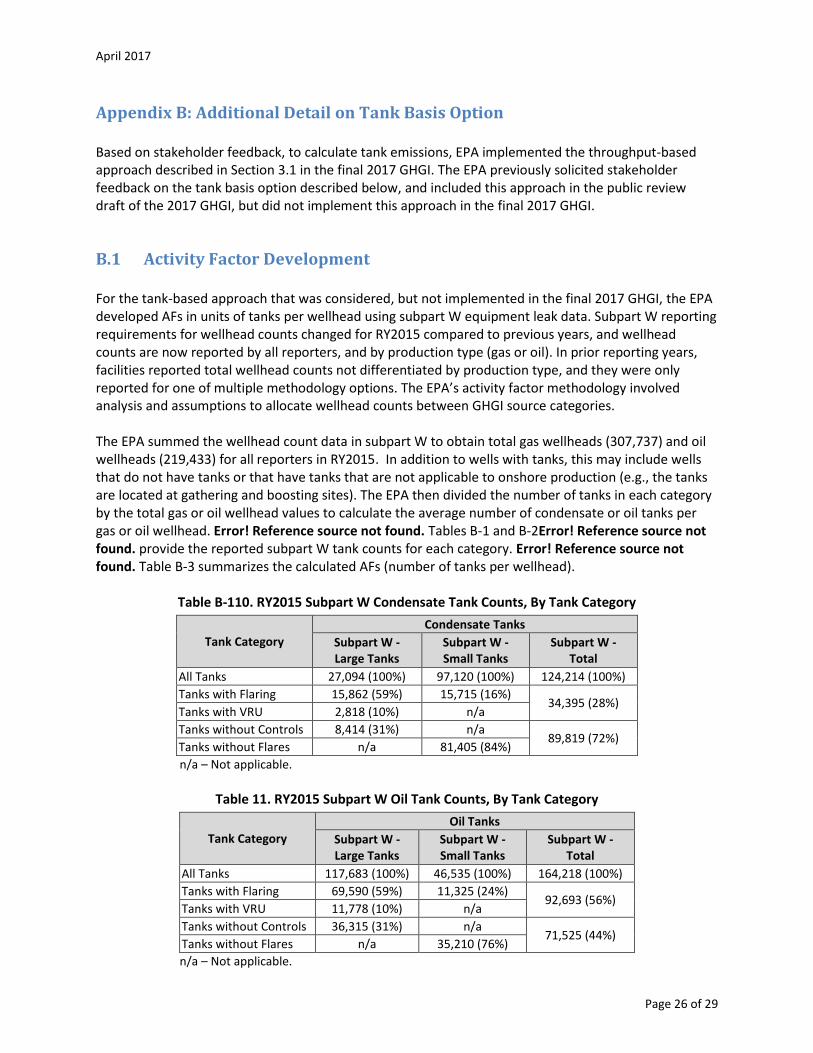
B.1 Activity Factor Development For the tank-based approach that was considered, but not implemented in the final 2017 GHGI, the EPA developed AFs in units of tanks per wellhead using subpart W equipment leak data. Subpart W reporting requirements for wellhead counts changed for RY2015 compared to previous years, and wellhead counts are now reported by all reporters, and by production type (gas or oil). In prior reporting years, facilities reported total wellhead counts not differentiated by production type, and they were only reported for one of multiple methodology options. The EPA’s activity factor methodology involved analysis and assumptions to allocate wellhead counts between GHGI source categories. The EPA summed the wellhead count data in subpart W to obtain total gas wellheads (307,737) and oil wellheads (219,433) for all reporters in RY2015. In addition to wells with tanks, this may include wells that do not have tanks or that have tanks that are not applicable to onshore production (e.g., the tanks are located at gathering and boosting sites). The EPA then divided the number of tanks in each category by the total gas or oil wellhead values to calculate the average number of condensate or oil tanks per gas or oil wellhead. Error! Reference source not found. Tables B-1 and B-2Error! Reference source not found. provide the reported subpart W tank counts for each category. Error! Reference source not found. Table B-3 summarizes the calculated AFs (number of tanks per wellhead).
Table B-110. RY2015 Subpart W Condensate Tank Counts, By Tank Category
Tank Category
Condensate Tanks
Subpart W - Large Tanks
Subpart W - Small Tanks
Subpart W - Total
All Tanks 27,094 (100%) 97,120 (100%) 124,214 (100%)
Tanks with Flaring 15,862 (59%) 15,715 (16%) 34,395 (28%)
Tanks with VRU 2,818 (10%) n/a
Tanks without Controls 8,414 (31%) n/a 89,819 (72%)
Tanks without Flares n/a 81,405 (84%)
n/a – Not applicable.
Table 11. RY2015 Subpart W Oil Tank Counts, By Tank Category
Tank Category
Oil Tanks
Subpart W - Large Tanks
Subpart W - Small Tanks
Subpart W - Total
All Tanks 117,683 (100%) 46,535 (100%) 164,218 (100%)
Tanks with Flaring 69,590 (59%) 11,325 (24%) 92,693 (56%)
Tanks with VRU 11,778 (10%) n/a
Tanks without Controls 36,315 (31%) n/a 71,525 (44%)
Tanks without Flares n/a 35,210 (76%)
n/a – Not applicable.
April 2017
Page 27 of 29
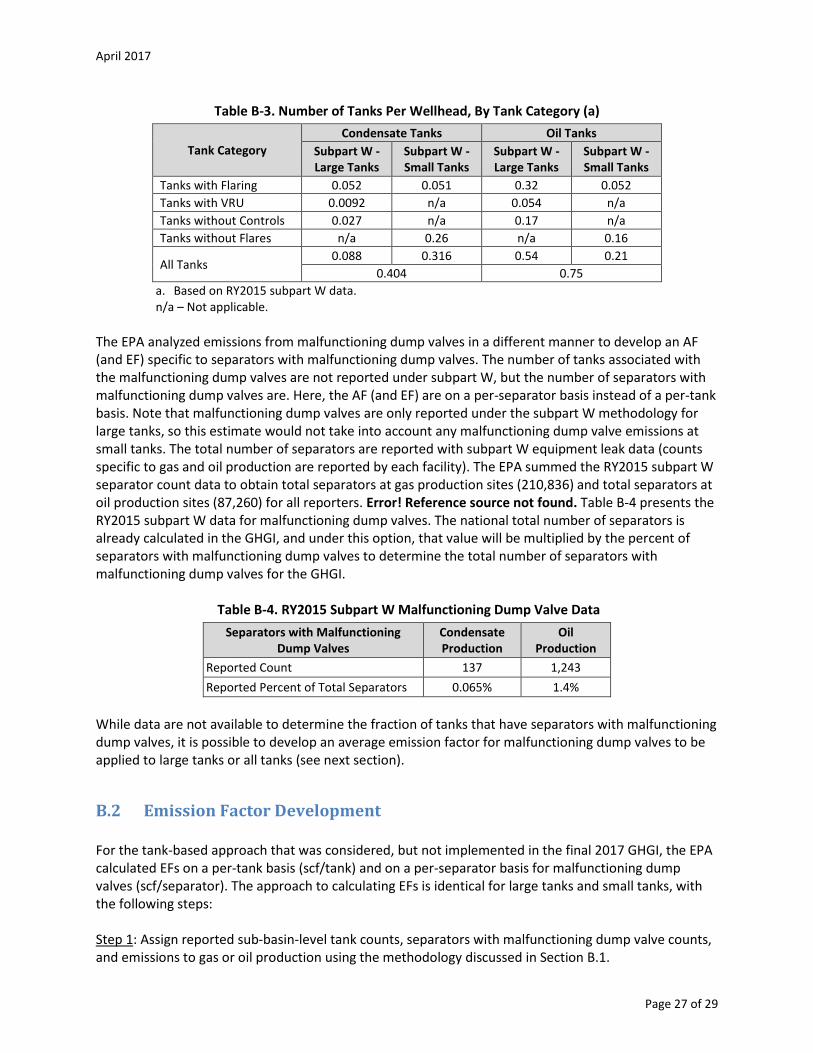
Table B-3. Number of Tanks Per Wellhead, By Tank Category (a)
Tank Category
Condensate Tanks Oil Tanks
Subpart W - Large Tanks
Subpart W - Small Tanks
Subpart W - Large Tanks
Subpart W - Small Tanks
Tanks with Flaring 0.052 0.051 0.32 0.052
Tanks with VRU 0.0092 n/a 0.054 n/a
Tanks without Controls 0.027 n/a 0.17 n/a
Tanks without Flares n/a 0.26 n/a 0.16
All Tanks 0.088 0.316 0.54 0.21
0.404 0.75
a. Based on RY2015 subpart W data. n/a – Not applicable.
The EPA analyzed emissions from malfunctioning dump valves in a different manner to develop an AF (and EF) specific to separators with malfunctioning dump valves. The number of tanks associated with the malfunctioning dump valves are not reported under subpart W, but the number of separators with malfunctioning dump valves are. Here, the AF (and EF) are on a per-separator basis instead of a per-tank basis. Note that malfunctioning dump valves are only reported under the subpart W methodology for large tanks, so this estimate would not take into account any malfunctioning dump valve emissions at small tanks. The total number of separators are reported with subpart W equipment leak data (counts specific to gas and oil production are reported by each facility). The EPA summed the RY2015 subpart W separator count data to obtain total separators at gas production sites (210,836) and total separators at oil production sites (87,260) for all reporters. Error! Reference source not found. Table B-4 presents the RY2015 subpart W data for malfunctioning dump valves. The national total number of separators is already calculated in the GHGI, and under this option, that value will be multiplied by the percent of separators with malfunctioning dump valves to determine the total number of separators with malfunctioning dump valves for the GHGI.
Table B-4. RY2015 Subpart W Malfunctioning Dump Valve Data
Separators with Malfunctioning Dump Valves
Condensate Production
Oil Production
Reported Count 137 1,243
Reported Percent of Total Separators 0.065% 1.4%
While data are not available to determine the fraction of tanks that have separators with malfunctioning dump valves, it is possible to develop an average emission factor for malfunctioning dump valves to be applied to large tanks or all tanks (see next section).
B.2 Emission Factor Development For the tank-based approach that was considered, but not implemented in the final 2017 GHGI, the EPA calculated EFs on a per-tank basis (scf/tank) and on a per-separator basis for malfunctioning dump valves (scf/separator). The approach to calculating EFs is identical for large tanks and small tanks, with the following steps: Step 1: Assign reported sub-basin-level tank counts, separators with malfunctioning dump valve counts, and emissions to gas or oil production using the methodology discussed in Section B.1.
April 2017
Page 28 of 29
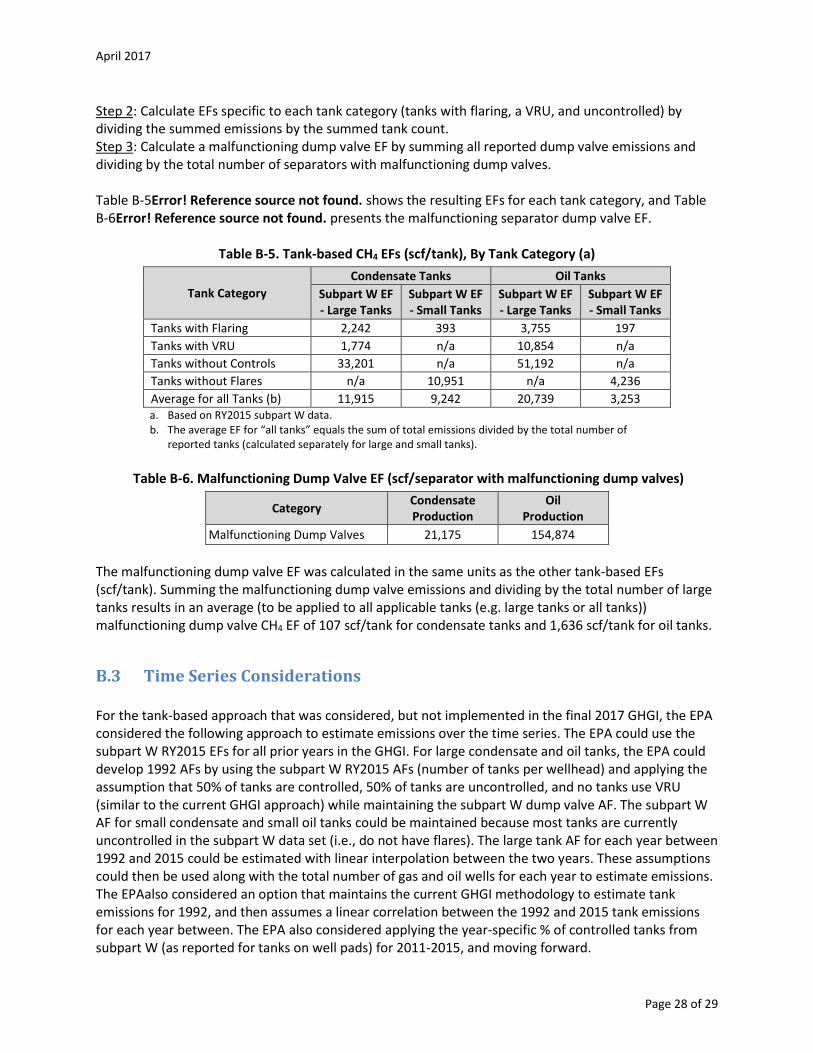
Step 2: Calculate EFs specific to each tank category (tanks with flaring, a VRU, and uncontrolled) by dividing the summed emissions by the summed tank count. Step 3: Calculate a malfunctioning dump valve EF by summing all reported dump valve emissions and dividing by the total number of separators with malfunctioning dump valves. Table B-5Error! Reference source not found. shows the resulting EFs for each tank category, and Table B-6Error! Reference source not found. presents the malfunctioning separator dump valve EF.
Table B-5. Tank-based CH4 EFs (scf/tank), By Tank Category (a)
Tank Category
Condensate Tanks Oil Tanks
Subpart W EF - Large Tanks
Subpart W EF - Small Tanks
Subpart W EF - Large Tanks
Subpart W EF - Small Tanks
Tanks with Flaring 2,242 393 3,755 197
Tanks with VRU 1,774 n/a 10,854 n/a
Tanks without Controls 33,201 n/a 51,192 n/a
Tanks without Flares n/a 10,951 n/a 4,236
Average for all Tanks (b) 11,915 9,242 20,739 3,253 a. Based on RY2015 subpart W data. b. The average EF for “all tanks” equals the sum of total emissions divided by the total number of
reported tanks (calculated separately for large and small tanks).
Table B-6. Malfunctioning Dump Valve EF (scf/separator with malfunctioning dump valves)
Category Condensate Production
Oil Production
Malfunctioning Dump Valves 21,175 154,874
The malfunctioning dump valve EF was calculated in the same units as the other tank-based EFs (scf/tank). Summing the malfunctioning dump valve emissions and dividing by the total number of large tanks results in an average (to be applied to all applicable tanks (e.g. large tanks or all tanks)) malfunctioning dump valve CH4 EF of 107 scf/tank for condensate tanks and 1,636 scf/tank for oil tanks.
B.3 Time Series Considerations For the tank-based approach that was considered, but not implemented in the final 2017 GHGI, the EPA considered the following approach to estimate emissions over the time series. The EPA could use the subpart W RY2015 EFs for all prior years in the GHGI. For large condensate and oil tanks, the EPA could develop 1992 AFs by using the subpart W RY2015 AFs (number of tanks per wellhead) and applying the assumption that 50% of tanks are controlled, 50% of tanks are uncontrolled, and no tanks use VRU (similar to the current GHGI approach) while maintaining the subpart W dump valve AF. The subpart W AF for small condensate and small oil tanks could be maintained because most tanks are currently uncontrolled in the subpart W data set (i.e., do not have flares). The large tank AF for each year between 1992 and 2015 could be estimated with linear interpolation between the two years. These assumptions could then be used along with the total number of gas and oil wells for each year to estimate emissions. The EPAalso considered an option that maintains the current GHGI methodology to estimate tank emissions for 1992, and then assumes a linear correlation between the 1992 and 2015 tank emissions for each year between. The EPA also considered applying the year-specific % of controlled tanks from subpart W (as reported for tanks on well pads) for 2011-2015, and moving forward.
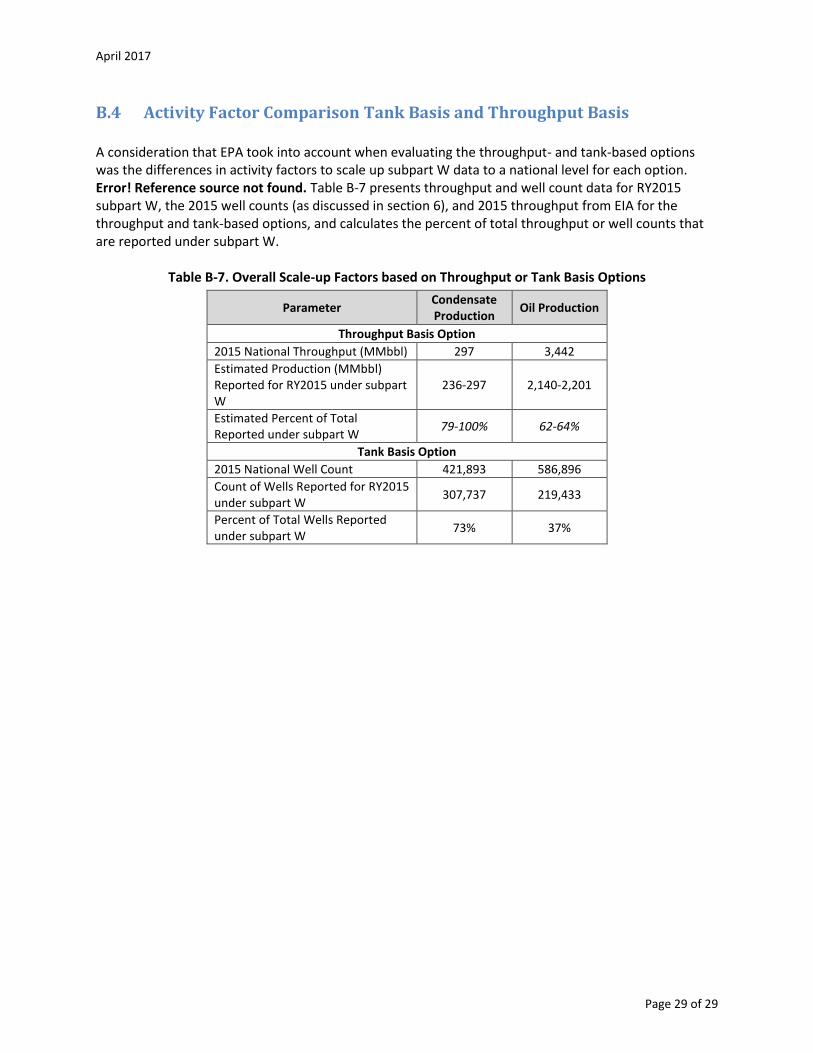
April 2017
Page 29 of 29
B.4 Activity Factor Comparison Tank Basis and Throughput Basis A consideration that EPA took into account when evaluating the throughput- and tank-based options was the differences in activity factors to scale up subpart W data to a national level for each option. Error! Reference source not found. Table B-7 presents throughput and well count data for RY2015 subpart W, the 2015 well counts (as discussed in section 6), and 2015 throughput from EIA for the throughput and tank-based options, and calculates the percent of total throughput or well counts that are reported under subpart W.
Table B-7. Overall Scale-up Factors based on Throughput or Tank Basis Options
Parameter Condensate Production
Oil Production
Throughput Basis Option
2015 National Throughput (MMbbl) 297 3,442
Estimated Production (MMbbl) Reported for RY2015 under subpart W
236-297 2,140-2,201
Estimated Percent of Total Reported under subpart W
79-100% 62-64%
Tank Basis Option
2015 National Well Count 421,893 586,896
Count of Wells Reported for RY2015 under subpart W
307,737 219,433
Percent of Total Wells Reported under subpart W
73% 37%


![Greenhouse Gas Emissions and Emissions Trading in North … · 2020. 2. 23. · 2002] Stephenson-Greenhouse Gas Emissions, Kyoto and U.S. Response 45 greenhouse gas molecules. This](https://static.fdocuments.in/doc/165x107/60facf56e286b02f9b10de99/greenhouse-gas-emissions-and-emissions-trading-in-north-2020-2-23-2002-stephenson-greenhouse.jpg)
