Inventory of New York City Greenhouse Gas Emissions · 2 2017 The Inventory of New York City...
56
INVENTORY OF NEW YORK CITY GREENHOUSE GAS EMISSIONS IN 2015 Published April 2017 The City of New York Mayor Bill de Blasio Mayor’s Office of Sustainability
Transcript of Inventory of New York City Greenhouse Gas Emissions · 2 2017 The Inventory of New York City...
1Inventory of New York City Greenhouse Gas Emissions: April 2017
INVENTORY OF NEW YORK CITYGREENHOUSEGAS EMISSIONSIN 2015 Published April 2017
The City of New York
Mayor Bill de Blasio
Mayor’s Office of Sustainability
2 Inventory of New York City Greenhouse Gas Emissions: April 2017
The Inventory of New York City Greenhouse Gas Emissions is published pursuant to Local Law 22 of 2008. This report was
produced by the New York City Mayor’s Office of Sustainability with Cventure LLC.
The City of New York would like to thank the following for their valuable assistance in producing this report: Con Edison Company
of New York, the Long Island Power Authority, the Metropolitan Transportation Authority, National Grid, New Jersey Transit, the
New York Power Authority, and the Port Authority of New York and New Jersey.
Academic Citation:
City of New York Inventory of New York City’s Greenhouse Gas Emissions, April 2017, by Cventure LLC, Cathy Pasion, Christianah
Oyenuga, and Kate Gouin, Mayor’s Office of Sustainability, New York, 2017.
This document was designed by Melanie Ho.
Cover Photo Credit: Peter J. DeJesus
3Inventory of New York City Greenhouse Gas Emissions: April 2017
Letter from the Mayor
Overview
Executive Summary
Introduction
Citywide Inventory
City Government Inventory
Appendices
INVENTORY OF NEW YORK CITY GREENHOUSE GAS EMISSIONS
April 2017
4
6
10
15
18
27
38

4 Inventory of New York City Greenhouse Gas Emissions: April 2017
Letter from the Mayor
5Inventory of New York City Greenhouse Gas Emissions: April 2017
Friends,
Cities have an important role in climate change mitigation. Since 2007, New York City has measured its citywide and government operations greenhouse gas emissions. As one of the first cities to do so, we are able to see how we are doing in our efforts to reduce those emissions. Over the years, this inventory has provided us with valu-able data to help develop the right strategies to meet our OneNYC goal of reducing greenhouse gas emissions 80 percent from 2005 levels by 2050 (80 x 50) and combat climate change.
To ensure our data is robust, we are committed to using best practices that allow us to compare our emissions with other cities. As a member of the Global Covenant of Mayors for Climate and Energy, we are compliant with the Global Protocol for Com-munity-Scale Greenhouse Gas Emission Inventory (GPC), an international standard.
The NYC greenhouse gas inventory shows that emissions in 2015 dropped 14.8 per-cent since 2005. This drop comes despite economic growth and increased population. Reductions to date continue to be largely the result of switching to natural gas in the electricity grid while the city’s building stock is the biggest source of the city’s emis-sions.
Last September, we released New York City’s Roadmap to 80 x 50, a comprehen-sive report to assess what is necessary from the buildings, energy, transportation, and waste sectors to reach 80 x 50. While there is much more work ahead in pursuit of our ambitious and necessary goals, we have made significant strides and outlined a strong pathway to get there.
Mayor Bill de Blasio

6 Inventory of New York City Greenhouse Gas Emissions: April 2017
Overview
7Inventory of New York City Greenhouse Gas Emissions: April 2017
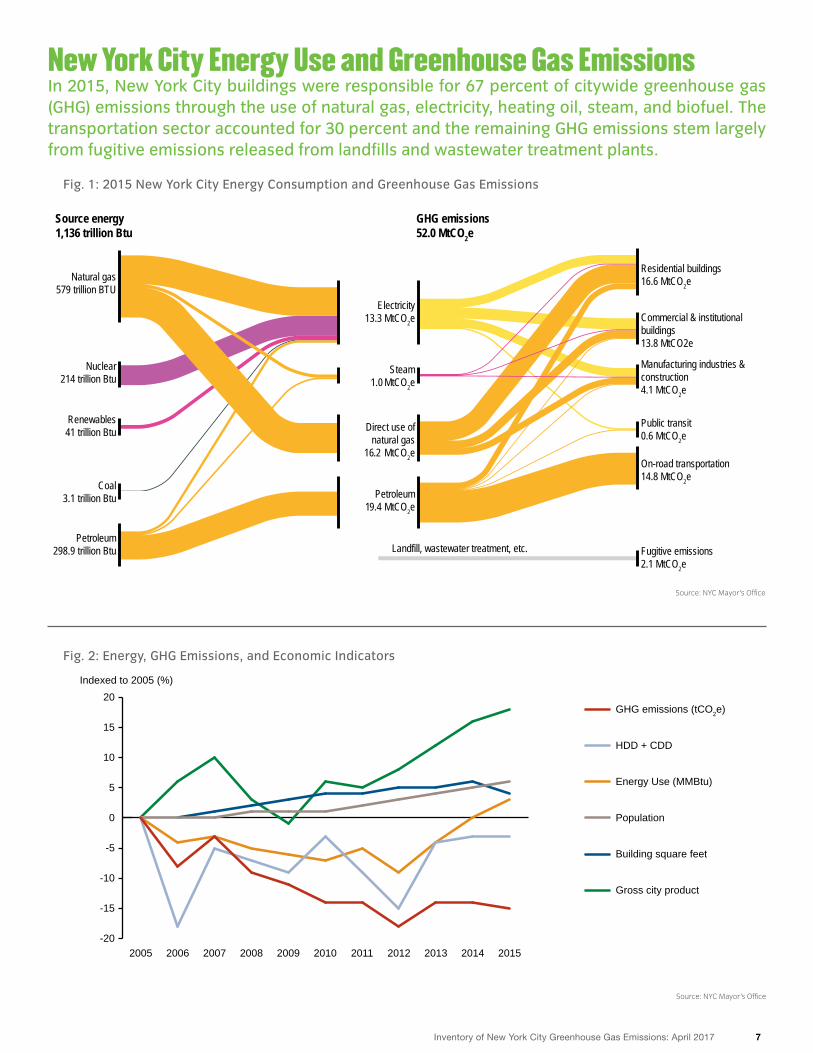
In 2015, New York City buildings were responsible for 67 percent of citywide greenhouse gas (GHG) emissions through the use of natural gas, electricity, heating oil, steam, and biofuel. The transportation sector accounted for 30 percent and the remaining GHG emissions stem largely from fugitive emissions released from landfills and wastewater treatment plants.
New York City Energy Use and Greenhouse Gas Emissions
Fig. 2: Energy, GHG Emissions, and Economic Indicators
Fig. 1: 2015 New York City Energy Consumption and Greenhouse Gas Emissions
Source: NYC Mayor’s Office
Source: NYC Mayor’s Office
-20
-15
-10
-5
0
5
10
15
20GHG emissions (tCO2e)
HDD + CDD
Energy Use (MMBtu)
Population
Building square feet
Gross city product
20152014201320122011201020092008200720062005
Indexed to 2005 (%)
Natural gas579 trillion BTU
Residential buildings16.6 MtCO2e
Commercial & institutionalbuildings13.8 MtCO2e
Manufacturing industries & construction4.1 MtCO2e
Public transit0.6 MtCO2e
On-road transportation14.8 MtCO2e
Fugitive emissions2.1 MtCO2e
Landfill, wastewater treatment, etc.
Electricity13.3 MtCO2e
Steam1.0 MtCO2e
Nuclear214 trillion Btu
Renewables41 trillion Btu
Coal3.1 trillion Btu
Petroleum298.9 trillion Btu
Source energy1,136 trillion Btu
GHG emissions52.0 MtCO2e
Direct use ofnatural gas
16.2 MtCO2e
Petroleum19.4 MtCO2e
8 Inventory of New York City Greenhouse Gas Emissions: April 2017
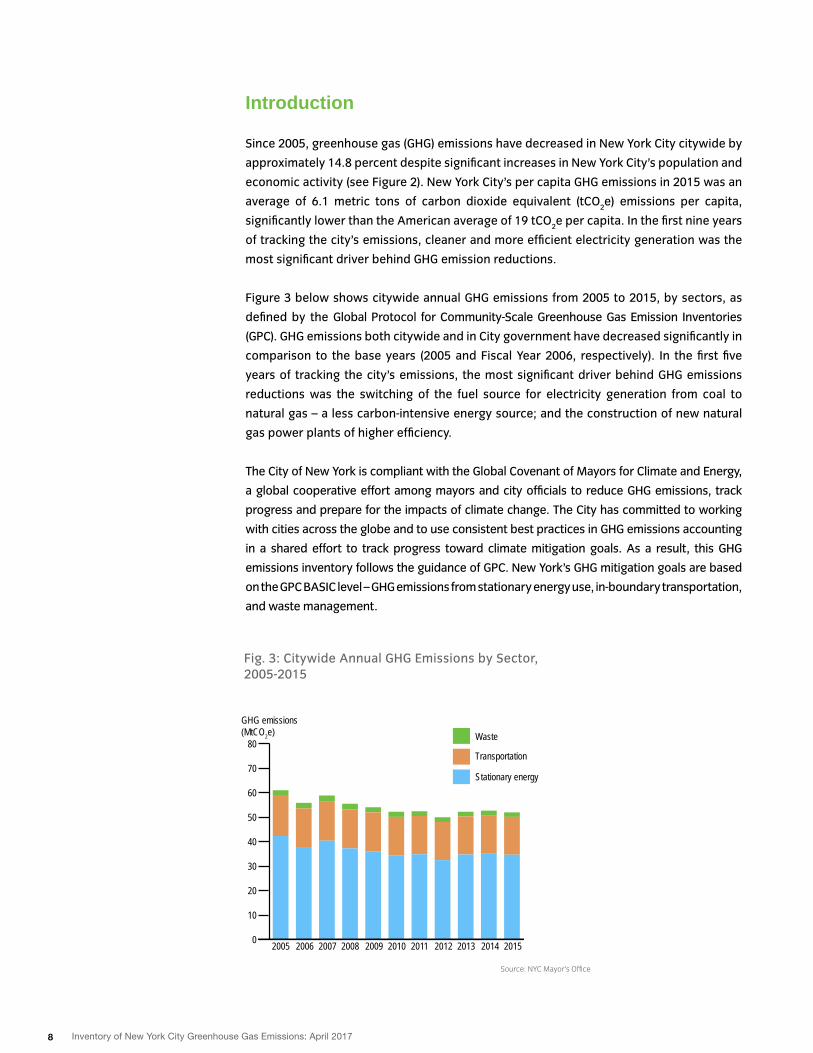
Fig. 3: Citywide Annual GHG Emissions by Sector, 2005-2015
Source: NYC Mayor’s Office
Introduction
Since 2005, greenhouse gas (GHG) emissions have decreased in New York City citywide by
approximately 14.8 percent despite significant increases in New York City’s population and
economic activity (see Figure 2). New York City’s per capita GHG emissions in 2015 was an
average of 6.1 metric tons of carbon dioxide equivalent (tCO2e) emissions per capita,
significantly lower than the American average of 19 tCO2e per capita. In the first nine years
of tracking the city’s emissions, cleaner and more efficient electricity generation was the
most significant driver behind GHG emission reductions.
Figure 3 below shows citywide annual GHG emissions from 2005 to 2015, by sectors, as
defined by the Global Protocol for Community-Scale Greenhouse Gas Emission Inventories
(GPC). GHG emissions both citywide and in City government have decreased significantly in
comparison to the base years (2005 and Fiscal Year 2006, respectively). In the first five
years of tracking the city’s emissions, the most significant driver behind GHG emissions
reductions was the switching of the fuel source for electricity generation from coal to
natural gas – a less carbon-intensive energy source; and the construction of new natural
gas power plants of higher efficiency.
The City of New York is compliant with the Global Covenant of Mayors for Climate and Energy,
a global cooperative effort among mayors and city officials to reduce GHG emissions, track
progress and prepare for the impacts of climate change. The City has committed to working
with cities across the globe and to use consistent best practices in GHG emissions accounting
in a shared effort to track progress toward climate mitigation goals. As a result, this GHG
emissions inventory follows the guidance of GPC. New York’s GHG mitigation goals are based
on the GPC BASIC level – GHG emissions from stationary energy use, in-boundary transportation,
and waste management.
0
10
20
30
40
50
60
70
80 Waste
Transportation
Stationary energy
20152014201320122011201020092008200720062005
GHG emissions(MtCO2e)
9Inventory of New York City Greenhouse Gas Emissions: April 2017
Since 2012, the rate of reduction has slowed slightly, and GHG emissions, as reported in
2013-2015, have more closely coincided with the fall and rise of temperatures. GHG
emissions from stationary energy heating fuel, which contribute approximately 40 percent
of the total citywide GHG emissions, track closely with the cold days of winter through
increased thermal demands and heating needs. This was especially evident in the
difference between the 2014 and 2015 GHG emissions inventories. 2014 was the coldest
year since 2005 and had an increase in stationary heating fuel GHG emissions. In 2015,
stationary heating fuel GHG emissions decreased by approximately two percent from
2014, as 2015 heating demand decreased back to below 2013 levels. GHG emissions that
result from increased use of energy to meet heating needs were offset in part by energy
efficiency gains from City programs and policies.
The City has developed policies and mitigation strategies to further its commitment to
reducing GHG emissions 80 percent below 2005 levels by 2050 (80 x 50). As a first step in
achieving this goal, the city is accelerating building retrofits, as described in the plan One City Built to Last, a ten-year action plan to improve energy efficiency in the city’s buildings
by 2025.1 City government is committed to leading the way to this goal, targeting a 35
percent reduction in City government buildings’ GHG emissions by 2025.
In order to reach 80 x 50, GHG reductions are required across all sectors. As part of the
City’s commitment in One New York: The Plan for a Strong and Just City,2 the City has
developed an integrated 80 x 50 GHG mitigation plan, New York City’s Roadmap to 80 x 50 (Roadmap to 80 x 50), which includes the buildings, energy supply, transportation, and
solid waste sectors.3 As New York City pursues its GHG emissions reduction target, this
GHG Inventory will continue to play a key role in measuring success and provide the
necessary metrics for revising and optimizing strategies.

10 Inventory of New York City Greenhouse Gas Emissions: April 2017
Executive Summary
11Inventory of New York City Greenhouse Gas Emissions: April 2017
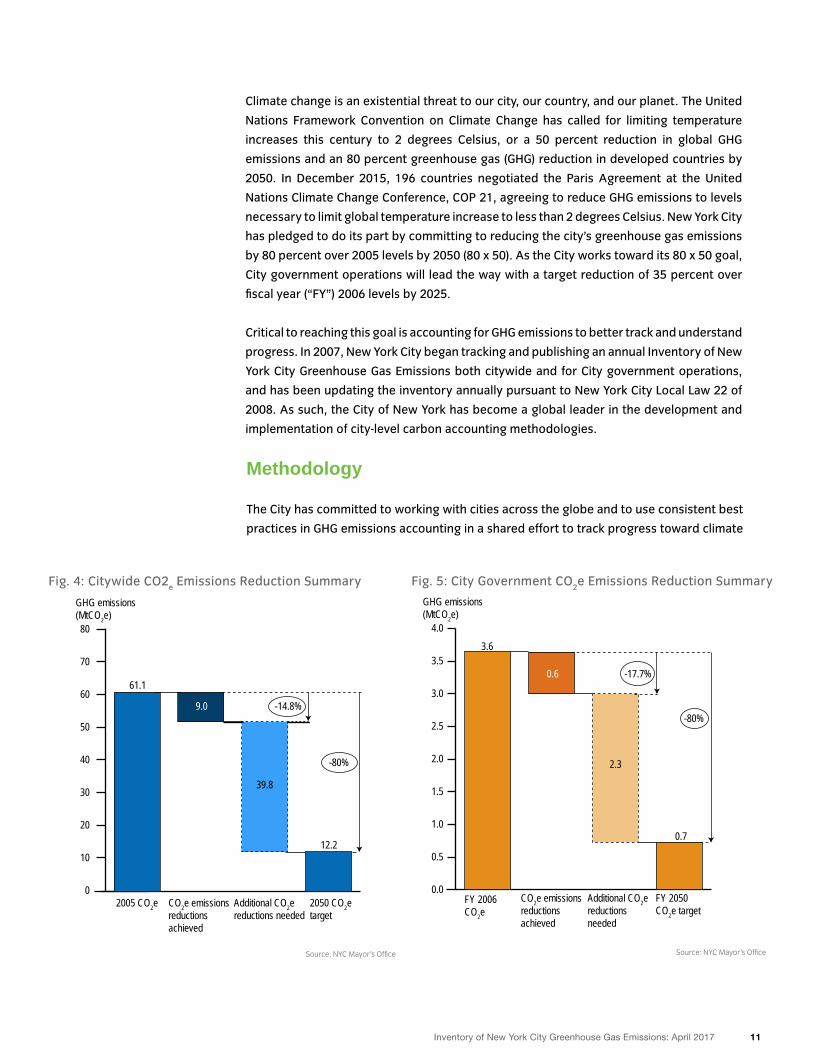
Fig. 4: Citywide CO2e Emissions Reduction Summary Fig. 5: City Government CO
2e Emissions Reduction Summary
Source: NYC Mayor’s Office Source: NYC Mayor’s Office
Climate change is an existential threat to our city, our country, and our planet. The United
Nations Framework Convention on Climate Change has called for limiting temperature
increases this century to 2 degrees Celsius, or a 50 percent reduction in global GHG
emissions and an 80 percent greenhouse gas (GHG) reduction in developed countries by
2050. In December 2015, 196 countries negotiated the Paris Agreement at the United
Nations Climate Change Conference, COP 21, agreeing to reduce GHG emissions to levels
necessary to limit global temperature increase to less than 2 degrees Celsius. New York City
has pledged to do its part by committing to reducing the city’s greenhouse gas emissions
by 80 percent over 2005 levels by 2050 (80 x 50). As the City works toward its 80 x 50 goal,
City government operations will lead the way with a target reduction of 35 percent over
fiscal year (“FY”) 2006 levels by 2025.
Critical to reaching this goal is accounting for GHG emissions to better track and understand
progress. In 2007, New York City began tracking and publishing an annual Inventory of New
York City Greenhouse Gas Emissions both citywide and for City government operations,
and has been updating the inventory annually pursuant to New York City Local Law 22 of
2008. As such, the City of New York has become a global leader in the development and
implementation of city-level carbon accounting methodologies.
Methodology
The City has committed to working with cities across the globe and to use consistent best
practices in GHG emissions accounting in a shared effort to track progress toward climate
0
10
20
30
40
50
60
70
80
2050 CO2e target
Additional CO2e reductions needed
CO2e emissions reductions achieved
2005 CO2e
-14.8%
39.8
9.0
61.1
12.2
-80%
GHG emissions(MtCO2e)
0.0
0.5
1.0
1.5
2.0
2.5
3.0
3.5
4.0
FY 2050 CO2e target
Additional CO2e reductions needed
CO2e emissions reductions achieved
FY 2006CO2e
-80%
-17.7%
2.3
0.6
3.6
0.7
GHG emissions(MtCO2e)
12 Inventory of New York City Greenhouse Gas Emissions: April 2017
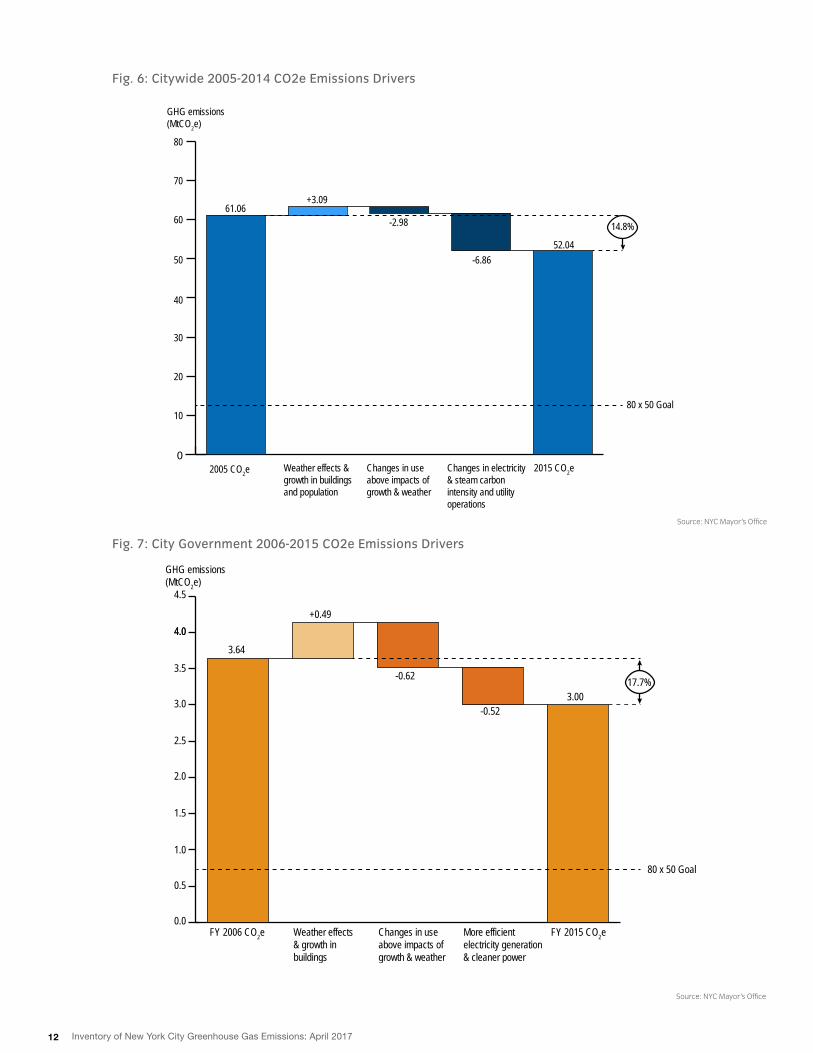
Fig. 7: City Government 2006-2015 CO2e Emissions Drivers
Fig. 6: Citywide 2005-2014 CO2e Emissions Drivers
Source: NYC Mayor’s Office
Source: NYC Mayor’s Office
0
10
20
30
40
50
60
70
80
2015 CO2eChanges in electricity & steam carbon intensity and utilityoperations
Changes in use above impacts of growth & weather
Weather effects & growth in buildingsand population
2005 CO2e
61.06+3.09
-2.98
-6.8652.04
80 x 50 Goal
GHG emissions(MtCO2e)
14.8%
0.0
0.5
1.0
1.5
2.0
2.5
3.0
3.5
4.0
4.5
FY 2015 CO2e
Changes in use above impacts of growth and weather
More e�cient electricity generation and cleaner power
Weather e�ects and growth in buildings
FY 2015 CO2eMore efficient electricity generation& cleaner power
Changes in use above impacts of growth & weather
Weather effects& growth inbuildings
FY 2006 CO2e
17.7%
3.64
+0.49
-0.62
4.0
-0.523.00
80 x 50 Goal
GHG emissions(MtCO2e)
13Inventory of New York City Greenhouse Gas Emissions: April 2017
mitigation goals, including following the guidance of the Global Protocol for Community-
Scale Greenhouse Gas Emission Inventories (GPC). Additional data sets were accounted for
last year in the 2014 GHG Inventory for the first time to ensure compliance with the Global
Covenant of Mayors for Climate and Energy, a global cooperative effort among mayors and
city officials to reduce GHG emissions, track progress, and prepare for the impacts of
climate change.
The Inventory of New York City Greenhouse Gas Emissions measures and reports GHG
emissions from two sets of sources: (1) all activities taking place within the boundary of
New York City are reported in the citywide inventory (referred to as the community
inventory in GHG protocols); and (2) the activities associated with the provision of services
by New York City Government (a subset of the citywide inventory), reported in the City
government GHG Inventory.
The citywide GPC BASIC GHG inventory consists of all direct and indirect GHG emissions
from energy used by buildings and other stationary sources; on-road transportation and
public transit within the geographic borders of New York City; and fugitive GHG emissions
from wastewater treatment, solid waste disposed of out of the city, and natural gas
distribution within New York City.
City government emissions are calculated and reported per the Local Government
Operations Protocol (LGOP).4 The inventory reports GHG emissions from operations,
facilities, or sources wholly owned by the City, or over which the City has full authority to
introduce and implement operations, health and safety, and environmental policies
(including both GHG- and non-GHG-related policies). GHG emissions from leased real estate
and vehicles and other equipment are included. It is important to note that additional,
non-City operated public entities (e.g., Metropolitan Transportation Authority) are not
included within the LGOP inventory protocol by this definition of operational control.
Results
As of 2015, citywide GHG emissions have decreased by 14.8 percent relative to 2005 levels,
resulting in citywide GHG emissions of 52.0 million metric tons of carbon dioxide equivalent
(MtCO2e) in 2015. This corresponds to a 1.3 percent decrease below the 2014 citywide GHG
emissions of 52.7 MtCO2e. City government GHG emissions have decreased by 17.7 percent
relative to FY 2006 levels.
Much of these reductions were achieved early on, largely as a result of power plants
switching their fuel source from coal to natural gas – a less carbon-intensive energy source;
and through the construction of new, highly efficient natural gas power plants, both within
and outside the city. Prior to 2013, electricity use had historically been the largest source
of GHG emissions within the city. As the result of conversions of buildings’ heating fuel
supplies from heavier heating fuel oils to light fuel oil or natural gas as part of the City’s
Clean Heat Program, along with continued low natural gas prices making natural gas the
fuel of choice for new construction, usage of natural gas has increased in the City.
14 Inventory of New York City Greenhouse Gas Emissions: April 2017
Collectively these factors have resulted in an increase in natural gas use in buildings
citywide of 25 percent from 2005 to 2015. Natural gas contributes approximately 31
percent of the citywide GHG emissions while electricity contributes approximately 25
percent of citywide GHG emissions.
This fall in electricity’s contribution to overall GHG emissions illustrates the gains in both
the cleanliness of the power supply, and increases in energy efficiency for electricity
generation and its end use.
From 2012 through 2015, the rate of GHG emissions reduction citywide has slowed
somewhat, and GHG emissions as reported in the 2013-2015 time period have more closely
tracked the fall and rise of temperatures as indicated by Heating Degree Days (HDD). This
was especially evident in the 2014 GHG emissions inventory, when 2014 was the coldest
year since 2005.
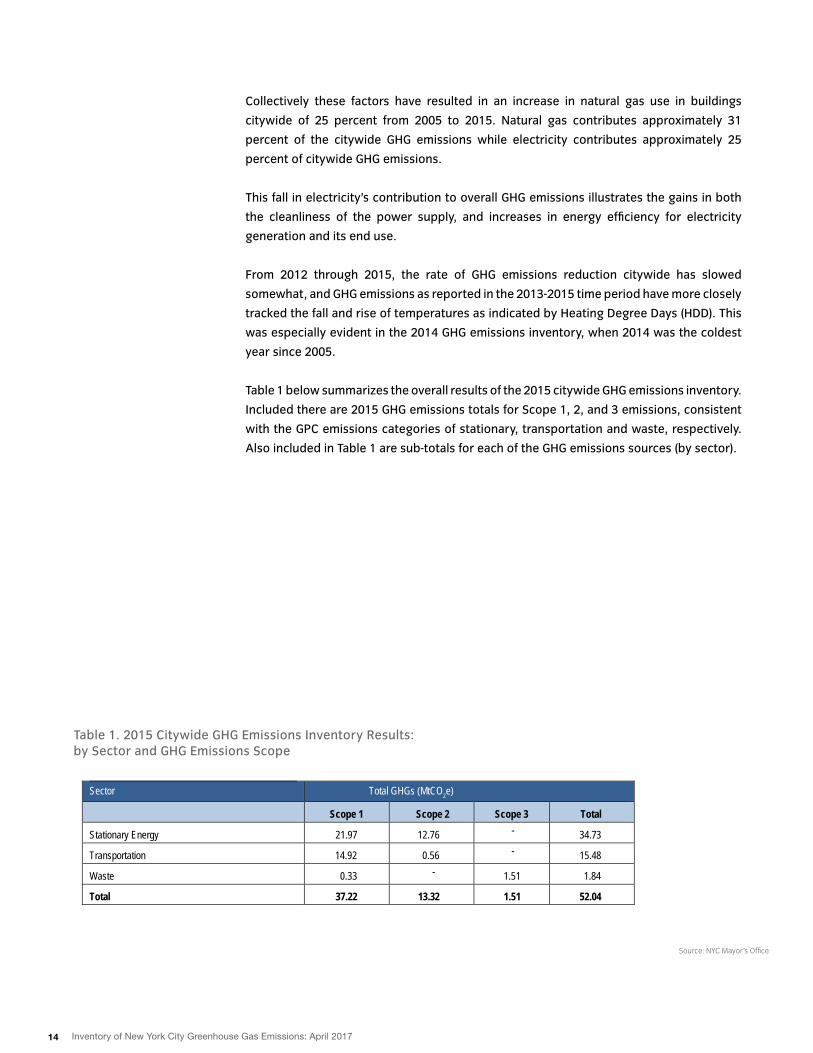
Table 1 below summarizes the overall results of the 2015 citywide GHG emissions inventory.
Included there are 2015 GHG emissions totals for Scope 1, 2, and 3 emissions, consistent
with the GPC emissions categories of stationary, transportation and waste, respectively.
Also included in Table 1 are sub-totals for each of the GHG emissions sources (by sector).
Table 1. 2015 Citywide GHG Emissions Inventory Results: by Sector and GHG Emissions Scope
Source: NYC Mayor’s Office
Sector Total GHGs (MtCO2e)
Scope 1 Scope 2 Scope 3 Total
Stationary Energy 21.97 12.76 34.73
Transportation 14.92 0.56 15.48
Waste 0.33 -
1.51 1.84
Total 37.22 13.32 1.51 52.04
-
-
-

15 Inventory of New York City Greenhouse Gas Emissions: April 2017
Introduction
16 Inventory of New York City Greenhouse Gas Emissions: April 2017
The City of New York released its first comprehensive greenhouse gas (GHG) inventory
in April 2007 (2005 Inventory), which informed both the citywide and City government
greenhouse gas mitigation efforts, and also established the levels from which the City’s
greenhouse gas mitigation goals are based. Local Law 22 of 2008 requires the City to
update both the citywide and City government inventories annually and to document
progress toward achieving its greenhouse gas mitigation goals.
Each year, the GHG Inventory has evolved to incorporate new and emerging carbon
accounting procedures, as well as continual improvements in calculation methodologies,
emission factors, data collection, and quality assurance. Past years’ inventory results are
then revised accordingly to reflect current methodologies and better data, and allow for
more accurate comparability across multiple years. As such, both the citywide and City
government base year and interim year inventory results have been updated in this April
2017 report, where applicable. The reliance on increasingly rigorous analysis to measure
the City’s progress toward its GHG mitigation goals and inform policy efforts demonstrates
its understanding of the critical importance of reliable, consistent, and complete GHG
emissions accounting.
Recognizing the important role cities play in combating climate change, the City of New
York joined the Global Covenant of Mayors for Climate and Energy, a global cooperative
effort among mayors and city officials to reduce GHG emissions, track progress and prepare
for the impacts of climate change. The City has committed to working with cities across
the globe and to use consistent best practices in GHG emissions accounting in a shared
effort to track progress toward climate mitigation goals, including following the guidance
of the Global Protocol for Community-Scale Greenhouse Gas Emission Inventories (GPC).
The 2015 GHG emissions inventory is GPC BASIC level compliant.
Methodology
Citywide GHG emissions are calculated and reported per the guidance of the GPC. The GHG
inventory consists of all direct and indirect GHG emissions from energy used by buildings
and other stationary sources, and natural gas distribution within New York City; on-road
transportation, railways, marine navigation, and aviation within the geographic borders of
New York City; and GHG emissions from wastewater treatment and solid waste disposed
out of the city. These sources represent the GPC BASIC level of reporting, which is used to
track the City’s GHG mitigation goals.
City Government GHG emissions are calculated and reported per the Local Government
Operations Protocol (LGOP). The City Government inventory reports GHG emissions from
operations, facilities, and sources either wholly owned by the City, or over which the City
has full authority to introduce and implement operations, health and safety, and
environmental policies (including both GHG- and non-GHG-related policies). GHG emissions
from leased real estate and vehicles and other equipment are also included. It is important
to note that additional, non-City operated public entities (e.g., Metropolitan Transportation
Authority) are not included by this definition of operational control.
17Inventory of New York City Greenhouse Gas Emissions: April 2017
Detailed methodology descriptions for both citywide and City Government GHG emissions
are included in Appendix A.
Uncertainty
A greenhouse gas inventory is both an accounting and scientific exercise; uncertainty
exists in data collection and aggregation, as well as the calculation of GHG emissions.
Uncertainty is inherently part of GHG calculations, as both the development of emission
factors and global warming potentials involve scientific uncertainty. Uncertainty also is a
part of the modeling and estimating necessary to complete GHG inventories. While a
precise margin of error has not been calculated for this GHG inventory, it is understood
that all results have some uncertain elements and should be interpreted and used
accordingly.
18 Inventory of New York City Greenhouse Gas Emissions: April 2017
Citywide Inventory
19Inventory of New York City Greenhouse Gas Emissions: April 2017
Fig. 8: Citywide Annual GHG Emissions by Sector, 2005-2015
Fig. 9: Citywide Annual GHG Emissions by Source, 2005-2015
Source: NYC Mayor’s Office Source: NYC Mayor’s Office
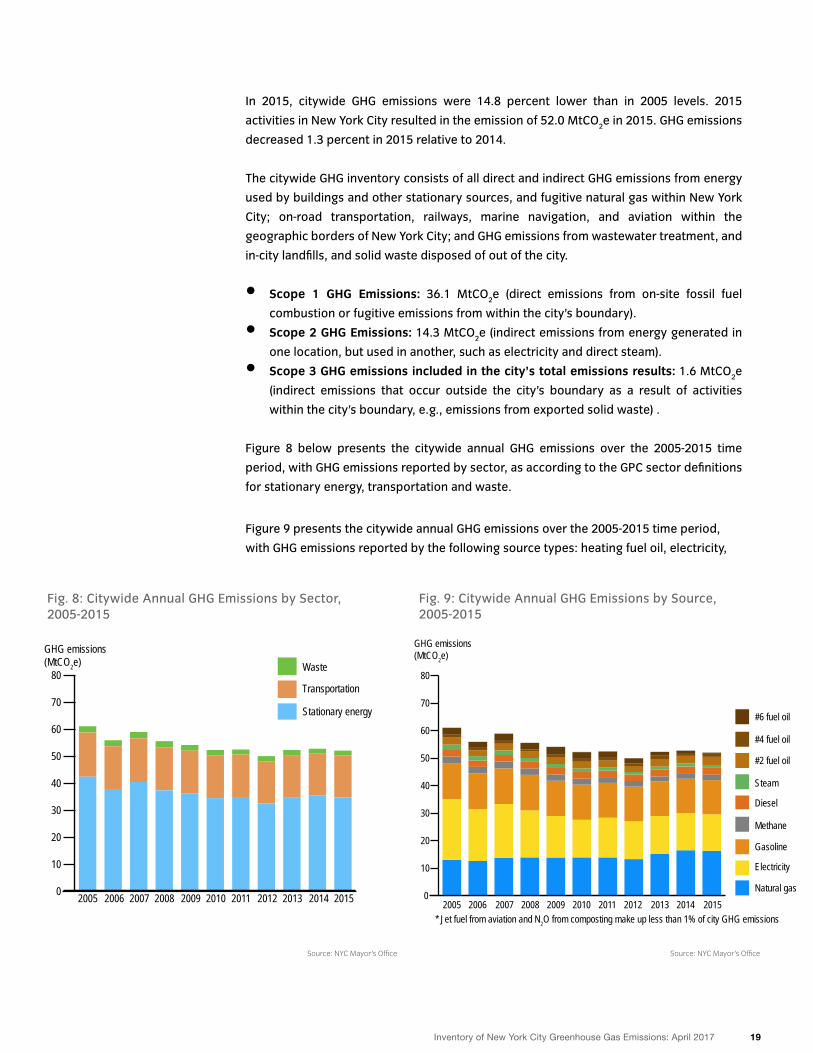
In 2015, citywide GHG emissions were 14.8 percent lower than in 2005 levels. 2015
activities in New York City resulted in the emission of 52.0 MtCO2e in 2015. GHG emissions
decreased 1.3 percent in 2015 relative to 2014.
The citywide GHG inventory consists of all direct and indirect GHG emissions from energy
used by buildings and other stationary sources, and fugitive natural gas within New York
City; on-road transportation, railways, marine navigation, and aviation within the
geographic borders of New York City; and GHG emissions from wastewater treatment, and
in-city landfills, and solid waste disposed of out of the city.
• Scope 1 GHG Emissions: 36.1 MtCO2e (direct emissions from on-site fossil fuel
combustion or fugitive emissions from within the city’s boundary).
• Scope 2 GHG Emissions: 14.3 MtCO2e (indirect emissions from energy generated in
one location, but used in another, such as electricity and direct steam).
• Scope 3 GHG emissions included in the city’s total emissions results: 1.6 MtCO2e
(indirect emissions that occur outside the city’s boundary as a result of activities
within the city’s boundary, e.g., emissions from exported solid waste) .
Figure 8 below presents the citywide annual GHG emissions over the 2005-2015 time
period, with GHG emissions reported by sector, as according to the GPC sector definitions
for stationary energy, transportation and waste.
Figure 9 presents the citywide annual GHG emissions over the 2005-2015 time period,
with GHG emissions reported by the following source types: heating fuel oil, electricity,
0
10
20
30
40
50
60
70
80 Waste
Transportation
Stationary energy
20152014201320122011201020092008200720062005
GHG emissions(MtCO2e)
0
10
20
30
40
50
60
70
80Nitrous oxide
Other
#6 fuel oil
#4 fuel oil
#2 fuel oil
Steam
Diesel
Methane
Gasoline
Electricity
Natural gas20152014201320122011201020092008200720062005
* Jet fuel from aviation and N2O from composting make up less than 1% of city GHG emissions
GHG emissions(MtCO2e)
20 Inventory of New York City Greenhouse Gas Emissions: April 2017
GHG Accounting ScopesNew York City’s GHG inventory follows standard international conventions for municipal GHG emissions reporting.
GHG accounting practice has historically classified emissions by “Scopes” per the World Resources Institute/World Busi-
ness Council for Sustainable Development’s Greenhouse Gas Protocol, the world’s corporate GHG accounting standard
and the standard upon which many other GHG accounting protocols are based, including the GPC. Following the GPC guid-
ance, New York City defines Scopes as:
• Scope 1: Direct emissions from on-site fossil fuel combustion or fugitive emissions from within the city’s boundary.
• Scope 2: Indirect emissions from energy generated in one location, but used in another, such as district electricity and
district steam use.
• Scope 3: Indirect emissions that occur outside the city’s boundary as a result of activities within the city’s boundary,
e.g., emissions from exported solid waste.
The City’s inventory includes: all Scope 1 emissions from buildings and industrial facilities within the city, vehicles oper-
ated within the city, and wastewater managed within the city; all Scope 2 emissions from electricity and steam used in
buildings, industrial facilities, streetlights, and transit systems within the city; and Scope 3 emissions from solid waste
generated within the city but disposed of outside of the city’s boundary. Examples of Scope 3 emissions that are not
included in New York City’s inventory include emissions from extraction and production of purchased materials, trans-
portation of purchased fuels, and use of sold products and services.
The City may revise its GHG reporting approach to include additional sources (including consumption-based emissions)
as applicable GHG protocols evolve.
natural gas, steam, gasoline,diesel (transportation fuel), fugitive waste/methane emis-
sions (e.g., from landfills), and other (jet fuel from aviation, N2O from composting, and CO
2
from waste incineration.
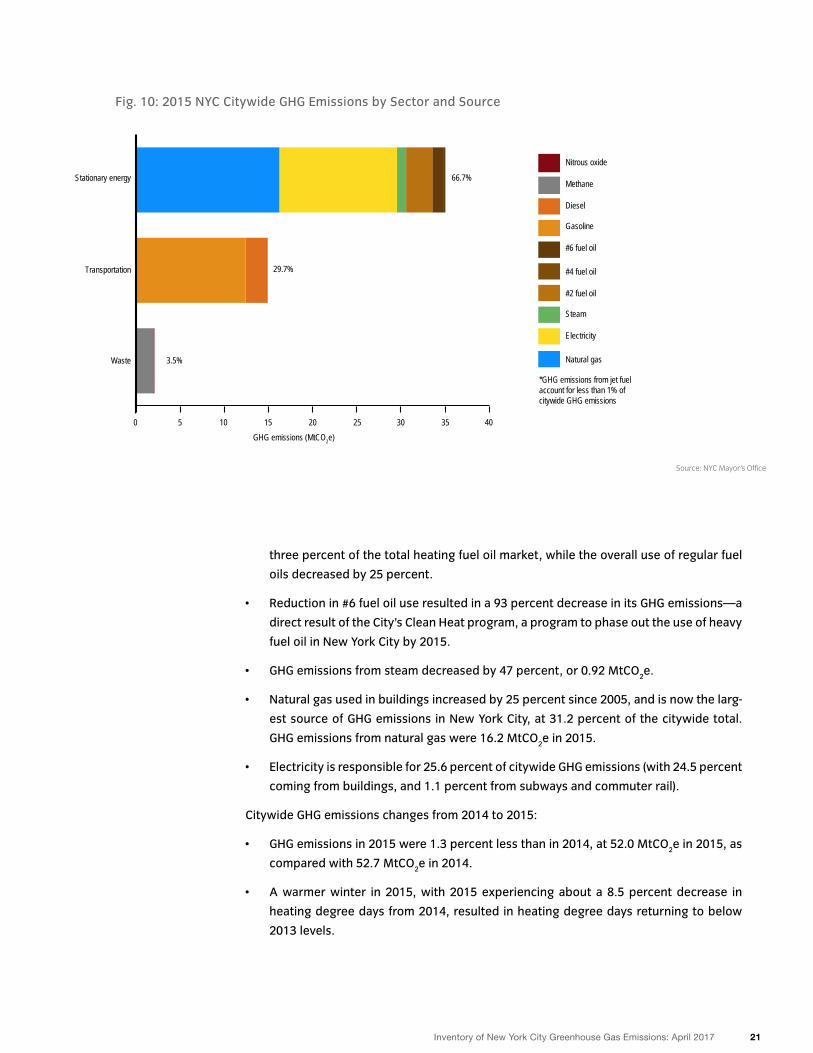
Figure 10 provides additional details on the 2015 citywide GHG emissions inventory.
Shown are the overall contributions to the citywide GHG inventory both by the various
sectors (i.e., stationary energy, transportation, and waste) and by the individual energy/
emissions source type. Stationary energy emissions are the dominant sector of the
citywide 2015 GHG inventory, contributing approximately 67 percent of the total citywide
GHG emissions. Natural gas and electricity contribute approximately 31 and 25 percent of
the citywide total, respectively.
Key FindingsCitywide GHG emissions changes from 2005 to 2015:
• Citywide GHG emissions were reduced by 14.8 percent.
• Biofuel use in buildings increased by a factor greater than 10, representing almost
21Inventory of New York City Greenhouse Gas Emissions: April 2017
Fig. 10: 2015 NYC Citywide GHG Emissions by Sector and Source
Source: NYC Mayor’s Office
three percent of the total heating fuel oil market, while the overall use of regular fuel
oils decreased by 25 percent.
• Reduction in #6 fuel oil use resulted in a 93 percent decrease in its GHG emissions—a
direct result of the City’s Clean Heat program, a program to phase out the use of heavy
fuel oil in New York City by 2015.
• GHG emissions from steam decreased by 47 percent, or 0.92 MtCO2e.
• Natural gas used in buildings increased by 25 percent since 2005, and is now the larg-
est source of GHG emissions in New York City, at 31.2 percent of the citywide total.
GHG emissions from natural gas were 16.2 MtCO2e in 2015.
• Electricity is responsible for 25.6 percent of citywide GHG emissions (with 24.5 percent
coming from buildings, and 1.1 percent from subways and commuter rail).
Citywide GHG emissions changes from 2014 to 2015:
• GHG emissions in 2015 were 1.3 percent less than in 2014, at 52.0 MtCO2e in 2015, as
compared with 52.7 MtCO2e in 2014.
• A warmer winter in 2015, with 2015 experiencing about a 8.5 percent decrease in
heating degree days from 2014, resulted in heating degree days returning to below
2013 levels.
0 5 10 15 20 25 30 35 40
Nitrous oxide
Methane
Diesel
Gasoline
#6 fuel oil
#4 fuel oil
#2 fuel oil
Steam
Electricity
Natural gas Waste
Transportation
Stationary energy 66.7%
29.7%
3.5%
GHG emissions (MtCO2e)
*GHG emissions from jet fuel account for less than 1% of citywide GHG emissions
22Inventory of New York City Greenhouse Gas Emissions: April 2017
Citywide GHG Emissions by SectorStationary energy
New York City’s building stock is massive and diverse, ranging from small single-family
homes to some of the world’s largest skyscrapers. The operation of these buildings is
responsible for the majority of the city’s GHG emissions. This enormous building stock
presents a prime opportunity for GHG mitigation measures, and the City has focused
many of its GHG mitigation policies on the city’s existing buildings, 75 percent of which
are expected to still be in existence by 2030.
From 2005 to 2015 GHG emissions from citywide stationary energy used in buildings
and facilities decreased by 18.1 percent, or 7.7 MtCO2e. Less carbon-intensive electricity
played the most significant role in driving down those emissions.
Note that GHG emissions from natural gas increased by 3.20 MtCO2e over the 2005-2015
time period. This evidence of increased natural gas use is due to the continued low pric-
es of natural gas available for residential, commercial, and industrial customers; the con-
struction of new buildings, which typically use natural gas; and the City’s Clean Heat Pro-
gram, which is designed to phase out the use of heavy heating oil, or #6 oil (which has been
largely accomplished by the City as of 2015). Thus, while natural gas emissions rose over
the 2005-2015 time period, the net environmental effect was positive in that the wider
use of natural gas caused a significant decline in the burning of more highly polluting oil.
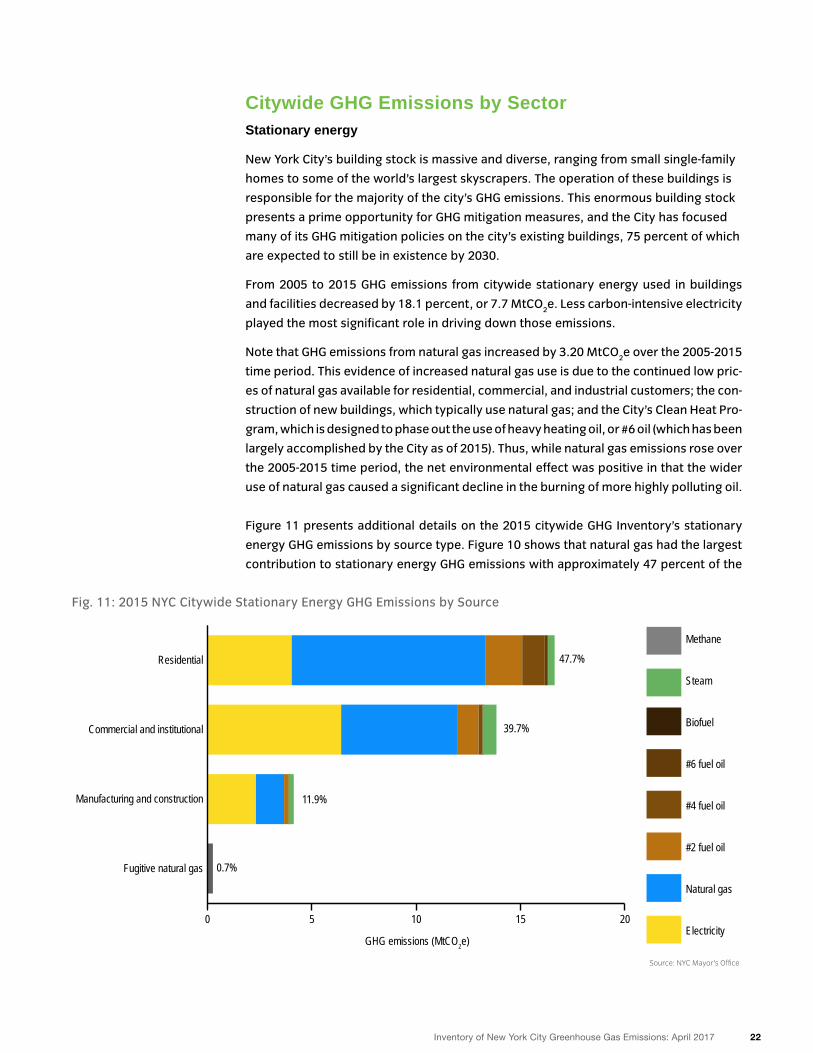
Figure 11 presents additional details on the 2015 citywide GHG Inventory’s stationary
energy GHG emissions by source type. Figure 10 shows that natural gas had the largest
contribution to stationary energy GHG emissions with approximately 47 percent of the
Source: NYC Mayor’s Office
Fig. 11: 2015 NYC Citywide Stationary Energy GHG Emissions by Source
0 5 10 15 20
Methane
Steam
Biofuel
#6 fuel oil
#4 fuel oil
#2 fuel oil
Natural gas
Electricity
Fugitive natural gas
Manufacturing and construction
Commercial and institutional
Residential 47.7%
39.7%
11.9%
0.7%
GHG emissions (MtCO2e)
23 Inventory of New York City Greenhouse Gas Emissions: April 2017
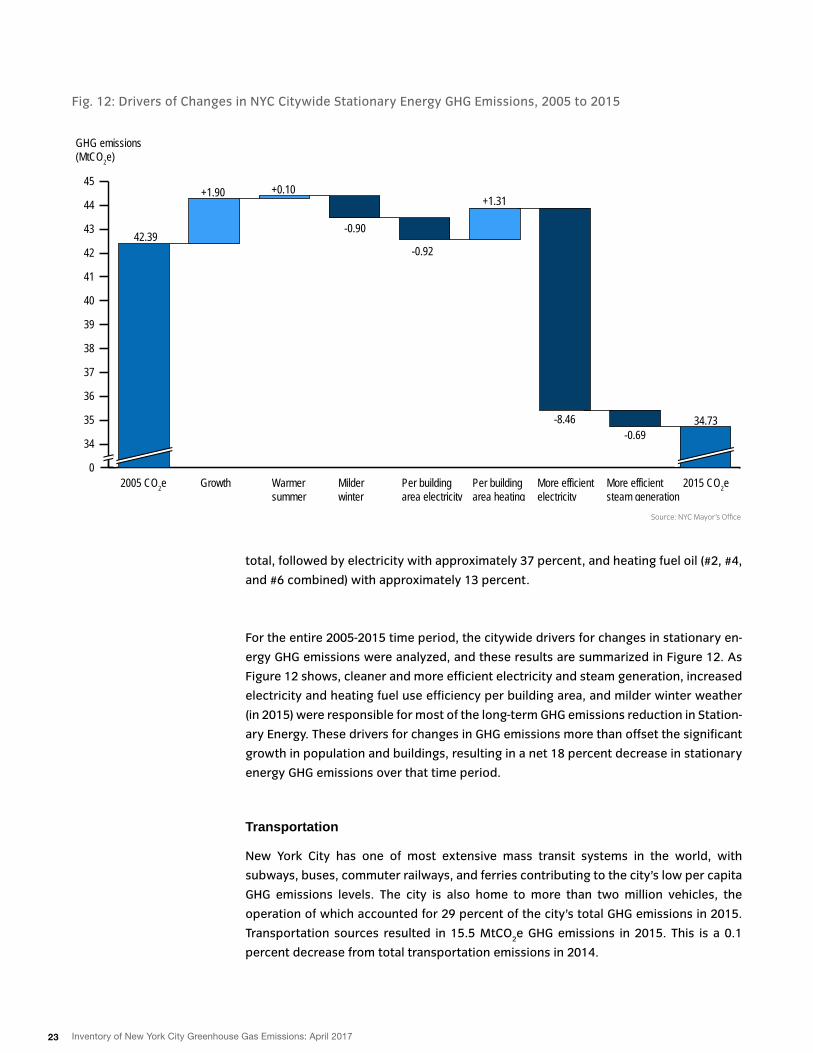
Fig. 12: Drivers of Changes in NYC Citywide Stationary Energy GHG Emissions, 2005 to 2015
Source: NYC Mayor’s Office
0
34
35
36
37
38
39
40
41
42
43
44
45
2015 CO2eMore efficient steam generation
More efficient electricity generation
Per building area heatingfuel use
Per building area electricity use
Milder winter
Warmer summer
Growth2005 CO2e
42.39
+1.90 +0.10
-0.90
-0.92
+1.31
-8.46-0.69
34.73
GHG emissions(MtCO2e)
total, followed by electricity with approximately 37 percent, and heating fuel oil (#2, #4,
and #6 combined) with approximately 13 percent.
For the entire 2005-2015 time period, the citywide drivers for changes in stationary en-
ergy GHG emissions were analyzed, and these results are summarized in Figure 12. As
Figure 12 shows, cleaner and more efficient electricity and steam generation, increased
electricity and heating fuel use efficiency per building area, and milder winter weather
(in 2015) were responsible for most of the long-term GHG emissions reduction in Station-
ary Energy. These drivers for changes in GHG emissions more than offset the significant
growth in population and buildings, resulting in a net 18 percent decrease in stationary
energy GHG emissions over that time period.
Transportation
New York City has one of most extensive mass transit systems in the world, with
subways, buses, commuter railways, and ferries contributing to the city’s low per capita
GHG emissions levels. The city is also home to more than two million vehicles, the
operation of which accounted for 29 percent of the city’s total GHG emissions in 2015.
Transportation sources resulted in 15.5 MtCO2e GHG emissions in 2015. This is a 0.1
percent decrease from total transportation emissions in 2014.
24Inventory of New York City Greenhouse Gas Emissions: April 2017
Source: NYC Mayor’s Office
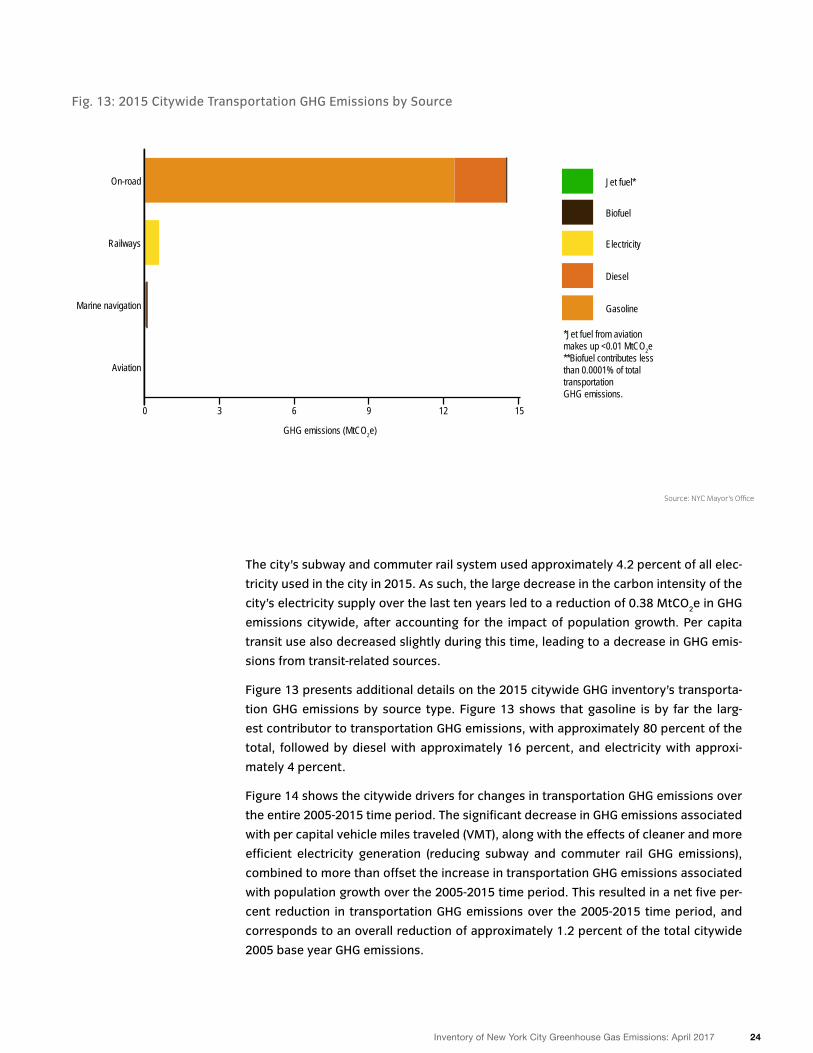
Fig. 13: 2015 Citywide Transportation GHG Emissions by Source
0 3 6 9 12 15
Jet fuel*
Biofuel
Electricity
Diesel
Gasoline
Aviation
Marine navigation
Railways
On-road
GHG emissions (MtCO2e)
*Jet fuel from aviation makes up <0.01 MtCO2e**Biofuel contributes less than 0.0001% of total transportation GHG emissions.
The city’s subway and commuter rail system used approximately 4.2 percent of all elec-
tricity used in the city in 2015. As such, the large decrease in the carbon intensity of the
city’s electricity supply over the last ten years led to a reduction of 0.38 MtCO2e in GHG
emissions citywide, after accounting for the impact of population growth. Per capita
transit use also decreased slightly during this time, leading to a decrease in GHG emis-
sions from transit-related sources.
Figure 13 presents additional details on the 2015 citywide GHG inventory’s transporta-
tion GHG emissions by source type. Figure 13 shows that gasoline is by far the larg-
est contributor to transportation GHG emissions, with approximately 80 percent of the
total, followed by diesel with approximately 16 percent, and electricity with approxi-
mately 4 percent.
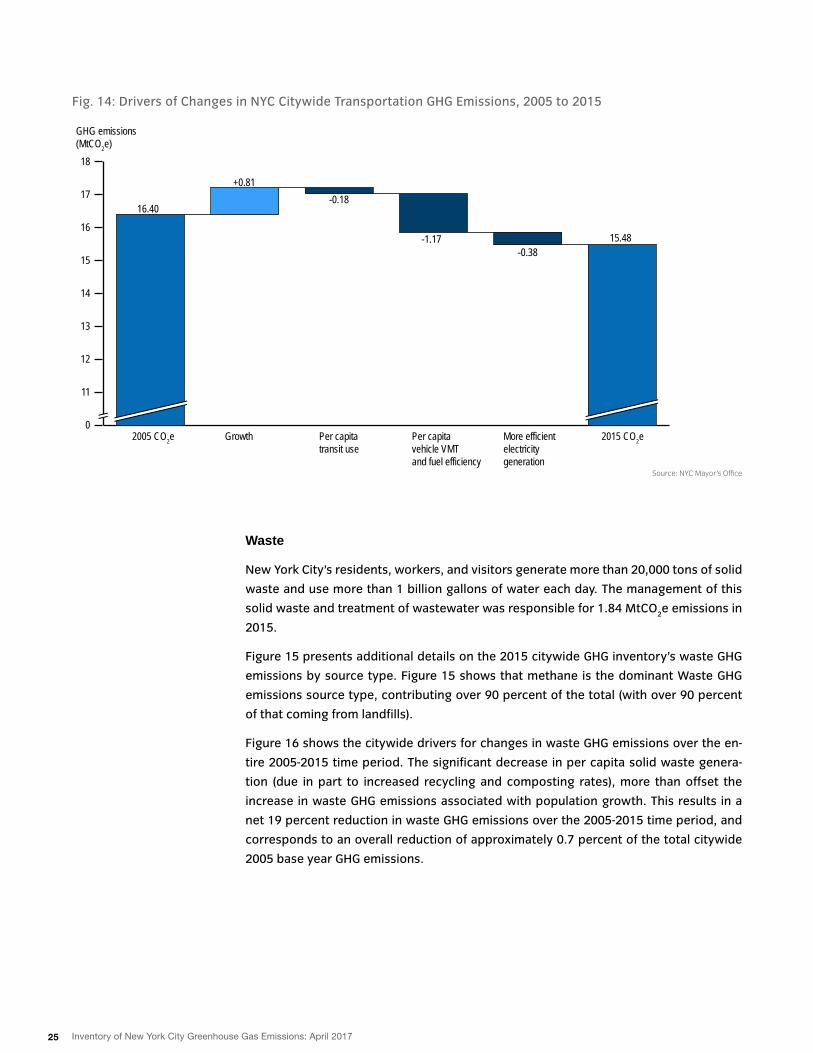
Figure 14 shows the citywide drivers for changes in transportation GHG emissions over
the entire 2005-2015 time period. The significant decrease in GHG emissions associated
with per capital vehicle miles traveled (VMT), along with the effects of cleaner and more
efficient electricity generation (reducing subway and commuter rail GHG emissions),
combined to more than offset the increase in transportation GHG emissions associated
with population growth over the 2005-2015 time period. This resulted in a net five per-
cent reduction in transportation GHG emissions over the 2005-2015 time period, and
corresponds to an overall reduction of approximately 1.2 percent of the total citywide
2005 base year GHG emissions.
25 Inventory of New York City Greenhouse Gas Emissions: April 2017
Fig. 14: Drivers of Changes in NYC Citywide Transportation GHG Emissions, 2005 to 2015
Source: NYC Mayor’s Office
0
11
12
13
14
15
16
17
18
2015 CO2eMore efficient electricity generation
Per capitavehicle VMT and fuel efficiency
Per capita transit use
Growth2005 CO2e
16.40
+0.81-0.18
-1.17-0.38
15.48
GHG emissions(MtCO2e)
Waste
New York City’s residents, workers, and visitors generate more than 20,000 tons of solid
waste and use more than 1 billion gallons of water each day. The management of this
solid waste and treatment of wastewater was responsible for 1.84 MtCO2e emissions in
2015.
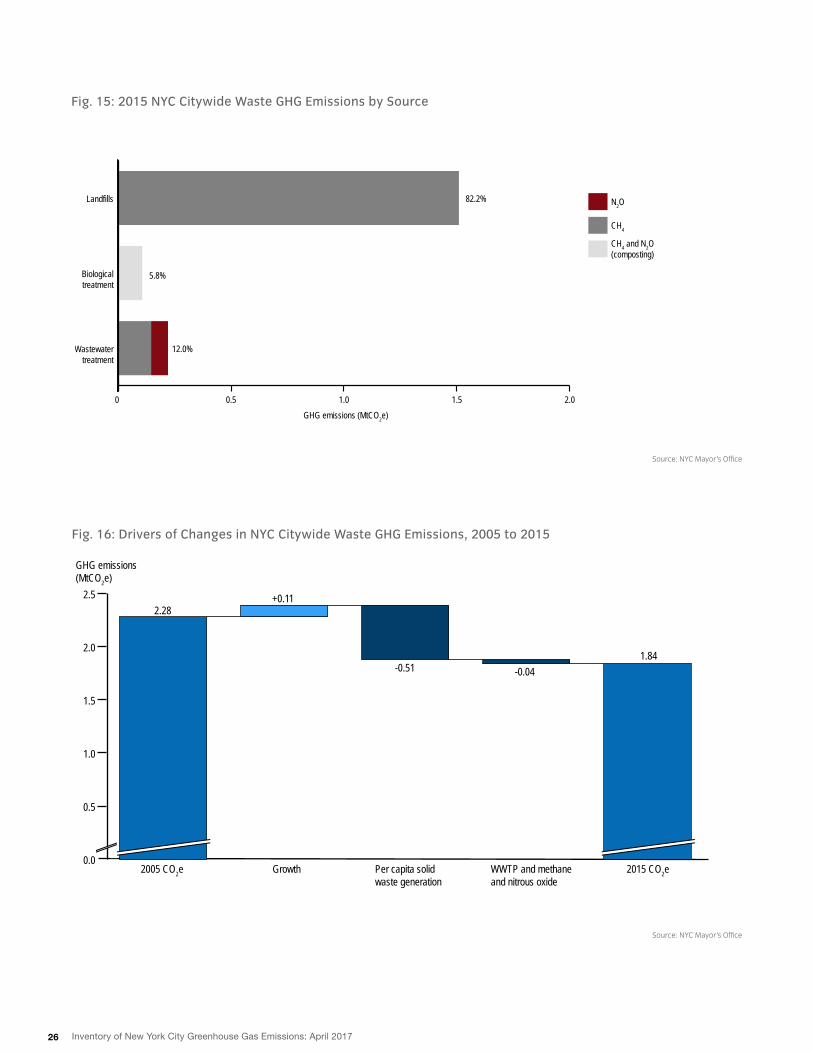
Figure 15 presents additional details on the 2015 citywide GHG inventory’s waste GHG
emissions by source type. Figure 15 shows that methane is the dominant Waste GHG
emissions source type, contributing over 90 percent of the total (with over 90 percent
of that coming from landfills).
Figure 16 shows the citywide drivers for changes in waste GHG emissions over the en-
tire 2005-2015 time period. The significant decrease in per capita solid waste genera-
tion (due in part to increased recycling and composting rates), more than offset the
increase in waste GHG emissions associated with population growth. This results in a
net 19 percent reduction in waste GHG emissions over the 2005-2015 time period, and
corresponds to an overall reduction of approximately 0.7 percent of the total citywide
2005 base year GHG emissions.
26 Inventory of New York City Greenhouse Gas Emissions: April 2017
Source: NYC Mayor’s Office
Fig. 15: 2015 NYC Citywide Waste GHG Emissions by Source
Fig. 16: Drivers of Changes in NYC Citywide Waste GHG Emissions, 2005 to 2015
Source: NYC Mayor’s Office
0.0
0.5
1.0
1.5
2.0
2.5
2015 CO2eWWTP and methane and nitrous oxide
Per capita solid waste generation
Growth2005 CO2e
2.28+0.11
-0.51 -0.041.84
GHG emissions(MtCO2e)
0 0.5 1.0 1.5 2.0
N2O
CH4
CH4 and N2O (composting)
Wastewater treatment
Biological treatment
Landfills 82.2%
5.8%
12.0%
GHG emissions (MtCO2e)
27 Inventory of New York City Greenhouse Gas Emissions: April 2017
City Government Inventory
28 Inventory of New York City Greenhouse Gas Emissions: April 2017
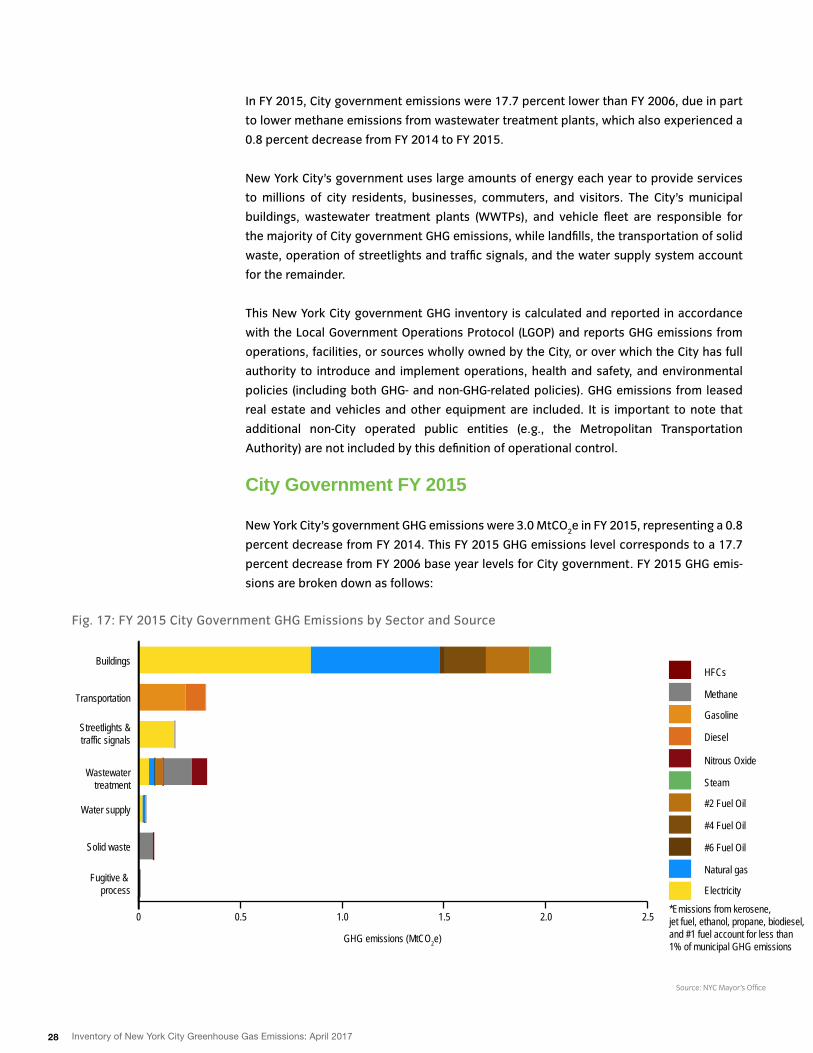
In FY 2015, City government emissions were 17.7 percent lower than FY 2006, due in part
to lower methane emissions from wastewater treatment plants, which also experienced a
0.8 percent decrease from FY 2014 to FY 2015.
New York City’s government uses large amounts of energy each year to provide services
to millions of city residents, businesses, commuters, and visitors. The City’s municipal
buildings, wastewater treatment plants (WWTPs), and vehicle fleet are responsible for
the majority of City government GHG emissions, while landfills, the transportation of solid
waste, operation of streetlights and traffic signals, and the water supply system account
for the remainder.
This New York City government GHG inventory is calculated and reported in accordance
with the Local Government Operations Protocol (LGOP) and reports GHG emissions from
operations, facilities, or sources wholly owned by the City, or over which the City has full
authority to introduce and implement operations, health and safety, and environmental
policies (including both GHG- and non-GHG-related policies). GHG emissions from leased
real estate and vehicles and other equipment are included. It is important to note that
additional non-City operated public entities (e.g., the Metropolitan Transportation
Authority) are not included by this definition of operational control.
City Government FY 2015
New York City’s government GHG emissions were 3.0 MtCO2e in FY 2015, representing a 0.8
percent decrease from FY 2014. This FY 2015 GHG emissions level corresponds to a 17.7
percent decrease from FY 2006 base year levels for City government. FY 2015 GHG emis-
sions are broken down as follows:
Fig. 17: FY 2015 City Government GHG Emissions by Sector and Source
Source: NYC Mayor’s Office
HFCs
Methane
Gasoline
Diesel
Nitrous Oxide
Steam
#2 Fuel Oil
#4 Fuel Oil
#6 Fuel Oil
Natural gas
ElectricityFugitive &
process
Solid waste
Water supply
Wastewatertreatment
Streetlights & traffic signals
Transportation
Buildings
*Emissions from kerosene, jet fuel, ethanol, propane, biodiesel,and #1 fuel account for less than 1% of municipal GHG emissions
0 0.5 1.0 1.5 2.0 2.5
GHG emissions (MtCO2e)
29Inventory of New York City Greenhouse Gas Emissions: April 2017
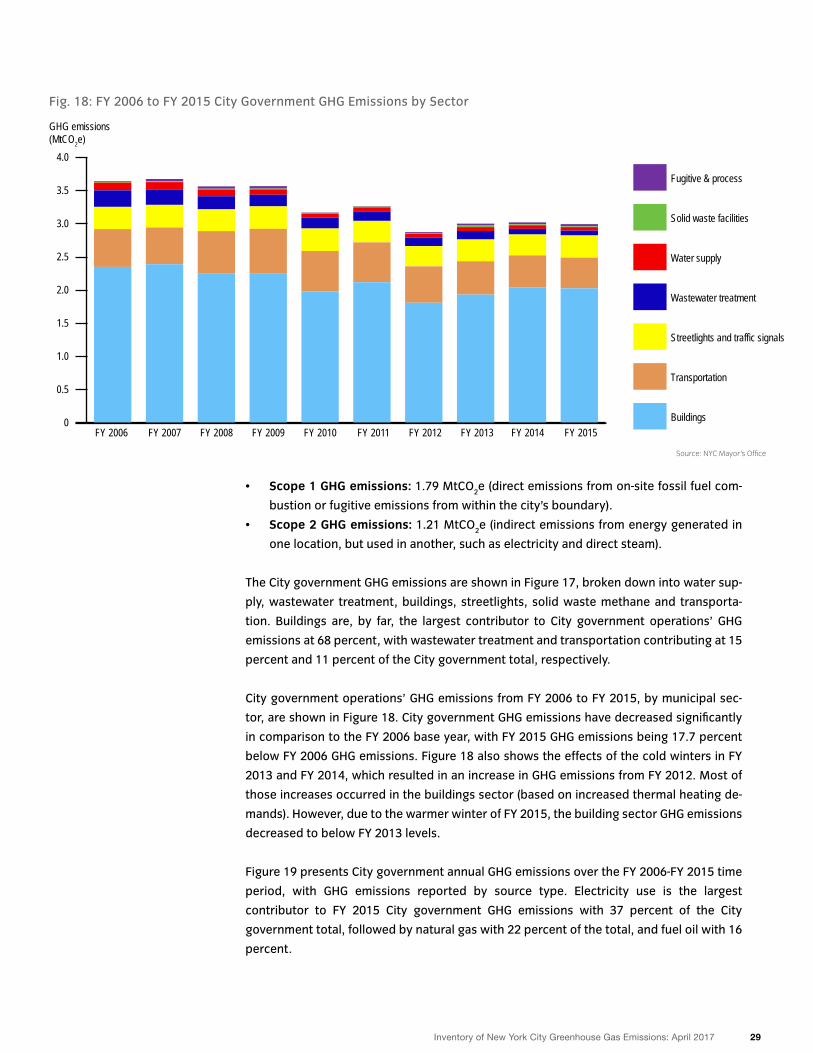
Fig. 18: FY 2006 to FY 2015 City Government GHG Emissions by Sector
Source: NYC Mayor’s Office
0
0.5
1.0
1.5
2.0
2.5
3.0
3.5
4.0
Fugitive & process
Solid waste facilities
Water supply
Wastewater treatment
Streetlights and traffic signals
Transportation
BuildingsFY 2015FY 2014FY 2013FY 2012FY 2011FY 2010FY 2009FY 2008FY 2007FY 2006
GHG emissions(MtCO2e)
• Scope 1 GHG emissions: 1.79 MtCO2e (direct emissions from on-site fossil fuel com-
bustion or fugitive emissions from within the city’s boundary).
• Scope 2 GHG emissions: 1.21 MtCO2e (indirect emissions from energy generated in
one location, but used in another, such as electricity and direct steam).
The City government GHG emissions are shown in Figure 17, broken down into water sup-
ply, wastewater treatment, buildings, streetlights, solid waste methane and transporta-
tion. Buildings are, by far, the largest contributor to City government operations’ GHG
emissions at 68 percent, with wastewater treatment and transportation contributing at 15
percent and 11 percent of the City government total, respectively.
City government operations’ GHG emissions from FY 2006 to FY 2015, by municipal sec-
tor, are shown in Figure 18. City government GHG emissions have decreased significantly
in comparison to the FY 2006 base year, with FY 2015 GHG emissions being 17.7 percent
below FY 2006 GHG emissions. Figure 18 also shows the effects of the cold winters in FY
2013 and FY 2014, which resulted in an increase in GHG emissions from FY 2012. Most of
those increases occurred in the buildings sector (based on increased thermal heating de-
mands). However, due to the warmer winter of FY 2015, the building sector GHG emissions
decreased to below FY 2013 levels.
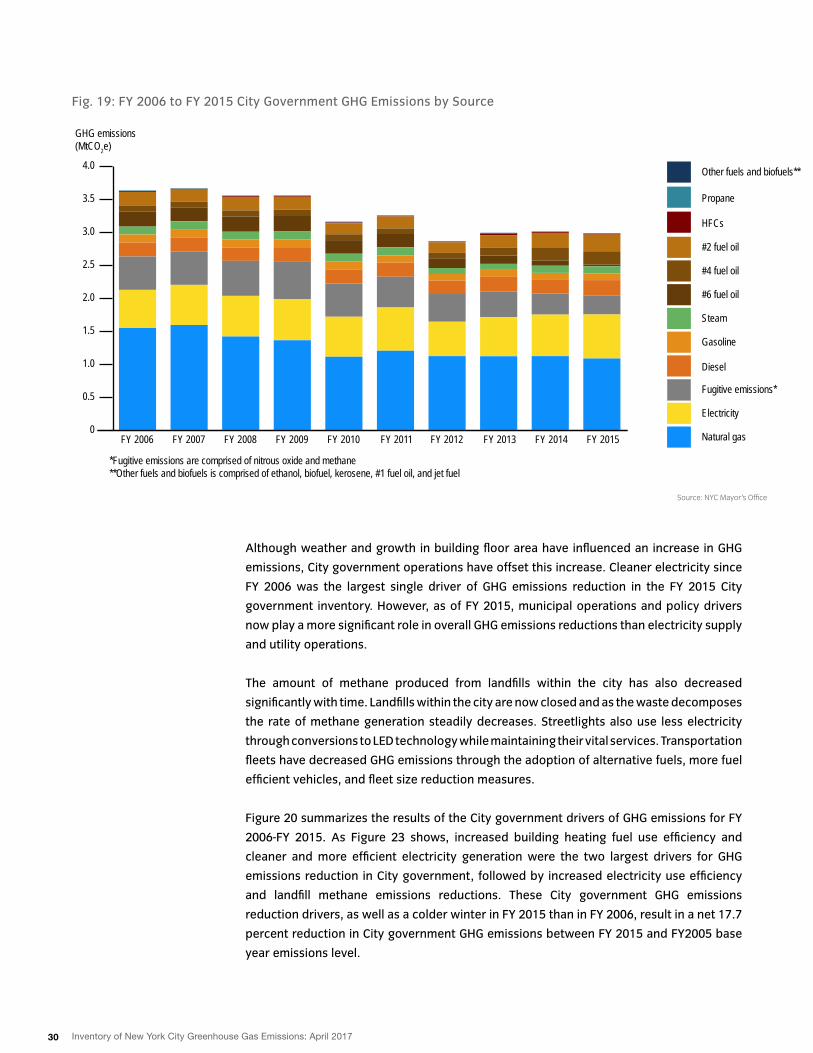
Figure 19 presents City government annual GHG emissions over the FY 2006-FY 2015 time
period, with GHG emissions reported by source type. Electricity use is the largest
contributor to FY 2015 City government GHG emissions with 37 percent of the City
government total, followed by natural gas with 22 percent of the total, and fuel oil with 16
percent.
30 Inventory of New York City Greenhouse Gas Emissions: April 2017
Although weather and growth in building floor area have influenced an increase in GHG
emissions, City government operations have offset this increase. Cleaner electricity since
FY 2006 was the largest single driver of GHG emissions reduction in the FY 2015 City
government inventory. However, as of FY 2015, municipal operations and policy drivers
now play a more significant role in overall GHG emissions reductions than electricity supply
and utility operations.
The amount of methane produced from landfills within the city has also decreased
significantly with time. Landfills within the city are now closed and as the waste decomposes
the rate of methane generation steadily decreases. Streetlights also use less electricity
through conversions to LED technology while maintaining their vital services. Transportation
fleets have decreased GHG emissions through the adoption of alternative fuels, more fuel
efficient vehicles, and fleet size reduction measures.
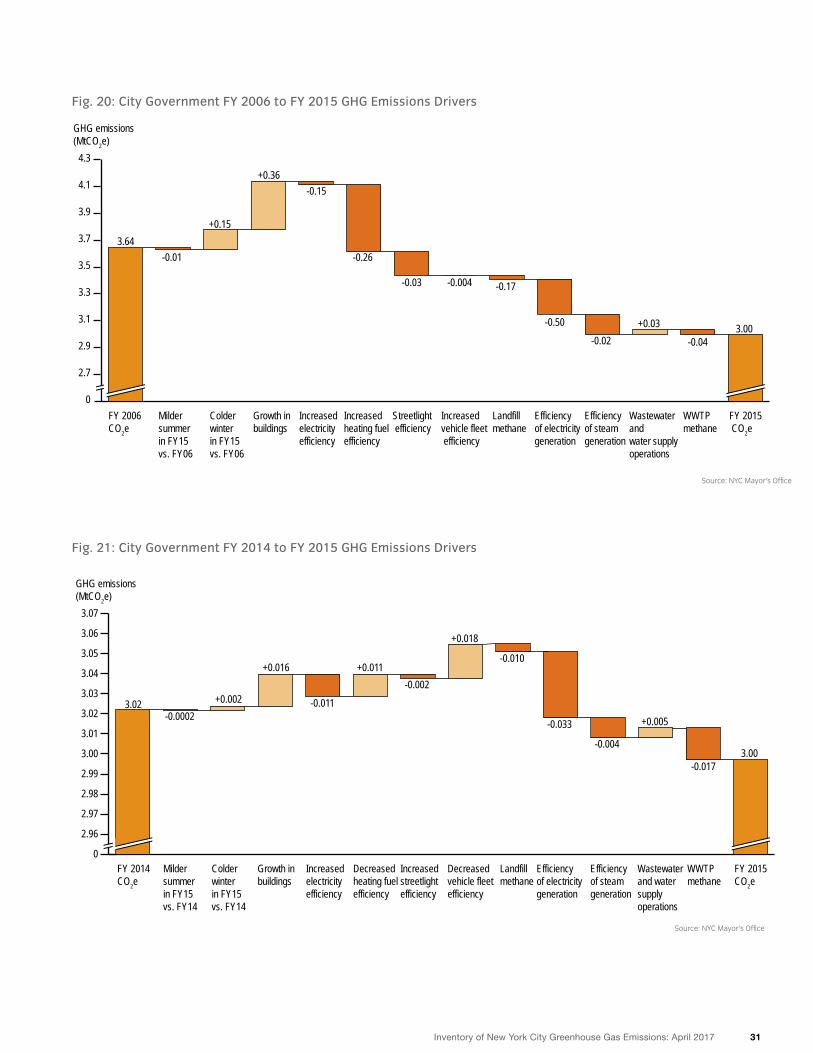
Figure 20 summarizes the results of the City government drivers of GHG emissions for FY
2006-FY 2015. As Figure 23 shows, increased building heating fuel use efficiency and
cleaner and more efficient electricity generation were the two largest drivers for GHG
emissions reduction in City government, followed by increased electricity use efficiency
and landfill methane emissions reductions. These City government GHG emissions
reduction drivers, as well as a colder winter in FY 2015 than in FY 2006, result in a net 17.7
percent reduction in City government GHG emissions between FY 2015 and FY2005 base
year emissions level.
Fig. 19: FY 2006 to FY 2015 City Government GHG Emissions by Source
Source: NYC Mayor’s Office
0
0.5
1.0
1.5
2.0
2.5
3.0
3.5
4.0 Other fuels and biofuels**
Propane
HFCs
#2 fuel oil
#4 fuel oil
#6 fuel oil
Steam
Gasoline
Diesel
Fugitive emissions*
Electricity
Natural gasFY 2015FY 2014FY 2013FY 2012FY 2011FY 2010FY 2009FY 2008FY 2007FY 2006
*Fugitive emissions are comprised of nitrous oxide and methane**Other fuels and biofuels is comprised of ethanol, biofuel, kerosene, #1 fuel oil, and jet fuel
GHG emissions(MtCO2e)
31Inventory of New York City Greenhouse Gas Emissions: April 2017
Fig. 20: City Government FY 2006 to FY 2015 GHG Emissions Drivers
Source: NYC Mayor’s Office
0
2.7
2.9
3.1
3.3
3.5
3.7
3.9
4.1
4.3
FY 2015 CO2e
WWTP methane
Wastewater and water supply operations
Efficiency of steam generation
Efficiency of electricity generation
Landfill methane
Increased vehicle fleet efficiency
Streetlight efficiency
Increased heating fuel efficiency
Increasedelectricity efficiency
Growth inbuildings
Colder winter in FY15 vs. FY06
Milder summerin FY15 vs. FY06
FY 2006 CO2e
3.64-0.01
+0.15
+0.36-0.15
-0.26
-0.03 -0.004 -0.17
-0.50
-0.02+0.03
-0.043.00
GHG emissions(MtCO2e)
Fig. 21: City Government FY 2014 to FY 2015 GHG Emissions Drivers
Source: NYC Mayor’s Office
0
2.96
2.97
2.98
2.99
3.00
3.01
3.02
3.03
3.04
3.05
3.06
3.07
FY 2015 CO2e
WWTP methane
Wastewater and water supply operations
Efficiency of steam generation
Efficiency of electricity generation
Landfill methane
Decreased vehicle fleet efficiency
Increased streetlight efficiency
Decreased heating fuel efficiency
Increased electricity efficiency
Growth in buildings
Colder winter in FY15 vs. FY14
Milder summer in FY15 vs. FY14
FY 2014 CO2e
Dataset: 2015 Comm & Muni WALKS v1 MB.xlsx
AND
MUNI DETAILED WALK, FY 2014-FY 2015
3.02-0.0002
+0.002
+0.016
-0.011
+0.011-0.002
+0.018
-0.010
-0.033
-0.004
+0.005
-0.0173.00
GHG emissions(MtCO2e)
32 Inventory of New York City Greenhouse Gas Emissions: April 2017
Source: NYC Mayor’s Office
Fig. 22: FY 2015 City Government Buildings and Streetlights GHG Emissions by Source
0 0.5 1.0 1.5 2.0 2.5
Steam
#2 Fuel Oil
#4 Fuel Oil
#6 Fuel Oil
Natural gas
Electricity
Buildings & Streetlights
*GHG emissions from propane, biodiesel, and kerosene account for <0.02% of total City Government Buildings emissions
GHG Emissions (MtCO2e)
A similar analysis of emissions drivers was also performed for the year-by-year changes
from FY 2014 to FY 2015; the results of that analysis are shown in Figure 21. Figure 21
clearly shows the effects of a reduction of heating fuel energy efficiency, producing a 0.02
MtCO2e emissions increase over FY 2014, as well as a reduction in wastewater treatment
plant CH4 emissions of 0.02 MtCO
2e, and an increase in vehicle fleet GHG emissions of 0.02
MtCO2e. These three effects, combined with all of the other emissions drivers, collectively
produced a total net decrease in City government GHG emissions in FY 2015 of 0.8 percent
below the FY 2014 GHG emissions level.
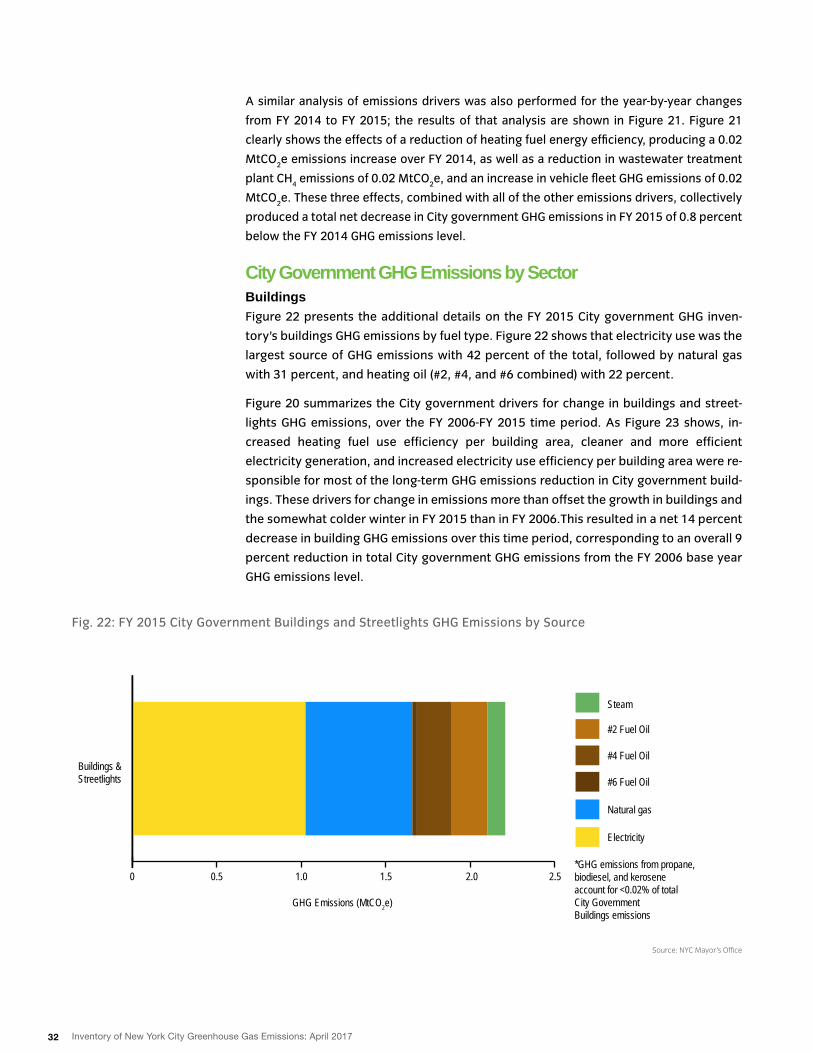
City Government GHG Emissions by Sector Buildings Figure 22 presents the additional details on the FY 2015 City government GHG inven-
tory’s buildings GHG emissions by fuel type. Figure 22 shows that electricity use was the
largest source of GHG emissions with 42 percent of the total, followed by natural gas
with 31 percent, and heating oil (#2, #4, and #6 combined) with 22 percent.
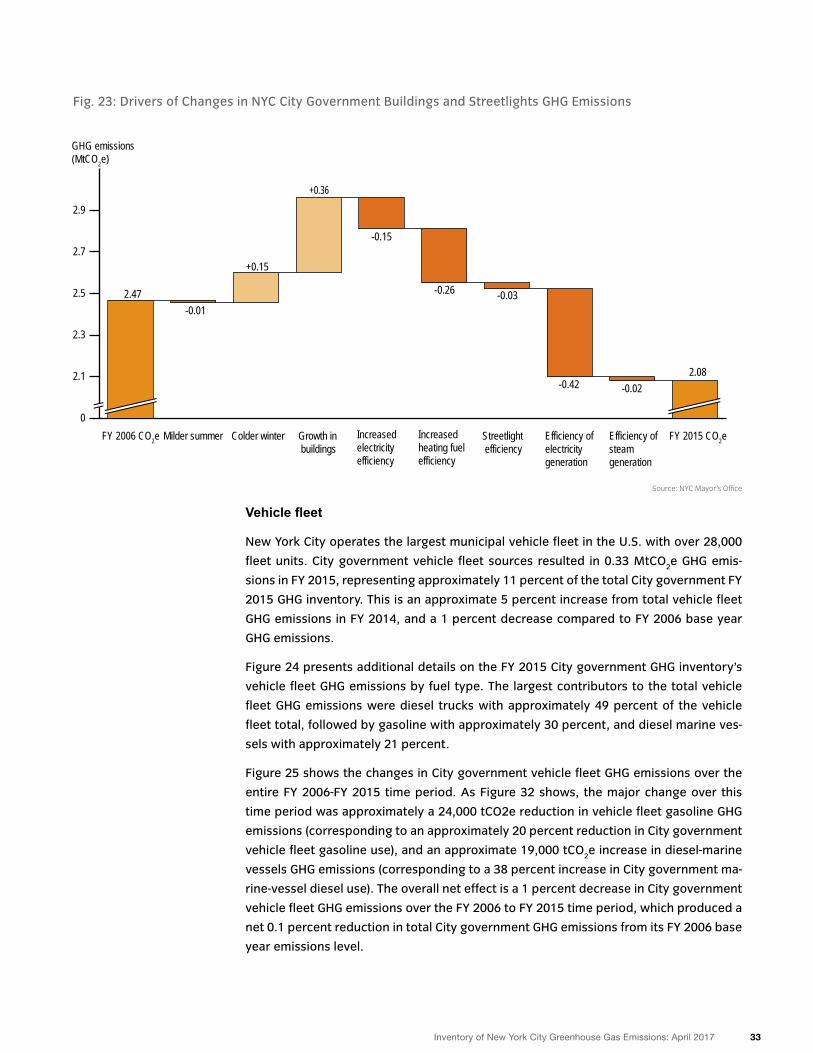
Figure 20 summarizes the City government drivers for change in buildings and street-
lights GHG emissions, over the FY 2006-FY 2015 time period. As Figure 23 shows, in-
creased heating fuel use efficiency per building area, cleaner and more efficient
electricity generation, and increased electricity use efficiency per building area were re-
sponsible for most of the long-term GHG emissions reduction in City government build-
ings. These drivers for change in emissions more than offset the growth in buildings and
the somewhat colder winter in FY 2015 than in FY 2006.This resulted in a net 14 percent
decrease in building GHG emissions over this time period, corresponding to an overall 9
percent reduction in total City government GHG emissions from the FY 2006 base year
GHG emissions level.
33Inventory of New York City Greenhouse Gas Emissions: April 2017
Vehicle fleet
New York City operates the largest municipal vehicle fleet in the U.S. with over 28,000
fleet units. City government vehicle fleet sources resulted in 0.33 MtCO2e GHG emis-
sions in FY 2015, representing approximately 11 percent of the total City government FY
2015 GHG inventory. This is an approximate 5 percent increase from total vehicle fleet
GHG emissions in FY 2014, and a 1 percent decrease compared to FY 2006 base year
GHG emissions.
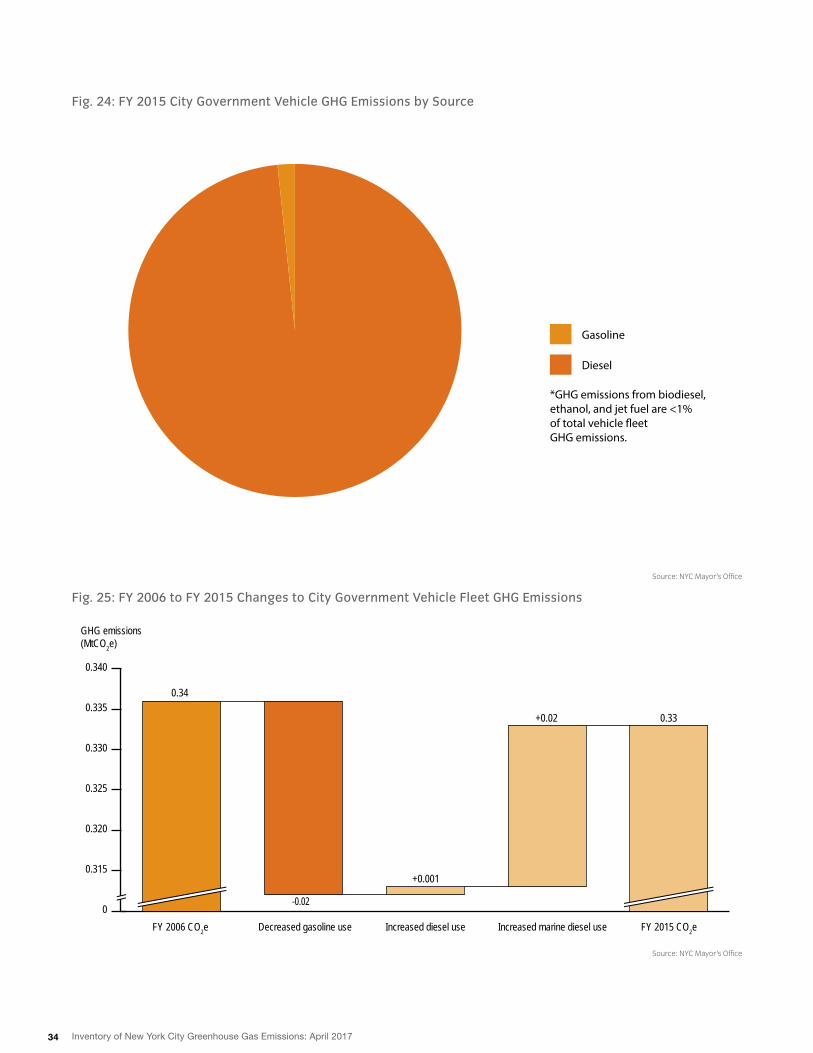
Figure 24 presents additional details on the FY 2015 City government GHG inventory’s
vehicle fleet GHG emissions by fuel type. The largest contributors to the total vehicle
fleet GHG emissions were diesel trucks with approximately 49 percent of the vehicle
fleet total, followed by gasoline with approximately 30 percent, and diesel marine ves-
sels with approximately 21 percent.
Figure 25 shows the changes in City government vehicle fleet GHG emissions over the
entire FY 2006-FY 2015 time period. As Figure 32 shows, the major change over this
time period was approximately a 24,000 tCO2e reduction in vehicle fleet gasoline GHG
emissions (corresponding to an approximately 20 percent reduction in City government
vehicle fleet gasoline use), and an approximate 19,000 tCO2e increase in diesel-marine
vessels GHG emissions (corresponding to a 38 percent increase in City government ma-
rine-vessel diesel use). The overall net effect is a 1 percent decrease in City government
vehicle fleet GHG emissions over the FY 2006 to FY 2015 time period, which produced a
net 0.1 percent reduction in total City government GHG emissions from its FY 2006 base
year emissions level.
Fig. 23: Drivers of Changes in NYC City Government Buildings and Streetlights GHG Emissions
Source: NYC Mayor’s Office
0
2.1
2.3
2.5
2.7
2.9
FY 2015 CO2eEfficiency of steam generation
Efficiency ofelectricity generation
Streetlight efficiency
Increased heating fuel efficiency
Increased electricity efficiency
Growth in buildings
Colder winterMilder summerFY 2006 CO2e
Dataset: 2015 Comm & Muni WALKS v1 MB.xlsx
AND
Buildings and Street-lights Walk - FY 2006- FY 2015
2.47-0.01
+0.15
+0.36
-0.15
-0.26 -0.03
-0.42 -0.022.08
GHG emissions(MtCO2e)
34 Inventory of New York City Greenhouse Gas Emissions: April 2017
Fig. 25: FY 2006 to FY 2015 Changes to City Government Vehicle Fleet GHG Emissions
Source: NYC Mayor’s Office
0
0.315
0.320
0.325
0.330
0.335
0.340
FY 2015 CO2eIncreased marine diesel useIncreased diesel useDecreased gasoline useFY 2006 CO2e
0.34
-0.02
+0.001
+0.02 0.33
GHG emissions(MtCO2e)
Source: NYC Mayor’s Office
Fig. 24: FY 2015 City Government Vehicle GHG Emissions by Source
Gasoline
Diesel
*GHG emissions from biodiesel, ethanol, and jet fuel are <1%of total vehicle �eet GHG emissions.
35Inventory of New York City Greenhouse Gas Emissions: April 2017
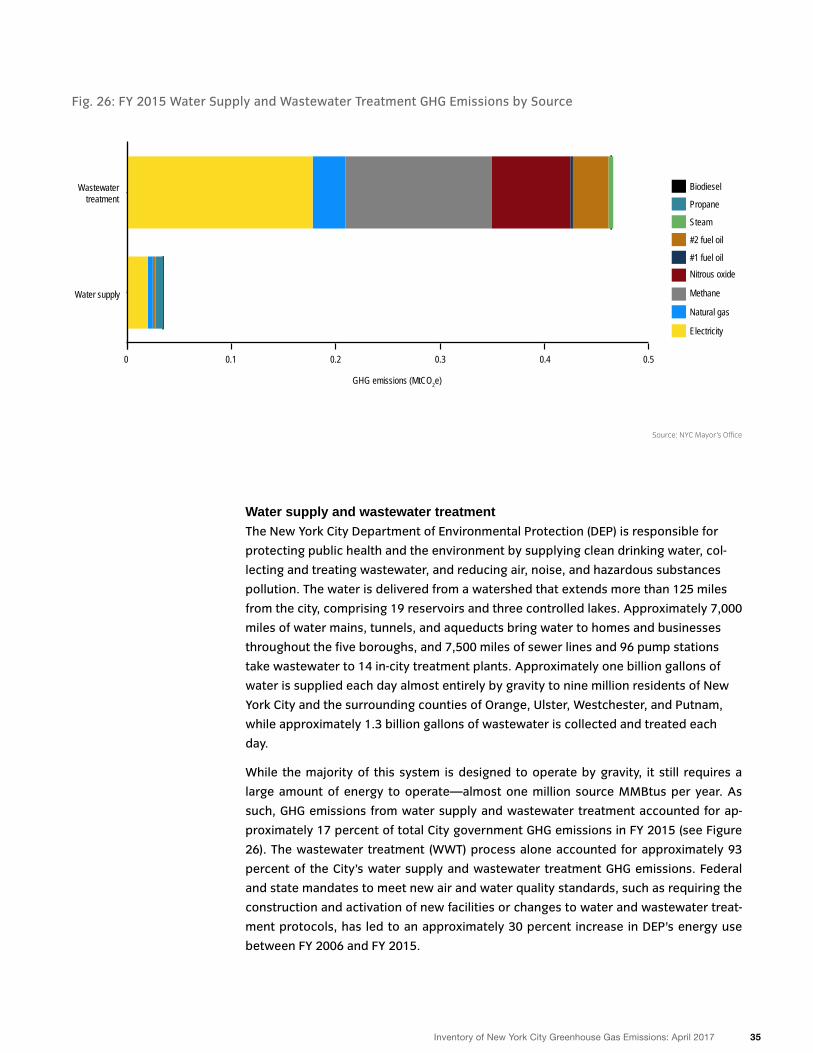
Water supply and wastewater treatment The New York City Department of Environmental Protection (DEP) is responsible for
protecting public health and the environment by supplying clean drinking water, col-
lecting and treating wastewater, and reducing air, noise, and hazardous substances
pollution. The water is delivered from a watershed that extends more than 125 miles
from the city, comprising 19 reservoirs and three controlled lakes. Approximately 7,000
miles of water mains, tunnels, and aqueducts bring water to homes and businesses
throughout the five boroughs, and 7,500 miles of sewer lines and 96 pump stations
take wastewater to 14 in-city treatment plants. Approximately one billion gallons of
water is supplied each day almost entirely by gravity to nine million residents of New
York City and the surrounding counties of Orange, Ulster, Westchester, and Putnam,
while approximately 1.3 billion gallons of wastewater is collected and treated each
day.
While the majority of this system is designed to operate by gravity, it still requires a
large amount of energy to operate—almost one million source MMBtus per year. As
such, GHG emissions from water supply and wastewater treatment accounted for ap-
proximately 17 percent of total City government GHG emissions in FY 2015 (see Figure
26). The wastewater treatment (WWT) process alone accounted for approximately 93
percent of the City’s water supply and wastewater treatment GHG emissions. Federal
and state mandates to meet new air and water quality standards, such as requiring the
construction and activation of new facilities or changes to water and wastewater treat-
ment protocols, has led to an approximately 30 percent increase in DEP’s energy use
between FY 2006 and FY 2015.
Source: NYC Mayor’s Office
Fig. 26: FY 2015 Water Supply and Wastewater Treatment GHG Emissions by Source
0 0.1 0.2 0.3 0.4 0.5
Biodiesel
Propane
Steam
#2 fuel oil
#1 fuel oilNitrous oxide
Methane
Natural gas
Electricity
Water supply
Wastewater treatment
GHG emissions (MtCO2e)
36 Inventory of New York City Greenhouse Gas Emissions: April 2017
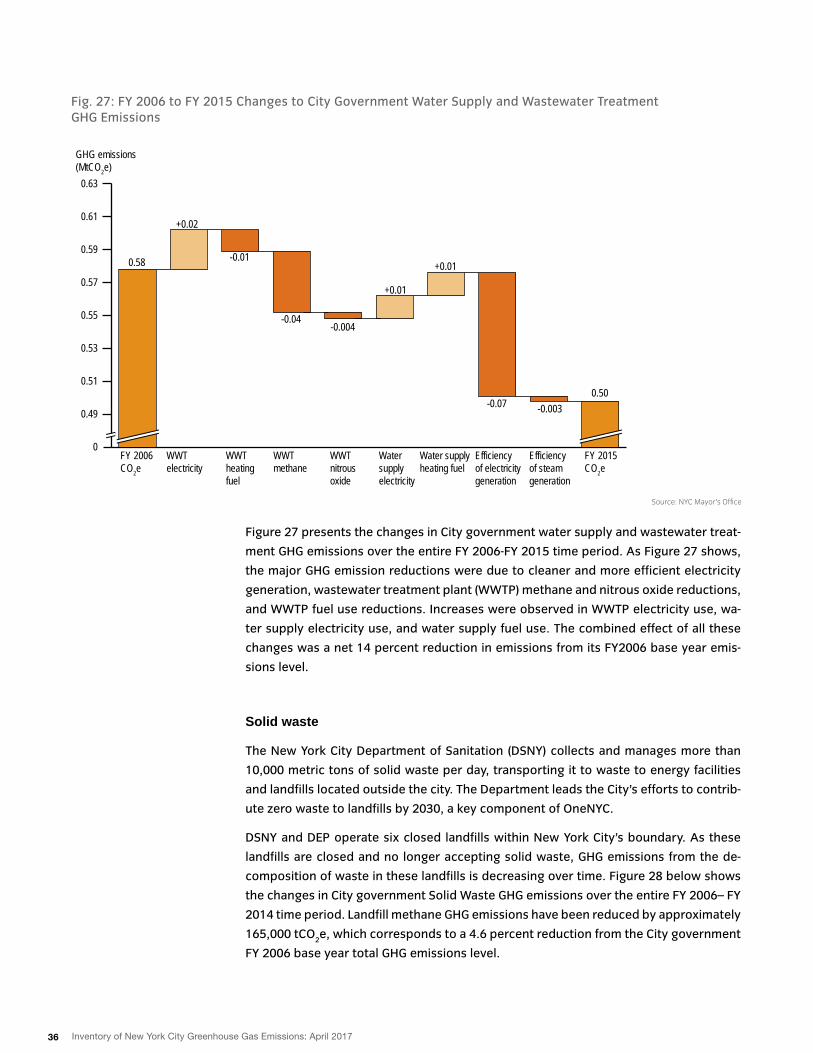
Figure 27 presents the changes in City government water supply and wastewater treat-
ment GHG emissions over the entire FY 2006-FY 2015 time period. As Figure 27 shows,
the major GHG emission reductions were due to cleaner and more efficient electricity
generation, wastewater treatment plant (WWTP) methane and nitrous oxide reductions,
and WWTP fuel use reductions. Increases were observed in WWTP electricity use, wa-
ter supply electricity use, and water supply fuel use. The combined effect of all these
changes was a net 14 percent reduction in emissions from its FY2006 base year emis-
sions level.
Solid waste
The New York City Department of Sanitation (DSNY) collects and manages more than
10,000 metric tons of solid waste per day, transporting it to waste to energy facilities
and landfills located outside the city. The Department leads the City’s efforts to contrib-
ute zero waste to landfills by 2030, a key component of OneNYC.
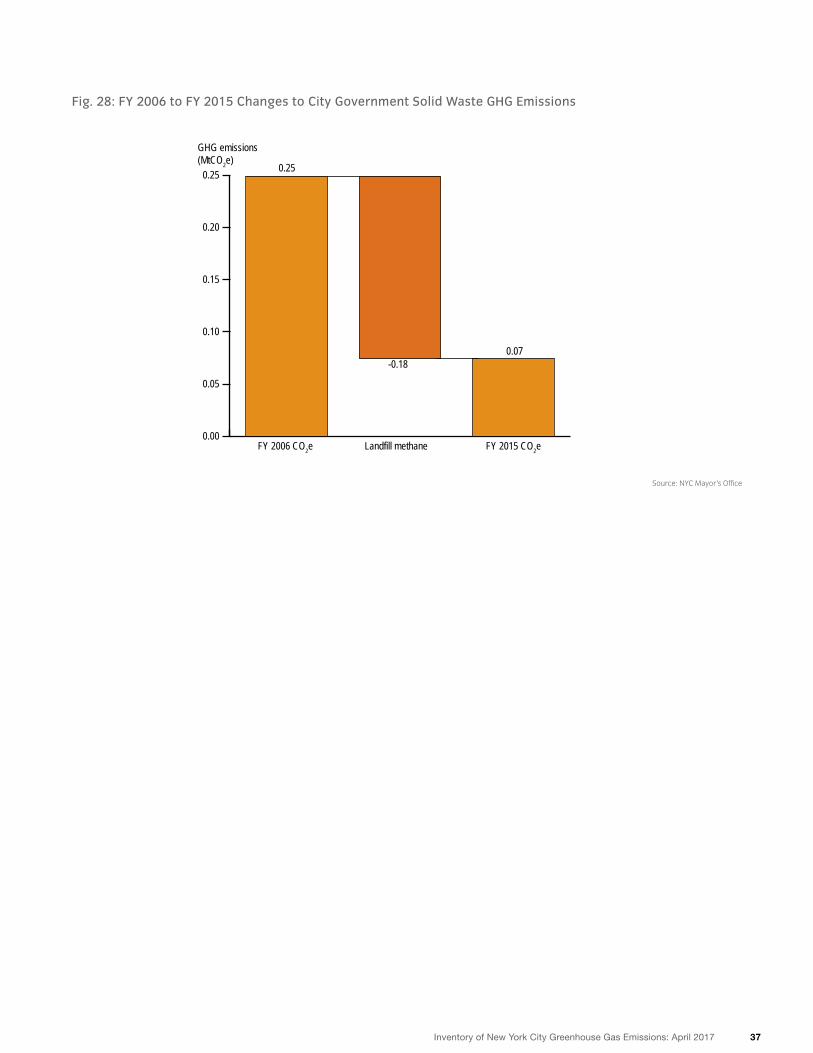
DSNY and DEP operate six closed landfills within New York City’s boundary. As these
landfills are closed and no longer accepting solid waste, GHG emissions from the de-
composition of waste in these landfills is decreasing over time. Figure 28 below shows
the changes in City government Solid Waste GHG emissions over the entire FY 2006– FY
2014 time period. Landfill methane GHG emissions have been reduced by approximately
165,000 tCO2e, which corresponds to a 4.6 percent reduction from the City government
FY 2006 base year total GHG emissions level.
Fig. 27: FY 2006 to FY 2015 Changes to City Government Water Supply and Wastewater Treatment GHG Emissions
Source: NYC Mayor’s Office
0
0.49
0.51
0.53
0.55
0.57
0.59
0.61
0.63
FY 2015 CO2e
Efficiencyof steam generation
Efficiency of electricity generation
Water supply heating fuel
Water supply electricity
WWTnitrous oxide
WWTmethane
WWT heating fuel
WWTelectricity
FY 2006 CO2e
Dataset: 2015 Comm & Muni WALKS v1 MB.xlsx
AND
Water Supply and Waste-water Treatment Walk - FY 2006- FY 2015
0.58
+0.02
-0.01
-0.04-0.004
+0.01
+0.01
-0.07 -0.0030.50
GHG emissions(MtCO2e)
37Inventory of New York City Greenhouse Gas Emissions: April 2017
Fig. 28: FY 2006 to FY 2015 Changes to City Government Solid Waste GHG Emissions
Source: NYC Mayor’s Office
Waterfall
0.00
0.05
0.10
0.15
0.20
0.25
FY 2015 total
Land�ll methane
FY 2006 CO2eFY 2015 CO2eLandfill methaneFY 2006 CO2e
Dataset: 2015 Comm & Muni WALKS v1 MB.xlsx
AND
Solid Waste Walk - FY 2006- FY 2015
0.25
-0.180.07
GHG emissions(MtCO2e)
38 Inventory of New York City Greenhouse Gas Emissions: April 2017
Methodology and Restatements of Previous Years’ GHG Emissions
Emission Coefficients and Methodologies
Acyronym Denfinitions
Weather Impacts on GHG Emissions
Steam Emission Coefficients
Electricity Emission Coefficients
Fuel Emissions Coefficients
Citywide GHG Emissions Summary - GPC Basic
City Government GHG Emissions Summary
Heating and Cooling Degree Days
Endnotes
A
B
C
D
E
F
G
H
I
J
K
APPENDICES
39
45
46
47
48
49
50
51
52
53
54
39Inventory of New York City Greenhouse Gas Emissions: April 2017
The Global Protocol for Community-Scale Greenhouse Gas
Emission Inventories (GPC) provides a robust and clear
framework that builds on existing methodologies for cal-
culating and reporting citywide GHG emissions. The GPC
sets out requirements and provides guidance for calculat-
ing and reporting citywide GHG emissions, consistent with
the 2006 Intergovernmental Panel on Climate Change
(IPCC) Guidelines for National Greenhouse Gas Inventories
(i.e., the “IPCC Guidelines”).
The GPC requires cities to report their GHG emissions
using two distinct but complementary approaches:
• The scopes framework, which allows cities to compre-
hensively report all GHG emissions attributable to
activities taking place within the geographic bound-
ary of the city, by categorizing the emission sources
into in-boundary sources (scope 1, or “territorial”),
grid-supplied energy sources (scope 2), and out-of-
boundary sources (scope 3).
• The city-induced framework measures GHG emissions
attributable to activities taking place within the geo-
graphic boundary of the city. This covers selected
scope 1, 2, and 3 emission sources. It provides two
reporting levels demonstrating different levels of
completeness. The BASIC level covers emission
sources that occur in almost all cities (stationary
energy, in-boundary transportation, and in-boundary
generated waste), and the calculation methodologies
and data are more readily available.
• New York City is utilizing the city-induced framework
as the basis for its reporting, and is reporting to the
GPC BASIC level.
Citywide Inventory MethodologyStationary energy
Con Edison (Con Ed) provided data on use of citywide elec-
tricity and steam, and natural gas in the Bronx, Manhattan,
and parts of Queens. National Grid reported natural gas
use data for Brooklyn, parts of Queens, and Staten Island.
The Long Island Power Authority (LIPA) reported electricity
use data for the Rockaways area of Queens. More details
on the methodology for estimating electricity and steam
coefficients are contained in Appendix B. Heating fuel oil
use was provided by private heating fuel oil suppliers, per
Local Law 43 of 2010, which requires heating fuel oil pro-
viders to report fuel oil deliveries by fuel type to the City
on an annual basis.
Transportation
On-road transportation vehicle miles traveled (VMT) data
was generated using the New York Best Practices Model
(NYBPM). Energy use data for public transit were provided
by the Metropolitan Transportation Authority (MTA) for
New York City Transit (NYCT) subways and buses, Staten
Island Railway (SIR), MTA Metro-North Railroad (MNR),
Long Island Rail Road (LIRR) commuter rail, and MTA Bus
Company buses; by the Port Authority of New York and
New Jersey (PANYNJ) for Trans-Hudson (PATH) commuter
rail; and New Jersey Transit (NJT) for its commuter rail and
buses. In-bound-ary aviation GHG emissions were calcu-
lated from total jet fuel used by City government operated
helicopters (NYPD, DOHMH, DEP). In-boundary marine
navigation GHG emissions were calculated based on total
fuel sales for City government operated marine vessels
(DOT, NYPD, FDNY, DEP).
Waste
Data used to calculate fugitive and process methane and
process nitrous oxide from wastewater treatment were
provided by DEP. Methane emissions were calculated
based on the destruction of volatile material in anaerobic
digesters. Based on the measured concentration and flow
of volatile organic solids, it is estimated that 15 cubic feet
of digester gas is produced for every pound of volatile
organic solids destroyed. Nitrous oxide emissions were
calculated by applying the daily nitrogen load discharged
Appendix A Methodology and Restatements of Previous Years GHG Emissions
40 Inventory of New York City Greenhouse Gas Emissions: April 2017
by each of the City’s 14 wastewater treatment plant to the
formula in the LGOP. Per the GPC, biogenic carbon dioxide
was also calculated from combustion of anaerobic
digester gas (ADG) and from fugitive ADG.
Fugitive methane from exported solid waste sent to land-
fills was calculated using waste disposal figures for resi-
dential, commercial, and construction and demolition
waste provided by DSNY, and applying emission factors
from the GPC. Carbon dioxide, methane, and nitrous oxide
from solid waste sent to waste-to-energy facilities was cal-
culated using methodology in the GPC. Methane and
nitrous oxide from composting was calculated using the
GPC. Fugitive methane from natural gas distribution was
calculated using data provided by National Grid and Con
Ed.
GHG emissions were calculated from all data acquired as
described using emission factors in Appendix H, I, and J,
unless otherwise noted.5
City Government Inventory MethodologyAll data used to complete the FY 2015 City government
GHG inventory were acquired from City agencies or fuel
vendors. Electricity, natural gas, and steam usage for the
City’s buildings, facilities, and streetlights was provided by
the Department of Citywide Administrative Services
(DCAS). Fuel vendors and DEP supplied heating and vehi-
cle fuel usage. Calculation of GHG emissions from fuel is
based upon the volume of fuel delivered as an estimate of
the volume of fuel used.
Fugitive and process GHG emissions were calculated using
data provided by several agencies: DEP for methane and
nitrous oxide emissions from wastewater treatment; DEP
and DSNY for fugitive methane emissions from landfills;
and DCAS for hydrofluorocarbons (HFC) from municipal
vehicle fleet cooling and refrigeration systems. All calcula-
tions were made as described in the citywide inventory
methodology section.
2015 GHG Methodology Refinements and UpdatesAs part of New York City’s GHG emissions inventory pro-
gram’s core principle of continuous improvement, there
were several areas of the 2015 GHG emissions inventory
development in which significant improvements were
made to the GHG emissions calculation methodology.
These included the following:
• Electricity emission factors development
• Heating fuel oil supplier missing data substitution
estimates
• Vehicle miles traveled (VMT) and associated mobile
source GHG emissions
• Solid waste-associated GHG emissions
Each of these 2015 GHG inventory methodology improve-
ments is described in more detail in the sections below.
Electricity emission factors
As part of the 2015 GHG inventory development, New York
City applied some advanced modeling techniques, which
had been developed recently as part of the City’s develop-
ment of the New York City’s Roadmap to 80 x 50 (Road-map to 80 x 50) GHG mitigation plan, to the citywide GHG
emissions inventory. This model, Xpand,5 was used in the
development of the Roadmap to 80 x 50 to generate vari-
ous scenarios for electricity plant generation in the State
to meet future electricity demand in New York City. Xpand
is an economic dispatch/generation capacity expansion
model which identifies the least-cost combination of unit
dispatch, expansions, and retirements, and considers
both environmental and policy requirements through
linear optimization.
A key feature of the model is that the power transmission/
distribution is based on a zonal distribution modeling of
transmission constraints. It models transmission con-
straints between various regions, integrating flow con-
straints based on previous studies which modeled inter-
region transfer capabilities, based on the New York Inde-
pendent System Operator (NYISO) 2014 Reliability Needs
Assessment. All of the assumptions input to the Xpand
model, which were applied retroactively to the New York
City 2005-2014 GHG inventories’ electricity data as part of
this year’s 2015 GHG inventory development, were con-
firmed by a technical advisory group as part of the 80 x 50
process.
41Inventory of New York City Greenhouse Gas Emissions: April 2017
This updated modeling considered maximum zone gener-
ation and transmission constraints. The primary result of
this is that the model better represents where electricity is
coming from, and the associated generation characteris-
tics of that electricity, to meet New York City demand.
The primary differences between the Xpand model’s
approach to the 2005-2015 electricity generation and GHG
emissions coefficient methodology, and the methodology
approach used in the 2014 and previous years’ GHG inven-
tory developments, are as follows:
• The City’s previous (2005-2014) methodology assigned
all Zone J (New York City) generation to Zone J GHG
emissions, ignoring that portion of the relatively high
emission factor Zone J generation which may be
exported out of the City; those electricity exports out
of New York City were much higher in 2014-2015 than
in 2005.
• Several major Con Ed power purchase agreements
(PPAs) expired in 2014 (from three large combined
cycle plants in NYISO Zones C and F: upstate/western
New York), which were accounted for this year.
• In addition to the three combined cycle PPAs, Xpand
also models all of the other power supply contracts
for importing power into New York City: four hydro
plants, one wind plant, and one nuclear unit (Indian
Point 2).
• This more rigorous modeling approach, including
transmission constraints and Zone J exports, resulted
in a greater percentage of power imports to New York
City from the lower GHG emission coefficient upstate
generation facilities (NYISO Zones A-F).
• The previous methodology’s generation allocation
had NYISO Zones A-F providing the very last “balance”
of the city’s power demand needs (if any, at that point
in the prior approach’s assumed allocation scheme):
after NYISO Zone J, PPA’s, NYISO Zones G-I (Westches-
ter, Rockland, Orange, etc. suburban New York City
counties), and New Jersey/PSE&G imports; resulting in
no market procurement from NYISO Zones A-F esti-
mated previously in 2014.
Heating fuel oil supplier missing data substitution estimates
Characterizing heating fuel oil use citywide in the New
York City GHG emissions inventory has evolved over the
last ten years. Initially, heating fuel oil usage citywide was
estimated based on building square footage data, permit
data for heating boiler ratings, and energy usage intensity
factors for heating fuel oil in buildings. Starting with the
2012 GHG inventory, based on Local Law 43 of 2010 (LL43),
citywide heating fuel oil data were collected directly from
the heating fuel oil suppliers. Data were collected at that
time for previous years, and preliminary estimates were
then made for missing data gaps in the historical record.
More recently, one of the major heating fuel oil suppliers
to New York City sold all of their New York City retail assets
in December 2013 to a new supplier to the local market.
These substantial retail assets were then re-sold, by the
first buyer, to an existing New York City retail heating fuel
oil supplier in May 2014. As part of the 2014 GHG emis-
sions inventory development, a very limited analysis of
that original major supplier’s historical market share trend
was used to make a forward projection, and estimate the
missing 2013 and 2014 heating fuel oil delivery data asso-
ciated with the sales of their retail assets.
With a full year’s worth of 2015 actual data successfully
collected from the second purchaser of those retail assets
for the 2015 GHG inventory, in this year’s GHG inventory
development New York City developed a more thorough,
comprehensive approach to address the challenges of
developing estimates, as a substitution for missing heat-
ing fuel oil supplier data. Based on all available data col-
lected from suppliers’ LL43 forms, for all suppliers with
large volumes of retail sales and missing data in any of the
years between 2007 and 2015, estimates were made for
the missing year(s).
• 2013: Because the heating degree days (HDDs) for
2013 and 2015 were approximately the same, a linear
interpolation was made for 2013 missing data; this
was based on the 2012 data from the missing supplier
(the last full year’s worth of data obtained from that
supplier before their December 2013 sale of all their
retail assets), and the 2015 data from the final buyer
(in May 2014) of those retail assets.
42 Inventory of New York City Greenhouse Gas Emissions: April 2017
• 2014: Calculate the average of the sum of the 2013
missing supplier estimate from above, the final buy-
er’s 2013 actual data, and the final buyer’s 2015 actual
data. This average value is then multiplied by 1.05, as
2014 had approximately 5 percent more HDDs than
2013 or 2015.
• Identify a set of “core suppliers”, defined as those
suppliers with a complete set of data between the
years 2007 and 2015. These suppliers represent a
large majority of the heating fuel oil sales in New York
City.
• For all suppliers, convert gallon values into MMBtu.
• For each supplier/year combination, calculate the
share of each supplier’s sales (in MMBtu) as a percent-
age of the total sales of the core suppliers (in MMBtu)
for each year.
• Focusing on the percent of sales for a supplier relative
to the total core vendors’ sales, fill any missing data
gaps by interpolation techniques. For example, if Sup-
plier A had 1.2 percent of the core suppliers’ total
sales in 2012, and 1.4 percent of total core suppliers’
sales in 2014, estimate missing 2013 sales as 1.3 per-
cent of total core suppliers’ sales in 2013.
• For each year, use the total sales of the core suppliers
(MMBtu) and each supplier’s percent values of the
total core suppliers’ sales and calculate the sales of
each individual vendor (MMBtu). With this approach,
any change in sales due to changes in weather (HDD)
is reflected in the sales of the core suppliers, and
automatically reflected in the estimated sales of non-
core suppliers.
• For each supplier, use the historical fuel distribution
(i.e., percent sales of each heating fuel oil type) to cal-
culate MMBtu by fuel type.
• For each supplier, use the calculated MMBtu sales by
heating fuel oil type to convert into gallons.
• Sum up all gallons across all suppliers by heating fuel
oil type to calculate the overall heating fuel oil activity
data.
Vehicle miles traveled (VMT) and associated mobile source GHG emissions
On-road VMT data are generated by the New York Metro-
politan Transportation Council’s (NYMTC) New York Best
Practice Model (NYBPM), to create some of the necessary
data inputs to calculate mobile source GHG emissions, as
part of the citywide GHG emissions inventory. Transporta-
tion modelers for the City’s 80 x 50 plan development uti-
lized the NYBPM model outputs as one set of input data to
model mobile source GHG emissions, an approach applied
to the City’s GHG emissions inventory development to
ensure consistency of results. The U.S. EPA’s Motor Vehi-
cle Emissions Simulator (MOVES) model, a state-of-the-sci-
ence model for estimating emissions from mobile sources
under a wide set of user-defined conditions, is the model
used to estimate on-road energy consumption and GHG
emissions for the New York City citywide GHG inventory.
MOVES can estimate GHG emissions and energy consump-
tion at a wide variety of geographic scales including, as in
the case of the New York City citywide inventory, individ-
ual county, multi-county, and/or metropolitan regions. It
can create an annual GHG emissions inventory for any cal-
endar year from 1999 through 2050. The latest version of
the MOVES model (MOVES2014a) accounts for all national
fuel economy and GHG standards for cars and trucks as of
October 2015. A post processor, PPSUITE, is also used for
the GHG inventory, to analyze highway operating condi-
tions, calculate highway speeds, compile VMT and vehicle
type mix data, and prepare MOVES runs and process out-
puts.
In part due to the complexity associated with collecting
various mobile sources’ input data, and the continuous
improvements in the City’s GHG inventory modeling, sev-
eral mobile source GHG methodology refinements were
made as part of the 2015 inventory. Some of these include
the following:
• Following GPC guidance, 50 percent of transboundary
trips in the induced activity method (trips “induced”
by the City, i.e., trips begin, end, or fully contained in
the City), counted as in-boundary trips as Scope 1
GHG emissions and 50 percent were counted as out-
of-boundary trips as Scope 3 GHG emissions (not
43Inventory of New York City Greenhouse Gas Emissions: April 2017
reported per the GPC BASIC reporting framework), for
all vehicles.
• Total Scope 1 VMT collected all trans-boundary Scope
1 VMT for all vehicle categories in the 2015 GHG inven-
tory.
• New PPSuite adjustment factors were developed to
apply to the BPM VMT data to produce a corrected
VMT, by applying that adjustment factor to seasonal
VMT data.
• Data in the 2015 GHG inventory provided VMT data at
the county level, broken out by functional road class.
• Updated, individual annual fuel economy data for
2010-2015 were included for many vehicle types
(instead of a single fixed value over that entire time
period).
• Additional MOVES modeling runs were made by the
New York City 80 x 50 plan modelers in support of the
2015 GHG inventory, beyond the limited set available
during the 2014 GHG inventory development, includ-
ing:
• VMT splits as a percentage of total VMT, by fuel
type and by sector/vehicle type.
• 2010 on-road VMT annual data from the BPM
model, as used in the 2014 GHG inventory, were
adjusted by the applicable PPSuite factor.
• More rigorous mapping and apportionment of
BPM to MOVES categories, which are designated
differently from each other.
• Collectively, all of these additional modeling runs have
improved the precision and accuracy of the 2015 GHG
inventory’s mobile source GHG emissions calcula-
tions, as compared to that of 2014.
Solid waste-associated GHG emissions
GHG emissions from the management of solid waste were
calculated using methodologies outlined in the GPC,
applying updated waste generation and characterization
data. Previous GHG inventories (2005-2014) used waste
generation data provided by DSNY, and applied waste
characterization data from DSNY’s 2005 Waste Character-
ization Study (for Residential and Construction and Demo-
lition Waste)6 and 2004 Commercial Waste Study.7 These
data were then applied to methane generation factors
from the EPA’s Waste Reduction Model (WARM), per the
guidance in ICLEI’s U.S. Community Protocol.
As part of the development of the Roadmap to 80 x 50,
waste generation estimates were revised for commercial
waste, as previous estimates were determined to be too
low. The Roadmap to 80 x 50 waste consultant developed
revised commercial waste generation values by incorpo-
rating industry studies, such as CalRecycle’s 2014 Genera-
tor-Based Characterization of Commercial Sector Disposal
and Diversion in California, with New York’s 2004 commer-
cial waste study to generate a per-employee waste gener-
ation factor. These factors were applied to employment
data using North American Industry Classification System
(NAICS) codes to estimate total commercial waste genera-
tion.
Because the Roadmap to 80 x 50 waste generation esti-
mates were developed for 2015, previous years’ total waste masses used for GHG emissions calculations were revised. Revisions include scaling these masses by a factor
based on the difference between the forecasted 2015
mass, historically used generation data, and the revised
2015 mass, which incorporated revised commercial waste
mass. The methodology for calculating waste generation
for residential waste and construction and demolition
(C&D) waste did not change for the 2015 inventory.
Aligned with the Roadmap to 80 x 50 analysis, waste char-
acterization was determined using the EPA’s WARM
model. The resulting mass of each specific waste material
in WARM aggregated up to the GPC’s waste categories:
food, garden waste/plant debris, paper, wood, textiles,
industrial waste, and other (inorganic). As in the City’s pre-
vious GHG inventories, a Waste Commitment method was
used, with all methane emissions from future decomposi-
tion of landfilled solid waste counted in the year of dis-
posal.
Previous New York City GHG inventories have counted
GHG emissions from closed landfills within New York, in
addition to projected GHG emissions from waste gener-
ated in the year of analysis. Further consideration of this
44Inventory of New York City Greenhouse Gas Emissions: April 2017
decision led to the exclusion of GHG emissions from in-city
landfills in the community inventory, as including these
sources would effectively be counting both GHG emissions
from waste generated before the 2005 base year and pro-
jected GHG emissions from currently-generated waste.
Fresh Kills Landfill, the last New York City landfill to accept
solid waste, stopped accepting solid waste in 2001.
GHG emissions from composting were also calculated
using the GPC’s formula. All GHG emissions from incinera-
tion in waste-to-energy facilities were assumed to be
incorporated in the electricity emission factor, and were
not reported separately to avoid double-counting this
source.
Restatements of previous years’ GHG emissions results
Each year, New York City reviews past years’ GHG inven-
tory results and makes adjustments where needed based
on a number of factors. This year, several revisions were
made that affected past citywide and City government
reported GHG emissions. Revised activity data (fuel oil use
and solid waste generation); revised mobile source energy
use and GHG emissions modeling; revised solid waste GHG
emissions modeling (per GPC guidance); and updated
electricity and steam emission factors all played a role in
these revisions.
45 Inventory of New York City Greenhouse Gas Emissions: April 2017
Electricity emission factor
The City has developed its own electricity emission fac-
tors, rather than using the U.S. Environmental Protection
Agency’s (EPA) eGRID emission factor. The City does this
for several reasons:
• The eGRID factor is regionally based on all Westches-
ter County and New York City electricity generation.
• The eGRID factor does not include electricity that is
imported into New York City from New Jersey or New
York beyond Westchester County, which is a signifi-
cant amount of the electricity supply.
• The eGRID factor is based on data that is several years
old—the most recent eGRID factor is based on 2012
generation data—which does not allow the City to
measure the impact of changes to the power supply
that occurred during the year of analysis.
The City used power plant data from EPA’s Continuous
Emissions Monitoring System (CEMS) database and the
U.S. Energy Information Administration’s (EIA) EIA-923
database (previously titled EIA-906) to calculate the CO2e
emissions coefficient from electricity. Data from these
sources were acquired from ABB Enterprise Software and
were organized to develop specific emission factors for
each plant in the New York Independent System Opera-
tor’s (NYISO) and PJM Public Service Electric and Gas
(PSEG) territories. From these data, New York City’s elec-
tricity emission factors were calculated by taking the fol-
lowing steps:
1. All electricity generated within New York City (NYISO
Zone J), all electricity imported to New York City through
bilateral contracts between power generators and the
New York Power Authority (NYPA) and Consolidated
Edison of New York (Con Ed), and measured electricity
flows from New Jersey’s PSEG territory over the Linden-
VFT transmission line (PJM) were added to determine the
known quantity of use from these sources.
Appendix B Emission Factors Methodologies
2. Additional imported electricity volumes were modeled
based on zonal distribution transmission constraints on
imports into Zone J; power exports out of Zone J; updated
status and modeling of New York City PPAs; and least cost
modeling based prioritization of market procurements
from other zones for additional imported power to New
York City.
3. Emission factors for both in-city and imported genera-
tion were calculated for carbon dioxide, methane, nitrous
oxide, and CO2e based on each plant’s heat rate (effi-
ciency) and primary fuel used for generation.
4. Energy use attributed to steam generation at in-city
cogeneration plants was deducted from the energy input
used to calculate each plant’s emission factor, using Con
Ed’s steam system data, to avoid double counting GHG
emissions resulting from this generation.
The City encourages all entities in New York City, public
and private, to use this emission factor to complete GHG
inventories. Revised electricity emission factors were
applied to past years’ inventory results.
Steam emission factor
The City developed its own steam emission factors in
cooperation with ConEd, as in past inventories. The
revised steam factors were applied to community and City
government 2015 inventories. The steam emission factor
is presented in detail in Appendix H.
The steam emission factor used by New York City takes
into account the impact of generating steam by means of
co-generation. This factor is intended to be used for
macro, city-scale analyses, as the accounting methodol-
ogy used by ConEd (as recommended by the EPA and
approved by the New York State Public Service Commis-
sion [PSC]) allocates the majority of fuel used for cogene-
rated steam to electricity generation, which is accounted
for in the City’s electricity coefficient. As such, applying
this steam coefficient to more granular, project-specific
analyses may not yield appropriate results.
46Inventory of New York City Greenhouse Gas Emissions: April 2017
NYC agencies
DCAS – New York City Department of Citywide Administra-
tive Services
DEP – New York City Department of Environmental
Protection
DOHMH – New York City Department of Health and Mental
Hygiene
DOT – New York City Department of Transporation
DSNY – New York City Department of Sanitation
Other entities
C40 – C40 Cities Climate Leadership Group
Con Ed – Consolidated Edison of New York
EIA – United States Energy Information Administration
EPA – United States Environmental Protection Agency
ICLEI – ICLEI-Local Governments for Sustainability
LIPA – Long Island Power Authority
LIRR – Long Island Railroad
MTA – Metropolitan Transportation Authority
MNR – Metro North Rail Road
NJT – New Jersey Transit
NYCT – New York City Transit
NYISO – New York Independent System Operator
NYMTC – New York Metropolitan Transportation Council
NYPA – New York Power Authority
PANYNJ – Port Authority of New York and New Jersey
PATH – Port Authority Trans-Hudson Corporation
PSC – New York State Public Service Commission
PSEG – Public Service Enterprise Group
Acronyms used throughout report
Btu – British thermal units
CDD – cooling degree days
CEMS – Continuous Emissions Monitoring System
CH4 – methane
CO2 – carbon dioxide
CO2e – carbon dioxide equivalent
CY – calendar year
eGRID – Emissions and Generation Resource Integrated Database
FY – fiscal year
GHG – greenhouse gas
GWh – gigawatt hour
GPC – Global Protocol for Community-Scale Greenhouse Gas Emis-
sion Inventories
HDD – heating degree days
HFCs – hydrofluorocarbons
kg – kilogram
km – kilometer
LGOP – Local Government Operations Protocol
MMBtu – million British thermal units
MW – megawatt
MtCO2e – million metric tons of carbon dioxide equivalent
N2O – nitrous oxide
PPA – power purchase agreement
ROS – rest of state
SF6 – sulfur hexafluoride
SWMP – Solid Waste Management Plan
tCO2e – metric ton of carbon dioxide equivalent
USCP – United States Community Protocol for Accounting and Re-
porting of Greenhouse Gas Emissions
VFT – variable frequency transformer
VMT – vehicle miles traveled
WARM – Waste Reduction Model
Appendix C Acronym Definitions
47 Inventory of New York City Greenhouse Gas Emissions: April 2017
Appendix DWeather Impacts on EmissionsTo fully understand the impact of year-on-year changes
in GHG emissions, the extent of weather’s impact on
energy use must be accounted for and is a key component
in determining causes for inter-annual changes in the
GHG carbon footprint. Steam (used for both heating and
cooling), electricity (used for cooling via air-conditioners),
natural gas (used for heating), and building oil (used for
heating) use figures correlate with monthly heating degree
days (HDD) and cooling degree days (CDD).
The resulting correlation graphs show the strength of
the relationship between each type of energy use and its
corresponding weather statistics.
The exclusion of weather from year-by-year changes is
based on these estimates; it is presented as an estimate
rather than a detailed analysis. Further refinement of these
methods will be necessary to make precise claims for
exactly how weather affected greenhouse gas emissions.
Weather fluctuations are measured in degree days, in which
one day at 66° would be one cooling degree day, and one
day at 75° would be ten cooling degree days. Conversely,
one day at 55° would be ten heating degree days.
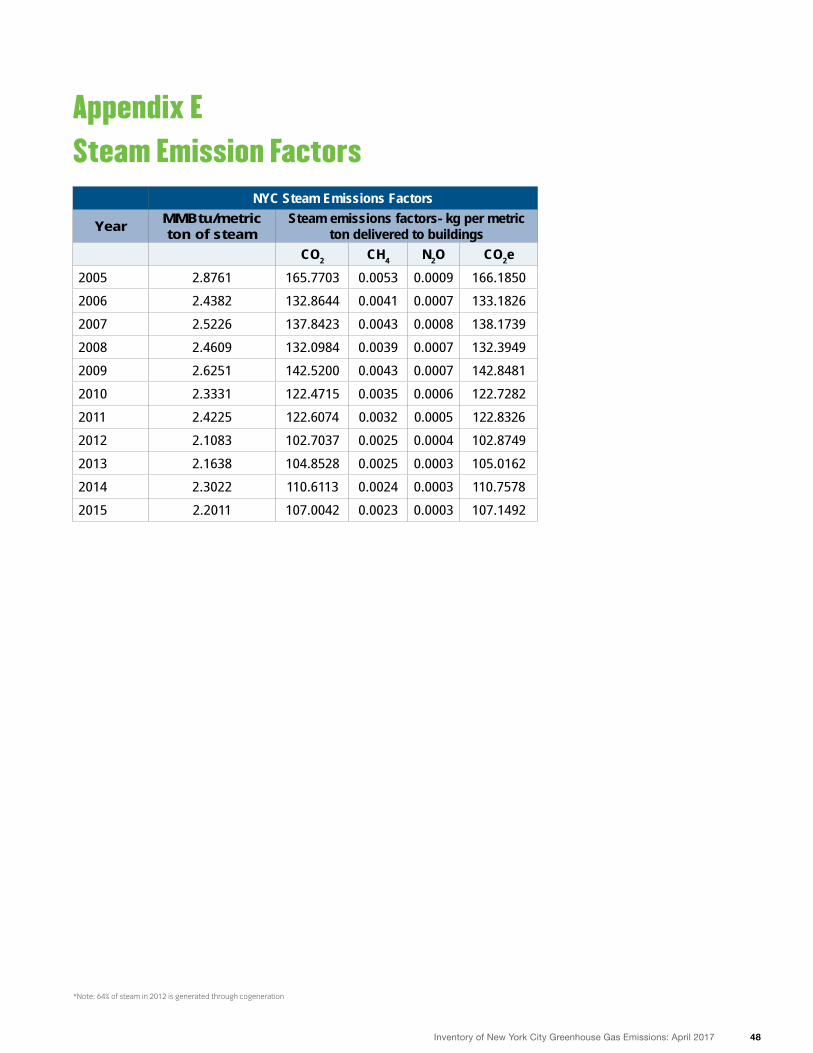
48Inventory of New York City Greenhouse Gas Emissions: April 2017
NYC Steam Emissions Factors
Year MMBtu/metric ton of steam
Steam emissions factors- kg per metric ton delivered to buildings
CO2 CH4 N2O CO2e2005 2.8761 165.7703 0.0053 0.0009 166.1850
2006 2.4382 132.8644 0.0041 0.0007 133.1826
2007 2.5226 137.8423 0.0043 0.0008 138.1739
2008 2.4609 132.0984 0.0039 0.0007 132.3949
2009 2.6251 142.5200 0.0043 0.0007 142.8481
2010 2.3331 122.4715 0.0035 0.0006 122.7282
2011 2.4225 122.6074 0.0032 0.0005 122.8326
2012 2.1083 102.7037 0.0025 0.0004 102.8749
2013 2.1638 104.8528 0.0025 0.0003 105.0162
2014 2.3022 110.6113 0.0024 0.0003 110.7578
2015 2.2011 107.0042 0.0023 0.0003 107.1492
Appendix E Steam Emission Factors
*Note: 64% of steam in 2012 is generated through cogeneration
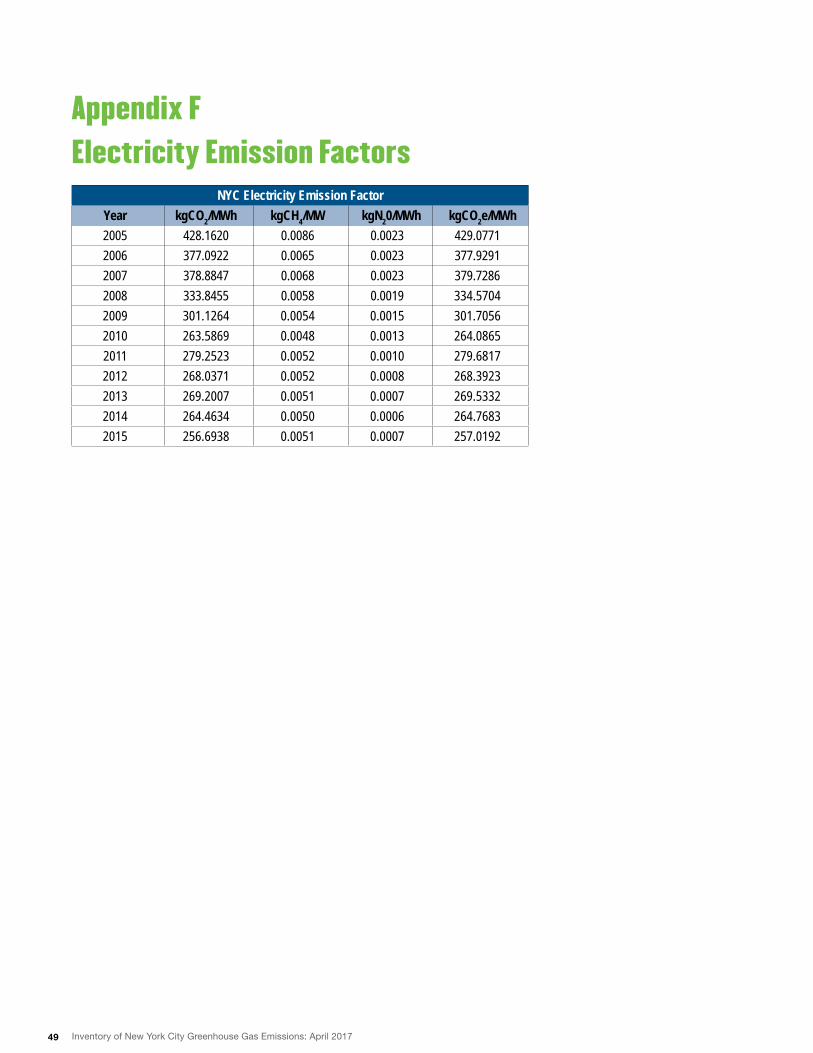
49 Inventory of New York City Greenhouse Gas Emissions: April 2017
NYC Electricity Emission FactorYear kgCO2/MWh kgCH4/MW kgN20/MWh kgCO2e/MWh2005 428.1620 0.0086 0.0023 429.07712006 377.0922 0.0065 0.0023 377.92912007 378.8847 0.0068 0.0023 379.72862008 333.8455 0.0058 0.0019 334.57042009 301.1264 0.0054 0.0015 301.70562010 263.5869 0.0048 0.0013 264.08652011 279.2523 0.0052 0.0010 279.68172012 268.0371 0.0052 0.0008 268.39232013 269.2007 0.0051 0.0007 269.53322014 264.4634 0.0050 0.0006 264.76832015 256.6938 0.0051 0.0007 257.0192
Appendix F Electricity Emission Factors
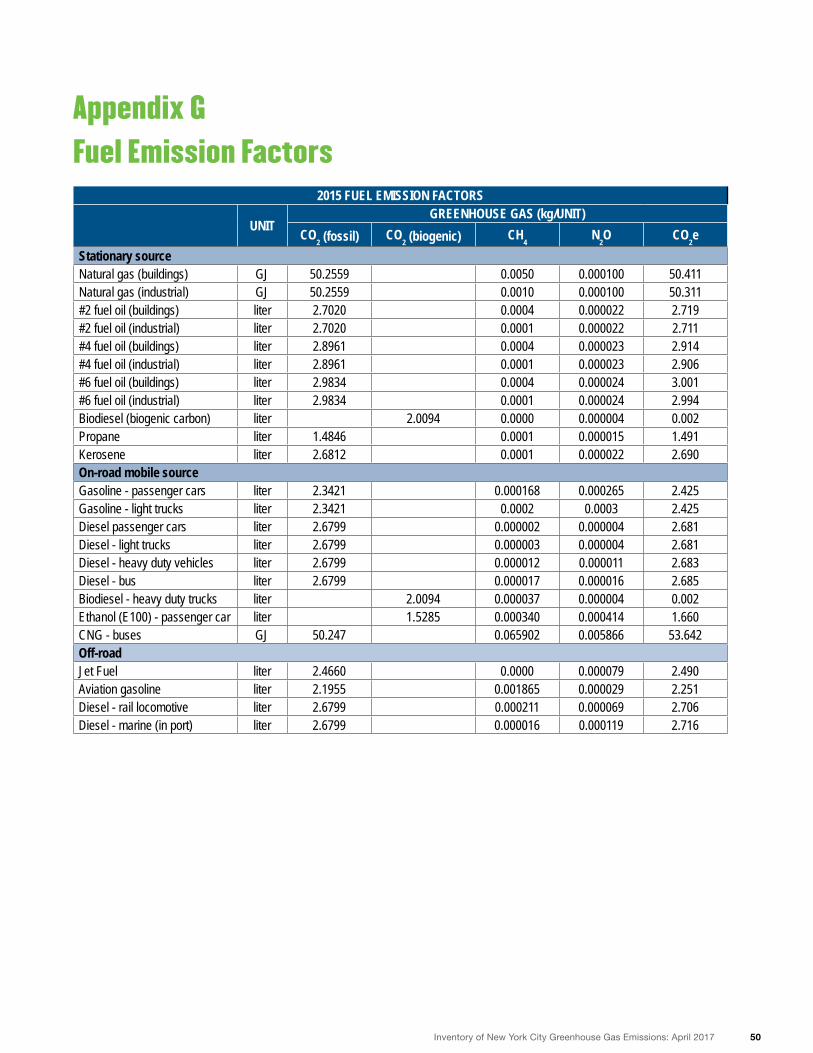
50Inventory of New York City Greenhouse Gas Emissions: April 2017
2015 FUEL EMISSION FACTORS
UNITGREENHOUSE GAS (kg/UNIT)
CO2 (fossil) CO
2 (biogenic) CH4
N2O CO
2e
Stationary sourceNatural gas (buildings) GJ 50.2559 0.0050 0.000100 50.411Natural gas (industrial) GJ 50.2559 0.0010 0.000100 50.311#2 fuel oil (buildings) liter 2.7020 0.0004 0.000022 2.719#2 fuel oil (industrial) liter 2.7020 0.0001 0.000022 2.711#4 fuel oil (buildings) liter 2.8961 0.0004 0.000023 2.914#4 fuel oil (industrial) liter 2.8961 0.0001 0.000023 2.906#6 fuel oil (buildings) liter 2.9834 0.0004 0.000024 3.001#6 fuel oil (industrial) liter 2.9834 0.0001 0.000024 2.994Biodiesel (biogenic carbon) liter 2.0094 0.0000 0.000004 0.002Propane liter 1.4846 0.0001 0.000015 1.491Kerosene liter 2.6812 0.0001 0.000022 2.690On-road mobile sourceGasoline - passenger cars liter 2.3421 0.000168 0.000265 2.425Gasoline - light trucks liter 2.3421 0.0002 0.0003 2.425Diesel passenger cars liter 2.6799 0.000002 0.000004 2.681Diesel - light trucks liter 2.6799 0.000003 0.000004 2.681Diesel - heavy duty vehicles liter 2.6799 0.000012 0.000011 2.683Diesel - bus liter 2.6799 0.000017 0.000016 2.685Biodiesel - heavy duty trucks liter 2.0094 0.000037 0.000004 0.002Ethanol (E100) - passenger car liter 1.5285 0.000340 0.000414 1.660CNG - buses GJ 50.247 0.065902 0.005866 53.642Off-roadJet Fuel liter 2.4660 0.0000 0.000079 2.490Aviation gasoline liter 2.1955 0.001865 0.000029 2.251Diesel - rail locomotive liter 2.6799 0.000211 0.000069 2.706Diesel - marine (in port) liter 2.6799 0.000016 0.000119 2.716
Appendix G Fuel Emission Factors
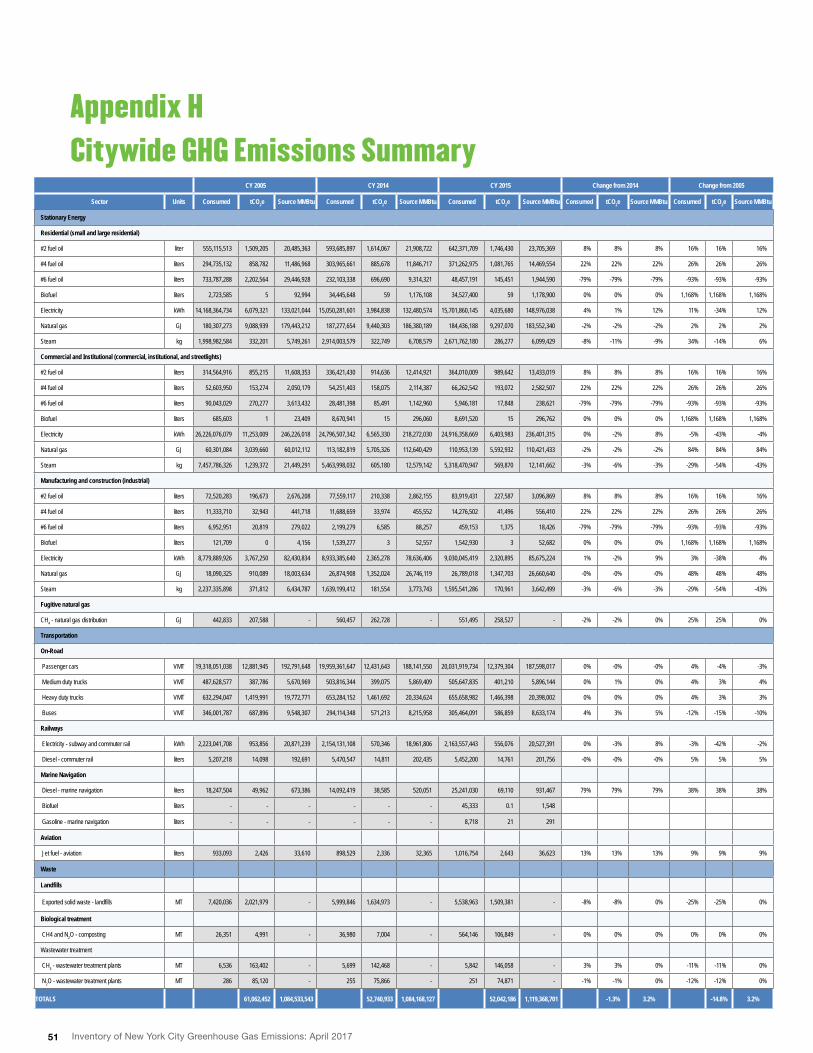
51 Inventory of New York City Greenhouse Gas Emissions: April 2017
Appendix H Citywide GHG Emissions Summary
CY 2005 CY 2014 CY 2015 Change from 2014 Change from 2005
Sector Units Consumed tCO2e Source MMBtu Consumed tCO2e Source MMBtu Consumed tCO2e Source MMBtu Consumed tCO2e Source MMBtu Consumed tCO2e Source MMBtu
Stationary Energy
Residential (small and large residential)
#2 fuel oil liter 555,115,513 1,509,205 20,485,363 593,685,897 1,614,067 21,908,722 642,371,709 1,746,430 23,705,369 8% 8% 8% 16% 16% 16%
#4 fuel oil liters 294,735,132 858,782 11,486,968 303,965,661 885,678 11,846,717 371,262,975 1,081,765 14,469,554 22% 22% 22% 26% 26% 26%
#6 fuel oil liters 733,787,288 2,202,564 29,446,928 232,103,338 696,690 9,314,321 48,457,191 145,451 1,944,590 -79% -79% -79% -93% -93% -93%
Biofuel liters 2,723,585 5 92,994 34,445,648 59 1,176,108 34,527,400 59 1,178,900 0% 0% 0% 1,168% 1,168% 1,168%
Electricity kWh 14,168,364,734 6,079,321 133,021,044 15,050,281,601 3,984,838 132,480,574 15,701,860,145 4,035,680 148,976,038 4% 1% 12% 11% -34% 12%
Natural gas GJ 180,307,273 9,088,939 179,443,212 187,277,654 9,440,303 186,380,189 184,436,188 9,297,070 183,552,340 -2% -2% -2% 2% 2% 2%
Steam kg 1,998,982,584 332,201 5,749,261 2,914,003,579 322,749 6,708,579 2,671,762,180 286,277 6,099,429 -8% -11% -9% 34% -14% 6%
Commercial and Institutional (commercial, institutional, and streetlights)
#2 fuel oil liters 314,564,916 855,215 11,608,353 336,421,430 914,636 12,414,921 364,010,009 989,642 13,433,019 8% 8% 8% 16% 16% 16%
#4 fuel oil liters 52,603,950 153,274 2,050,179 54,251,403 158,075 2,114,387 66,262,542 193,072 2,582,507 22% 22% 22% 26% 26% 26%
#6 fuel oil liters 90,043,029 270,277 3,613,432 28,481,398 85,491 1,142,960 5,946,181 17,848 238,621 -79% -79% -79% -93% -93% -93%
Biofuel liters 685,603 1 23,409 8,670,941 15 296,060 8,691,520 15 296,762 0% 0% 0% 1,168% 1,168% 1,168%
Electricity kWh 26,226,076,079 11,253,009 246,226,018 24,796,507,342 6,565,330 218,272,030 24,916,358,669 6,403,983 236,401,315 0% -2% 8% -5% -43% -4%
Natural gas GJ 60,301,084 3,039,660 60,012,112 113,182,819 5,705,326 112,640,429 110,953,139 5,592,932 110,421,433 -2% -2% -2% 84% 84% 84%
Steam kg 7,457,786,326 1,239,372 21,449,291 5,463,998,032 605,180 12,579,142 5,318,470,947 569,870 12,141,662 -3% -6% -3% -29% -54% -43%
Manufacturing and construction (industrial)
#2 fuel oil liters 72,520,283 196,673 2,676,208 77,559,117 210,338 2,862,155 83,919,431 227,587 3,096,869 8% 8% 8% 16% 16% 16%
#4 fuel oil liters 11,333,710 32,943 441,718 11,688,659 33,974 455,552 14,276,502 41,496 556,410 22% 22% 22% 26% 26% 26%
#6 fuel oil liters 6,952,951 20,819 279,022 2,199,279 6,585 88,257 459,153 1,375 18,426 -79% -79% -79% -93% -93% -93%
Biofuel liters 121,709 0 4,156 1,539,277 3 52,557 1,542,930 3 52,682 0% 0% 0% 1,168% 1,168% 1,168%
Electricity kWh 8,779,889,926 3,767,250 82,430,834 8,933,385,640 2,365,278 78,636,406 9,030,045,419 2,320,895 85,675,224 1% -2% 9% 3% -38% 4%
Natural gas GJ 18,090,325 910,089 18,003,634 26,874,908 1,352,024 26,746,119 26,789,018 1,347,703 26,660,640 -0% -0% -0% 48% 48% 48%
Steam kg 2,237,335,898 371,812 6,434,787 1,639,199,412 181,554 3,773,743 1,595,541,286 170,961 3,642,499 -3% -6% -3% -29% -54% -43%
Fugitive natural gas
CH4 - natural gas distribution GJ 442,833 207,588 - 560,457 262,728 - 551,495 258,527 - -2% -2% 0% 25% 25% 0%
Transportation
On-Road
Passenger cars VMT 19,318,051,038 12,881,945 192,791,648 19,959,361,647 12,431,643 188,141,550 20,031,919,734 12,379,304 187,598,017 0% -0% -0% 4% -4% -3%
Medium duty trucks VMT 487,628,577 387,786 5,670,969 503,816,344 399,075 5,869,409 505,647,835 401,210 5,896,144 0% 1% 0% 4% 3% 4%
Heavy duty trucks VMT 632,294,047 1,419,991 19,772,771 653,284,152 1,461,692 20,334,624 655,658,982 1,466,398 20,398,002 0% 0% 0% 4% 3% 3%
Buses VMT 346,001,787 687,896 9,548,307 294,114,348 571,213 8,215,958 305,464,091 586,859 8,633,174 4% 3% 5% -12% -15% -10%
Railways
Electricity - subway and commuter rail kWh 2,223,041,708 953,856 20,871,239 2,154,131,108 570,346 18,961,806 2,163,557,443 556,076 20,527,391 0% -3% 8% -3% -42% -2%
Diesel - commuter rail liters 5,207,218 14,098 192,691 5,470,547 14,811 202,435 5,452,200 14,761 201,756 -0% -0% -0% 5% 5% 5%
Marine Navigation
Diesel - marine navigation liters 18,247,504 49,962 673,386 14,092,419 38,585 520,051 25,241,030 69,110 931,467 79% 79% 79% 38% 38% 38%
Biofuel liters - - - - - - 45,333 0.1 1,548
Gasoline - marine navigation liters - - - - - - 8,718 21 291
Aviation
Jet fuel - aviation liters 933,093 2,426 33,610 898,529 2,336 32,365 1,016,754 2,643 36,623 13% 13% 13% 9% 9% 9%
Waste
Landfills
Exported solid waste - landfills MT 7,420,036 2,021,979 - 5,999,846 1,634,973 - 5,538,963 1,509,381 - -8% -8% 0% -25% -25% 0%
Biological treatment
CH4 and N2O - composting MT 26,351 4,991 - 36,980 7,004 - 564,146 106,849 - 0% 0% 0% 0% 0% 0%
Wastewater treatment
CH4 - wastewater treatment plants MT 6,536 163,402 - 5,699 142,468 - 5,842 146,058 - 3% 3% 0% -11% -11% 0%
N2O - wastewater treatment plants MT 286 85,120 - 255 75,866 - 251 74,871 - -1% -1% 0% -12% -12% 0%
TOTALS 61,062,452 1,084,533,543 52,740,933 1,084,168,127 52,042,186 1,119,368,701 -1.3% 3.2% -14.8% 3.2%
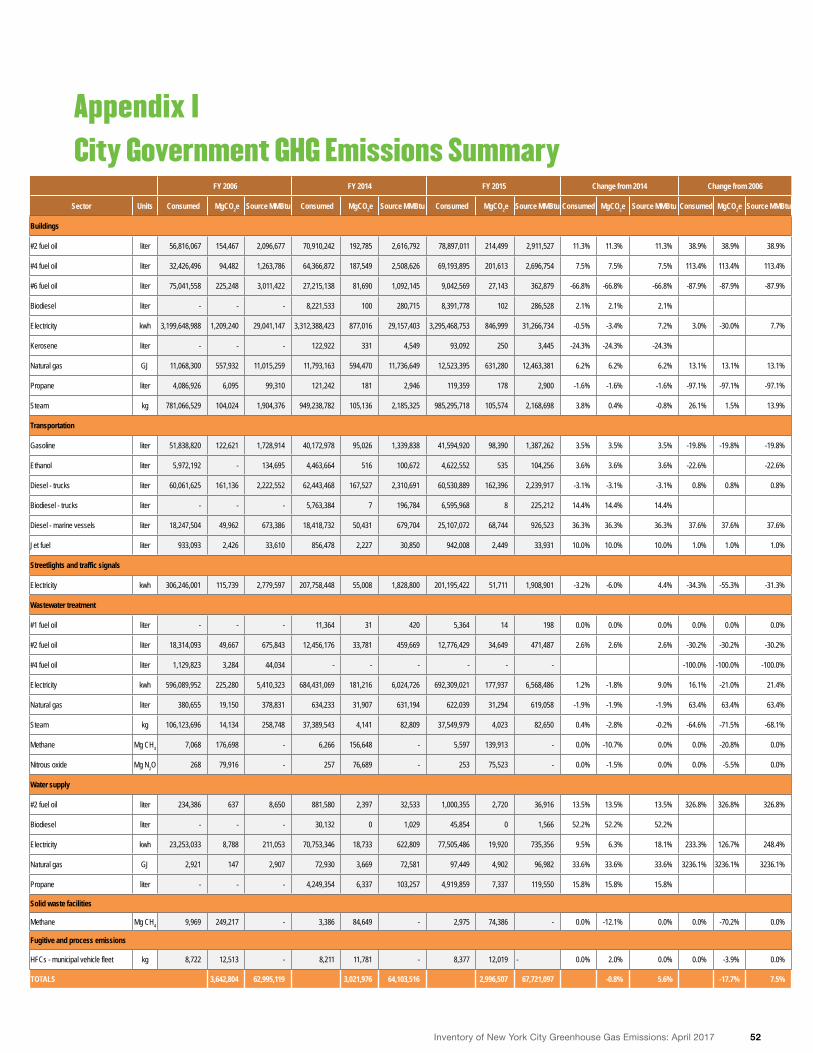
52Inventory of New York City Greenhouse Gas Emissions: April 2017
Appendix ICity Government GHG Emissions Summary
FY 2006 FY 2014 FY 2015 Change from 2014 Change from 2006
Sector Units Consumed MgCO2e Source MMBtu Consumed MgCO2e Source MMBtu Consumed MgCO2e Source MMBtu Consumed MgCO2e Source MMBtu Consumed MgCO2e Source MMBtu
Buildings
#2 fuel oil liter 56,816,067 154,467 2,096,677 70,910,242 192,785 2,616,792 78,897,011 214,499 2,911,527 11.3% 11.3% 11.3% 38.9% 38.9% 38.9%
#4 fuel oil liter 32,426,496 94,482 1,263,786 64,366,872 187,549 2,508,626 69,193,895 201,613 2,696,754 7.5% 7.5% 7.5% 113.4% 113.4% 113.4%
#6 fuel oil liter 75,041,558 225,248 3,011,422 27,215,138 81,690 1,092,145 9,042,569 27,143 362,879 -66.8% -66.8% -66.8% -87.9% -87.9% -87.9%
Biodiesel liter - - - 8,221,533 100 280,715 8,391,778 102 286,528 2.1% 2.1% 2.1%
Electricity kwh 3,199,648,988 1,209,240 29,041,147 3,312,388,423 877,016 29,157,403 3,295,468,753 846,999 31,266,734 -0.5% -3.4% 7.2% 3.0% -30.0% 7.7%
Kerosene liter - - - 122,922 331 4,549 93,092 250 3,445 -24.3% -24.3% -24.3%
Natural gas GJ 11,068,300 557,932 11,015,259 11,793,163 594,470 11,736,649 12,523,395 631,280 12,463,381 6.2% 6.2% 6.2% 13.1% 13.1% 13.1%
Propane liter 4,086,926 6,095 99,310 121,242 181 2,946 119,359 178 2,900 -1.6% -1.6% -1.6% -97.1% -97.1% -97.1%
Steam kg 781,066,529 104,024 1,904,376 949,238,782 105,136 2,185,325 985,295,718 105,574 2,168,698 3.8% 0.4% -0.8% 26.1% 1.5% 13.9%
Transportation
Gasoline liter 51,838,820 122,621 1,728,914 40,172,978 95,026 1,339,838 41,594,920 98,390 1,387,262 3.5% 3.5% 3.5% -19.8% -19.8% -19.8%
Ethanol liter 5,972,192 - 134,695 4,463,664 516 100,672 4,622,552 535 104,256 3.6% 3.6% 3.6% -22.6% -22.6%
Diesel - trucks liter 60,061,625 161,136 2,222,552 62,443,468 167,527 2,310,691 60,530,889 162,396 2,239,917 -3.1% -3.1% -3.1% 0.8% 0.8% 0.8%
Biodiesel - trucks liter - - - 5,763,384 7 196,784 6,595,968 8 225,212 14.4% 14.4% 14.4%
Diesel - marine vessels liter 18,247,504 49,962 673,386 18,418,732 50,431 679,704 25,107,072 68,744 926,523 36.3% 36.3% 36.3% 37.6% 37.6% 37.6%
Jet fuel liter 933,093 2,426 33,610 856,478 2,227 30,850 942,008 2,449 33,931 10.0% 10.0% 10.0% 1.0% 1.0% 1.0%
Streetlights and traffic signals
Electricity kwh 306,246,001 115,739 2,779,597 207,758,448 55,008 1,828,800 201,195,422 51,711 1,908,901 -3.2% -6.0% 4.4% -34.3% -55.3% -31.3%
Wastewater treatment
#1 fuel oil liter - - - 11,364 31 420 5,364 14 198 0.0% 0.0% 0.0% 0.0% 0.0% 0.0%
#2 fuel oil liter 18,314,093 49,667 675,843 12,456,176 33,781 459,669 12,776,429 34,649 471,487 2.6% 2.6% 2.6% -30.2% -30.2% -30.2%
#4 fuel oil liter 1,129,823 3,284 44,034 - - - - - - -100.0% -100.0% -100.0%
Electricity kwh 596,089,952 225,280 5,410,323 684,431,069 181,216 6,024,726 692,309,021 177,937 6,568,486 1.2% -1.8% 9.0% 16.1% -21.0% 21.4%
Natural gas liter 380,655 19,150 378,831 634,233 31,907 631,194 622,039 31,294 619,058 -1.9% -1.9% -1.9% 63.4% 63.4% 63.4%
Steam kg 106,123,696 14,134 258,748 37,389,543 4,141 82,809 37,549,979 4,023 82,650 0.4% -2.8% -0.2% -64.6% -71.5% -68.1%
Methane Mg CH4 7,068 176,698 - 6,266 156,648 - 5,597 139,913 - 0.0% -10.7% 0.0% 0.0% -20.8% 0.0%
Nitrous oxide Mg N2O 268 79,916 - 257 76,689 - 253 75,523 - 0.0% -1.5% 0.0% 0.0% -5.5% 0.0%
Water supply
#2 fuel oil liter 234,386 637 8,650 881,580 2,397 32,533 1,000,355 2,720 36,916 13.5% 13.5% 13.5% 326.8% 326.8% 326.8%
Biodiesel liter - - - 30,132 0 1,029 45,854 0 1,566 52.2% 52.2% 52.2%
Electricity kwh 23,253,033 8,788 211,053 70,753,346 18,733 622,809 77,505,486 19,920 735,356 9.5% 6.3% 18.1% 233.3% 126.7% 248.4%
Natural gas GJ 2,921 147 2,907 72,930 3,669 72,581 97,449 4,902 96,982 33.6% 33.6% 33.6% 3236.1% 3236.1% 3236.1%
Propane liter - - - 4,249,354 6,337 103,257 4,919,859 7,337 119,550 15.8% 15.8% 15.8%
Solid waste facilities
Methane Mg CH4 9,969 249,217 - 3,386 84,649 - 2,975 74,386 - 0.0% -12.1% 0.0% 0.0% -70.2% 0.0%
Fugitive and process emissions
HFCs - municipal vehicle fleet kg 8,722 12,513 - 8,211 11,781 - 8,377 12,019 - 0.0% 2.0% 0.0% 0.0% -3.9% 0.0%
TOTALS 3,642,804 62,995,119 3,021,976 64,103,516 2,996,507 67,721,097 -0.8% 5.6% -17.7% 7.5%
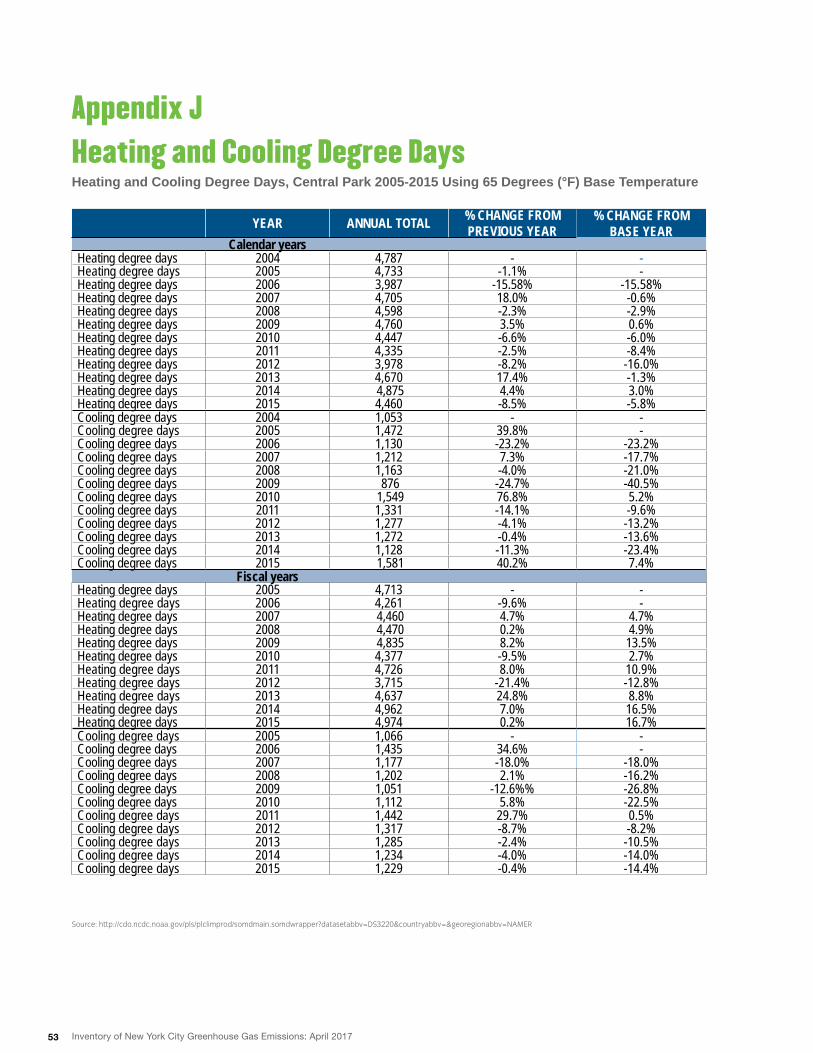
53 Inventory of New York City Greenhouse Gas Emissions: April 2017
YEAR ANNUAL TOTAL % CHANGE FROM PREVIOUS YEAR
% CHANGE FROM BASE YEAR
Calendar yearsHeating degree days 2004 4,787 - -Heating degree days 2005 4,733 -1.1% -Heating degree days 2006 3,987 -15.58% -15.58%Heating degree days 2007 4,705 18.0% -0.6%Heating degree days 2008 4,598 -2.3% -2.9%Heating degree days 2009 4,760 3.5% 0.6%Heating degree days 2010 4,447 -6.6% -6.0%Heating degree days 2011 4,335 -2.5% -8.4%Heating degree days 2012 3,978 -8.2% -16.0%Heating degree days 2013 4,670 17.4% -1.3%Heating degree days 2014 4,875 4.4% 3.0%Heating degree days 2015 4,460 -8.5% -5.8%Cooling degree days 2004 1,053 - -Cooling degree days 2005 1,472 39.8% -Cooling degree days 2006 1,130 -23.2% -23.2%Cooling degree days 2007 1,212 7.3% -17.7%Cooling degree days 2008 1,163 -4.0% -21.0%Cooling degree days 2009 876 -24.7% -40.5%Cooling degree days 2010 1,549 76.8% 5.2%Cooling degree days 2011 1,331 -14.1% -9.6%Cooling degree days 2012 1,277 -4.1% -13.2%Cooling degree days 2013 1,272 -0.4% -13.6%Cooling degree days 2014 1,128 -11.3% -23.4%Cooling degree days 2015 1,581 40.2% 7.4%
Fiscal yearsHeating degree days 2005 4,713 - -Heating degree days 2006 4,261 -9.6% -Heating degree days 2007 4,460 4.7% 4.7%Heating degree days 2008 4,470 0.2% 4.9%Heating degree days 2009 4,835 8.2% 13.5%Heating degree days 2010 4,377 -9.5% 2.7%Heating degree days 2011 4,726 8.0% 10.9%Heating degree days 2012 3,715 -21.4% -12.8%Heating degree days 2013 4,637 24.8% 8.8%Heating degree days 2014 4,962 7.0% 16.5%Heating degree days 2015 4,974 0.2% 16.7%Cooling degree days 2005 1,066 - -Cooling degree days 2006 1,435 34.6% -Cooling degree days 2007 1,177 -18.0% -18.0%Cooling degree days 2008 1,202 2.1% -16.2%Cooling degree days 2009 1,051 -12.6%% -26.8%Cooling degree days 2010 1,112 5.8% -22.5%Cooling degree days 2011 1,442 29.7% 0.5%Cooling degree days 2012 1,317 -8.7% -8.2%Cooling degree days 2013 1,285 -2.4% -10.5%Cooling degree days 2014 1,234 -4.0% -14.0%Cooling degree days 2015 1,229 -0.4% -14.4%
Heating and Cooling Degree Days, Central Park 2005-2015 Using 65 Degrees (°F) Base Temperature
Source: http://cdo.ncdc.noaa.gov/pls/plclimprod/somdmain.somdwrapper?datasetabbv=DS3220&countryabbv=&georegionabbv=NAMER
Appendix J Heating and Cooling Degree Days
54Inventory of New York City Greenhouse Gas Emissions: April 2017
Appendix K Endnotes1 City of New York, 2014, available at http://www.nyc.gov/
html/builttolast/assets/downloads/pdf/OneCity.pdf
2City of New York, 2014, available at http://www.nyc.gov/
html/onenyc/downloads/pdf/publications/OneNYC.pdf
3City of New York, 2016, available at http://www1.nyc.gov/
assets/sustainability/downloads/pdf/publications/New%20
York%20City’s%20Roadmap%20to%2080%20x%2050_Final.
4ICLEI-USA, 2010, available at https://s3.amazonaws.com/
icleiusaresources/lgo_protocol_v1_1_2010-05-03.pdf
5Xpand, a proprietary model licensed to the Brattle Group
from the Lantau Group, is a capacity expansion model that
endogenously determines the last-cost strategy to meet
load given a series of constraints.
6City of New York, 2005, available at http://www1.nyc.gov/
assets/dsny/docs/about_2004-2005-waste-characteriza-
tion_0815.pdf
7City of New York, 2004, available at http://www1.nyc.gov/
assets/dsny/about/inside-dsny/commercial-waste-man-
agement-study-2004.shtml

55 Inventory of New York City Greenhouse Gas Emissions: April 2017
All calculations presented in this report are based on data submitted to the New York City Mayor’s Office. While every effort
has been made to ensure the data’s accuracy, the possibility for errors exists. This report is not intended to be a flawless
accounting of New York City’s carbon emissions, but is rather intended to provide guidance from which policy decisions may
be based. The City of New York does not accept responsibility for the completeness or accuracy of this report, and it shall not
be held liable for any damage or loss that may result, either directly or indirectly, as a result of its use.

56Inventory of New York City Greenhouse Gas Emissions: April 2017