Inventory Management - OER University - Anvari.Net€¦ · PPT file · Web view ·...
83
12 – 1 Copyright © 2010 Pearson Education, Inc. Publishing as Prentice Hall. Inventory Inventory Management Management 12 For For Operations Management, Operations Management, 9e 9e by by Krajewski/Ritzman/Malhotr Krajewski/Ritzman/Malhotr a a PowerPoint PowerPoint Slides by Jeff Slides by Jeff Heyl Heyl
Transcript of Inventory Management - OER University - Anvari.Net€¦ · PPT file · Web view ·...

12 – 1Copyright © 2010 Pearson Education, Inc. Publishing as Prentice Hall.
Inventory ManagementInventory Management12
For For Operations Management, 9eOperations Management, 9e by by Krajewski/Ritzman/Malhotra Krajewski/Ritzman/Malhotra © 2010 Pearson Education© 2010 Pearson Education
PowerPoint Slides PowerPoint Slides by Jeff Heylby Jeff Heyl

12 – 2Copyright © 2010 Pearson Education, Inc. Publishing as Prentice Hall.
Inventory ManagementInventory Management
Inventories are important to all types of organizations They have to be counted, paid for, used in
operations, used to satisfy customers, and managed
Too much inventory reduces profitability Too little inventory damages customer
confidence Inventory trade-offs

12 – 3Copyright © 2010 Pearson Education, Inc. Publishing as Prentice Hall.
ABC AnalysisABC Analysis
Stock-keeping units (SKU) Identify the classes so management can
control inventory levels A Pareto chart Cycle counting

12 – 4Copyright © 2010 Pearson Education, Inc. Publishing as Prentice Hall.
10 20 30 40 50 60 70 80 90 100Percentage of SKUs
Perc
enta
ge o
f dol
lar v
alue
100 —
90 —
80 —
70 —
60 —
50 —
40 —
30 —
20 —
10 —
0 —
Class C
Class A
Class B
ABC AnalysisABC Analysis
Figure 12.1 – Typical Chart Using ABC Analysis

12 – 5Copyright © 2010 Pearson Education, Inc. Publishing as Prentice Hall.
Economic Order QuantityEconomic Order Quantity
The lot size, Q, that minimizes total annual inventory holding and ordering costs
Five assumptions1. Demand rate is constant and known with certainty2. No constraints are placed on the size of each lot3. The only two relevant costs are the inventory holding
cost and the fixed cost per lot for ordering or setup4. Decisions for one item can be made independently of
decisions for other items5. The lead time is constant and known with certainty

12 – 6Copyright © 2010 Pearson Education, Inc. Publishing as Prentice Hall.
Economic Order QuantityEconomic Order Quantity
Don’t use the EOQ Make-to-order strategy Order size is constrained
Modify the EOQ Quantity discounts Replenishment not instantaneous
Use the EOQ Make-to-stock Carrying and setup costs are known and
relatively stable

12 – 7Copyright © 2010 Pearson Education, Inc. Publishing as Prentice Hall.
Calculating EOQCalculating EOQ
Inventory depletion (demand rate)
Receive order
1 cycle
On-
hand
inve
ntor
y (u
nits
)
Time
Q
Averagecycleinventory
Q2
Figure 12.2 – Cycle-Inventory Levels

12 – 8Copyright © 2010 Pearson Education, Inc. Publishing as Prentice Hall.
Calculating EOQCalculating EOQ
Annual holding costAnnual holding cost = (Average cycle inventory)
(Unit holding cost) Annual ordering cost
Annual ordering cost = (Number of orders/Year) (Ordering or setup costs)
Total annual cycle-inventory costTotal costs = Annual holding cost
+ Annual ordering or setup cost

12 – 9Copyright © 2010 Pearson Education, Inc. Publishing as Prentice Hall.
Ann
ual c
ost (
dolla
rs)
Lot Size (Q)
Holding cost
Ordering cost
Total cost
Calculating EOQCalculating EOQ
Figure 12.3 – Graphs of Annual Holding, Ordering, and Total Costs

12 – 10Copyright © 2010 Pearson Education, Inc. Publishing as Prentice Hall.
Calculating EOQCalculating EOQ
Total annual cycle-inventory cost
whereC = total annual cycle-inventory costQ = lot sizeH = holding cost per unit per yearD = annual demandS = ordering or setup costs per lot
C = (H) + (S)Q2
DQ

12 – 11Copyright © 2010 Pearson Education, Inc. Publishing as Prentice Hall.
The Cost of a Lot-Sizing PolicyThe Cost of a Lot-Sizing Policy
EXAMPLE 12.1 A museum of natural history opened a gift shop which
operates 52 weeks per year. Managing inventories has become a problem. Top-selling SKU is a bird feeder. Sales are 18 units per week, the supplier charges $60 per
unit. Ordering cost is $45. Annual holding cost is 25 percent of a feeder’s value. Management chose a 390-unit lot size. What is the annual cycle-inventory cost of the current policy
of using a 390-unit lot size? Would a lot size of 468 be better?

12 – 12Copyright © 2010 Pearson Education, Inc. Publishing as Prentice Hall.
The Cost of a Lot-Sizing PolicyThe Cost of a Lot-Sizing Policy
SOLUTIONWe begin by computing the annual demand and holding cost as
D =H =
C = (H) + (S)Q2
DQ
The total annual cycle-inventory cost for the alternative lot size is
= ($15) + ($45)
= $2,925 + $108 = $3,033
3902
936390
The total annual cycle-inventory cost for the current policy is
(18 units/week)(52 weeks/year) = 936 units0.25($60/unit) = $15
C = ($15) + ($45) = $3,510 + $90 = $3,6004682
936468

12 – 13Copyright © 2010 Pearson Education, Inc. Publishing as Prentice Hall.
The Cost of a Lot-Sizing PolicyThe Cost of a Lot-Sizing Policy
3000 –
2000 –
1000 –
0 –| | | | | | | |
50 100 150 200 250 300 350 400Lot Size (Q)
Ann
ual c
ost (
dolla
rs)
CurrentQ
Currentcost
Lowestcost
Best Q (EOQ)
Total cost = (H) + (S)
Q2
DQ
Figure 12.4 – Total Annual Cycle-Inventory Cost Function for the Bird Feeder
Ordering cost = (S)DQ
Holding cost = (H)Q2

12 – 14Copyright © 2010 Pearson Education, Inc. Publishing as Prentice Hall.
Calculating EOQCalculating EOQ
The EOQ formula:
EOQ = 2DSH
Time between orders
TBOEOQ = (12 months/year)EOQD

12 – 15Copyright © 2010 Pearson Education, Inc. Publishing as Prentice Hall.
Finding the EOQ, Total Cost, TBOFinding the EOQ, Total Cost, TBO
EXAMPLE 12.2For the bird feeders in Example 12.1, calculate the EOQ and its total annual cycle-inventory cost. How frequently will orders be placed if the EOQ is used?
SOLUTIONUsing the formulas for EOQ and annual cost, we get
EOQ = =2DSH
= 74.94 or 75 units2(936)(45)15
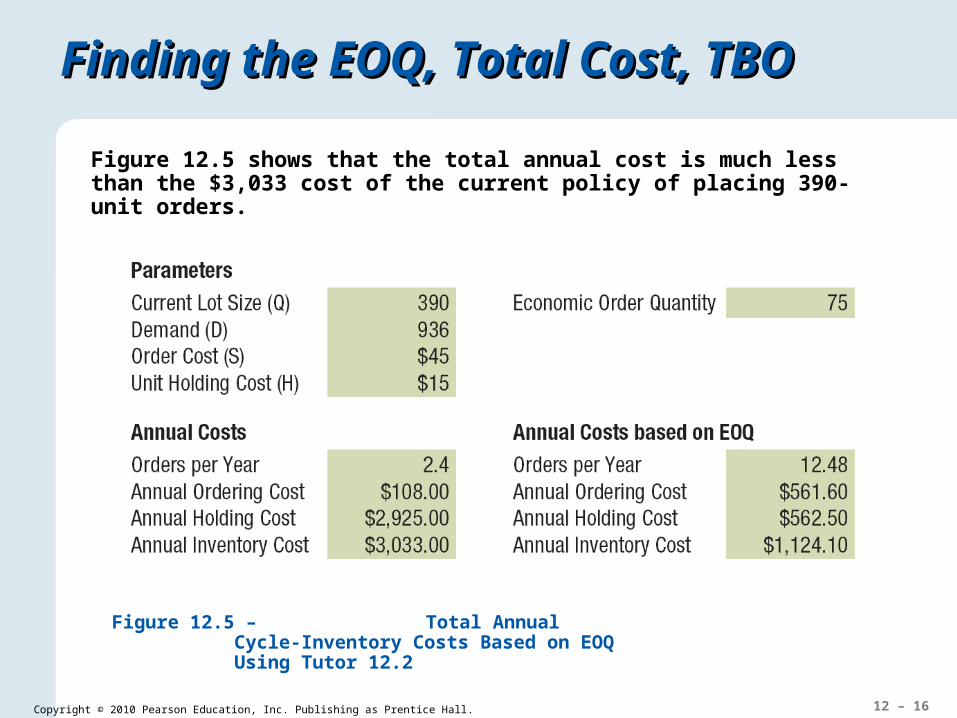
12 – 16Copyright © 2010 Pearson Education, Inc. Publishing as Prentice Hall.
Finding the EOQ, Total Cost, TBOFinding the EOQ, Total Cost, TBO
Figure 12.5 shows that the total annual cost is much less than the $3,033 cost of the current policy of placing 390-unit orders.
Figure 12.5 – Total Annual Cycle-Inventory Costs Based on EOQ Using Tutor 12.2

12 – 17Copyright © 2010 Pearson Education, Inc. Publishing as Prentice Hall.
Finding the EOQ, Total Cost, TBOFinding the EOQ, Total Cost, TBO
When the EOQ is used, the TBO can be expressed in various ways for the same time period.
TBOEOQ =EOQ
D
TBOEOQ = (12 months/year)EOQ
D
TBOEOQ = (52 weeks/year)EOQ
D
TBOEOQ = (365 days/year)EOQ
D
= = 0.080 year75936
= (12) = 0.96 month75936
= (52) = 4.17 weeks75936
= (365) = 29.25 days75936

12 – 18Copyright © 2010 Pearson Education, Inc. Publishing as Prentice Hall.
Application 12.1Application 12.1
Suppose that you are reviewing the inventory policies on an $80 item stocked at a hardware store. The current policy is to replenish inventory by ordering in lots of 360 units. Additional information is:
D = 60 units per week, or 3,120 units per yearS = $30 per orderH = 25% of selling price, or $20 per unit per year
What is the EOQ?
EOQ = =2DSH
= 97 units2(3,120)(30)20
SOLUTION

12 – 19Copyright © 2010 Pearson Education, Inc. Publishing as Prentice Hall.
Current Policy EOQ Policy
Application 12.1Application 12.1
What is the total annual cost of the current policy (Q = 360), and how does it compare with the cost with using the EOQ?
Q = 360 units Q = 97 units
C = 3,600 + 260
C = $3,860
C = (360/2)(20) + (3,120/360)(30)
C = 970 + 965
C = $1,935
C = (97/2)(20) + (3,120/97)(30)

12 – 20Copyright © 2010 Pearson Education, Inc. Publishing as Prentice Hall.
Application 12.1Application 12.1
What is the time between orders (TBO) for the current policy and the EOQ policy, expressed in weeks?
TBO360 =
TBOEOQ =
(52 weeks per year) = 6 weeks3603,120
(52 weeks per year) = 1.6 weeks973,120
SOLUTION

12 – 21Copyright © 2010 Pearson Education, Inc. Publishing as Prentice Hall.
Managerial InsightsManagerial Insights
TABLE 12.1 | SENSITIVITY ANALYSIS OF THE EOQ
Parameter EOQ Parameter Change
EOQ Change
Comments
Demand ↑ ↑ Increase in lot size is in proportion to the square root of D.
Order/Setup Costs ↓ ↓
Weeks of supply decreases and inventory turnover increases because the lot size decreases.
Holding Costs ↓ ↑ Larger lots are justified when holding
costs decrease.
2DSH
2DSH
2DSH

12 – 22Copyright © 2010 Pearson Education, Inc. Publishing as Prentice Hall.
Inventory Control SystemsInventory Control Systems
Two important questions: How much? When?
Nature of demand Independent demand Dependent demand

12 – 23Copyright © 2010 Pearson Education, Inc. Publishing as Prentice Hall.
Inventory Control SystemsInventory Control Systems
Continuous review (Q) system Reorder point system (ROP) and fixed order
quantity system For independent demand items Tracks inventory position (IP) Includes scheduled receipts (SR), on-hand
inventory (OH), and back orders (BO)
Inventory position = On-hand inventory + Scheduled receipts – Backorders
IP = OH + SR – BO

12 – 24Copyright © 2010 Pearson Education, Inc. Publishing as Prentice Hall.
Selecting the Reorder PointSelecting the Reorder Point
Time
On-
hand
inve
ntor
y
TBO TBOL L
TBOL
Orderplaced
Orderplaced
Orderplaced
IP IPIP
R
Q QQ
OH OHOH
Orderreceived
Orderreceived
Orderreceived
Orderreceived
Figure 12.6 – Q System When Demand and Lead Time Are Constant and Certain

12 – 25Copyright © 2010 Pearson Education, Inc. Publishing as Prentice Hall.
Application 12.2Application 12.2
The on-hand inventory is only 10 units, and the reorder point R is 100. There are no backorders and one open order for 200 units. Should a new order be placed?
IP = OH + SR – BO = 10 + 200 – 0 = 210
R = 100
SOLUTION
Decision: Place no new order

12 – 26Copyright © 2010 Pearson Education, Inc. Publishing as Prentice Hall.
Placing a New OrderPlacing a New Order
EXAMPLE 12.3Demand for chicken soup at a supermarket is always 25 cases a day and the lead time is always 4 days. The shelves were just restocked with chicken soup, leaving an on-hand inventory of only 10 cases. No backorders currently exist, but there is one open order in the pipeline for 200 cases. What is the inventory position? Should a new order be placed?
SOLUTIONR =Total demand during lead time = (25)(4) = 100 cases
= 10 + 200 – 0 = 210 casesIP = OH + SR – BO

12 – 27Copyright © 2010 Pearson Education, Inc. Publishing as Prentice Hall.
Continuous Review SystemsContinuous Review Systems
Selecting the reorder point with variable demand and constant lead time
Reorder point =Average demand during lead time + Safety stock=dL + safety stock
whered = average demand per week (or day or months)L = constant lead time in weeks (or days or months)

12 – 28Copyright © 2010 Pearson Education, Inc. Publishing as Prentice Hall.
Continuous Review SystemsContinuous Review Systems
Time
On-
hand
inve
ntor
y
TBO1 TBO2 TBO3
L1 L2 L3
R
Orderreceived
Q
Orderplaced
Orderplaced
Orderreceived
IP IP
Q
Orderplaced
Q
Orderreceived
Orderreceived
0
IP
Figure 12.7 – Q System When Demand Is Uncertain

12 – 29Copyright © 2010 Pearson Education, Inc. Publishing as Prentice Hall.
Reorder PointReorder Point
1. Choose an appropriate service-level policy Select service level or cycle service level Protection interval
2. Determine the demand during lead time probability distribution
3. Determine the safety stock and reorder point levels

12 – 30Copyright © 2010 Pearson Education, Inc. Publishing as Prentice Hall.
Demand During Lead TimeDemand During Lead Time
Specify mean and standard deviationStandard deviation of demand during lead time
σdLT = σd2L = σd L
Safety stock and reorder point
Safety stock = zσdLT
wherez =number of standard deviations needed to achieve the cycle-service levelσdLT =stand deviation of demand during lead time
Reorder point = R = dL + safety stock

12 – 31Copyright © 2010 Pearson Education, Inc. Publishing as Prentice Hall.
σt = 15
+75
Demand for week 1
σt = 25.98
225Demand for 3-week lead time
+75
Demand for week 2
σt = 15
=75
Demand for week 3
σt = 15
Demand During Lead TimeDemand During Lead Time
Figure 12.8 – Development of Demand Distribution for the Lead Time

12 – 32Copyright © 2010 Pearson Education, Inc. Publishing as Prentice Hall.
Demand During Lead TimeDemand During Lead Time
Average demand
during lead time
Cycle-service level = 85%
Probability of stockout(1.0 – 0.85 = 0.15)
zσdLT
R
Figure 12.9 – Finding Safety Stock with a Normal Probability Distribution for an 85 Percent Cycle-Service Level

12 – 33Copyright © 2010 Pearson Education, Inc. Publishing as Prentice Hall.
Reorder Point for Variable DemandReorder Point for Variable Demand
EXAMPLE 12.4Let us return to the bird feeder in Example 12.2. The EOQ is 75 units. Suppose that the average demand is 18 units per week with a standard deviation of 5 units. The lead time is constant at two weeks. Determine the safety stock and reorder point if management wants a 90 percent cycle-service level.

12 – 34Copyright © 2010 Pearson Education, Inc. Publishing as Prentice Hall.
Reorder Point for Variable DemandReorder Point for Variable Demand
SOLUTIONIn this case, σd = 5, d = 18 units, and L = 2 weeks, so σdLT = σd L = 5 2 = 7.07. Consult the body of the table in the Normal Distribution appendix for 0.9000, which corresponds to a 90 percent cycle-service level. The closest number is 0.8997, which corresponds to 1.2 in the row heading and 0.08 in the column heading. Adding these values gives a z value of 1.28. With this information, we calculate the safety stock and reorder point as follows:
Safety stock = zσdLT = 1.28(7.07) = 9.05 or 9 units
2(18) + 9 = 45 unitsReorder point = dL + Safety stock =

12 – 35Copyright © 2010 Pearson Education, Inc. Publishing as Prentice Hall.
Application 12.3Application 12.3
Suppose that the demand during lead time is normally distributed with an average of 85 and σdLT = 40. Find the safety stock, and reorder point R, for a 95 percent cycle-service level.
SOLUTIONSafety stock = zσdLT =
Find the safety stock, and reorder point R, for an 85 percent cycle-service level.
R = Average demand during lead time + Safety stock R = 85 + 66 = 151 units
1.645(40) = 65.8 or 66 units
Safety stock = zσdLT = 1.04(40) = 41.6 or 42 unitsR = Average demand during lead time + Safety stockR = 85 + 42 = 127 units

12 – 36Copyright © 2010 Pearson Education, Inc. Publishing as Prentice Hall.
Reorder Point for Variable Demand Reorder Point for Variable Demand and Lead Timeand Lead Time
Often the case that both are variableThe equations are more complicated
Safety stock = zσdLT
whered =Average weekly (or daily or monthly) demandL =Average lead timeσd =Standard deviation of weekly (or daily or monthly) demandσLT =Standard deviation of the lead timeσdLT = Lσd
2 + d2σLT2
R =(Average weekly demand Average lead time) + Safety stock=dL + Safety stock

12 – 37Copyright © 2010 Pearson Education, Inc. Publishing as Prentice Hall.
Reorder PointReorder Point
EXAMPLE 12.5The Office Supply Shop estimates that the average demand for a popular ball-point pen is 12,000 pens per week with a standard deviation of 3,000 pens. The current inventory policy calls for replenishment orders of 156,000 pens. The average lead time from the distributor is 5 weeks, with a standard deviation of 2 weeks. If management wants a 95 percent cycle-service level, what should the reorder point be?

12 – 38Copyright © 2010 Pearson Education, Inc. Publishing as Prentice Hall.
Reorder PointReorder Point
SOLUTION
From the Normal Distribution appendix for 0.9500, the appropriate z value = 1.65. We calculate the safety stock and reorder point as follows:
σdLT = Lσd2 + d2σLT
2 =
We have d = 12,000 pens, σd = 3,000 pens, L = 5 weeks, and σLT = 2 weeks
(5)(3,000)2 + (12,000)2(2)2
= 24,919.87 pens
Safety stock = zσdLT =
Reorder point = dL + Safety stock =
(1.65)(24,919.87) = 41,117.79 or 41,118 pens
(12,000)(5) + 41.118 = 101,118 pens

12 – 39Copyright © 2010 Pearson Education, Inc. Publishing as Prentice Hall.
Application 12.4Application 12.4
Grey Wolf lodge is a popular 500-room hotel in the North Woods. Managers need to keep close tabs on all of the room service items, including a special pint-scented bar soap. The daily demand for the soap is 275 bars, with a standard deviation of 30 bars. Ordering cost is $10 and the inventory holding cost is $0.30/bar/year. The lead time from the supplier is 5 days, with a standard deviation of 1 day. The lodge is open 365 days a year.What should the reorder point be for the bar of soap if management wants to have a 99 percent cycle-service?

12 – 40Copyright © 2010 Pearson Education, Inc. Publishing as Prentice Hall.
Application 12.4Application 12.4
SOLUTION
d =275 barsL =5 days
σd =30 barsσLT =1 day
283.06 barsσdLT = Lσd2 + d2σLT
2 =
From the Normal Distribution appendix for 0.9900, z = 2.33. We calculate the safety stock and reorder point as follows;
Safety stock = zσdLT = Reorder point + safety stock = dL + safety stock
(2.33)(283.06) = 659.53 or 660 bars
= (275)(5) + 660 = 2,035 bars

12 – 41Copyright © 2010 Pearson Education, Inc. Publishing as Prentice Hall.
Continuous Review SystemsContinuous Review Systems
Two-Bin system Visual system An empty first bin signals the need to place an order
Calculating total systems costs
Total cost = Annual cycle inventory holding cost + Annual ordering cost + Annual safety stock holding cost
C = (H) + (S) + (H) (Safety stock)Q2
DQ

12 – 42Copyright © 2010 Pearson Education, Inc. Publishing as Prentice Hall.
Application 12.5Application 12.5
The Discount Appliance Store uses a continuous review system (Q system). One of the company’s items has the following characteristics:
Demand = 10 units/wk (assume 52 weeks per year)Ordering and setup cost (S) = $45/orderHolding cost (H) = $12/unit/yearLead time (L) = 3 weeks (constant)Standard deviation in weekly demand = 8 unitsCycle-service level = 70%

12 – 43Copyright © 2010 Pearson Education, Inc. Publishing as Prentice Hall.
Application 12.5Application 12.5
SOLUTIONWhat is the EOQ for this item?
D = 10/wk 52 wks/yr = 520 units
EOQ = =2DSH
= 62 units2(520)(45)12
What is the desired safety stock?
σdLT = σd L = 8 3 = 14 units
Safety stock = zσdLT = 0.525(14) = 8 units

12 – 44Copyright © 2010 Pearson Education, Inc. Publishing as Prentice Hall.
Application 12.5Application 12.5
What is the desired reorder point R?
R = Average demand during lead time + Safety stockR =
What is the total annual cost?
3(10) + 8 = 38 units
($12) + ($45) + 8($12) = $845.42622
52062C =

12 – 45Copyright © 2010 Pearson Education, Inc. Publishing as Prentice Hall.
Application 12.5Application 12.5
Suppose that the current policy is Q = 80 and R = 150. What will be the changes in average cycle inventory and safety stock if your EOQ and R values are implemented?
Reducing Q from 80 to 62Cycle inventory reduction = 40 – 31 = 9 units
Safety stock reduction = 120 – 8 = 112 units
Reducing R from 150 to 38

12 – 46Copyright © 2010 Pearson Education, Inc. Publishing as Prentice Hall.
Periodic Review System (Periodic Review System (PP))
Fixed interval reorder system or periodic reorder system
Four of the original EOQ assumptions maintained No constraints are placed on lot size Holding and ordering costs Independent demand Lead times are certain
Order is placed to bring the inventory position up to the target inventory level, T, when the predetermined time, P, has elapsed

12 – 47Copyright © 2010 Pearson Education, Inc. Publishing as Prentice Hall.
Periodic Review System (Periodic Review System (PP))
P P
T
L L L
Protection interval
Time
On-
hand
inve
ntor
y
IP3
IP1
IP2
OrderplacedOrderplaced
Orderplaced
Orderreceived
Orderreceived
Orderreceived
IP IPIP
OH OHQ1
Q2
Q3
Figure 12.10 – P System When Demand Is Uncertain

12 – 48Copyright © 2010 Pearson Education, Inc. Publishing as Prentice Hall.
How Much to Order in a How Much to Order in a PP System System
EXAMPLE 12.6A distribution center has a backorder for five 36-inch color TV sets. No inventory is currently on hand, and now is the time to review. How many should be reordered if T = 400 and no receipts are scheduled?
SOLUTIONIP = OH + SR – BO
That is, 405 sets must be ordered to bring the inventory position up to T sets.
= 0 + 0 – 5 = –5 sets
T – IP = 400 – (–5) = 405 sets

12 – 49Copyright © 2010 Pearson Education, Inc. Publishing as Prentice Hall.
Application 12.6Application 12.6
The on-hand inventory is 10 units, and T is 400. There are no back orders, but one scheduled receipt of 200 units. Now is the time to review. How much should be reordered?
SOLUTION
IP = OH + SR – BO
The decision is to order 190 units
= 10 + 200 – 0 = 210
T – IP = 400 – 210 = 190

12 – 50Copyright © 2010 Pearson Education, Inc. Publishing as Prentice Hall.
Periodic Review SystemPeriodic Review System
Selecting the time between reviews, choosing P and T
T = d(P + L) + safety stock for protection interval
Selecting T when demand is variable and lead time is constant
IP covers demand over a protection interval of P + L
The average demand during the protection interval is d(P + L), or
Safety stock = zσP + L , where σP + L = LPd

12 – 51Copyright © 2010 Pearson Education, Inc. Publishing as Prentice Hall.
Calculating Calculating PP and and TT
EXAMPLE 12.7Again, let us return to the bird feeder example. Recall that demand for the bird feeder is normally distributed with a mean of 18 units per week and a standard deviation in weekly demand of 5 units. The lead time is 2 weeks, and the business operates 52 weeks per year. The Q system developed in Example 12.4 called for an EOQ of 75 units and a safety stock of 9 units for a cycle-service level of 90 percent. What is the equivalent P system? Answers are to be rounded to the nearest integer.

12 – 52Copyright © 2010 Pearson Education, Inc. Publishing as Prentice Hall.
Calculating Calculating PP and and TT
SOLUTIONWe first define D and then P. Here, P is the time between reviews, expressed in weeks because the data are expressed as demand per week:
D = (18 units/week)(52 weeks/year) = 936 units
P = (52) =EOQD
(52) = 4.2 or 4 weeks75936
With d = 18 units per week, an alternative approach is to calculate P by dividing the EOQ by d to get 75/18 = 4.2 or 4 weeks. Either way, we would review the bird feeder inventory every 4 weeks.

12 – 53Copyright © 2010 Pearson Education, Inc. Publishing as Prentice Hall.
Calculating Calculating PP and and TT
We now find the standard deviation of demand over the protection interval (P + L) = 6:
Before calculating T, we also need a z value. For a 90 percent cycle-service level z = 1.28. The safety stock becomes
Safety stock = zσP + L = 1.28(12.25) = 15.68 or 16 units
We now solve for T:
= (18 units/week)(6 weeks) + 16 units = 124 units
T = Average demand during the protection interval + Safety stock= d(P + L) + safety stock
units 12.2565 LPdLP

12 – 54Copyright © 2010 Pearson Education, Inc. Publishing as Prentice Hall.
Periodic Review SystemPeriodic Review System
Use simulation when both demand and lead time are variable
Suitable to single-bin systems Total costs for the P system are the sum of the
same three cost elements as in the Q system Order quantity and safety stock are calculated
differently
C = (H) + (S) + HzσP + LdP2
DdP

12 – 55Copyright © 2010 Pearson Education, Inc. Publishing as Prentice Hall.
Application 12.7Application 12.7
Return to Discount Appliance Store (Application 12.4), but now use the P system for the item. Previous information
Demand = 10 units/wk (assume 52 weeks per year) = 520EOQ = 62 units (with reorder point system)Lead time (L) = 3 weeksStandard deviation in weekly demand = 8 unitsz = 0.525 (for cycle-service level of 70%)
Reorder interval P, if you make the average lot size using the Periodic Review System approximate the EOQ.

12 – 56Copyright © 2010 Pearson Education, Inc. Publishing as Prentice Hall.
Application 12.7Application 12.7
SOLUTIONReorder interval P, if you make the average lot size using the Periodic Review System approximate the EOQ.
P = (EOQ/D)(52) = (62/529)(52) = 6.2 or 6 weeks
Safety stock
Target inventory
T = 10(6 + 3) + 13 = 103 unitsT = d(P + L) + safety stock for protection interval
Safety stock = LPd
units 13 or 12.63680.525

12 – 57Copyright © 2010 Pearson Education, Inc. Publishing as Prentice Hall.
Application 12.7Application 12.7
Total cost
C = (H) + (S) + HzσP + L
dP2
DdP
= ($12) + ($45) + (13)($12) = $906.0010(6)
2520
10(6)

12 – 58Copyright © 2010 Pearson Education, Inc. Publishing as Prentice Hall.
Comparative AdvantagesComparative Advantages
Primary advantages of P systems Convenient Orders can be combined Only need to know IP when review is made
Primary advantages of Q systems Review frequency may be individualized Fixed lot sizes can result in quantity discounts Lower safety stocks

12 – 59Copyright © 2010 Pearson Education, Inc. Publishing as Prentice Hall.
Optional replenishment systems Optimal review, min-max, or (s,S) system, like the P
system Reviews IP at fixed time intervals and places a variable-
sized order to cover expected needs Ensures that a reasonable large order is placed
Hybrid systemsHybrid systems
Base-stock system Replenishment order is issued each time a withdrawal is
made Order quantities vary to keep the inventory position at R Minimizes cycle inventory, but increases ordering costs Appropriate for expensive items

12 – 60Copyright © 2010 Pearson Education, Inc. Publishing as Prentice Hall.
Solved Problem 1Solved Problem 1
Booker’s Book Bindery divides SKUs into three classes, according to their dollar usage. Calculate the usage values of the following SKUs and determine which is most likely to be classified as class A.
SKU Number Description Quantity Used per Year
Unit Value ($)
1 Boxes 500 3.002 Cardboard
(square feet)18,000 0.02
3 Cover stock 10,000 0.754 Glue (gallons) 75 40.005 Inside covers 20,000 0.056 Reinforcing tape
(meters)3,000 0.15
7 Signatures 150,000 0.45

12 – 61Copyright © 2010 Pearson Education, Inc. Publishing as Prentice Hall.
Solved Problem 1Solved Problem 1
SOLUTIONThe annual dollar usage for each item is determined by multiplying the annual usage quantity by the value per unit. As shown in Figure 12.11, the SKUs are then sorted by annual dollar usage, in declining order. Finally, A–B and B–C class lines are drawn roughly, according to the guidelines presented in the text. Here, class A includes only one SKU (signatures), which represents only 1/7, or 14 percent, of the SKUs but accounts for 83 percent of annual dollar usage. Class B includes the next two SKUs, which taken together represent 28 percent of the SKUs and account for 13 percent of annual dollar usage. The final four SKUs, class C, represent over half the number of SKUs but only 4 percent of total annual dollar usage.

12 – 62Copyright © 2010 Pearson Education, Inc. Publishing as Prentice Hall.
Solved Problem 1Solved Problem 1
SKU Number Description
Quantity Used per
YearUnit Value
($)Annual Dollar
Usage ($)
1 Boxes 500 3.00 = 1,500
2 Cardboard (square feet)
18,000 0.02 = 360
3 Cover stock 10,000 0.75 = 7,500
4 Glue (gallons) 75 40.00 = 3,000
5 Inside covers 20,000 0.05 = 1,000
6 Reinforcing tape (meters)
3,000 0.15 = 450
7 Signatures 150,000 0.45 = 67,500
Total 81,310

12 – 63Copyright © 2010 Pearson Education, Inc. Publishing as Prentice Hall.
Solved Problem 1Solved Problem 1
Percentage of SKUs
Perc
enta
ge o
f Dol
lar V
alue
100 –90 –80 –70 –60 –50 –40 –30 –20 –10 –
0 –10 30 40 50 60 70 80 90 10020
Class C
Class A
Class B
Figure 12.11 – Annual Dollar Usage for Class A, B, and C SKUs Using Tutor 12.2

12 – 64Copyright © 2010 Pearson Education, Inc. Publishing as Prentice Hall.
Solved Problem 2Solved Problem 2
Nelson’s Hardware Store stocks a 19.2 volt cordless drill that is a popular seller. Annual demand is 5,000 units, the ordering cost is $15, and the inventory holding cost is $4/unit/year.
a. What is the economic order quantity?b. What is the total annual cost for this inventory item?
SOLUTIONa. The order quantity is
EOQ = =2DSH
2(5,000)($15)$4
= 37,500 = 193.65 or 194 drills
b. The total annual cost is
C = (H) + (S) =Q2
DQ ($4) + ($15) = $774.60194
25,000194

12 – 65Copyright © 2010 Pearson Education, Inc. Publishing as Prentice Hall.
Solved Problem 3Solved Problem 3
A regional distributor purchases discontinued appliances from various suppliers and then sells them on demand to retailers in the region. The distributor operates 5 days per week, 52 weeks per year. Only when it is open for business can orders be received. Management wants to reevaluate its current inventory policy, which calls for order quantities of 440 counter-top mixers. The following data are estimated for the mixer:
Average daily demand (d) = 100 mixersStandard deviation of daily demand (σd) = 30 mixersLead time (L) = 3 daysHolding cost (H) = $9.40/unit/yearOrdering cost (S) = $35/orderCycle-service level = 92 percentThe distributor uses a continuous review (Q) system

12 – 66Copyright © 2010 Pearson Education, Inc. Publishing as Prentice Hall.
Solved Problem 3Solved Problem 3
a. What order quantity Q, and reorder point, R, should be used?b. What is the total annual cost of the system?c. If on-hand inventory is 40 units, one open order for 440
mixers is pending, and no backorders exist, should a new order be placed?

12 – 67Copyright © 2010 Pearson Education, Inc. Publishing as Prentice Hall.
Solved Problem 3Solved Problem 3
SOLUTIONa. Annual demand is
The order quantity is
D = (5 days/week)(52 weeks/year)(100 mixers/day)= 26,000 mixers/year
EOQ = =2DSH
2(26,000)($35)$9.40
= 193,167 = 440.02 or 440 mixers

12 – 68Copyright © 2010 Pearson Education, Inc. Publishing as Prentice Hall.
Solved Problem 3Solved Problem 3
The standard deviation of the demand during lead time distribution is
A 92 percent cycle-service level corresponds to z = 1.41
σdLT = σd L = 30 3 = 51.96
Safety stock = zσdLT = 1.41(51.96 mixers) = 73.26 or 73 mixers
100(3) = 300 mixersAverage demand during lead time = dL =
Reorder point (R) = Average demand during lead time + Safety stock
= 300 mixers + 73 mixers = 373 mixers
With a continuous review system, Q = 440 and R = 373

12 – 69Copyright © 2010 Pearson Education, Inc. Publishing as Prentice Hall.
Solved Problem 3Solved Problem 3
b. The total annual cost for the Q systems is
C = (H) + (S) + (H)(Safety stock)Q2
DQ
C = ($9.40) + ($35) + ($9.40)(73) = $4,822.384402
26,000440
c. Inventory position = On-hand inventory + Scheduled receipts – Backorders
IP = OH + SR – BO = 40 + 440 – 0 = 480 mixers
Because IP (480) exceeds R (373), do not place a new order

12 – 70Copyright © 2010 Pearson Education, Inc. Publishing as Prentice Hall.
Solved Problem 4Solved Problem 4
Suppose that a periodic review (P) system is used at the distributor in Solved Problem 3, but otherwise the data are the same.a. Calculate the P (in workdays, rounded to the nearest day)
that gives approximately the same number of orders per year as the EOQ.
b. What is the target inventory level, T? Compare the P system to the Q system in Solved Problem 3.
c. What is the total annual cost of the P system?d. It is time to review the item. On-hand inventory is 40 mixers;
receipt of 440 mixers is scheduled, and no backorders exist. How much should be reordered?

12 – 71Copyright © 2010 Pearson Education, Inc. Publishing as Prentice Hall.
Solved Problem 4Solved Problem 4SOLUTIONa. The time between orders is
P = (260 days/year) = EOQD (260) = 4.4 or 4 days440
26,000
b. Figure 12.12 shows that T = 812 and safety stock = (1.41)(79.37) = 111.91 or about 112 mixers. The corresponding Q system for the counter-top mixer requires less safety stock.
Figure 12.12 –OM Explorer Solver for Inventory Systems

12 – 72Copyright © 2010 Pearson Education, Inc. Publishing as Prentice Hall.
Solved Problem 4Solved Problem 4
c. The total annual cost of the P system is
C = (H) + (S) + (H)(Safety stock)dP2
DdP
C = ($9.40) + ($35) + ($9.40)(1.41)(79.37)100(4)
226,000100(4)
= $5,207.80d. Inventory position is the amount on hand plus scheduled
receipts minus backorders, or
IP = OH + SR – BO = 40 + 440 – 0 = 480 mixersThe order quantity is the target inventory level minus the inventory position, or
Q = T – IP = An order for 332 mixers should be placed.
812 mixers – 480 mixers = 332 mixers

12 – 73Copyright © 2010 Pearson Education, Inc. Publishing as Prentice Hall.
Solved Problem 5Solved Problem 5
Grey Wolf Lodge is a popular 500-room hotel in the North Woods. Managers need to keep close tabs on all room service items, including a special pine-scented bar soap. The daily demand for the soap is 275 bars, with a standard deviation of 30 bars. Ordering cost is $10 and the inventory holding cost is $0.30/bar/year. The lead time from the supplier is 5 days, with a standard deviation of 1 day. The lodge is open 365 days a year.a. What is the economic order quantity for the bar of soap?b. What should the reorder point be for the bar of soap if
management wants to have a 99 percent cycle-service level?c. What is the total annual cost for the bar of soap, assuming a
Q system will be used?

12 – 74Copyright © 2010 Pearson Education, Inc. Publishing as Prentice Hall.
Solved Problem 5Solved Problem 5
SOLUTIONa. We have D = (275)(365) = 100,375 bars of soap; S = $10; and
H = $0.30. The EOQ for the bar of soap is
EOQ = =2DSH
2(100,375)($10)$0.30
= 6,691,666.7 = 2,586.83 or 2,587 bars

12 – 75Copyright © 2010 Pearson Education, Inc. Publishing as Prentice Hall.
Solved Problem 5Solved Problem 5
b. We have d = 275 bars/day, σd = 30 bars, L = 5 days, and σLT = 1 day.
σdLT = Lσd2 + d2σLT
2 = (5)(30)2 + (275)2(1)2 = 283.06 bars
Consult the body of the Normal Distribution appendix for 0.9900. The closest value is 0.9901, which corresponds to a z value of 2.33. We calculate the safety stock and reorder point as follows:
Safety stock = zσdLT = (2.33)(283.06) = 659.53 or 660 bars
Reorder point = dL + Safety stock = (275)(5) + 660 = 2,035 bars

12 – 76Copyright © 2010 Pearson Education, Inc. Publishing as Prentice Hall.
Solved Problem 5Solved Problem 5
c. The total annual cost for the Q system is
C = (H) + (S) + (H)(Safety stock)Q2
DQ
C = ($0.30) + ($10) + ($0.30)(660) = $974.052,587
2100,375
2,587

12 – 77Copyright © 2010 Pearson Education, Inc. Publishing as Prentice Hall.
Solved Problem 6Solved Problem 6
Zeke’s Hardware Store sells furnace filters. The cost to place an order to the distributor is $25 and the annual cost to hold a filter in stock is $2. The average demand per week for the filters is 32 units, and the store operates 50 weeks per year. The weekly demand for filters has the probability distribution shown on the left below. The delivery lead time from the distributor is uncertain and has the probability distribution shown on the right below. Suppose Zeke wants to use a P system with P = 6 weeks and a cycle-service level of 90 percent. What is the appropriate value for T and the associated annual cost of the system?

12 – 78Copyright © 2010 Pearson Education, Inc. Publishing as Prentice Hall.
Solved Problem 6Solved Problem 6
Demand Probability
24 0.15
28 0.20
32 0.30
36 0.20
40 0.15
Lead Time (wks) Probability
1 0.05
2 0.25
3 0.40
4 0.25
5 0.05

12 – 79Copyright © 2010 Pearson Education, Inc. Publishing as Prentice Hall.
Solved Problem 6Solved Problem 6
SOLUTIONFigure 12.13 contains output from the Demand During the Protection Interval Simulator from OM Explorer.
Figure 12.13 – OM Explorer Solver for Demand during the Protection Interval

12 – 80Copyright © 2010 Pearson Education, Inc. Publishing as Prentice Hall.
Solved Problem 6Solved Problem 6
Given the desired cycle-service level of 90 percent, the appropriate T value is 322 units. The simulation estimated the average demand during the protection interval to be 289 units, consequently the safety stock is 322 – 289 = 33 units.The annual cost of this P system is
C = ($2) + ($25) + (33)($2)6(32)
250(32)6(32)
= $192.00 + $208.33 + $66.00 = $466.33

12 – 81Copyright © 2010 Pearson Education, Inc. Publishing as Prentice Hall.
Solved Problem 7Solved Problem 7
Consider Zeke’s inventory in Solved Problem 6. Suppose that he wants to use a continuous review (Q) system for the filters, with an order quantity of 200 and a reorder point of 140. Initial inventory is 170 units. If the stockout cost is $5 per unit, and all of the other data in Solved Problem 6 are the same, what is the expected cost per week of using the Q system?
SOLUTIONFigure 12.14 shows output from the Q System Simulator in OM Explorer. Only weeks 1 through 13 and weeks 41 through 50 are shown in the figure. The average total cost per week is $305.62. Notice that no stockouts occurred in this simulation. These results are dependent on Zeke’s choices for the reorder point and lot size. It is possible that stockouts would occur if the simulation were run for more than 50 weeks.

12 – 82Copyright © 2010 Pearson Education, Inc. Publishing as Prentice Hall.
Solved Problem 7Solved Problem 7
Figure 12.14 – OM Explorer Q System Simulator

12 – 83Copyright © 2010 Pearson Education, Inc. Publishing as Prentice Hall.