
Inventory Management Best Practices for 2012 - MDM · Inventory Management Best Practices for 2012...
65
Inventory Management Best Practices for 2012 event sponsor produced by December 1, 2011 [email protected] www.manh.com
Transcript of Inventory Management Best Practices for 2012 - MDM · Inventory Management Best Practices for 2012...
Inventory Management Best Practices for 2012
event sponsorproduced by
December 1, 2011
[email protected] www.manh.com
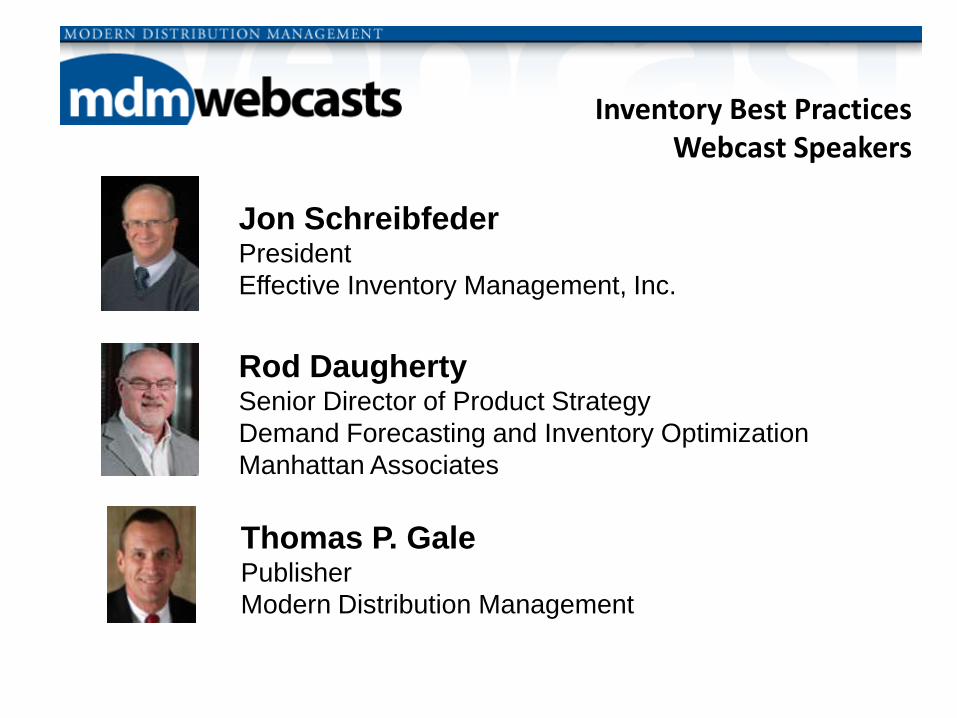
Thomas P. GalePublisher
Modern Distribution Management
Rod DaughertySenior Director of Product Strategy
Demand Forecasting and Inventory Optimization
Manhattan Associates
Jon SchreibfederPresident
Effective Inventory Management, Inc.
Inventory Best PracticesWebcast Speakers
Achieving Effective Inventory ManagementFifth Edition
By Jon Schreibfeder
• 10% off $74 list price
• Free shipping
Order at www.mdm.com/store
Promotion code: Webcast
Special offer for attendees: Get the book!
4
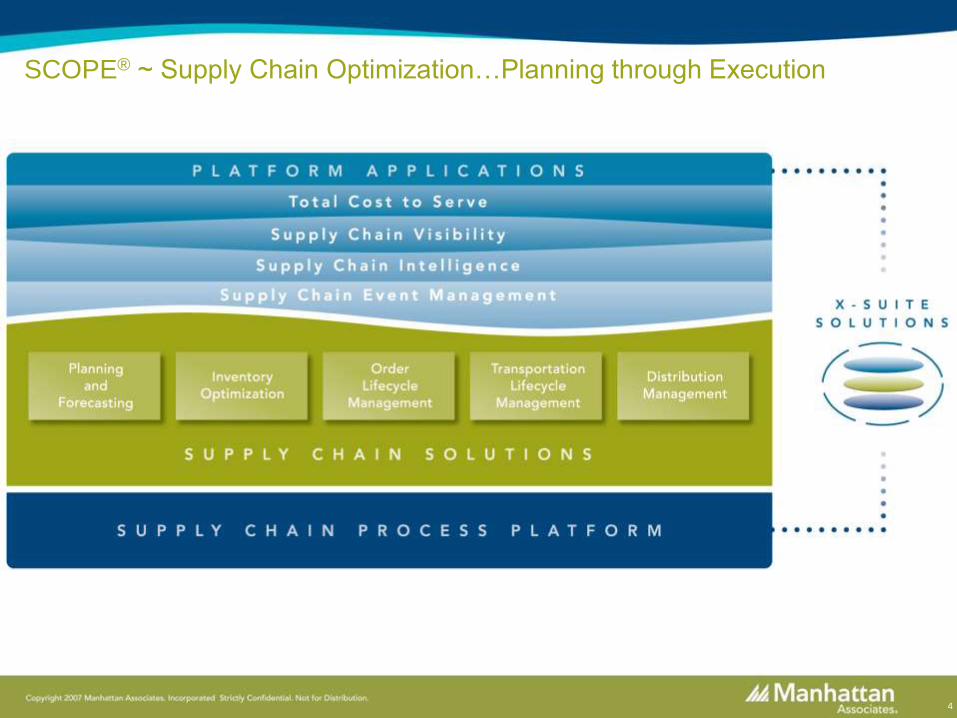
SCOPE® ~ Supply Chain Optimization…Planning through Execution
5
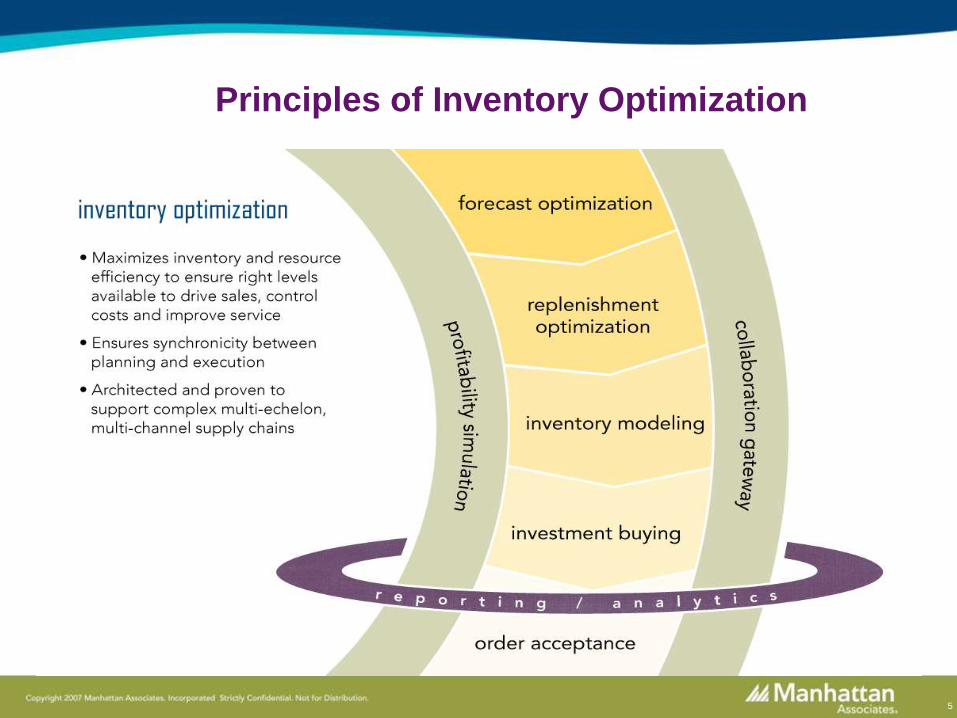
Principles of Inventory Optimization
6Copyright 2011 Manhattan Associates, Incorporated. Strictly Confidential. Not for Distribution.
6
First Steps to Achieving
Effective Inventory Management Jon SchreibfederPresident
Effective Inventory Management
7Copyright 2011 Manhattan Associates, Incorporated. Strictly Confidential. Not for Distribution.
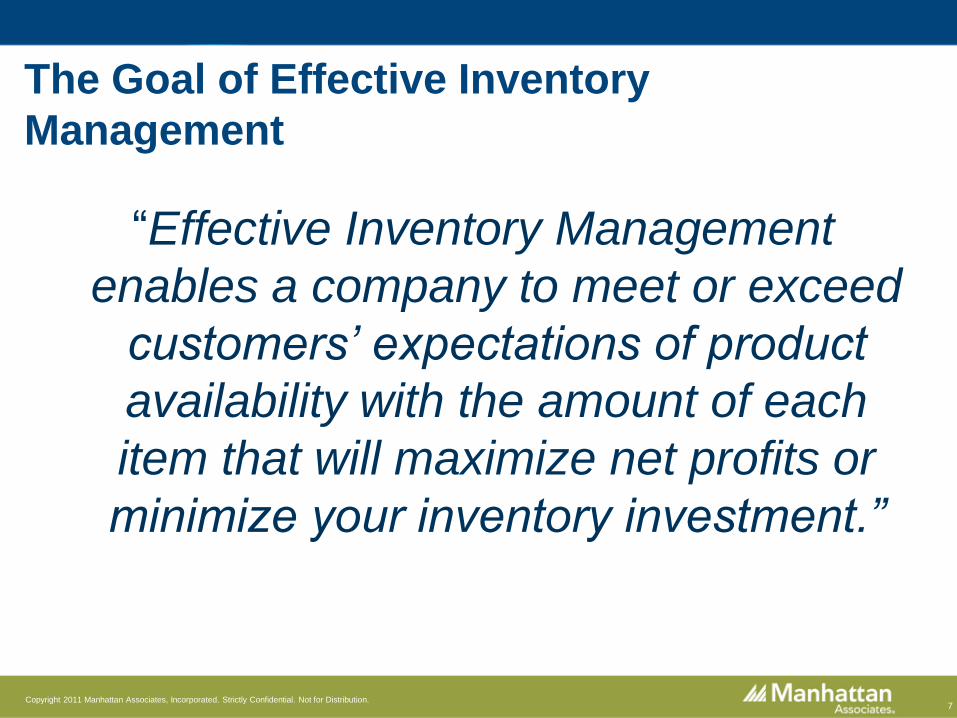
“Effective Inventory Management
enables a company to meet or exceed
customers’ expectations of product
availability with the amount of each
item that will maximize net profits or
minimize your inventory investment.”
The Goal of Effective Inventory
Management
8Copyright 2011 Manhattan Associates, Incorporated. Strictly Confidential. Not for Distribution.
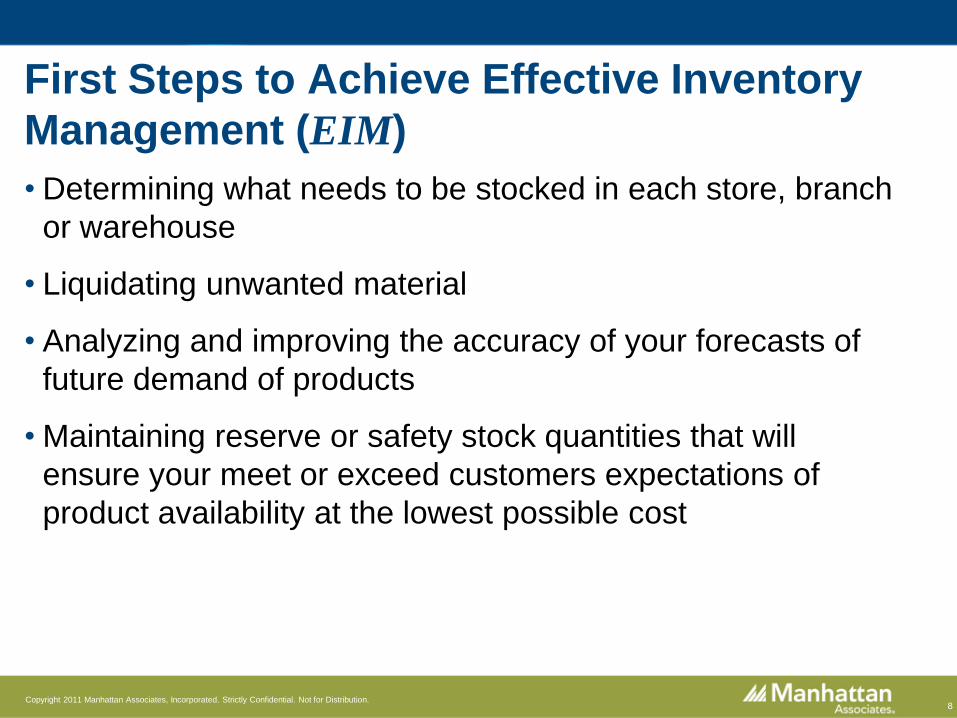
• Determining what needs to be stocked in each store, branch
or warehouse
• Liquidating unwanted material
• Analyzing and improving the accuracy of your forecasts of
future demand of products
• Maintaining reserve or safety stock quantities that will
ensure your meet or exceed customers expectations of
product availability at the lowest possible cost
First Steps to Achieve Effective Inventory
Management (EIM)
9Copyright 2011 Manhattan Associates, Incorporated. Strictly Confidential. Not for Distribution.
• Stocking a product is a commitment to have that product
available in reasonable quantities
• Your facilities are probably filled with:
–Stock (Merchandise you intend to stock)
–Stuff (Material that inadvertently got stuck in your facility)
What Do Your Customers Expect You to
Have in Stock?
10Copyright 2011 Manhattan Associates, Incorporated. Strictly Confidential. Not for Distribution.
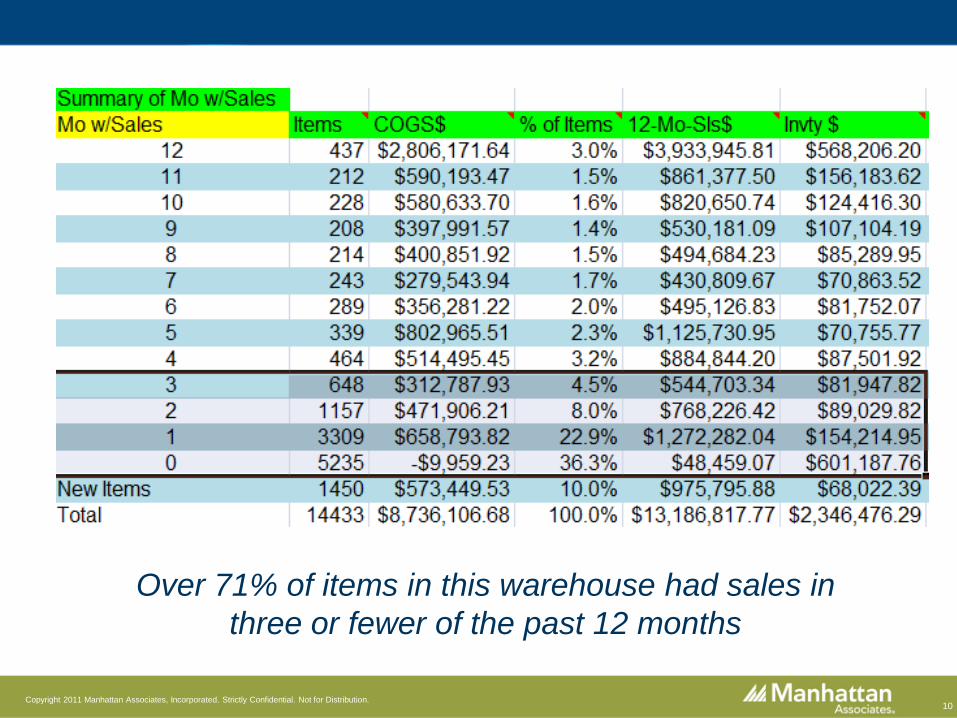
Over 71% of items in this warehouse had sales in
three or fewer of the past 12 months
11Copyright 2011 Manhattan Associates, Incorporated. Strictly Confidential. Not for Distribution.
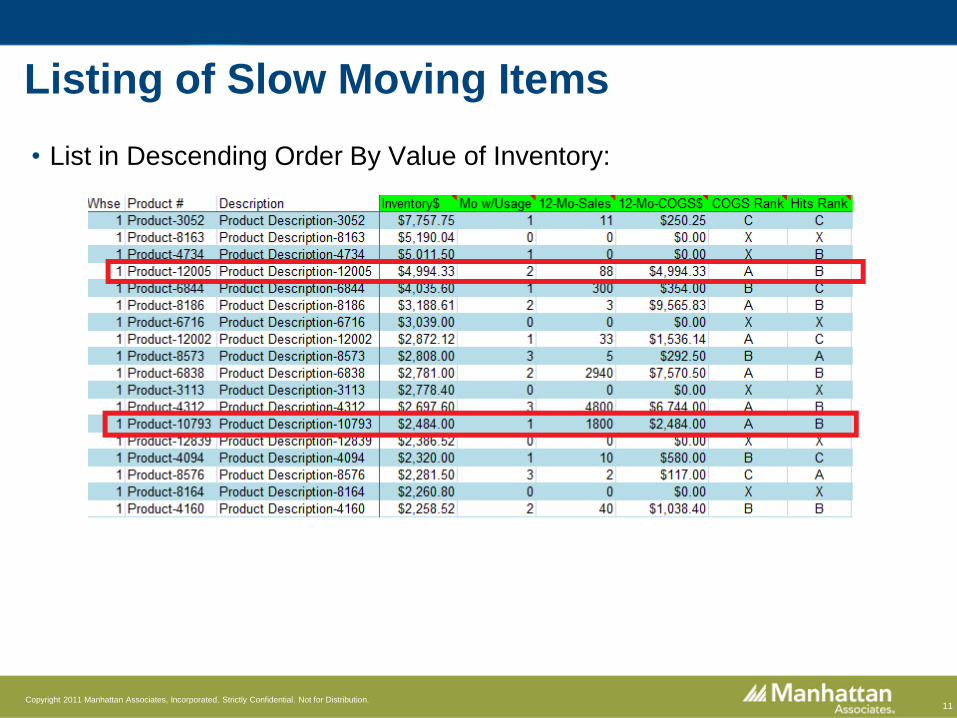
Listing of Slow Moving Items
• List in Descending Order By Value of Inventory:
12Copyright 2011 Manhattan Associates, Incorporated. Strictly Confidential. Not for Distribution.
• Do customers realistically expect it to be available
for immediate delivery?
• Is it a critical item that must be stocked in case of
emergency?
• Does the profit margin offset the cost of carrying
inventory for a prolonged period of time?
• Can a more popular item be used in its place?
Question Why Each Slow Moving Product
is Stocked
13Copyright 2011 Manhattan Associates, Incorporated. Strictly Confidential. Not for Distribution.
• The GOOD: Inventory that you stock that provides
an acceptable return on your investment
Types of Stocked Inventory
14Copyright 2011 Manhattan Associates, Incorporated. Strictly Confidential. Not for Distribution.
• The GOOD: Inventory that you stock that provides
an acceptable return on your investment
• The BAD: Inventory that doesn’t provide an
acceptable return on your investment, but
contributes to other profitable sales
Types of Stocked Inventory
15Copyright 2011 Manhattan Associates, Incorporated. Strictly Confidential. Not for Distribution.
• The GOOD: Inventory that you stock that provides
an acceptable return on your investment
• The BAD: Inventory that doesn’t provide an
acceptable return on your investment, but
contributes to other profitable sales
• The UGLY: Inventory that doesn’t provide an
acceptable return on your investment, and doesn’t
contribute to other profitable sales
Types of Stocked Inventory
16Copyright 2011 Manhattan Associates, Incorporated. Strictly Confidential. Not for Distribution.
• Gross Margin is defined as:
Sales Dollars - Cost of Goods Sold Dollars
Sales Dollars
No, gross margin dollars don’t vary as
the amount of inventory increases
Can You Base Actual Profitability on Gross
Margin?
17Copyright 2011 Manhattan Associates, Incorporated. Strictly Confidential. Not for Distribution.
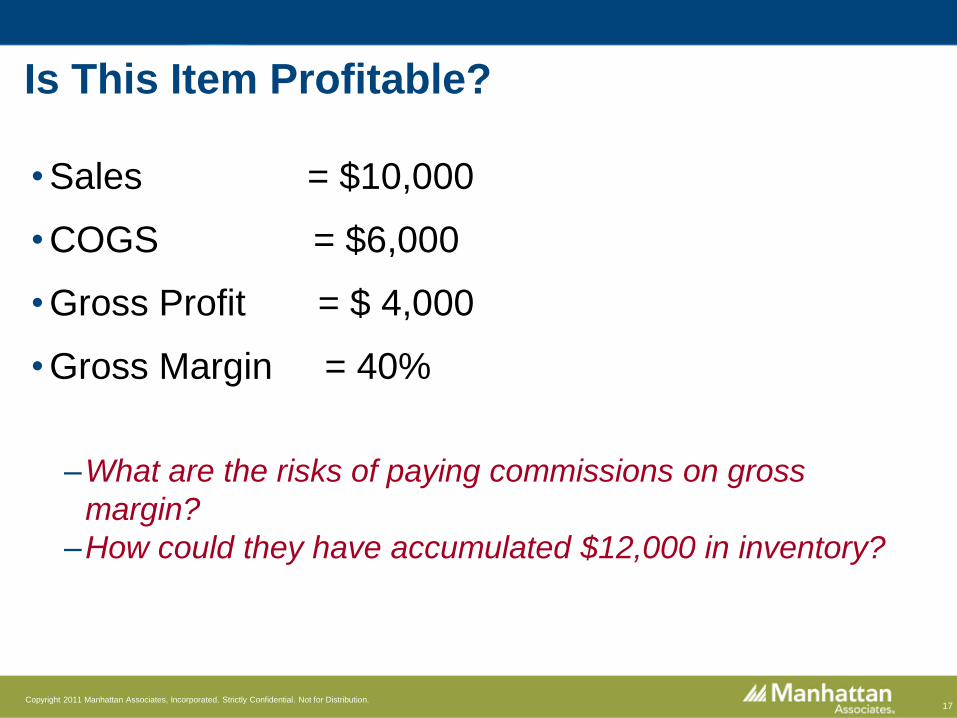
• Sales = $10,000
• COGS = $6,000
• Gross Profit = $ 4,000
• Gross Margin = 40%
ave $12,000 in inventory!–What are the risks of paying commissions on gross
margin?
–How could they have accumulated $12,000 in inventory?
Is This Item Profitable?
18Copyright 2011 Manhattan Associates, Incorporated. Strictly Confidential. Not for Distribution.
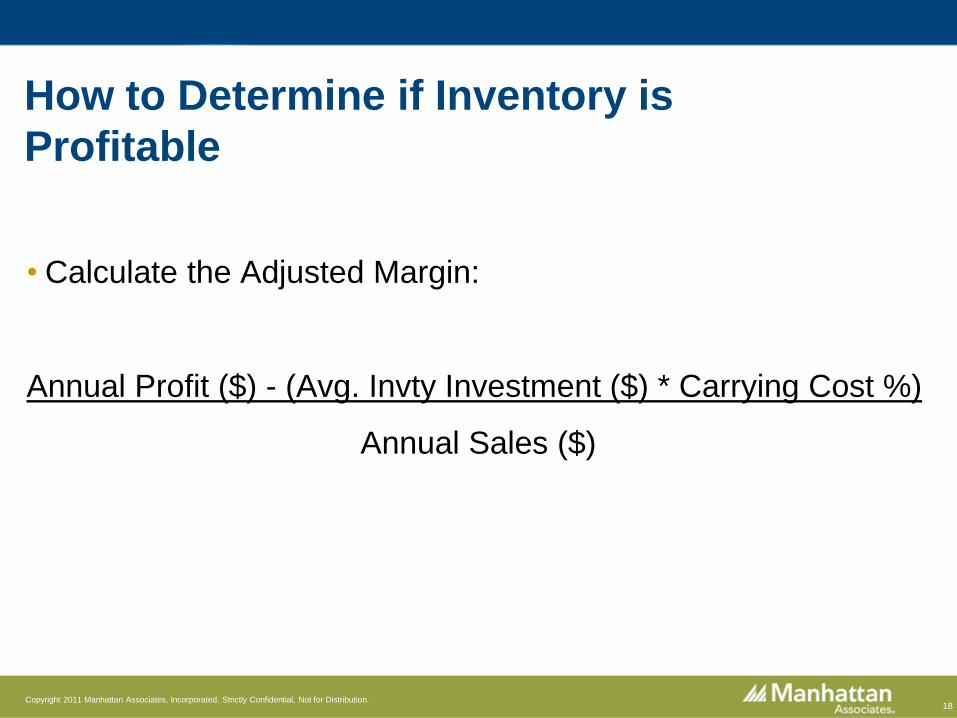
• Calculate the Adjusted Margin:
Annual Profit ($) - (Avg. Invty Investment ($) * Carrying Cost %)
Annual Sales ($)
How to Determine if Inventory is
Profitable
19Copyright 2011 Manhattan Associates, Incorporated. Strictly Confidential. Not for Distribution.
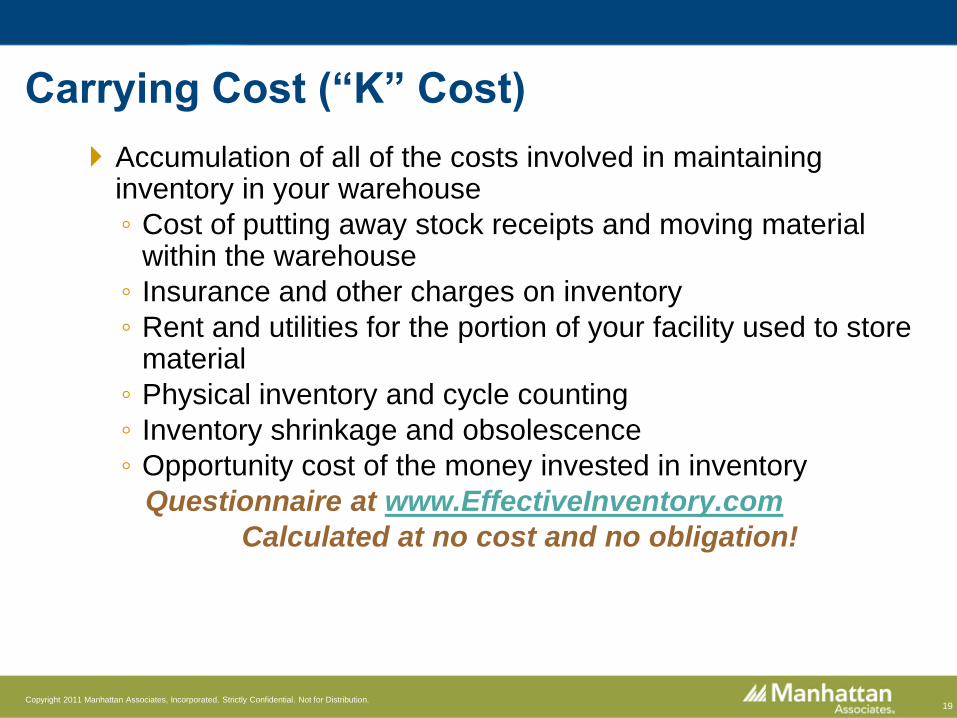
Accumulation of all of the costs involved in maintaining inventory in your warehouse
◦ Cost of putting away stock receipts and moving material within the warehouse
◦ Insurance and other charges on inventory
◦ Rent and utilities for the portion of your facility used to store material
◦ Physical inventory and cycle counting
◦ Inventory shrinkage and obsolescence
◦ Opportunity cost of the money invested in inventory
Questionnaire at www.EffectiveInventory.com
Calculated at no cost and no obligation!
Carrying Cost (“K” Cost)
20Copyright 2011 Manhattan Associates, Incorporated. Strictly Confidential. Not for Distribution.
21Copyright 2011 Manhattan Associates, Incorporated. Strictly Confidential. Not for Distribution.
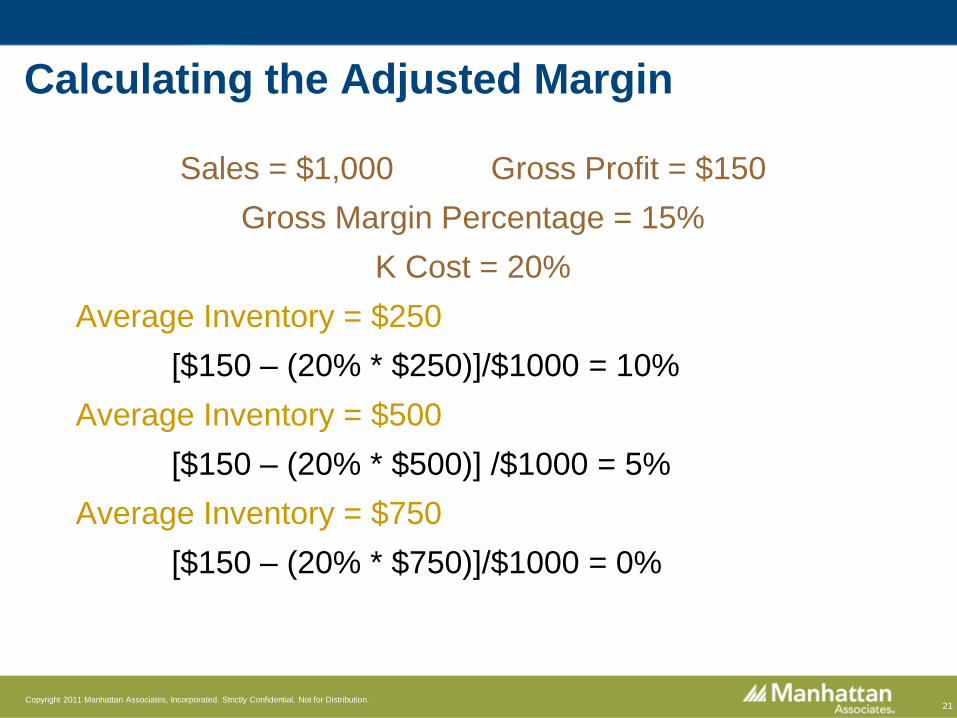
Calculating the Adjusted Margin
Sales = $1,000 Gross Profit = $150
Gross Margin Percentage = 15%
K Cost = 20%
Average Inventory = $250
[$150 – (20% * $250)]/$1000 = 10%
Average Inventory = $500
[$150 – (20% * $500)] /$1000 = 5%
Average Inventory = $750
[$150 – (20% * $750)]/$1000 = 0%
22Copyright 2011 Manhattan Associates, Incorporated. Strictly Confidential. Not for Distribution.
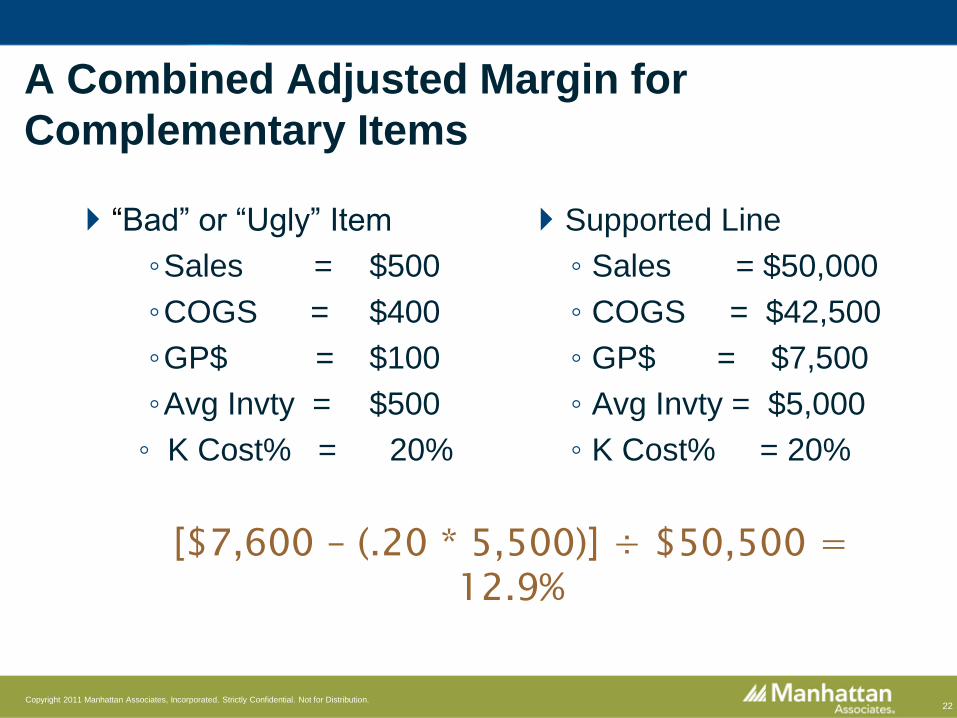
A Combined Adjusted Margin for
Complementary Items
Supported Line
◦ Sales = $50,000
◦ COGS = $42,500
◦ GP$ = $7,500
◦ Avg Invty = $5,000
◦ K Cost% = 20%
“Bad” or “Ugly” Item
◦Sales = $500
◦COGS = $400
◦GP$ = $100
◦Avg Invty = $500
◦ K Cost% = 20%
[$7,600 – (.20 * 5,500)] ÷ $50,500 = 12.9%
23Copyright 2011 Manhattan Associates, Incorporated. Strictly Confidential. Not for Distribution.
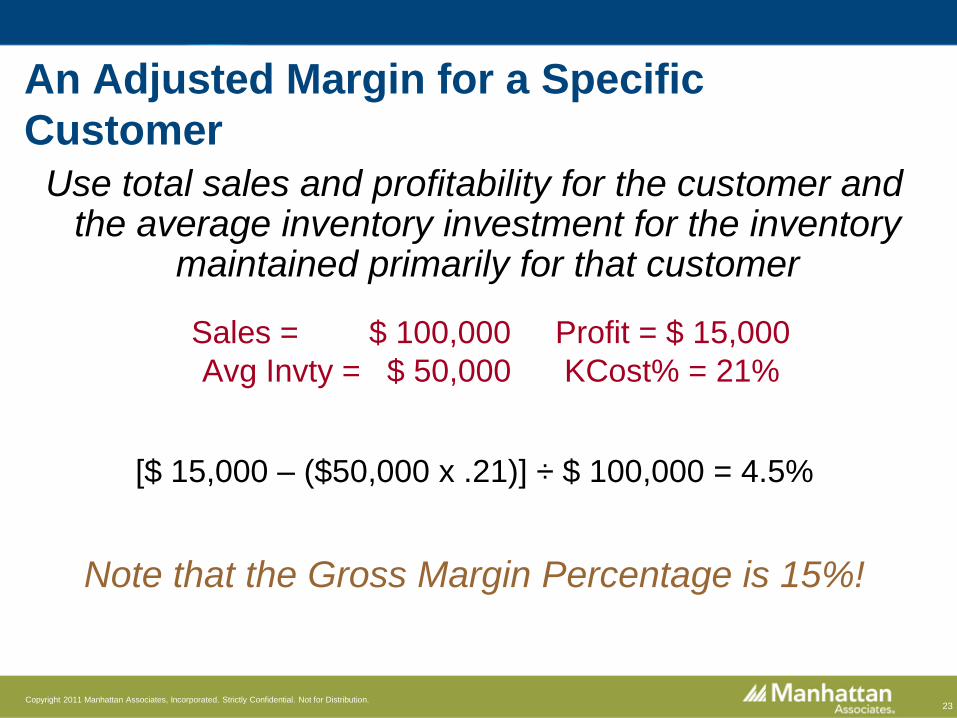
Use total sales and profitability for the customer and the average inventory investment for the inventory
maintained primarily for that customer
Sales = $ 100,000 Profit = $ 15,000
Avg Invty = $ 50,000 KCost% = 21%
[$ 15,000 – ($50,000 x .21)] ÷ $ 100,000 = 4.5%
Note that the Gross Margin Percentage is 15%!
An Adjusted Margin for a Specific
Customer
24Copyright 2011 Manhattan Associates, Incorporated. Strictly Confidential. Not for Distribution.
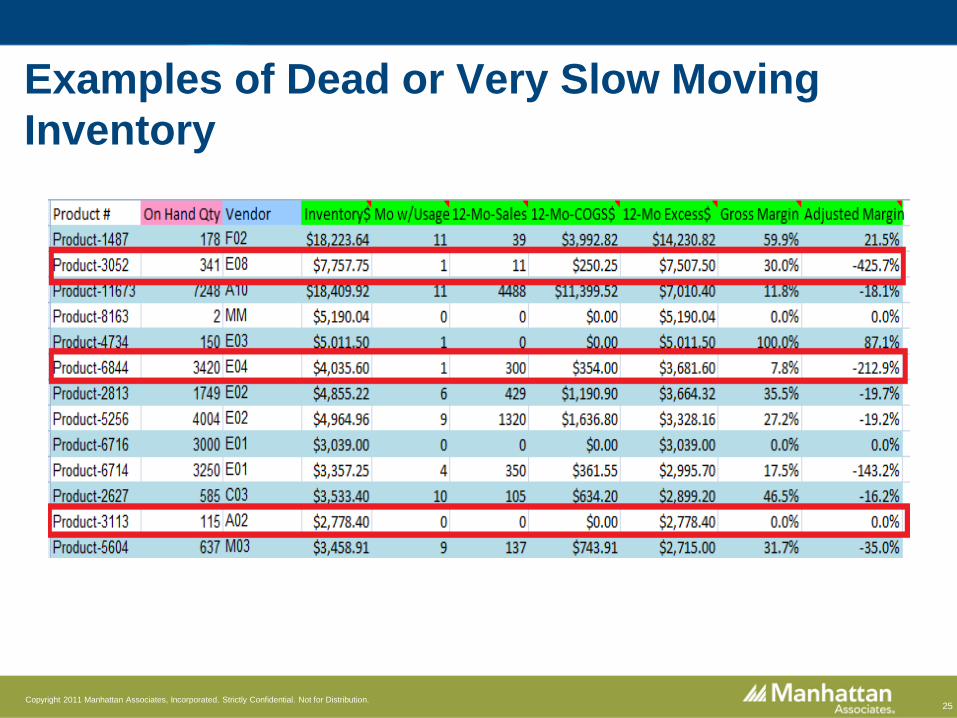
• A report should list items in descending order based on the value of the value eligible to be liquidated.
• Remember that inventory is a sunk expense. It is not worth what you paid for it, it is worth what someone is willing to pay you for it.
• “Don’t get emotional about stock, it clouds your judgment” (Michael Douglas’ character Gordon Gecko in the movie Wall Street)
Liquidating Stuff and Excess Inventory
25Copyright 2011 Manhattan Associates, Incorporated. Strictly Confidential. Not for Distribution.
Examples of Dead or Very Slow Moving
Inventory
26Copyright 2011 Manhattan Associates, Incorporated. Strictly Confidential. Not for Distribution.
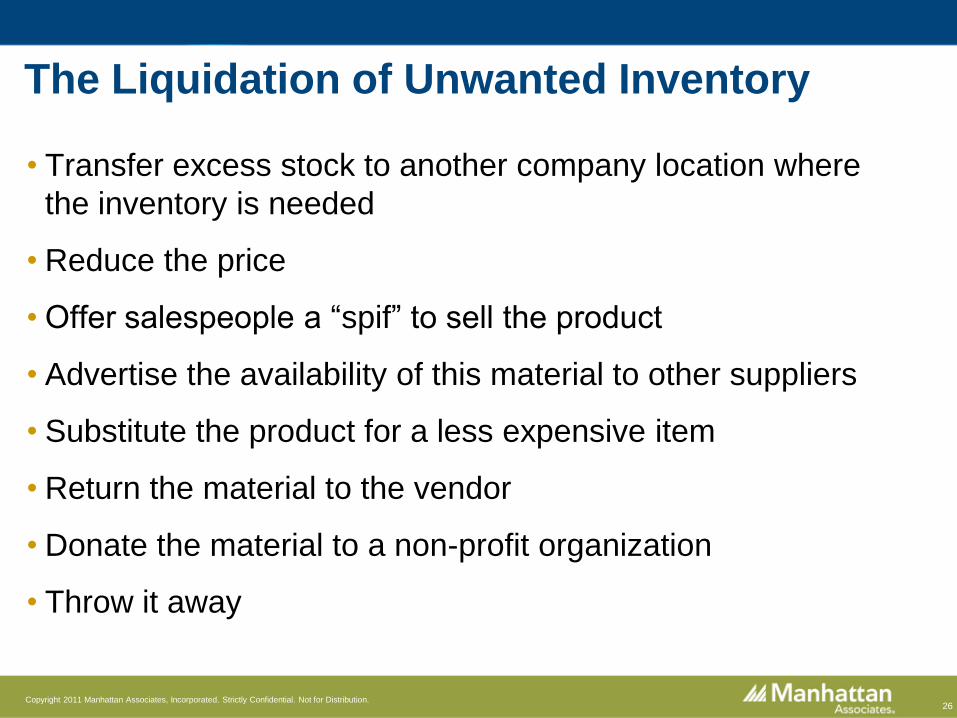
• Transfer excess stock to another company location where
the inventory is needed
• Reduce the price
• Offer salespeople a “spif” to sell the product
• Advertise the availability of this material to other suppliers
• Substitute the product for a less expensive item
• Return the material to the vendor
• Donate the material to a non-profit organization
• Throw it away
The Liquidation of Unwanted Inventory
27Copyright 2011 Manhattan Associates, Incorporated. Strictly Confidential. Not for Distribution.
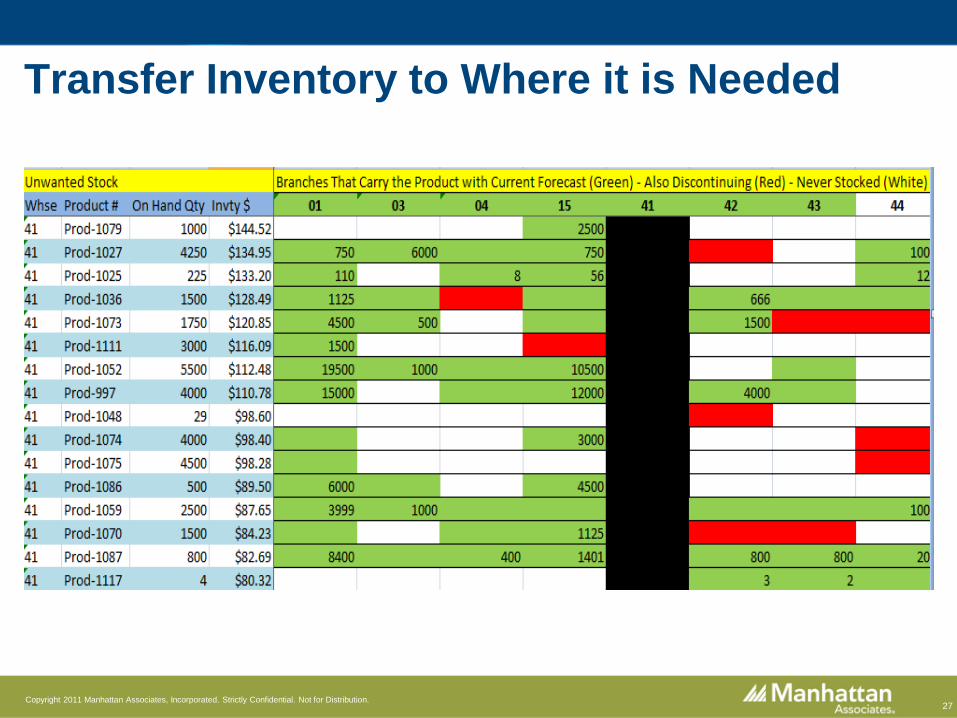
Transfer Inventory to Where it is Needed
28Copyright 2011 Manhattan Associates, Incorporated. Strictly Confidential. Not for Distribution.
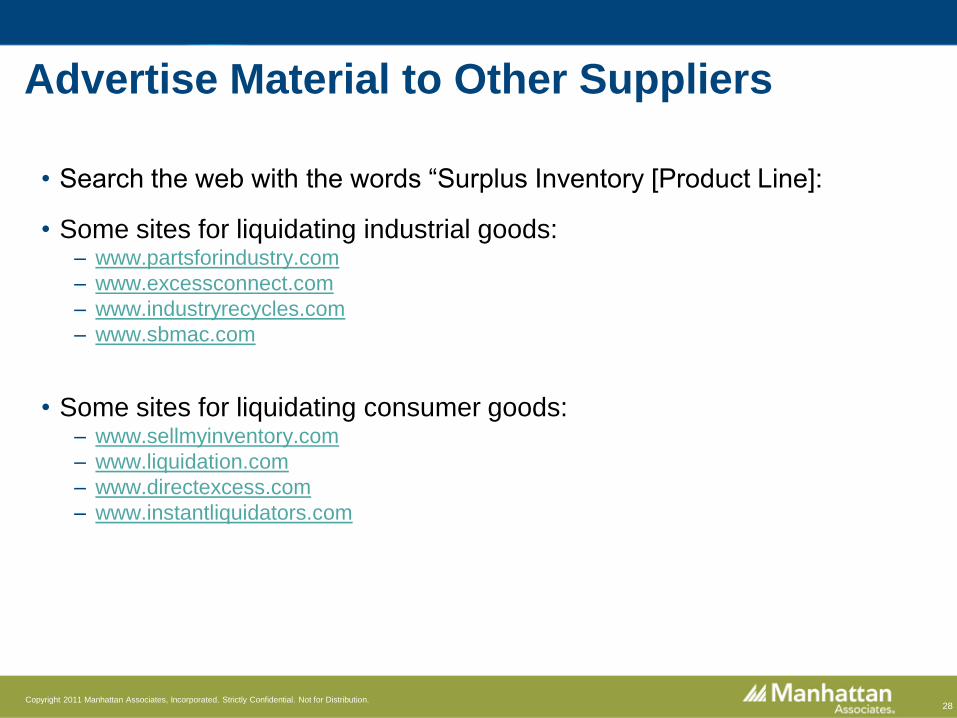
• Search the web with the words “Surplus Inventory [Product Line]:
• Some sites for liquidating industrial goods:– www.partsforindustry.com
– www.excessconnect.com
– www.industryrecycles.com
– www.sbmac.com
• Some sites for liquidating consumer goods:– www.sellmyinventory.com
– www.liquidation.com
– www.directexcess.com
– www.instantliquidators.com
Advertise Material to Other Suppliers
29Copyright 2011 Manhattan Associates, Incorporated. Strictly Confidential. Not for Distribution.
• New stock items should be maintained with manually set
parameters until enough usage history has been
accumulated to accurately forecast demand
• New stock items are usually the source of most dead
inventory. That is, it’s dead on arrival
New Stock Items
30Copyright 2011 Manhattan Associates, Incorporated. Strictly Confidential. Not for Distribution.
Who will buy this product or product line?
What are the estimates of usage for each of the upcoming six months?
What is the anticipated gross margin for sales of this item?
What affect will usage of this product have on usage of other existing stock
items?
How many month’s supply must initially be purchased? What investment is
necessary?
Where will this new inventory be stored?
How can any unsold stock be liquidated?
New Item Questionnaire
31Copyright 2011 Manhattan Associates, Incorporated. Strictly Confidential. Not for Distribution.
• Committee of marketing, sales, management and
purchasing
• How accurate has the source been in the past?
• Three or more members must agree to add the product to
stock inventory in that location
Evaluating New Item Questionnaires
32Copyright 2011 Manhattan Associates, Incorporated. Strictly Confidential. Not for Distribution.
Provide salespeople with a weekly report of the sales of new stock products. For each item:◦ Item and Description
◦ Sales and Gross Margin Projections
◦ Actual Sales and Gross Profits
◦ Current Available Quantity
◦ Value of Available Quantity
◦ Person requesting that the product be stocked
Consider a budget for new inventory items
Keep Sales and Marketing Focused On
New Stock Items
33Copyright 2011 Manhattan Associates, Incorporated. Strictly Confidential. Not for Distribution.
• If a product is needed that is not on the approved stock list:
–Customer must buy the entire quantity that must be ordered
–Customer must pay for the entire quantity that must be ordered
–Salesperson must pay for any stock that the customer doesn’t buy or pay for
–Any remaining inventory is expensed against the transaction
Working with Non-Stock Items
34Copyright 2011 Manhattan Associates, Incorporated. Strictly Confidential. Not for Distribution.
A demand forecast is a prediction
of the quantity of a product that will
be sold, transferred or otherwise
used during a specific time period.
How Much of Each Stocked Item Will
be Used at Each Location?
35Copyright 2011 Manhattan Associates, Incorporated. Strictly Confidential. Not for Distribution.
• Who forecasts?
• What method do you use to forecast?
• What do you consider when you forecast?
• When do you forecast?
• How far out into the future do you forecast?
• Historically how accurate are your forecasts?
How Do You Forecast Future Demand
Now?
36Copyright 2011 Manhattan Associates, Incorporated. Strictly Confidential. Not for Distribution.
• The “if it’s on paper it must be true” syndrome
• Most systems base demand solely on some average of past usage. Often buyers/planners don’t know formula!
• Usually one formula is used to calculate demand for all products
• There is usually no verification to see if the quantity forecast for a certain month was actually sold or shipped in that month
• No system for reliably obtaining future predictions of demand from customers
Common Problems with Demand
Forecasting
37Copyright 2011 Manhattan Associates, Incorporated. Strictly Confidential. Not for Distribution.
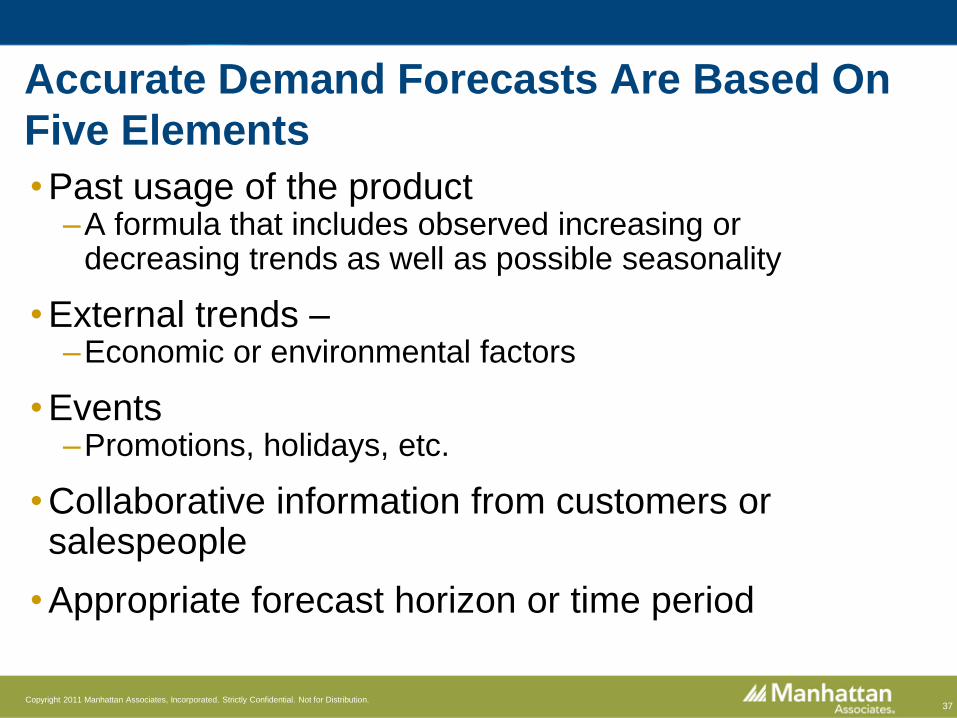
• Past usage of the product–A formula that includes observed increasing or
decreasing trends as well as possible seasonality
• External trends ––Economic or environmental factors
• Events–Promotions, holidays, etc.
• Collaborative information from customers or salespeople
• Appropriate forecast horizon or time period
Accurate Demand Forecasts Are Based On
Five Elements
38Copyright 2011 Manhattan Associates, Incorporated. Strictly Confidential. Not for Distribution.
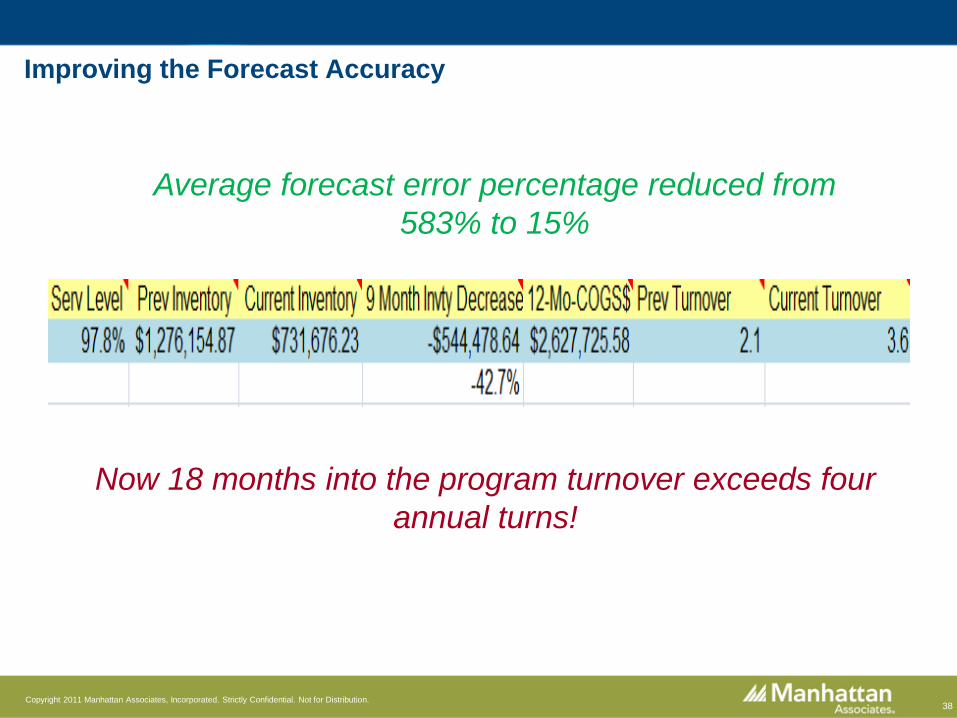
Improving the Forecast Accuracy
Average forecast error percentage reduced from
583% to 15%
Now 18 months into the program turnover exceeds four
annual turns!
39Copyright 2011 Manhattan Associates, Incorporated. Strictly Confidential. Not for Distribution.
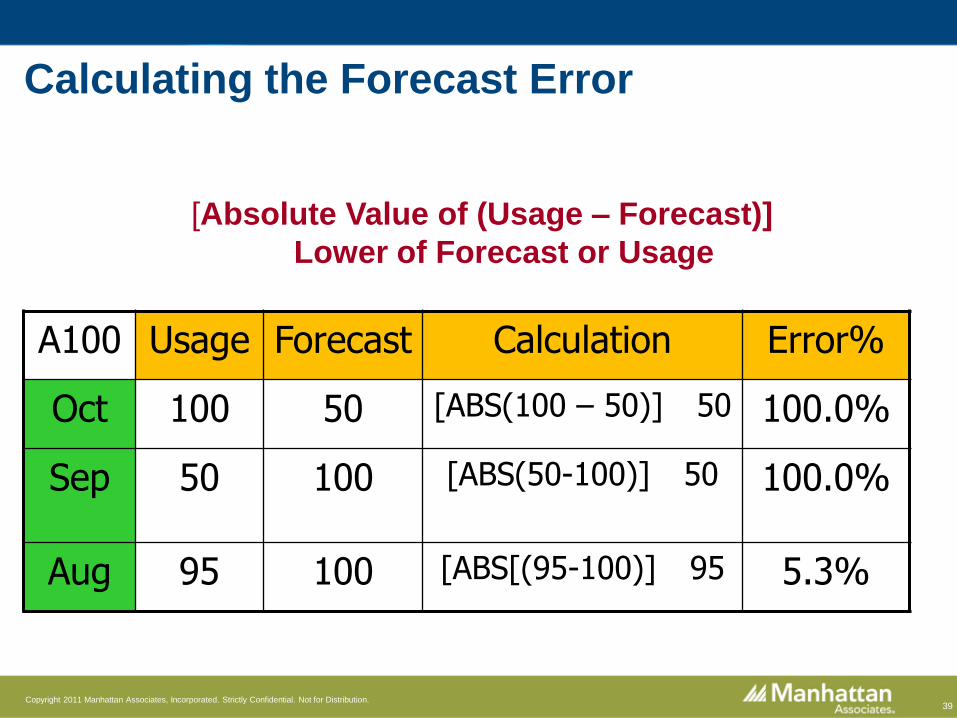
Calculating the Forecast Error
A100 Usage Forecast Calculation Error%
Oct 100 50 [ABS(100 – 50)] 50 100.0%
Sep 50 100 [ABS(50-100)] 50 100.0%
Aug 95 100 [ABS[(95-100)] 95 5.3%
[Absolute Value of (Usage – Forecast)]
Lower of Forecast or Usage
40Copyright 2011 Manhattan Associates, Incorporated. Strictly Confidential. Not for Distribution.
In a study done by EIM of a wide range of distributors using a wide range of computer systems:◦ The mean forecast error was 682%
◦ The median forecast error was 381%
“Best Practice” companies had an error that was approximately 1/10th of the average forecast error in their industry
The better your forecast, the less you need to stock to maintain your desired level of customer service
The “Average” Forecast Error
41Copyright 2011 Manhattan Associates, Incorporated. Strictly Confidential. Not for Distribution.
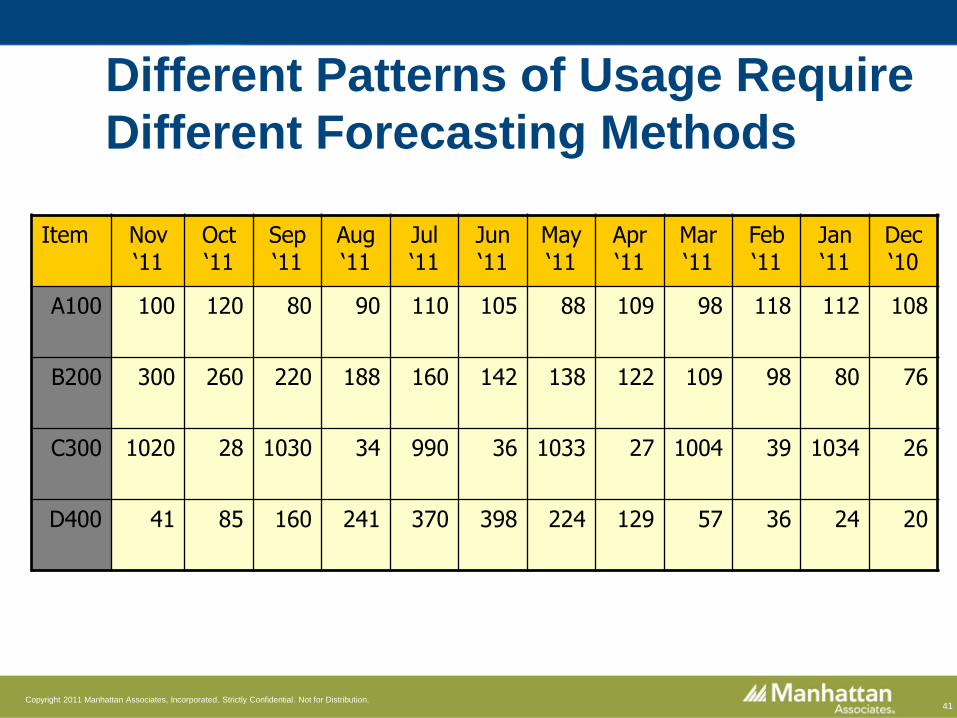
Different Patterns of Usage Require
Different Forecasting Methods
Item Nov ‘11
Oct ‘11
Sep ‘11
Aug ‘11
Jul ‘11
Jun ‘11
May ‘11
Apr ‘11
Mar ‘11
Feb ‘11
Jan ‘11
Dec ‘10
A100 100 120 80 90 110 105 88 109 98 118 112 108
B200 300 260 220 188 160 142 138 122 109 98 80 76
C300 1020 28 1030 34 990 36 1033 27 1004 39 1034 26
D400 41 85 160 241 370 398 224 129 57 36 24 20
42Copyright 2011 Manhattan Associates, Incorporated. Strictly Confidential. Not for Distribution.
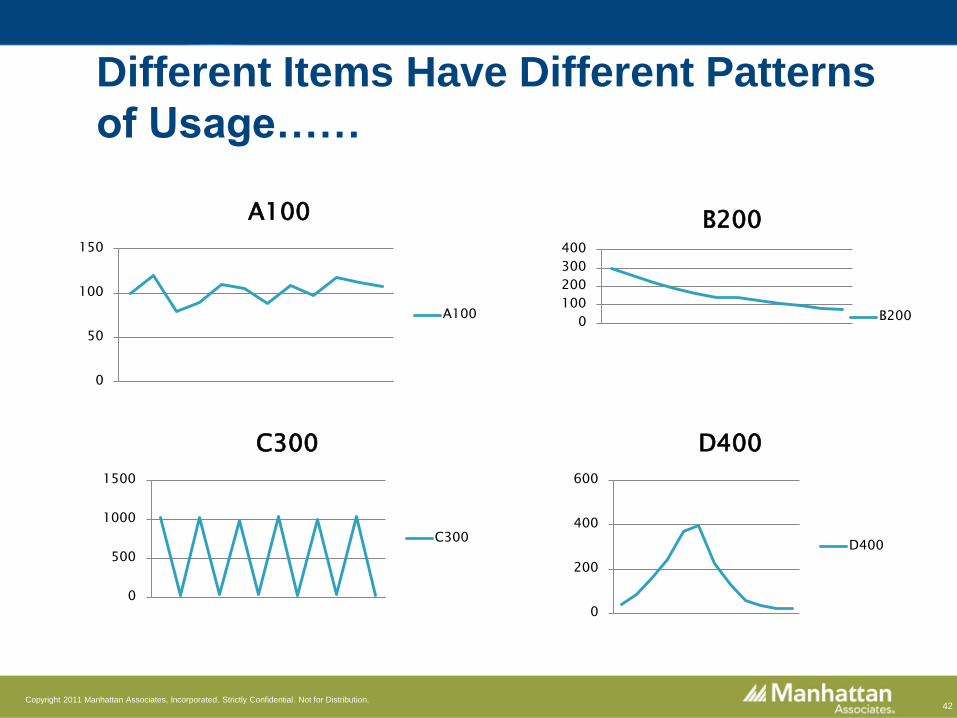
Different Items Have Different Patterns
of Usage……
0
100
200
300
400
B200
B200
0
500
1000
1500
C300
C300
0
200
400
600
D400
D400
0
50
100
150
A100
A100
43Copyright 2011 Manhattan Associates, Incorporated. Strictly Confidential. Not for Distribution.
• Events do not occur at exactly the same time each
year–Some holidays
–Promotions
• External factors are outside of your control but may
affect usage–Changing market tastes
–Economy
–Weather
Events and External Factors will Affect
Usage
44Copyright 2011 Manhattan Associates, Incorporated. Strictly Confidential. Not for Distribution.
1. Hypothesis: I think this event will affect usage
2. Test: Does it affect usage?
3. Record results: When this occurs again, I can adjust the forecast to take into account the results of this event or external factor
4. Clean usage history: Adjust out the effects of the event from usage history. After all, this event will not occur at exactly the same time next year.
Analyze Each Event & External Factor

45Copyright 2011 Manhattan Associates, Incorporated. Strictly Confidential. Not for Distribution.
Measuring the Effect of Events
Event Start Day End Day Prior –Event %
Prior–Post Event%
Centennial Founders’
Day
04/23/2011 04/30/2011 -25.0% 10.0%
Promo-1 06/01/2011 06/07/2011 26.8% -0.8%
Promo-1 09/01/2011 09/07/2011 14.0% -4.7%
Promo-2 10/01/2011 10/07/2011 13.2% -13.0%
46Copyright 2011 Manhattan Associates, Incorporated. Strictly Confidential. Not for Distribution.
120
April 0
2
120
125
April 9
125
119
April 1
6
119
89A
pril 2
3
+30
119
Actual Sales
Adjustment for
Event
Normalized
Usage
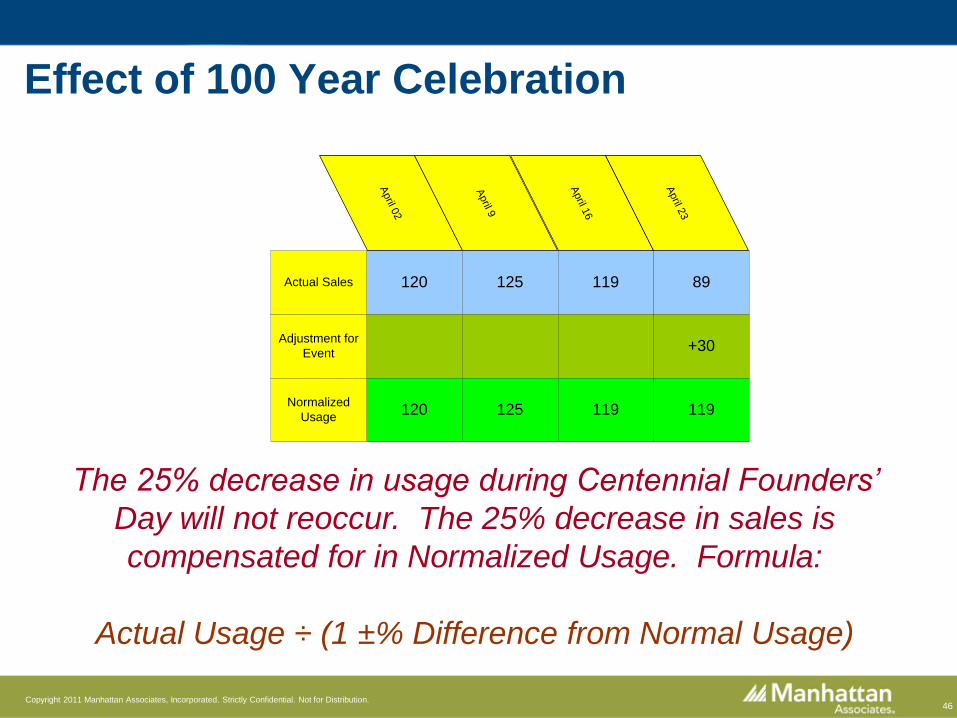
Effect of 100 Year Celebration
The 25% decrease in usage during Centennial Founders’
Day will not reoccur. The 25% decrease in sales is
compensated for in Normalized Usage. Formula:
Actual Usage ÷ (1 ±% Difference from Normal Usage)
47Copyright 2011 Manhattan Associates, Incorporated. Strictly Confidential. Not for Distribution.
488
May 1
1
488
524
May 1
8
524
462
May 2
5
462
595
June 1
-126
469
Actual Sales
Adjustment for
Promotion
Normalized
Usage
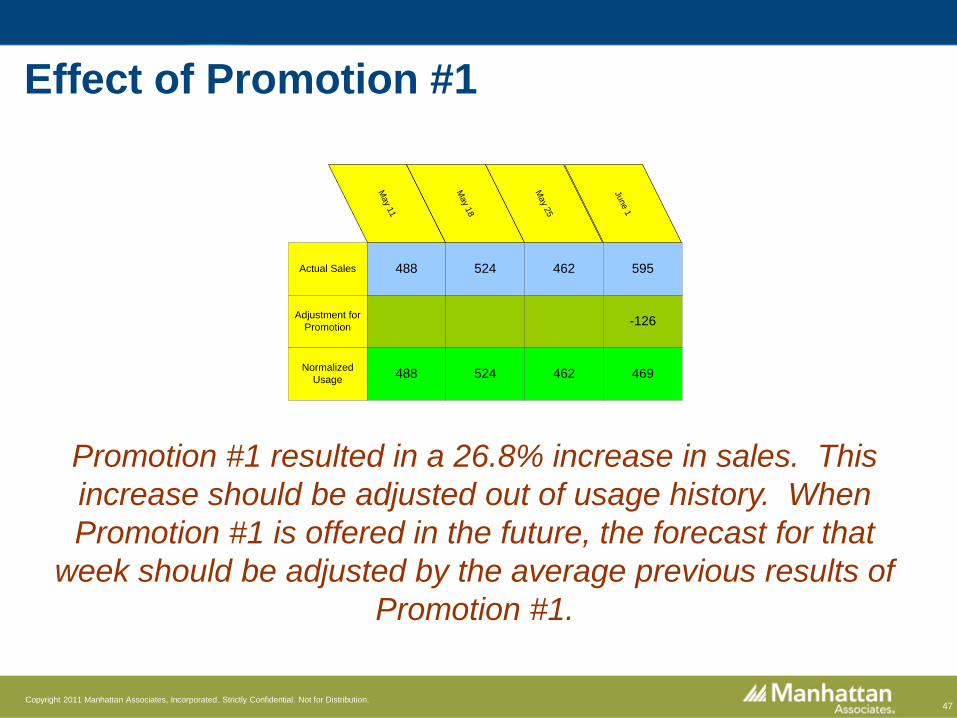
Effect of Promotion #1
Promotion #1 resulted in a 26.8% increase in sales. This
increase should be adjusted out of usage history. When
Promotion #1 is offered in the future, the forecast for that
week should be adjusted by the average previous results of
Promotion #1.
48Copyright 2011 Manhattan Associates, Incorporated. Strictly Confidential. Not for Distribution.
• Even after automatic adjustments to usage have been applied there still may be significant differences between the demand forecast and actual usage
• Salespeople are closest to the customers
• Salespeople can best determine if possible unusual usage is:–Activity that will not reoccur–Start of a new trend
Buyers Should Bring Possible Unusual
Usage to Sales
49Copyright 2011 Manhattan Associates, Incorporated. Strictly Confidential. Not for Distribution.
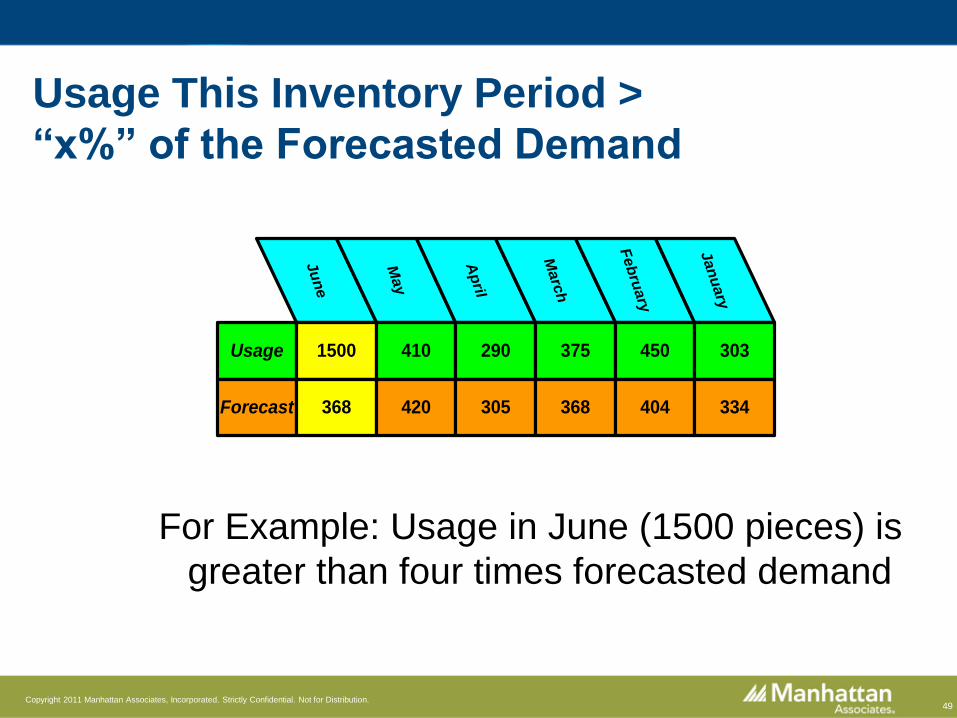
Usage This Inventory Period >
“x%” of the Forecasted Demand
For Example: Usage in June (1500 pieces) is
greater than four times forecasted demand
Ju
ne
May
Ap
ril
Marc
h
Feb
ruary
Jan
uary
Usage 1500 410 290 375 450 303
Forecast 368 420 305 368 404 334
50Copyright 2011 Manhattan Associates, Incorporated. Strictly Confidential. Not for Distribution.
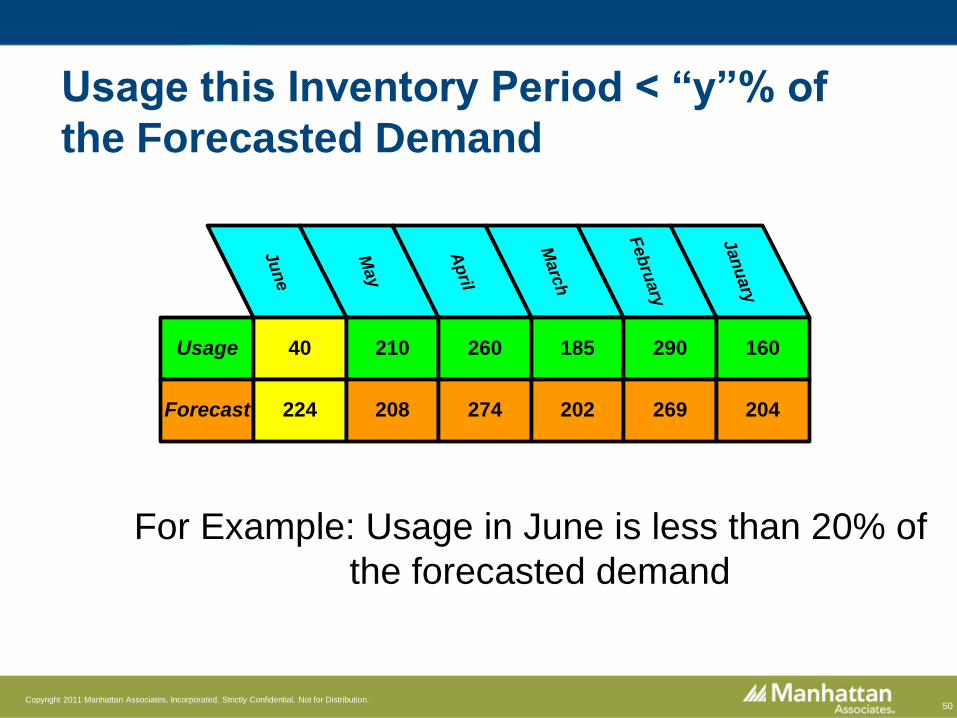
Usage this Inventory Period < “y”% of
the Forecasted Demand
For Example: Usage in June is less than 20% of
the forecasted demand
Ju
ne
May
Ap
ril
Marc
h
Feb
ruary
Jan
uary
Usage 40 210 260 185 290 160
Forecast 224 208 274 202 269 204
51Copyright 2011 Manhattan Associates, Incorporated. Strictly Confidential. Not for Distribution.
• We have noticed that products with an item number starting
with “A” or “1” have better performance than products with
an item number beginning with “Z”
• Examine transactions, talk with salespeople and customers
to determine if any unusual activity occurred
List by Rank of Product by Size of the
Discrepancy
52Copyright 2011 Manhattan Associates, Incorporated. Strictly Confidential. Not for Distribution.
• Quantity sold or used during the month was affected by
activity that won’t reoccur
• A new sales trend has begun
• The wrong forecast formula is being used to predict future
demand of the product
Reasons for Possible Unusual Usage
53Copyright 2011 Manhattan Associates, Incorporated. Strictly Confidential. Not for Distribution.
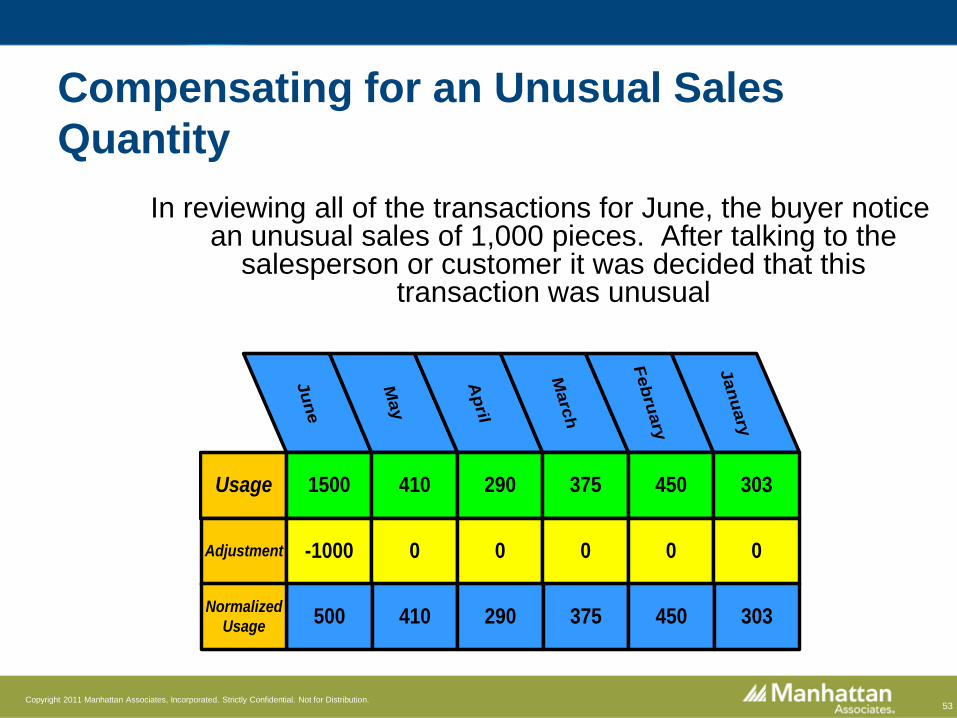
Compensating for an Unusual Sales
Quantity
In reviewing all of the transactions for June, the buyer notice an unusual sales of 1,000 pieces. After talking to the
salesperson or customer it was decided that this transaction was unusual
Ju
ne
May
Ap
ril
Marc
h
Feb
ruary
Jan
uary
Usage 1500 410 290 375 450 303
Adjustment -1000 0 0 0 0 0
500 410 290 375 450 303Normalized
Usage
54Copyright 2011 Manhattan Associates, Incorporated. Strictly Confidential. Not for Distribution.
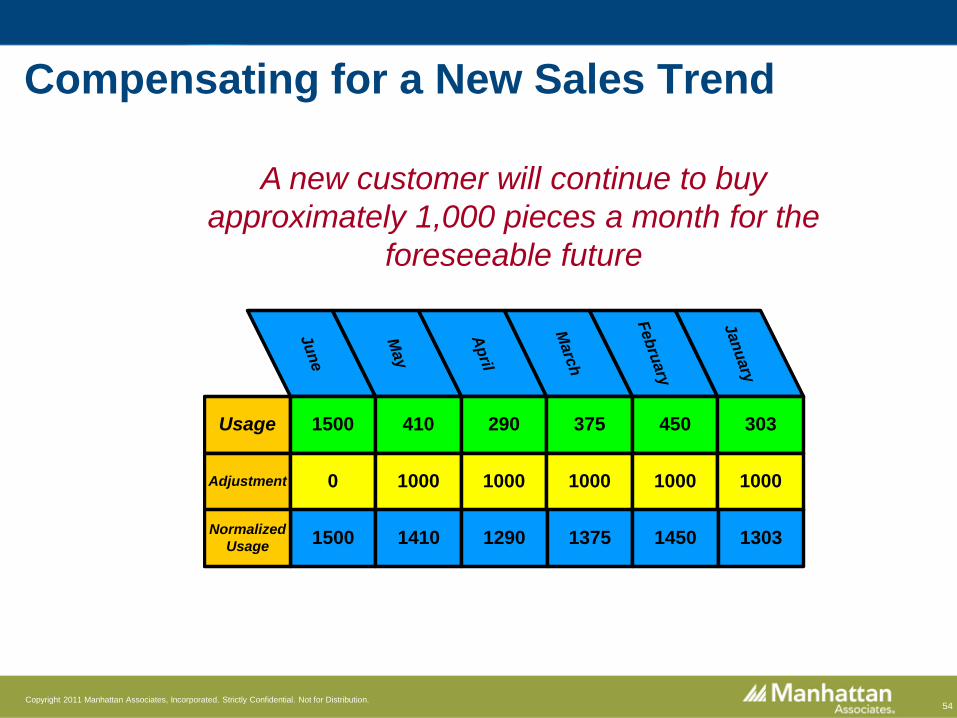
Ju
ne
May
Ap
ril
Marc
h
Feb
ruary
Jan
uary
Usage 1500 410 290 375 450 303
Adjustment 0 1000 1000 1000 1000 1000
1500 1410 1290 1375 1450 1303Normalized
Usage
Compensating for a New Sales Trend
A new customer will continue to buy
approximately 1,000 pieces a month for the
foreseeable future
55Copyright 2011 Manhattan Associates, Incorporated. Strictly Confidential. Not for Distribution.
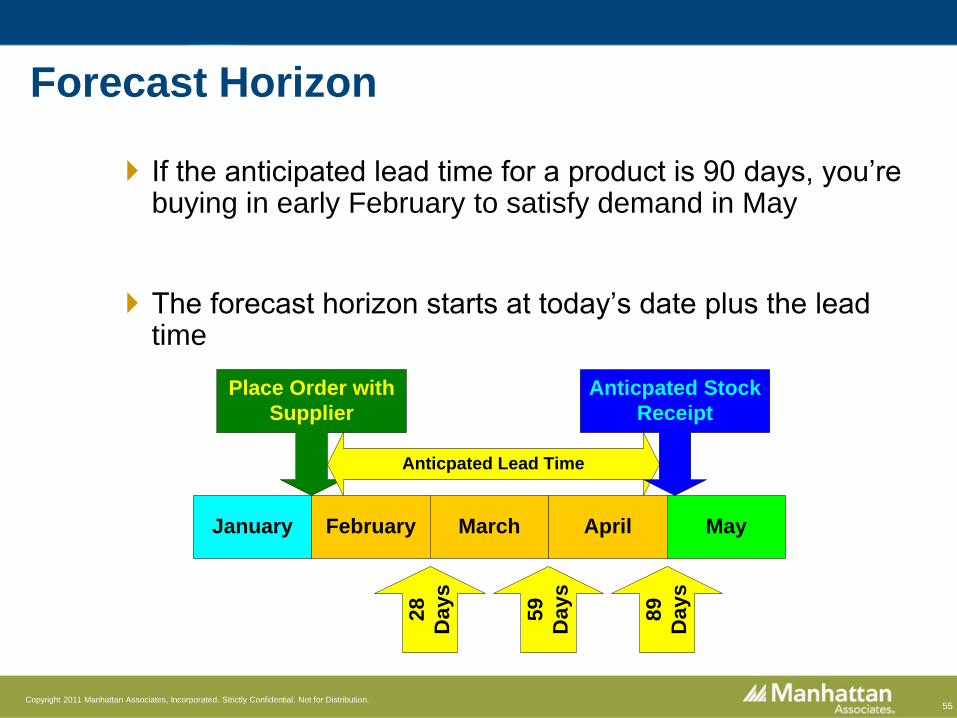
Forecast Horizon
If the anticipated lead time for a product is 90 days, you’re buying in early February to satisfy demand in May
The forecast horizon starts at today’s date plus the lead time
January February March April May
Place Order with
Supplier
Anticpated Lead Time
Anticpated Stock
Receipt2
8
Da
ys
59
Da
ys
89
Da
ys
56Copyright 2011 Manhattan Associates, Incorporated. Strictly Confidential. Not for Distribution.
Maintain Adequate Safety Stock
• Safety stock is reserved inventory maintained to protect
customer service in case of unusual demand or delays in
receiving a stock receipt during the time it takes to replenish
inventory.
• Like any other type of insurance safety stock is an expense,
not an investment
57Copyright 2011 Manhattan Associates, Incorporated. Strictly Confidential. Not for Distribution.
•“Painful Backorder” - items (1/2% - 11/2%) of the
products you stock
• Products with erratic usage
• Products with erratic lead times
• High profit items
• Stock reserved for a specific customer
Items That Require More Safety Stock
58Copyright 2011 Manhattan Associates, Incorporated. Strictly Confidential. Not for Distribution.
• Items with very consistent usage and lead times
• Products with a large number of “hits”
• Low usage items, especially very expensive low usage
items
Items That Require Less Safety Stock
59Copyright 2011 Manhattan Associates, Incorporated. Strictly Confidential. Not for Distribution.
50
100
150Jan
uary
Feb
ruary
Marc
h
Ap
ril May
Ju
ne
Forecasted
Monthly
Demand
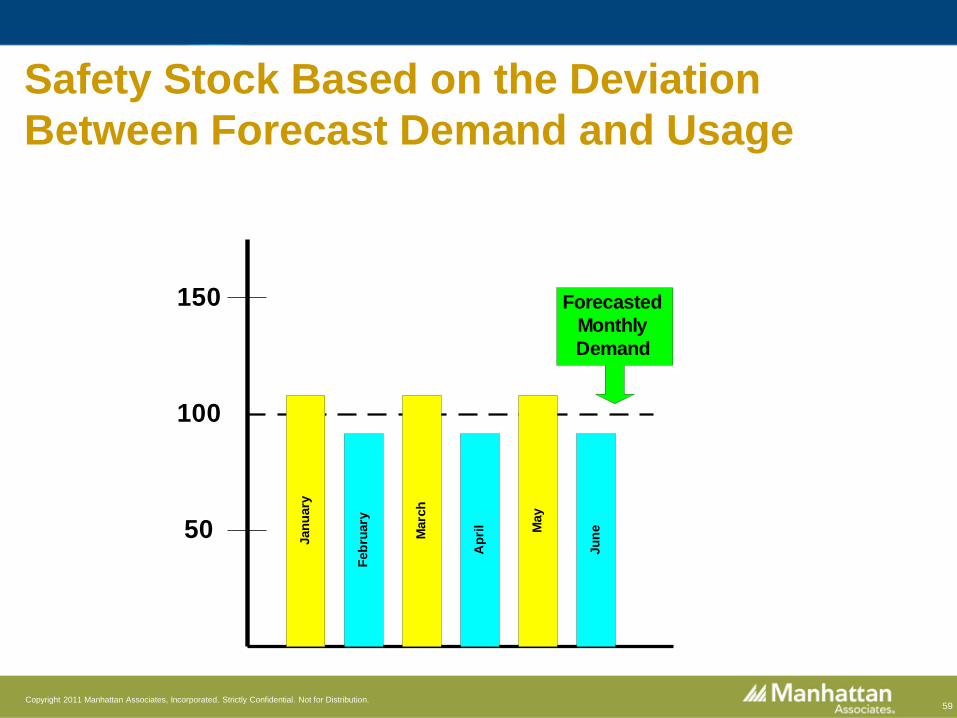
Safety Stock Based on the Deviation
Between Forecast Demand and Usage
60Copyright 2011 Manhattan Associates, Incorporated. Strictly Confidential. Not for Distribution.
50
100
150
Jan
uary
Feb
ruary
Marc
h
Ap
ril
May
Ju
ne
Forecasted
Monthly
Demand
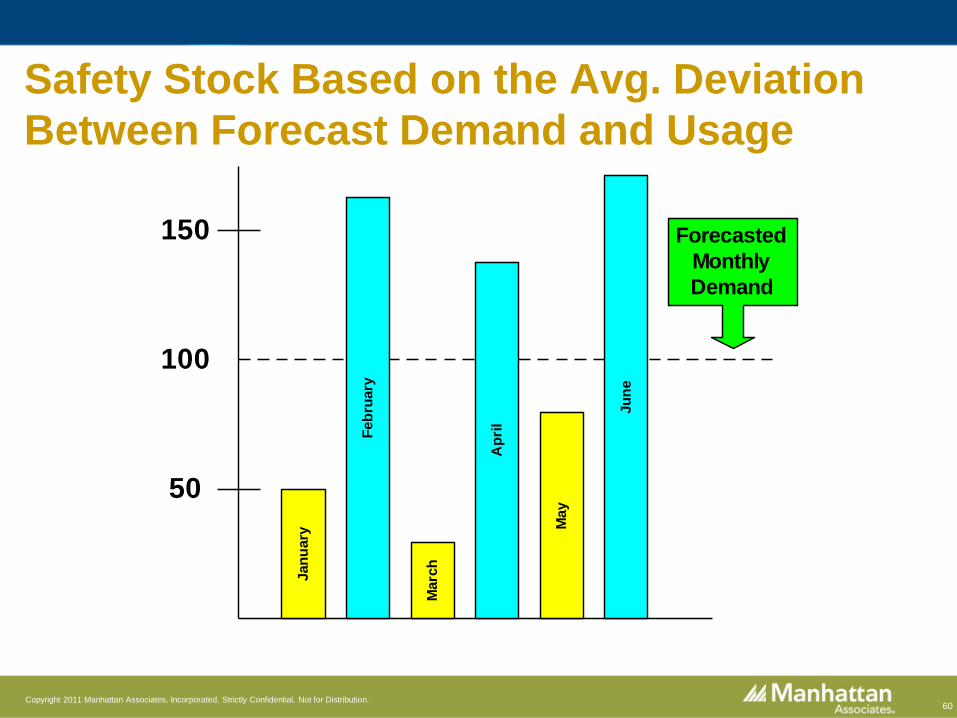
Safety Stock Based on the Avg. Deviation
Between Forecast Demand and Usage
61Copyright 2011 Manhattan Associates, Incorporated. Strictly Confidential. Not for Distribution.
# o
f tim
es E
ach
To
tal
Usa
ge
Qty
wa
s R
eco
rde
d
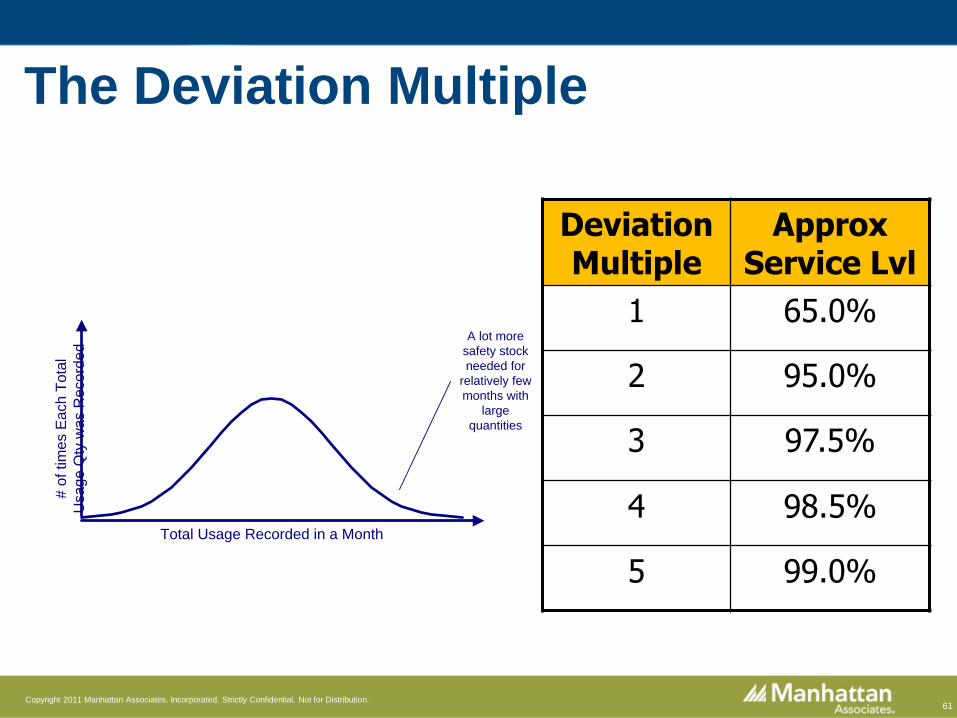
Total Usage Recorded in a Month
A lot more
safety stock
needed for
relatively few
months with
large
quantities
Deviation Multiple
Approx Service Lvl
1 65.0%
2 95.0%
3 97.5%
4 98.5%
5 99.0%
The Deviation Multiple
62Copyright 2011 Manhattan Associates, Incorporated. Strictly Confidential. Not for Distribution.
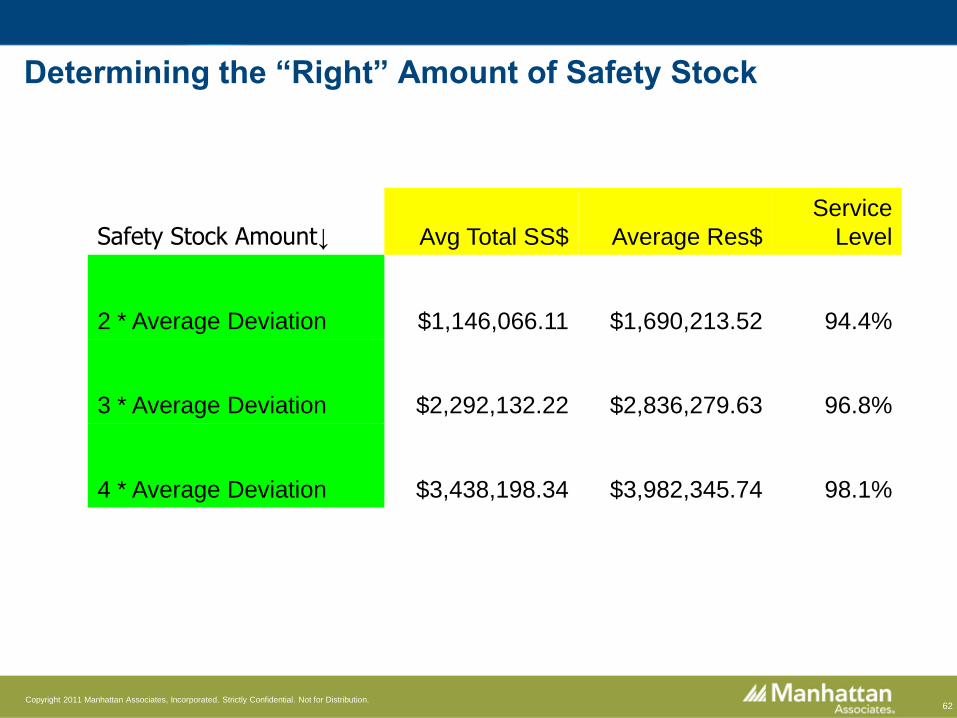
Determining the “Right” Amount of Safety Stock
Safety Stock Amount↓ Avg Total SS$ Average Res$
Service
Level
2 * Average Deviation $1,146,066.11 $1,690,213.52 94.4%
3 * Average Deviation $2,292,132.22 $2,836,279.63 96.8%
4 * Average Deviation $3,438,198.34 $3,982,345.74 98.1%

63Copyright 2011 Manhattan Associates, Incorporated. Strictly Confidential. Not for Distribution.
“Effective Inventory Management
enables a company to meet or exceed
customers’ expectations of product
availability with the amount of each
item that will maximize net profits or
minimize your inventory investment.”
The Goal of Effective Inventory
Management

64Copyright 2011 Manhattan Associates, Incorporated. Strictly Confidential. Not for Distribution.
• Determining what needs to be stocked in each store, branch
or warehouse
• Liquidating unwanted material
• Analyzing and improving the accuracy of your forecasts of
future demand of products
• Maintaining reserve or safety stock quantities that will
ensure your meet or exceed customers expectations of
product availability at the lowest possible cost
First Steps to Achieve Effective Inventory
Management (EIM)
65Copyright 2011 Manhattan Associates, Incorporated. Strictly Confidential. Not for Distribution.
Jon Schreibfeder, President
Effective Inventory Management, Inc.
120 South Denton Tap Road
Suite 450 – 200
Coppell, TX 75019
Phone - 972 304-3325
Fax - 972 393-1310
www.EffectiveInventory.com
If you have questions…..