inventory and monitoring of amphibians and reptiles in the powder
45
INVENTORY AND MONITORING OF AMPHIBIANS AND REPTILES IN THE POWDER RIVER BASIN AREA OF WYOMING FINAL REPORT 2010 Prepared by: Wendy Estes-Zumpf, Zoologist Hannah Griscom, Zoologist Doug Keinath, Senior Zoologist Wyoming Natural Diversity Database University of Wyoming 1000 E. University Ave // Department 3381 Laramie, Wyoming 82071 Prepared for: Bill Ostheimer & the Aquatic Task Group BLM Buffalo Field Office 1425 Fort Street Buffalo, Wyoming 82834 February 2011
Transcript of inventory and monitoring of amphibians and reptiles in the powder

INVENTORY AND MONITORING OF AMPHIBIANS AND
REPTILES IN THE POWDER RIVER BASIN AREA OF WYOMING
FINAL REPORT 2010
Prepared by:
Wendy Estes-Zumpf, Zoologist
Hannah Griscom, Zoologist
Doug Keinath, Senior Zoologist
Wyoming Natural Diversity Database
University of Wyoming
1000 E. University Ave // Department 3381
Laramie, Wyoming 82071
Prepared for:
Bill Ostheimer & the Aquatic Task Group
BLM Buffalo Field Office
1425 Fort Street
Buffalo, Wyoming 82834
February 2011

2
TABLE OF CONTENTS
EXECUTIVE SUMMARY ......................................................................................................................4
INTRODUCTION .................................................................................................................................6
Objectives ...................................................................................................................................6
METHODS .........................................................................................................................................7
Study Area ..................................................................................................................................7
Selection of Monitoring Sites ....................................................................................................8
Survey Protocols ........................................................................................................................8
Monitoring Pathogens .............................................................................................................11
RESULTS & DISCUSSION .................................................................................................................12
Monitoring Sites ......................................................................................................................12
2010 Survey Results .................................................................................................................12
Species Distributions ...............................................................................................................15
BLM Special Area Results .......................................................................................................16
Tiger Salamander Mortality ....................................................................................................17
Chytrid Analyses ......................................................................................................................18
RECOMMENDATIONS .......................................................................................................................18
ACKNOWLEDGEMENTS ....................................................................................................................20
LITERATURE CITED .........................................................................................................................21
TABLES AND FIGURES .....................................................................................................................23
Table 1. Species of amphibians and reptiles expected to occur in the Powder River Basin of Wyoming .......... 23
Table 2. List of acronyms for species names used in tables and figures ............................................................. 24
Table 3. Locations of proposed monitoring sites for long-term monitoring of amphibian and reptile populations
in the Powder River Basin, Wyoming. ................................................................................................................. 24
Table 4. Occupancy estimates for amphibians detected during nocturnal call surveys in 2010. ........................ 25
Table 5. Occupancy estimates for amphibians detected during visual encounter surveys in 2010. .................. 26
Table 6. Occupancy estimates for reptiles detected during visual encounter surveys in 2010 ........................... 26
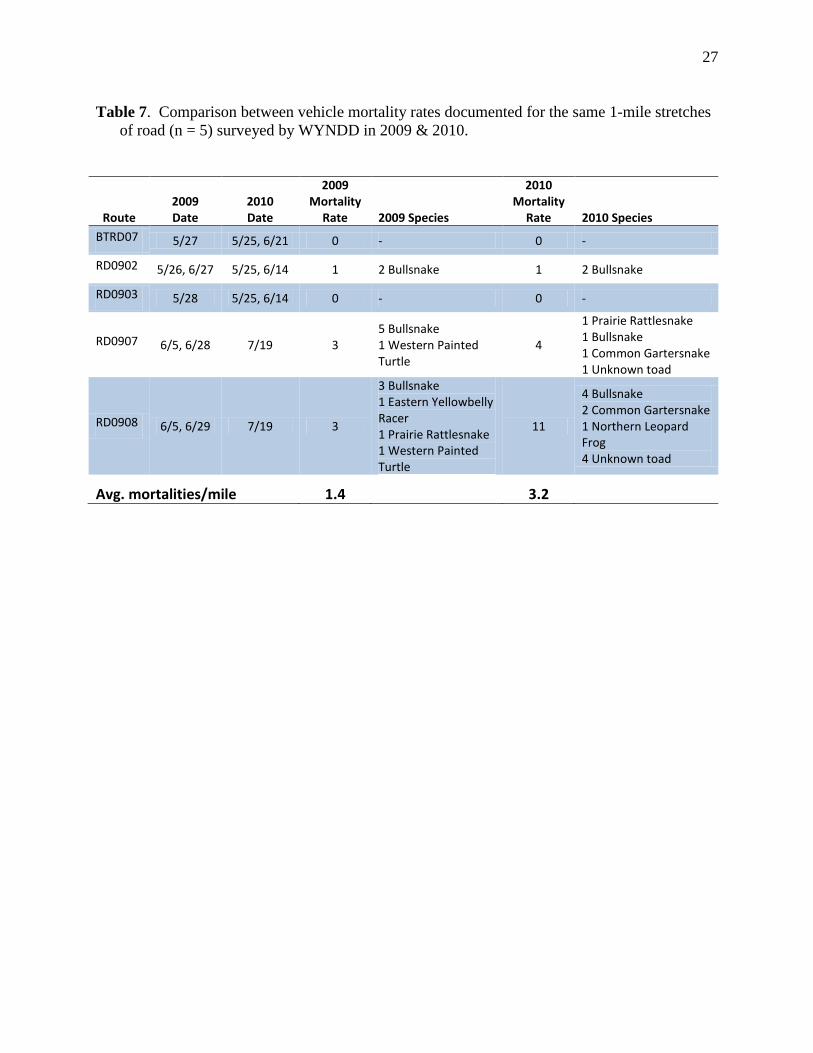
Table 7. Comparison between vehicle mortality rates documented for the same 1-mile stretches of road
surveyed by WYNDD in 2009 & 2010 ................................................................................................................ 27
Table 8. Results of amphibian and reptile surveys in key areas of the Powder River Basin .............................. 28
Figure 1. Map of the Powder River Basin and Welch Management Area where amphibian and reptile surveys
were conducted by WYNDD from 2008 to2010. ................................................................................................. 30

3
Figure 2. Location of proposed monitoring sites for amphibians and reptiles in the Powder River Basin and
surrounding area ................................................................................................................................................... 31
Figure 3. Location of amphibian and reptile surveys conducted in the Powder River Basin in 2010. ............. 32
Figure 4. Relative diversity of species detected at survey locations from 2008 to 2010 during WYNDD field
work in the Powder River Basin ........................................................................................................................... 33
Figure 5. Locations of occurrences for Northern Leopard Frogs and Boreal Chorus Frogs detected 2008-2010
during WYNDD field surveys in the Powder River Basin. .................................................................................. 34
Figure 6. Locations of occurrences for Woodhouse‟s Toads detected 2008-2010 during WYNDD field surveys
in the Powder River Basin. ................................................................................................................................... 35
Figure 7. Locations of occurrences for Tiger Salamanders detected 2008-2010 during WYNDD field surveys
in the Powder River Basin .................................................................................................................................... 36
Figure 8. Locations of occurrences for Plains Spadefoot Toads and Great Plains Toads detected 2008-2010
during WYNDD field surveys in the Powder River Basin ................................................................................... 37
Figure 9. Locations of occurrences for Bullsnakes detected 2008-2010 during WYNDD field surveys in the
Powder River Basin .............................................................................................................................................. 38
Figure 10. Locations of occurrences for Prairie Rattlenakes detected 2008-2010 during WYNDD field surveys
in the Powder River Basin .................................................................................................................................... 39
Figure 11. Locations of occurrences for gartersnakes detected 2008-2010 during WYNDD field surveys in the
Powder River Basin .............................................................................................................................................. 40
Figure 12. Locations of occurrences for less common snakes detected 2008-2010 during WYNDD field
surveys in the Powder River Basin ....................................................................................................................... 41
Figure 13. Locations of occurrences for Northern Sagebrush Lizard and Greater Short-horned Lizards detected
2008-2010 during WYNDD field surveys in the Powder River Basin ................................................................. 42
Figure 14. Locations of occurrences for turtles detected 2008-2010 during WYNDD field surveys in the
Powder River Basin .............................................................................................................................................. 43
Figure 15. Locations of areas identified by the BLM as areas of interest for amphibian and reptile surveys .... 44
Figure 16. Locations of amphibian in the Powder River Basin area that tested positive for chytrid fungus from
2008 to 2010. ........................................................................................................................................................ 45

4
EXECUTIVE SUMMARY
Coal Bed Natural Gas (CBNG) development in the Powder River Basin (PRB), Wyoming,
continues to expand. The effect of CBNG development on local amphibians and reptiles is
largely unknown, but possible impacts could result from changes in water quality, changes in
water flow regimes, and increases in road densities and traffic volume. The Aquatic Task Group
(ATG) is an inter-agency working group focused on studying and mitigating impacts of CBNG
development in northeastern Wyoming and southeastern Montana. The Wyoming Natural
Diversity Database (WYNDD) has been working with the Buffalo Field Office of the BLM, a
member of the ATG, since 2008 to conduct an inventory and develop a monitoring plan for
amphibians and reptiles in the PRB. The goal of this project is to determine the current status of
amphibians and reptiles in the PRB so that future monitoring can detect changes, if any, in
species composition, reproductive success, and occupancy rates due to CBNG development. We
conducted several types of surveys to inventory amphibians and reptiles from 2008-2010 and to
began monitoring efforts in 2010. Survey methods included visual encounter surveys of water
bodies, roadkill/basking surveys, nocturnal call surveys, and visual encounter surveys of rock
outcrops. We also measured water quality and/or habitat characteristics at all sites.
Over the course of the project, we have documented 19 (6 amphibian, 13 reptile) of the 21
species thought to possibly occur in the PRB, with species detection varying by survey method.
The only species not confirmed that might occur in the PRB are the Bullfrog, an invasive species
in Wyoming, and the Northern Prairie Lizard. In 2010, we detected 2 Pale Milksnakes, a species
for which confirmed observations previously were lacking in the PRB. Tiger Salamanders and
Boreal Chorus Frogs were the most common amphibian species detected, but Northern Leopard
Frogs were also estimated to occupy 42% of water bodies. Bullsnake and Prairie Rattlesnakes
were the most common snakes detected on roads and at rock outcroppings. Gartersnakes were
typically found during VES surveys along water bodies. Northern Sagebrush Lizards were
detected throughout the PRB at most rock outcrops surveyed.
We recorded road mortality along set routes at previously identified “roadkill hotspots” as
well as incidental findings of amphibian and reptiles killed by vehicles. Bullsnakes and Prairie
rattlesnakes were most frequently found dead on roads and average roadkill rate was 3.2
mortalities/mile at the 5 “hotspots”. However, 88% of mortalities were documented on 2
stretches of SR338 next to the Welch Management Area.
We continued to collect data on known amphibian pathogens in the PRB. Large numbers of
dead Tiger Salamanders have been observed in the PRB since surveys began in 2008. In 2009,
diagnostic tests confirmed that salamanders sent for testing had died of a ranavirus infection.
Tiger Salamander mortality was documented at 50% of lentic (standing water) sites in 2010,
including the Fortification Creek area and near Ice Cave west of Kaycee. Chytrid fungus was
also detected in amphibians in 2010, however, the infection rate in 2010 (7.7%) was much less
than in 2009 (23%). The decreased infection rate could indicate a decrease in the prevalence of
the fungus in the PRB or could result from annual variation in site selection or local weather
patterns. Continued monitoring of chytrid infection rates is necessary to assess the nature of the
observed trend.
In addition to monitoring efforts, we also conducted inventories for amphibians and reptiles
at 10 areas of special interest to the BLM. Of these, the Fortification Creek area and the Welch

5
Management area contained the most species detected. We identified 8 species at Fortification
Creek in 2010 and 11 species in the Welch Management Area across 2009 and 2010 field
seasons.
At the conclusion of the report, we provide locations of potential long-term monitoring sites.
We recommend that the BLM and ATG to review sites to make sure they meet the needs of the
group. We also recommend survey protocols for the different types of surveys proposed for
long-term monitoring, including recommended modifications to improve the ability to assess
trends in populations and reproductive success using occupancy modeling.

6
INTRODUCTION
The Powder River Basin (PRB) in northeastern Wyoming is a surprisingly complex
landscape marked by plains and large forested escarpments in the north and highly eroded ridges
and breaks along the river to the south. The PRB encompasses sagebrush and grassland
dominated vegetation types and is part of the Great Plains. The complex topography and
sedimentary soils support a diverse array of plant and animal species. The PRB also is an
important area for the extraction of coal bed natural gas (CBNG). Currently, over 18,000
CBNG wells exist in the PRB and numerous additional leases are pending. CBNG development
entails establishment of new roads, construction of wells and other infrastructure related to the
extraction of CBNG, and the release of groundwater extracted from coal seams into surface
streams, rivers, or holding ponds. In 2003, the Buffalo Field Office (BFO) of the Bureau of Land
Management (BLM) prepared an Environmental Impact Statement (EIS) for CBNG development
in Wyoming and Montana which outlines potential impacts to hydrology, wildlife, and other
natural resources in the Powder River Basin (BFO BLM 2003). The EIS identified 2 primary
areas of concern with respect to amphibians and reptiles; (1) changes in water quality and timing
due to release of CBNG product waters into surface waters, and (2) road mortalities from
increased vehicular traffic.
The Aquatic Task Group (ATG) was formed in response to the lack of knowledge regarding
how CBNG could impact local natural resources. The ATG is an inter-agency and inter-state
working group focused on studying and mitigating impacts of energy development on aquatic
ecosystems in northeastern Wyoming and southeastern Montana. In 2008, the Wyoming Natural
Diversity Database (WYNDD) began a 3-year study of amphibians and reptiles in the PRB under
the guidance of the ATG. The purpose of the study was to conduct an inventory of reptiles and
amphibians in the PRB and design a monitoring program to track population trends as CBNG
development continues to increase in the region. The majority of funding for this work was
provided by the Buffalo Field Office of the BLM with some matching funds from WYNDD.
In 2008 and 2009, WYNDD conducted inventories for reptiles and amphibians across the
PRB to determine the presence and relative abundance of species in the region. In 2010, our
objectives focused on establishing a feasible monitoring plan with standardized survey protocols
and collecting the first year of data under this plan. Because new long-term riparian monitoring
reaches along the Powder River were in the process of being established, WYNDD was
instructed to exclude riparian monitoring until sites were agreed upon. Thus, monitoring in 2010
focused on upland and lentic (pond) sites, with additional inventories in areas of particular
interest to the Buffalo Field Office of the BLM.
Objectives
This project had 4 overall objectives:
1. Complete a literature review of impacts to amphibians and reptiles from vehicular traffic
and changes in water quality.
2. Determine the general distribution and characterize the status and habitat of all
amphibians and reptiles occurring in the PRB below 1,370 m.
7
To do this, locations of all herptofauna observations will be combined with data from
the WGFD (Turner, 2007) and WYNDD‟s database to produce a distribution map for
each species. Overall site occupancy measures and current literature will be used to
categorize species into general groups such as „common in PRB‟, „moderately abundant
in PRB‟, and „rare in PRB‟. Qualitative descriptions of habitat by species will be
produced by combining standardized variables collected at survey sites (including water
quality) and those presented in the literature.
3. Identify potential current and long-term impacts of CBNG activities on amphibians and
reptiles and suggest possible mitigation measures. This will be achieved by measuring
road mortality rates and water quality tolerance levels.
Note: The impact of CBNG activities on amphibians and reptiles can only be
roughly estimated within the framework of this project.
4. Establish a long-term, repeatable monitoring protocol that can be used to track population
trends and impacts from CBNG activities in the future.
The literature review (Objective 1) was completed in 2008, and surveys to determine the
distribution and habitat use of amphibians and reptiles in the PRB were conducted in 2008 and
2009 (Objective 2 & 3; Estes-Zumpf et al. 2010). Draft distribution maps for each species were
provided in the Year 2 progress report (Estes-Zumpf et al. 2010) and final distribution maps are
available free of charge upon request from WYNDD
(https://survey.uwyo.edu/TakeSurvey.aspx?SurveyID=l20Klp4K). This report details the first
year of formal monitoring efforts (site choice, protocols, etc.) as well as additional inventories at
key sites identified by the BLM.
METHODS
Study Area
The Powder River watershed is located in northeastern Wyoming (Figure 1) and has an area
of approximately 25,000 km2. The main stem of the river flows north into Montana where it
joins the Yellowstone River. Within Wyoming, tributary streams that originate in the Bighorn
Mountains to the west generally have perennial flow fed by snowmelt, whereas ephemeral
tributaries originating in the plains to the south and east are characterized by short duration flows
from rainstorms (Davis et al., 2006). The majority of CBNG development in the PRB is below
1,370 m elevation and, thus, defines the study area for this project. Topography is complex and
includes floodplains, escarpments, upland plains, and highly eroded breaks. The climate is semi-
arid and land cover is dominated by two ecological systems; Inter-mountain Basins Big
Sagebrush Steppe and Northwestern Great Plains Mixed-grass Prairie. Riparian vegetation along
rivers and streams is usually composed of willows and tall grasses with cottonwood forests
restricted to the larger rivers, but there are very few natural lentic (standing water) wetlands in
the Basin. Twenty-one species of reptiles and amphibians potentially occur in the Powder River
Basin of Wyoming (Table 1). Most of these species belong to the suite of Great Plains species

8
whose far western range occurs in northeastern Wyoming. See Table 2 for a list of acronyms for
species names used in this document.
Over 50% of land ownership in the PRB is private, limiting efforts to establish long-term
monitoring sites on accessible public lands. Livestock grazing dominates land use with irrigated
agriculture restricted to areas immediately adjacent to perennial rivers (Davis et al. 2006).
CBNG production has increased greatly on both public and private lands in the last 10 years,
especially in the eastern half of the PRB where natural gas is most easily recoverable. Gas field
development often entails building and maintaining extensive road networks to serve well pads,
pipelines, and compression stations. Deep aquifer water is pumped to the surface and discharged
into ephemeral drainages or reservoirs in order to release natural gas trapped in coal seams. The
aquifer water is usually colder than surface water and often has higher concentrations of sodium
bicarbonate and other salts (Davis et al. 2006). For more background information about the
potential impacts of water quality and road network changes on amphibians and reptiles, see
Griscom et al. (2009; Appendix A).
Selection of Monitoring Sites
Selection of monitoring sites was guided by the following criteria.
1. Sites should be on accessible public lands to ensure access for future surveys.
2. Sites should be located in or near habitat for sensitive reptile and amphibian species
(water bodies and/or rock outcrops).
3. Sites should be selected in areas of high and low potential CBNG impact.
4. Sites are known to contain one or more sensitive amphibian and/or reptile species.
It is important to note that much of the PRB is private land and was excluded in most cases
from our monitoring plan. Limitations due to access issues and presence of habitat (especially
water) further restricted site selection. As a result, sites selected for long-term monitoring were
strategically chosen rather than randomly selected and much of the PRB was not sampled.
Therefore, inferences about changes in amphibian and reptile populations from this monitoring
plan are limited to changes observed at monitoring sites and should not be extrapolated to the
entire PRB.
Surveys Protocols
Nocturnal Call Surveys
Nocturnal call surveys can be an efficient and effective way to survey for anurans (frogs and
toads), especially in areas where to habitat is restricted. Males of all anuran species in the PRB
vocalize under suitable weather conditions to attract females to breeding sites. Calls can be used
to identify individuals to species and, depending on environmental conditions, can be heard up to
an estimated 2 km away. Road-based nocturnal call surveys are an effective way of detecting
species presence across relatively large distances without requiring physical access to adjacent
land.

9
Nocturnal call surveys involved a two person crew starting at a fixed location on a public
road and driving a predefined distance to each subsequent listening point. Results from
nocturnal call surveys conducted in the PRB in 2006 by the Wyoming Game and Fish
Department (WGFD; Turner 2007) and by WYNDD in 2008 and 2009 reveal that shorter
distance between listening points tends to increase detection of anurans with softer calls that
don‟t carry well over larger distances (e.g., Northern Leopard Frogs (Lithobates pipiens)). The
number of species detected along routes with listening points at every 0.1 miles was greater than
the number of species detected when listening points were separated by 0.5 miles. Based on
these findings, in 2010 we chose to maximize both distance covered and species detections by
conducting nocturnal call surveys for anurans every 0.2 miles along chosen 2-mile stretches of
roads.
All surveys were conducted after dark and detailed weather information was collected at the
beginning and end of the survey (wind speed, barometric pressure, relative humidity, cloud
cover, and air temperature). At each listening point, surveyors got out of the vehicle and listened
for 3 minutes, recording the coordinates, species, calling intensity, direction and distance to
caller(s), and ambient noise. Most calling routes were surveyed twice between late May and
early July to increase the likelihood of detecting pulse breeders such as Plains Spadefoot Toads
(Spea bombifrons). Because weather patterns influence the annual onset and conclusion of
amphibian breeding seasons, we excluded from analyses all surveys conducted after the last
survey during which amphibians were heard calling. This is based on the assumption that
breeding season concluded shortly after that date and all surveys after the conclusion of breeding
had a zero probability of detecting calling anurans.
Results from nocturnal call surveys were used to estimate occupancy rates for each species
based on this survey method. Occupancy rates can be used to monitor changes across time.
Naïve occupancy rates are simply the number of sites occupied by a species divided by the
number of sites surveyed. Because our ability to detect an amphibian species is rarely perfect,
non-detection could mean that the species was not present, or the species was present but we
failed to detect it. Occupancy modeling helps to correct for imperfect detection by using repeat
surveys during a season to estimate the probability of detecting a species (MacKenzie et al.
2006). Occupancy rates for each species are then corrected for this bias in detection. We used
program PRESENCE (Hines 2006) to estimate occupancy rates at nocturnal call survey sites.
We tested if day of year, moon phase, time since last rain, barometric pressure, or air temperature
influenced calling behavior and, thus, our ability to detect species. We determined the best
model(s) given our set of candidate models using Akaike‟s Information Criteria (AIC; Burnham
and Anderson 2002). In the event that a species was not detected enough times to allow for
estimation of detection probabilities, we present naïve (uncorrected) occupancy rates.
Water Body and Riparian Surveys
Visual encounter surveys (VES) allow surveyors to visually detect species and their life
stages present at a site. We conducted VES surveys along the banks of standing (lentic) and
some flowing (lotic) water in the PRB. This survey method primarily targets amphibians, though
reptiles are often found. Surveys followed protocols described in the ATG Monitoring Plan for
Amphibians and Reptiles. In previous years, two observers worked together to conduct surveys
at each site. In 2010, we modified protocols to facilitate estimating detection probabilities using

10
the dual observer method. Under this method each observer surveys the site independently and
does not discuss results with the other observer. This method provides 2 independent repeat
surveys for each visit to the site. At lentic sites, observers waited 15 minutes between surveys to
allow animals time to settle between surveys. At lotic sites (typically narrow stream channels),
observers surveyed different banks. Although this method is not as ideal as multiple return visits
to a site, it is an accepted technique to obtain multiple independent surveys at sites across large
landscapes or with limited access.
Surveyors searched at a consistent rate around the edge of lentic water bodies or along
riparian reaches on either side of stream channels. At each site, surveyors collected extensive
data on habitat, water chemistry (pH, temperature, conductivity, TDS), species observed, and life
stage. Surveys were timed to record search effort, and timers were stopped while animals were
being processed. Dead amphibians were collected, labeled, and preserved in 95% ethanol for
later analysis. Frogs and toads were caught by hand or dip net, when possible, and swabbed for
chytrid fungus (Batrachochytrium dendrobatidis; see below).
Results from lotic and lentic water body surveys were used to estimate occupancy rates for
each species. We used program PRESENCE (Hines 2006) to estimate occupancy rates after first
correcting for bias due to imperfect detection rates. We tested if day of year and amount of
cloud cover significantly influenced species detectability and if the type of site (lotic or lentic)
influenced occupancy by a species. We determined the best model(s) given our set of candidate
models using AIC. As with nocturnal call surveys, in the event that a species was not detected
enough times to allow for estimation of detection probabilities, we present naïve (uncorrected)
occupancy rates.
Rock Outcrop Surveys
Rocky outcrops are important landscape features for many reptiles because they provide
protection from predators, basking surfaces, and shade from the midday sun, and are often used
as hibernacula by multiple species of snakes. Therefore, we conducted visual encounter surveys
for reptiles along south-facing rock outcrops. Rock outcrops typically occur in more upland
areas and often are not associated with aquatic habitat. Thus, these surveys were used to
inventory reptiles and search for snake hibernacula in the PRB but will likely not be part of a
long-term monitoring program unless specifically requested by the ATG or the BLM.
Rock outcrops were indentified with aerial photographs and field reconnaissance. Surveys
were conducted primarily during morning hours or evening hours, when reptiles are most likely
to be active. Surveys involved searching under and around rocks and organic debris. We
photographed species encountered and described the general habitat in which the species was
found. We recorded search effort by timing all surveys, stopping the timer during data recording
and identification of species. We also recorded all non-reptile species observed during rock-
outcrop surveys.
Roadkill and Basking Surveys
Roads serve as basking surfaces for reptiles and amphibians. Because animals basking on or
crossing roads are often killed by vehicles, surveys along roads are commonly used to inventory
local reptiles and amphibians (Heyer et al. 1994). Roadkill „hotspots‟, where multiple
11
individuals are found in a short distance, can signify proximity to hibernacula or migration
corridors and the location of hotspots can be used to guide management plans. Encounter rates
or mortality rates along fixed stretches of road can also be calculated and compared across
seasons or years. In 2008 and 2009 we used roadkill/basking surveys primarily to inventory
species present in the PRB; thus we targeted different types of roads (paved, gravel, dirt, etc.)
near or adjacent to rock outcrops or water bodies. We incorporated roadkill hotspots identified
in 2008 and 2009, along with stretches of the Powder River Road that occur near reptile and
amphibian habitat into our monitoring plan in 2010. The Powder River Road is the major north-
south access road in the region and is heavily used by residents and CBNG industry workers.
We conducted roadkill/basking surveys along 1-mile fixed stretches of roads. Technicians
walked on opposite sides of the road searching for dead or basking reptiles and amphibians.
Animals found were photographed and their location was recorded. In addition to fixed roadkill
surveys, technicians also recorded all incidental sightings of dead or basking reptiles and
amphibians found while driving between survey sites.
Monitoring Pathogens
Chytrid Analyses
Chytrid fungus (Batrachochytrium dendrobatidis) has been implicated in amphibian declines
around the world, especially in concert with other environmental stressors, and infected animals
have been documented in several amphibian species in the PRB (Turner 2007, Griscom et al.
2009, Estes-Zumpf et al. 2010). Because chyrid fungus occurs in the PRB and the ATG is
concerned about potential environmental stressor associated with CBNG (changes in water
temperature, increased levels of sodium bicarbonate, etc.), any amphibian monitoring program in
the region should include monitoring of chytrid prevalence in local amphibian populations.
To identify whether amphibians were infected with chytrid fungus, we collected epithelial
tissue samples from a subset of all amphibians found at each site during surveys. Sample
collection followed established procedures (Livo 2003). Amphibians were systematically
swabbed with sterile cotton swabs to collect epidermal DNA. Swabs were immediately stored in
sterile microcentrifuge tubes containing 95% ethanol and labeled with unique specimen numbers.
We stored samples in a -20°F freezer until shipping. Samples were sent to Dr. John Wood at
Pisces Molecular LLC in Boulder, Colorado, for analysis via PCR test to determine if the fungus
was present.
Ranavirus
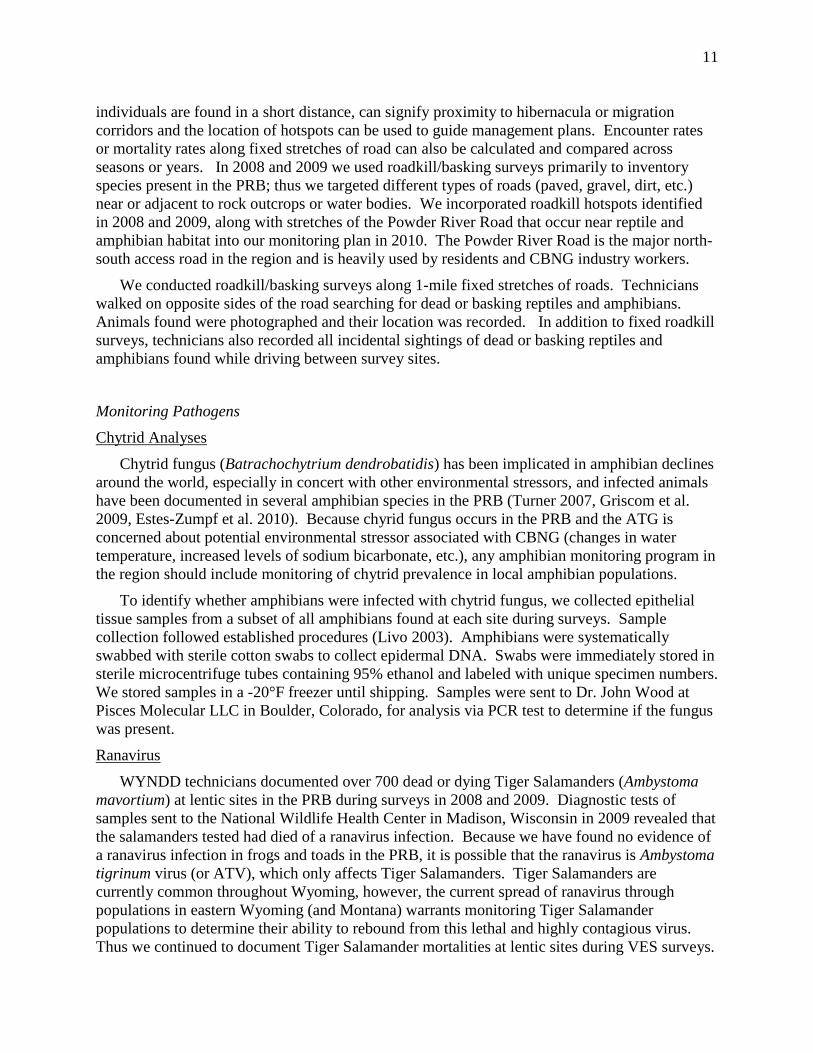
WYNDD technicians documented over 700 dead or dying Tiger Salamanders (Ambystoma
mavortium) at lentic sites in the PRB during surveys in 2008 and 2009. Diagnostic tests of
samples sent to the National Wildlife Health Center in Madison, Wisconsin in 2009 revealed that
the salamanders tested had died of a ranavirus infection. Because we have found no evidence of
a ranavirus infection in frogs and toads in the PRB, it is possible that the ranavirus is Ambystoma
tigrinum virus (or ATV), which only affects Tiger Salamanders. Tiger Salamanders are
currently common throughout Wyoming, however, the current spread of ranavirus through
populations in eastern Wyoming (and Montana) warrants monitoring Tiger Salamander
populations to determine their ability to rebound from this lethal and highly contagious virus.
Thus we continued to document Tiger Salamander mortalities at lentic sites during VES surveys.
12
RESULTS & DISCUSSION
Monitoring Sites
We identified monitoring sites largely on accessible areas of public land and several sections
of state land, thereby ensuring continued access to most sites in the future. Several sites
surveyed in 2010 as special interest areas to the BLM were incorporated into the monitoring
plan. We identified 21 VES survey routes at water bodies, 5 roadkill/basking routes, and 12
nocturnal call survey routes (Figure 2, Table 3). The ATG is also working with the USGS to
identify a number of long-term monitoring reaches above and below major tributaries and CBNG
discharge points along the Powder and Tongue Rivers. These sites will also be incorporated into
the long-term monitoring plan.
2010 Survey Results
Nocturnal Call Surveys:
We conducted nocturnal call surveys at 15 sites in the PRB (Figure 3), twelve of which are
part of the proposed monitoring plan. Three sites were surveyed to inventory species at areas of
interest to the BLM, but likely will not be included in a long-term monitoring plan. Surveys
were conducted from 19 May to 15 July, however, calling dropped off in early July and the last
survey during which anurans were heard calling was on 12 July. Thus, we excluded 1 survey
that occurred after 12 July.
We detected at least 3 species at most sites and detected all 5 anuran species at one site along
Echeta Road (site NOC011). Boreal Chorus Frogs (Pseudacris maculata) were the most
common species recorded and were detected at 87% (± 8.8) of sites (Table 4). Detectability of
Boreal Chorus Frogs varied between repeat surveys, however, likely resulting from repeat
surveys being conducted later in the season and closer to the end of the breeding season. Plains
Spadefoot Toads and Woodhouse‟s Toads (Anaxyrus woodhousii) also were common and
estimated to occur at about 60% of sites. Detectability of Woodhouse‟s toads decreased with day
of year, again indicating that detectability was lower later in the season. Great Plains Toads
(Anaxyrus cognatus) and Northern Leopard Frogs (Lithobates pipiens) were the least common
and were only documented at 20% of sites (Table 4).
We were unable to correct nocturnal call survey occupancy rates for detection bias due to
low power resulting from having only 2 surveys at all sites. To compensate for this, future
implementation of this monitoring plan should visit several sites ≥ 3 times in order to improve
the ability to estimate detection rates (see Recommendations section for further discussion).
Water Body and Riparian Surveys:
We conducted VES surveys at 29 sites in 2010. Surveys were conducted in 11 riparian areas
along streams and rivers (lotic systems), and at 18 stockponds and CBNG ponds (lentic systems)
throughout the PRB (Figure 3). We documented 5 species of amphibians (Table 5) and 9 species
of reptiles (Table 6) during riparian surveys. Tiger Salamanders and Boreal Chorus Frogs were

13
the most common species detected, and Boreal Chorus Frogs were often detected audibly rather
than by sight. Tiger Salamanders were more common at lentic sites than lotic sites, and the top
occupancy model for this species had separate occupancy rates for lentic (0.788 ± 0.117) and
lotic (0.307 ± 0.152) sites (Table 5). For all other amphibians the simple model (1 group,
constant occupancy, constant detectability) performed better than more complex alternative
models. Thus, occupancy and detectability estimates from the simple model are provided (Table
5). Northern Leopard Frogs, a species currently being petitioned for listing as threatened under
the Endangered Species Act, were estimated to occupy 42% of sites surveyed in 2010. Plains
Spadefoot Toads and Great Plains Toads were the least common amphibian species detected
during VES surveys, likely due in part to their habitat preferences and breeding behavior (pulse
breeders).
We detected 5 snake, 3 turtle, and 1 lizard species during formal VES surveys (Table 6),
however detections were too few for most species to allow probability of detection to be
estimated. Thus, occupancy rates for most species are naïve (not corrected for detection bias).
Gartersnakes were the most common type of snakes detected during VES surveys, likely due to
their close association with water. We estimate that Wandering Gartersnakes (Thamnophis
elegans vagrans) occupied 18% of sites, and Plains Gartersnakes (Thamnophis radix) occupied
11% of sites (Table 6). All other snake species detected using this method occurred in very low
numbers, likely because they prefer rocky habitat typically found in more upland areas. We
documented Western Painted Turtles (Chrysemys picta) at 10% and only documented Snapping
Turtles (Chelydra serpentina) and Spiny Softshell Turtles (Apalone spinifera) at one site each.
Although turtles likely occur in more sites, the probability of detecting turtles using VES surveys
is relatively low. Use of turtle traps is a more effective means of surveying for turtles (Turner
2007), but this technique is time consuming and should only be employed if management goals
require monitoring trends in turtle populations at specific sites.
Two lentic sites on state land in Campbell County had the highest species diversity (i.e.,
Spotted Horse Reservoir and LS Bar Pond). We detected 4 amphibian species at both sites. No
amphibians sampled tested positive for chytrid fungus, but dead salamanders were found at
Spotted Horse. We also documented 6 reptile species, including Snapping Turtles and numerous
Western Painted Turtles, at Spotted Horse. Most evidence of turtles, however, were from shells
of dead turtles. We detected 5 reptile species as LS Bar Pond. CBNG development occurs in the
area of both sites, however, we were unable to assess influence of any upstream CBNG
development, if any, on these ponds.
Two sites with direct input of CBNG product water also had high species diversity. We
documented 4 species of amphibians, including Plains Spadefoot Toad, at Fallen Eagle
Reservoir. Burger Draw also had 3 species of amphibians and 1 reptile (Northern Sagebrush
Lizard (Sceloporus graciosus)). Chytrid fungus was not documented at either site, though dead
salamanders were reported at Fallen Eagle.
Rock Outcrop Surveys
We conducted rock outcrop surveys at 19 sites across the PRB (Figure 3). We detected 86
individual herps from 7 species. Five species of reptiles (4 snakes, 1 lizard) were documented
during surveys. The most notable species detected was a Pale Milksnake (Lampropeltis
14
triangulum), as species suspected to occur in the PRB but for which observations are lacking.
One Pale Milksnake was found under a thin slab of layer rock at survey site ROC01001 just
south of Schoonover Rd and about 2km east of the Powder River. Northern Sagebrush Lizards
were the most common reptile found, accounting for 83% of observations, and were observed at
most rock outcrops (84%). Prairie Rattlesnakes (Crotalus viridis) were the second most common
reptile found on rock outcrops and were documented at 26% of sites. Bullsnakes (Pituophis
catenifer sayi) and Eastern Yellowbelly Racers (Coluber constrictor flaviventris) were detected
at 11% of rock outcrops. We also documented 2 amphibian species during rock outcrop surveys.
Woodhouse‟s Toads were found at 2 sites and a Boreal Chorus Frog was found at 1 site. Other
species found at rock outcropping included bushy-tailed woodrats (Neotoma cinerea), cottontail
rabbits (Sylvilagus spp.), mule deer (Odocoileus hemionus), pronghorn (Antilocapra americana),
coyotes (Canis latrans), swallows, magpies (Pica hudsonia), scorpions (Paruroctonus sp.), and
centipedes (Family Scolopendridae). We also found 3 bats using a day roost between sheets of
rock at ROC01001, the same site where the milksnake was detected. No evidence of snake
hibernacula was found, however, timing of rock outcrop surveys was not ideal for observing
snakes recently emerged from or about to enter hibernation. If the ATG or BLM are interested in
identifying snake hibernacula in the future, specific surveys for hibernacula in fall or early spring
would be optimal. Success, however, varies with weather patterns and size of the survey area.
Roadkill and Basking Surveys
We conducted multiple surveys of 5 one-mile stretches of dirt and paved roads to search for
roadkill/basking reptiles and amphibians (Figure 3). We detected 20 individuals, 17 of which
were dead, from at least 4 species. As in 2009, Bullsnakes were the most common species found
dead on roads (41%). Toads accounted for 29% of roadkill followed by Common Gartersnakes
(Thamnophis sirtalis parietalis; 18%), Prairie Rattlesnakes (6%), and Northern Leopard Frogs
(6%).
Because we targeted key roads and roadkill “hotspots” identified during 2008 and 2009
inventory surveys, the average roadkill rate at monitoring sites in 2010 was higher than in
previous years. We determined the average roadkill rate for sites that were visited more than
once during the field season. The overall average roadkill rate was 3.2 mortalities/mile,
however, 88% of mortalities were found along two, one-mile stretches of SR338 near the Welch
Management Area along the Tongue River in Sheridan County (Table 7). The overall roadkill
rate for the same 5 sites surveyed in 2009 was 1.4 mortalities/mile. The increase in roadkill rates
from 2009 to 2010 is almost entirely due to a large increase in the number of mortalities at site
RD0908 on SR338 in 2010. We documented 11 dead reptiles and amphibians at RD0908 in
2010, as well as numerous dead swallows on the bridge section where SR338 crosses the Tongue
River. Roadkill rates are likely consistently high along this portion of SR338 due to its
proximity to riparian areas along the Tongue River and multiple adjacent rock outcroppings.
The potential influence of such high roadkill rates on local herpetofauna is difficult to predict
without formal population studies. However, if managers are concerned about reptile and
amphibian populations in the Welch Management Area, seasonal speed restrictions or increased
signage warning motorists to watch for wildlife on roads may help to decrease the significant
number of road mortalities in this area.

15
In addition to formal roadkill/basking surveys, we recorded all incidental occurrences of dead
or basking reptiles and amphibians found while driving between surveys in the PRB. In 2010, 23
reptiles and amphibians were found on roadways, the majority of which (74%) were dead.
Bullsnakes were again the most common species found on roadways (48%) followed by Prairie
Rattlesnakes (22%). We also documented a Pale Milksnake dead on SR14/16 near the
intersection of Arvada-Gillette Road (Figure 12). Incidental occurrences of other species found
on the road include Eastern Yellowbelly Racer, Wandering Gartersnake, Tiger Salamander,
Woodhouse‟s Toad, Great Plains Toad, and Greater Short-horned Lizard (Phrynosoma
hernandesi). Although formal surveys in past years did not detect roadkill along Dead Horse
Road south of Hwy 93 on the east side of the Powder River, we documented incidental
occurrences of 5 dead snakes (3 Bullsnakes, 2 Prairie Rattlesnakes) along in about a 3.5 mile
stretch of this road. Managers may want to monitor roadkill rates along this road in future years.
Species Distributions
Although surveys conducted in 2008 and 2009 primarily focused on inventorying amphibians
and reptiles in the PRB and surveys in 2010 focused on collecting baseline data at proposed
monitoring sites, we continued to add to our knowledge of the distribution and abundance of
species in the area. Inventories at additional areas of interest to the BLM in 2010 further
augmented our knowledge. Interpretation of patterns are limited to sites surveyed because large
portions of the PRB are private lands or are inaccessible due to lack of roads or to surrounding
land ownership. Because water is rare and patchily distributed across the PRB, amphibians (and
certain reptiles) are concentrated near water bodies. Occupancy by a given species is not only
influenced by presence of water, but could also be influenced by water permanence, proximity to
other water bodies, water quality, recent disease outbreaks, and the length of time the water body
has been present on the landscape. Thus, understanding patterns of occupancy in such a large,
complex, and changing landscape is difficult.
Taking the above limitations into consideration, some patterns are revealed in the data. In
general, surveys in the northern portion of the PRB in Wyoming tended to detect more species
(Figure 4). Surveys of lentic sites in the northwest, in particular, resulted in a diversity of both
amphibians and reptiles. Rock outcrops, used by many reptile species, also generally are more
common and larger in the northern portion of the PRB. Thus, the northern PRB may provide
more habitat for reptiles than the eroded clay breaks in the southern portion of the PRB.
Based on results from multiple survey methods, Boreal Chorus Frogs, Woodhouse‟s Toads,
and Tiger Salamanders appear to be common throughout the PRB (Figures 5, 6, 7). Boreal
Chorus Frogs were primarily detected by their calling during nocturnal call surveys and VES
surveys at both lotic and lentic sites. Tiger salamanders, however, are more common in areas
with standing water than flowing water and the majority of Tiger Salamanders detected were
dead or dying, likely due to ranavirus. Northern Leopard Frogs were also relatively common
throughout the PRB and were most easily detected using VES surveys at water bodies (Figure 5).
Plains Spadefoot Toads and Great Plains Toads had the lowest occupancy rates for amphibians;
however, detectability for these pulse breeders is notoriously low. We only detected Great Plains
Toads in the northern half of the PRB (Figure 8), but lack of detections in the south could be due
to low detectability and fewer surveys in that region. Plains Spadefoot Toads were found in low
numbers throughout much of the PRB (Figure 8).

16
We also documented most of the reptile species thought to occur in the PRB. Bullsnakes
were the most common snake observed in the PRB and were detected throughout the area both
near water bodies and in upland sites on roads and at rock outcrops (Figure 9). Prairie
Rattlesnakes also were common in both upland and riparian habitats throughout the PRB (Figure
10) though were most often detected at rock outcrops or on roads. Gatersnakes were primarily
restricted to areas near water bodies and were most often detected using VES surveys. Of the 3
species detected, Wandering Gartersnakes were the most common and were distributed
throughout the PRB at both lentic and lotic sites (Figure 11). Common Gartersnakes were only
documented at a couple of sites, but occurred in both the northern and southern portions of the
PRB (Figure 11). Plains Gartersnakes, however, were only detected near water bodies in the
northern half of the PRB. Eastern Yellowbelly Racers were not common, but could occasionally
be found near water bodies and on roads and were distributed throughout the PRB (Figure 12).
The two rarest snakes in the PRB were the Western Hog-nosed Snake and the Pale Milksnake.
Both had too few occurrences to understand their distributions in this area (Figure 12). Surveys
in 2010, however, resulted in the only recorded sightings of Pale Milksnakes in the PRB.
Other reptiles documented include lizards and turtles. Although Northern Sagebrush Lizards
were common throughout the PRB both near water bodies and at upland sites, Greater Short-
Horned Lizards were rarely detected (Figure 13). Greater Short-horned Lizards, however, prefer
sandy upland habitats, areas which were not targeted for surveys. Observations of turtles were
rare but could result from low detectability for these species using VES surveys. Of the 3 turtle
species, Western Painted Turtles were the most common and likely the most detectable (Figure
14). Spiny Softshell Turtles were only documented in the Welch Management Area (Figure 14),
however, this species prefers large rivers and further surveys along the Powder River and its
major tributaries could result in more documented occurrences of this species.
Predictive distribution maps for amphibian and reptile species were generated using data
from this project, past surveys, and documented sightings/collections in Wyoming. Draft maps
were provided in the 2009 annual report (Estes-Zumpf et al. 2010). These distribution models
are part of an ongoing project on Assessment of Wildlife Vulnerability to Energy Development
(AWVED) being conducted by WYNDD‟s senior zoologist, Doug Keinath, and GIS specialist,
Mark Andersen. Final distribution maps are available online by request from WYNDD. A
summary of habitat types, habitat characteristics, and water quality parameters for each
amphibian species documented in the PRB was provided in the 2009 annual report (Estes-Zumpf
et al. 2010; Table 5).
BLM Special Area Results
We conducted inventories for reptiles and amphibians at 10 areas of special interest to the
Buffalo Field Office of the BLM (Table 8; Figure 15). All but one of these areas occurred on
BLM lands. The Wild Horse Creek area is privately owned but permission was given to survey a
portion of the creek. Wild Horse Creek is of interest to the BLM because considerable amounts
of CBNG water have been released into Wild Horse Creek for several years. We were unable to
survey Dead Horse Reservoir 2 as requested because it was dry in 2010. The type of survey
methods used varied between sites with type and accessibility of habitat (water bodies and rock
outcrops).
17
The Fortification Creek area had the most habitat for reptiles and amphibians and we were
able to conduct several VES, nocturnal call surveys, and rock outcrop surveys. We identified 8
species of herps (4 amphibians, 4 reptiles) as well as a gartersnake, toad, and turtle which we
were unable to get a sufficient view of to identify to species (Table 8). Chytrid fungus was not
documented in any of the amphibians sampled from the Fortification Creek area, however, we
did find at least 10 dead tiger salamanders in a pond on state land. Due to access issues, we only
surveyed a small portion of this watershed, but were able to target the few areas in the watershed
with consistent water. More upland searches could yield detections of additional reptile species.
We first inventoried reptiles and amphibians in the Welch Management Area in 2009 at the
request of the BLM. We surveyed the area a second time in 2010 and documented 5 of the 9
species detected in 2010 (Table 8). We also detected several Common Gartersnakes, which were
not observed in 2009, and 5 toads that had been killed by vehicles and which we were unable to
identify to species. Thus, during surveys in 2009 and 2010, we confirmed at least 11 species of
reptiles and amphibians in the Welch Management Area, making this area one of the most
herpetologically diverse sites surveyed. Unfortunately, many of the individuals in this area were
found during roadkill/basking surveys and had been killed by vehicles on SR338.
The Burnt Hollow Management Area also contained several species of herps (4 amphibians,
1 reptile detected), despite the relative lack of water bodies and rock outcrops (Table 8). We
were able to find 3 ponds in the Management Area that contained water and conducted
opportunistic searches while looking for suitable rock outcrops. The most unique individual
detected in Burnt Hollow was a likely Woodhouse‟s Toad adult with no cranial crests. Toads in
Wyoming can be identified by the presence and shape of their cranial crests. Although cranial
crests are sometimes not very obvious on young toads, crests are typically prominent on adults.
The only toad species in Wyoming that lacks a cranial crest is the Boreal Toad (Anaxyrus boreas
boreas) which occurs in some mountain ranges in Wyoming. Because the Burnt Hollow
Management Area is well outside the range of the Boreal Toad in Wyoming both WGFD
herpetologists and WYNDD experts assume, based on photographic evidence, that the large toad
found was an aberrant Woodhouse‟s Toad that lacked any cranial crests. Further investigations
into toads in this area, however, could prove interesting.
Tiger Salamander Mortality
Tiger Salamander mortality was documented at 50% (9 of 18 sites) of lentic sites (standing
water bodies) in 2010, including sites in the Fortification Creek area and near Ice Cave west of
Kaycee (Figure 7). The proportion of sites with dead or dying salamanders in 2010 was greater
than the 25% of lentic sites in 2008 but less than the 63% of sites with dead salamanders in 2009.
In total, over 700 dead salamanders have been found throughout the PRB during survey activities
from 2008 to 2010 (Figure 7). In 2009, diagnostic tests of two dead salamanders sent the
National Wildlife Health Center in Madison, Wisconsin confirmed that both salamanders died of
a ranavirus infection. No salamanders were sent in for diagnostic tests in 2010, however, many
exhibited hemorrhaging consistent with (but not limited to) a ranavirus infection.
Although testing of dead Tiger Salamanders from multiple sites across the PRB has yet to be
done, it is likely that the majority of deaths are the result of ranavirus infection due to presence
of the virus in the area and obvious external symptom evident on dead and dying individuals.
18
Because other amphibians in the area, and even in the same ponds, do not show evidence of a
ranavirus infection, it is also likely that the ranavirus is the genus-specific Ambystoma tigrinum
virus (ATV). However, more widespread diagnostic tests should be conducted to confirm this.
Tiger Salamanders are currently common throughout Wyoming, however, the apparent rapid
spread of ranavirus through populations in eastern Wyoming warrants monitoring. Ranavirus is
a lethal and highly contagious virus that could potentially impact Tiger Salamander populations
in the state. At this point, it is unknown if the ranavirus outbreak is natural or if changes in water
quality in the PRB due to CBNG development could be increasing susceptibility of Tiger
Salamanders to the virus. We recommend monitoring tiger salamander mortalities in the PRB.
Research investigating the possible role of CBNG discharge in susceptibility of salamanders to
ranavirus could also help resource managers and scientists better understand the dynamics of this
virus.
Chytrid Analyses
We sampled 26 individual amphibians (11 Woodhouse‟s toads, 12 Northern Leopard Frogs,
2 Plains Spadefoot Toads, and 1 Great Plains Toad) for chytrid fungus. Chytrid was only
detected in 2 samples, 1 Woodhouse‟s Toad and 1 Great Plains Toad. The overall chytrid
infection rate for individuals sampled in 2010 (7.7%) is a drastic decrease from the 23%
documented in 2009 and the lowest it has been since Turner (2007) began documenting chytrid
infection rates in the PRB. We also observed a drop in chytrid infection rate when analyzed by
site rather than by individual. In 2009, 3 of 11 sites (27%) contained amphibians which tested
positive for chytrid. In 2010, 2 of 12 sites (17%) contained individuals with chytrid fungus.
Furthermore, in 2010 no Northern Leopard Frogs tested positive for chytrid, while 28% tested
positive in 2009. This decrease in chytrid is encouraging, especially given the cold wet spring in
2010, conditions which typically decrease the ability of infected amphibians to fight off the
fungus through basking behavior. The perceived decrease in chytrid infection rate could indicate
a decrease in the prevalence of chytrid fungus in the PRB. Results from surveys conducted by
WYNDD from 2008 to 2010 indicate that chytrid has been documented along the Powder River
and several of its tributaries (except in the very south) and from the Tongue River in the West to
the just northeast of Gillette (Figure 16). As with the ranavirus infection, sufficient data does not
yet exist to determine the impact of chytrid on local amphibian populations, and we recommend
continued monitoring of chytrid infection rates in the PRB.
RECOMMENDATIONS
1. Proposed monitoring sites and survey protocols should be reviewed by the BLM and the
ATG to make sure they meet the needs of the group. Surveys sites focus on areas near
water bodies and detections of upland species are expected to be lower. Some species,
such as Northern Sagebrush Lizards, Bullsnakes, and Prairie Rattlesnakes are better
detected using rock outcrop surveys. If the ATG decides these species are important to
monitor, rock outcrop surveys should be incorporated into monitoring efforts. Only five,
1-mile stretches of road are currently proposed for monitoring road mortalities based on
concern over the number of dead herps detected during inventories. If the ATG is
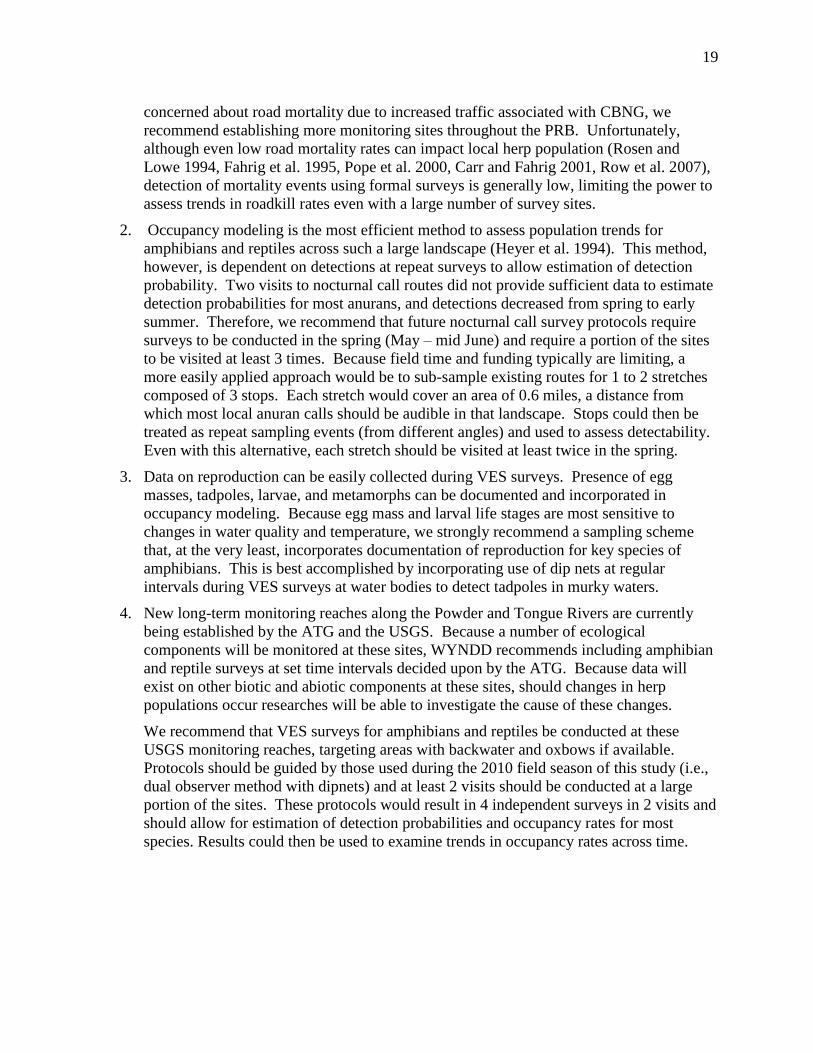
19
concerned about road mortality due to increased traffic associated with CBNG, we
recommend establishing more monitoring sites throughout the PRB. Unfortunately,
although even low road mortality rates can impact local herp population (Rosen and
Lowe 1994, Fahrig et al. 1995, Pope et al. 2000, Carr and Fahrig 2001, Row et al. 2007),
detection of mortality events using formal surveys is generally low, limiting the power to
assess trends in roadkill rates even with a large number of survey sites.
2. Occupancy modeling is the most efficient method to assess population trends for
amphibians and reptiles across such a large landscape (Heyer et al. 1994). This method,
however, is dependent on detections at repeat surveys to allow estimation of detection
probability. Two visits to nocturnal call routes did not provide sufficient data to estimate
detection probabilities for most anurans, and detections decreased from spring to early
summer. Therefore, we recommend that future nocturnal call survey protocols require
surveys to be conducted in the spring (May – mid June) and require a portion of the sites
to be visited at least 3 times. Because field time and funding typically are limiting, a
more easily applied approach would be to sub-sample existing routes for 1 to 2 stretches
composed of 3 stops. Each stretch would cover an area of 0.6 miles, a distance from
which most local anuran calls should be audible in that landscape. Stops could then be
treated as repeat sampling events (from different angles) and used to assess detectability.
Even with this alternative, each stretch should be visited at least twice in the spring.
3. Data on reproduction can be easily collected during VES surveys. Presence of egg
masses, tadpoles, larvae, and metamorphs can be documented and incorporated in
occupancy modeling. Because egg mass and larval life stages are most sensitive to
changes in water quality and temperature, we strongly recommend a sampling scheme
that, at the very least, incorporates documentation of reproduction for key species of
amphibians. This is best accomplished by incorporating use of dip nets at regular
intervals during VES surveys at water bodies to detect tadpoles in murky waters.
4. New long-term monitoring reaches along the Powder and Tongue Rivers are currently
being established by the ATG and the USGS. Because a number of ecological
components will be monitored at these sites, WYNDD recommends including amphibian
and reptile surveys at set time intervals decided upon by the ATG. Because data will
exist on other biotic and abiotic components at these sites, should changes in herp
populations occur researches will be able to investigate the cause of these changes.
We recommend that VES surveys for amphibians and reptiles be conducted at these
USGS monitoring reaches, targeting areas with backwater and oxbows if available.
Protocols should be guided by those used during the 2010 field season of this study (i.e.,
dual observer method with dipnets) and at least 2 visits should be conducted at a large
portion of the sites. These protocols would result in 4 independent surveys in 2 visits and
should allow for estimation of detection probabilities and occupancy rates for most
species. Results could then be used to examine trends in occupancy rates across time.
20
ACKNOWLEDGEMENTS
We would like to thank Zachary Bateson and Jared Luke Hodges for conducting field
surveys for this project in 2010. Dr. Jeffery Beck and Clay Buchanan assisted with site access.
William Turner generously provided WGFD data and routes at the onset of this project. Bill
Ostheimer, Bryce Maxwell, Zack Walker, and the Wyoming Game and Fish Department
provided much appreciated conceptual and logistical support. We sincerely thank the Buffalo
Field Office of the BLM and the Aquatic Task Group for providing financial support for this
study.

21
LITERATURE CITED
Aquatic Task Group, 2006. Aquatic monitoring plan. An online document prepared by a
subcommittee of the Coal Bed Natural Gas Interagency Working Group.
http://www.wy.blm.gov/prbgroup/04minutes/aquaticbiotaplan06-16.pdf
BFO BLM, 2003. Powder River Basin Final EIS/ Proposed Resource Management Proposal
Amendment. Buffalo Field Office, Bureau of Land Management, Buffalo, Wyoming.
http://www.blm.gov/wy/st/en/info/NEPA/bfodocs/prb_eis.html
Burnham, K. P., and D. R. Anderson. 2002. Model selection and multimodel inference: a
practical information-theoretic approach. 2nd ed. Springer, New York, New York.
Carr, L. W., and L. Fahrig. 2001. Effect of road traffic on two amphibian species of differing
vagility. Conservation Biology 15:1071–1078.
Davis, W.N., R.G. Bramblett, and A.V. Zale. 2006. The effects of coalbed natural gas activities
on fish assemblages: a review of the literature. Montana Cooperative Fish Research Unit,
Montana State University, Bozeman, Montana.
Estes-Zumpf, W. H. Griscom, D. Keinath. 2010. Inventory of Amphibians and Reptiles in the
Powder River Basin Area of Wyoming: Year Two Progress Report. Report prepared for the
Buffalo Field Office of the Bureau of Land Management by the Wyoming Natural Diversity
Database-University of Wyoming, Laramie, Wyoming
Fahrig, L., J. H. Pedlar, S. E. Pope, P. D. Taylor, and J. F. Wegner. 1995. Effect of road traffic
on amphibian density. Biological Conservation 73:177–182.
Griscom, H., W. Estes-Zumpf, D. Keinath. 2009. Pre-drilling surveys of amphibian and reptile
habitats in the Powder River Basin of Wyoming. Prepared by the Wyoming Natural
Diversity Database, Laramie, Wyoming. January 2009.
Heyer, W. R., M. A. Donnelly, R. W. McDiarmid, L. C. Hayek, and M. S. Foster. 1994.
Measuring and Monitoring Biological Diversity: Standard Methods for Amphibians.
Smithsonian Institution Press, Washington D.C.
Hines, J. E. (2006). PRESENCE2- Software to estimate patch occupancy and related parameters.
USGS-PWRC. http://www.mbr-pwrc.usgs.gov/software/presence.html.
Livo, L.J. 2003. Methods for obtaining Batrachochytrium dendrobatidis (Bd) samples for PCR
testing. Department of Integrative Physiology, University of Colorado, Boulder, Colorado.
Mackenzie, D. I., J. D. Nichols, J. A. Royle, K. H. Pollock, L. L. Bailey, J. E. Hines. 2006.
Occupancy Estimation and Modeling: Inferring Patterns and Dynamics of Species
Occurrence. New York, Academic Press.
Parker, J. and S. Anderson. 2001. Identification guide to the herptiles of Wyoming. Prepared
by the Wyoming Cooperative Fish and Wildlife Research Unit for the Wyoming Game and
Fish Department.
Pope, S. E., L. Fahrig, and N. G. Merriam. 2000. Landscape complementation and
metapopulation effects on leopard frog populations. Ecology 81:2498–2508.

22
Rosen, P. C., and C. H. Lowe. 1994. Highway mortality of snakes in the Sonoran Desert of
southern Arizona. Biological Conservation 68:143–148.
Row, J. R., G. Blouin-Demers, and P. J. Weatherhead. 2007. Demographic effects of road
mortality in black ratsnakes (Elaphe obsoleta). Biological Conservation 137:117-124.
Turner, W. 2007. Survey of herpefauna in the Powder River Basin. Prepared by the Wyoming
Game and Fish Department for the US Environmental Protection Agency.

23
TABLES AND FIGURES
Table 1. Species of amphibians and reptiles thought to potentially occur in the Powder River
Basin of Wyoming (Turner, 2007; Parker and Anderson, 2001) and their detection history
during past surveys.
Common Name Scientific Name WGFD
2004-2006 WYNDD
2008 WYNDD
2009 WYNDD
2010
Bullfrog* Lithobates catesbeianus Maybe N N N
Northern Prairie Lizard* Sceloporus undulatus garmani
N N N N
Pale Milksnake† Lampropeltis triangulum N N N Y
Boreal Chorus Frog Pseudacris maculata Y Y Y Y
Northern Leopard Frog Lithobates pipiens Y Y Y Y
Great Plains Toad Anaxyrus cognatus Y Y N Y
Woodhouse's Toad Anaxyrus woodhousii Y Y Y Y
Plains Spadefoot Spea bombifrons Y Y Y Y
Tiger Salamander Ambystoma mavortium Y Y Y Y
Greater Short-horned Lizard
Phrynosoma hernandesi Y Y Y Y
Northern Sagebrush Lizard
Sceloporus graciosus Y Y Y Y
Eastern Yellowbelly Racer Coluber constrictor flaviventris
Y Y Y Y
Prairie Rattlesnake Crotalus viridis Y Y Y Y
Western Hog-nosed Snake
Heterodon nasicus Y Y N N
Bullsnake Pituophis catenifer sayi Y Y Y Y
Wandering Garter Snake Thamnophis elegans vagrans
Y Y Y Y
Plains Garter Snake Thamnophis radix Y Y N Y
Common Garter Snake Thamnophis sirtalis parietalis
Y Y Y Y
Snapping Turtle Chelydra serpentina Y Y N Y
Western Painted Turtle Chrysemys picta Y Y Y Y
Spiny Softshell Turtle Apalone spinifera Y N Y Y
* Indicates questionable occurrence in PRB due to lack of supporting documentation from field survey efforts.
† Occurrence in PRB was previously questionable due to lack of sightings
24
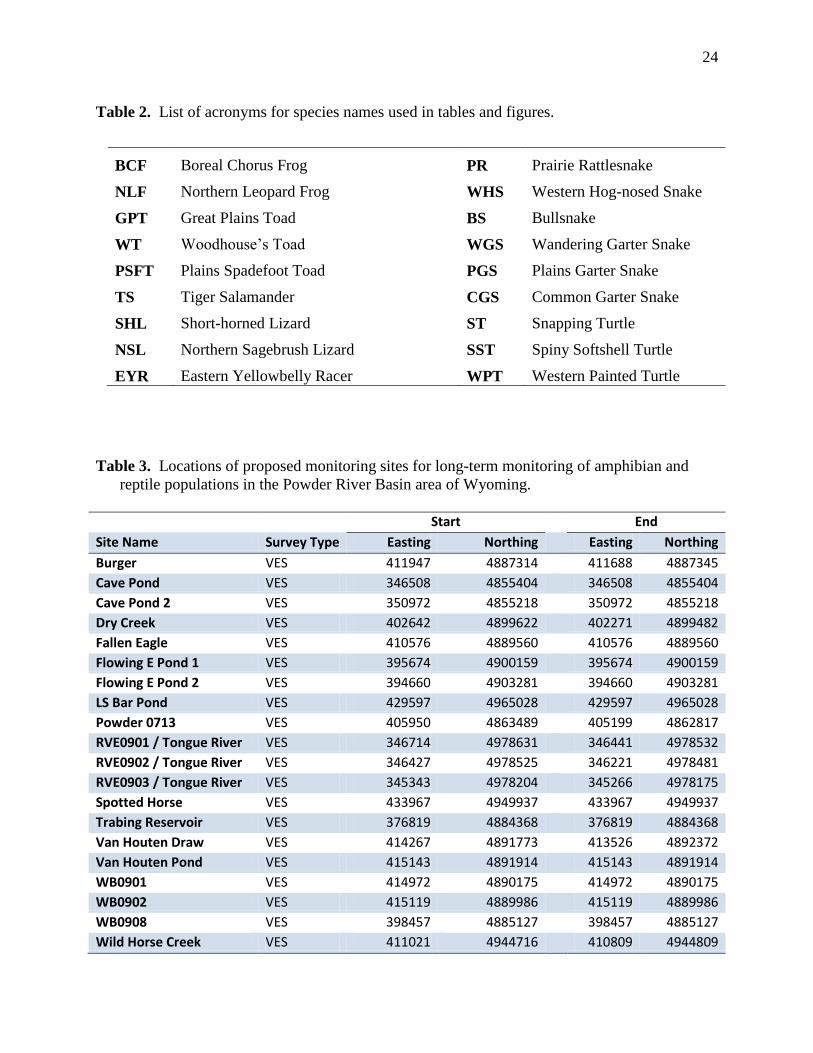
Table 2. List of acronyms for species names used in tables and figures.
BCF Boreal Chorus Frog PR Prairie Rattlesnake
NLF Northern Leopard Frog WHS Western Hog-nosed Snake
GPT Great Plains Toad BS Bullsnake
WT Woodhouse‟s Toad WGS Wandering Garter Snake
PSFT Plains Spadefoot Toad PGS Plains Garter Snake
TS Tiger Salamander CGS Common Garter Snake
SHL Short-horned Lizard ST Snapping Turtle
NSL Northern Sagebrush Lizard SST Spiny Softshell Turtle
EYR Eastern Yellowbelly Racer WPT Western Painted Turtle
Table 3. Locations of proposed monitoring sites for long-term monitoring of amphibian and
reptile populations in the Powder River Basin area of Wyoming.
Start End
Site Name Survey Type Easting Northing Easting Northing
Burger VES 411947 4887314 411688 4887345
Cave Pond VES 346508 4855404 346508 4855404
Cave Pond 2 VES 350972 4855218 350972 4855218
Dry Creek VES 402642 4899622 402271 4899482
Fallen Eagle VES 410576 4889560 410576 4889560
Flowing E Pond 1 VES 395674 4900159 395674 4900159
Flowing E Pond 2 VES 394660 4903281 394660 4903281
LS Bar Pond VES 429597 4965028 429597 4965028
Powder 0713 VES 405950 4863489 405199 4862817
RVE0901 / Tongue River VES 346714 4978631 346441 4978532
RVE0902 / Tongue River VES 346427 4978525 346221 4978481
RVE0903 / Tongue River VES 345343 4978204 345266 4978175
Spotted Horse VES 433967 4949937 433967 4949937
Trabing Reservoir VES 376819 4884368 376819 4884368
Van Houten Draw VES 414267 4891773 413526 4892372
Van Houten Pond VES 415143 4891914 415143 4891914
WB0901 VES 414972 4890175 414972 4890175
WB0902 VES 415119 4889986 415119 4889986
WB0908 VES 398457 4885127 398457 4885127
Wild Horse Creek VES 411021 4944716 410809 4944809

25
Wild Horse Creek 2 VES 411021 4944716 411239 4945059
BTRD07 Roadkill 408908 4925314 409413 4926690
RD0902 Roadkill 407808 4898063 407771 4898373
RD0903 Roadkill 407671 4895349 408296 4893919
RD0907 Roadkill 347250 4979896 347891 4981343
RD0908 Roadkill 346698 4978801 347349 4977405
BTNOC09 Nocturnal 395987 4923083 394618 4922329
BTNOC11 Nocturnal 396386 4925557 395300 4926657
BTNOC14 Nocturnal 382290 4898499 383150 4897258
BTNOC15 Nocturnal 377246 4882746 376867 4884280
NOC009B Nocturnal 398748 4838009 395736 4838390
NOC010 Nocturnal 410347 4944639 413280 4943471
NOC011 Nocturnal 424203 4932914 424719 4929900
NOC016 Nocturnal 390402 4917339 386462 4917769
NOC018B Nocturnal 432976 4899074 432180 4893840
NOC1001 Nocturnal 429086 4925178 430790 4922544
NOC019B Nocturnal 411690 4896632 410438 4894389
NOCBVER Nocturnal 345595 4837382 345102 4838857
Table 4. Occupancy estimates (Ψ) for amphibians detected during nocturnal call surveys in
2010. Naïve occupancy rates (number of sites where detected / number of sites surveyed) are
provided for each species. For species with sufficient detections, we estimated detection
probabilities (p) for surveys and corrected occupancy estimates for bias due to imperfect
detection. Standard errors (S.E.) are provided for estimates.
Nocturnal Call
Species Naïve Ψ Ψ S.E. p S.E.
BCF 0.867 0.867 0.088 varied with survey (1,2) p1 = 1.0 (fixed) p2 = 0.727
p1= 0 (fixed) p2 = 0.134
NLF 0.2 - - - -
WT 0.467 0.606 0.15 varied with day of year (-) n/a
GPT 0.2
PSFT 0.6 - - - -
26
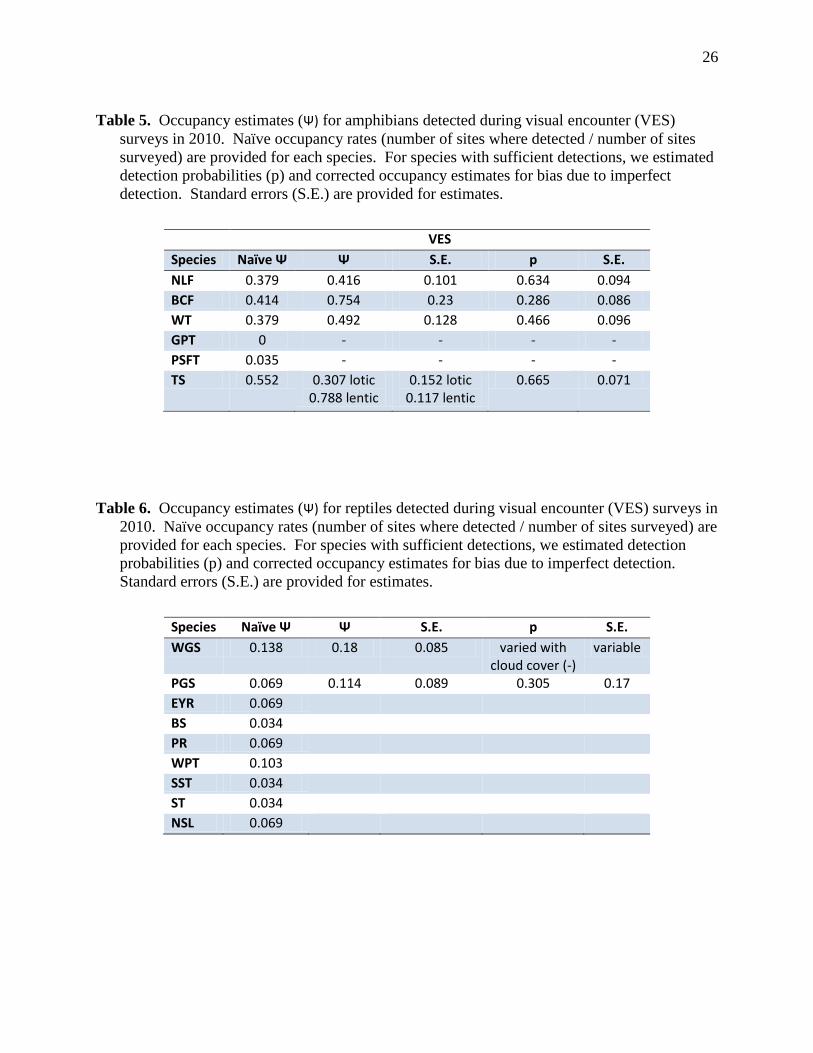
Table 5. Occupancy estimates (Ψ) for amphibians detected during visual encounter (VES)
surveys in 2010. Naïve occupancy rates (number of sites where detected / number of sites
surveyed) are provided for each species. For species with sufficient detections, we estimated
detection probabilities (p) and corrected occupancy estimates for bias due to imperfect
detection. Standard errors (S.E.) are provided for estimates.
VES
Species Naïve Ψ Ψ S.E. p S.E.
NLF 0.379 0.416 0.101 0.634 0.094
BCF 0.414 0.754 0.23 0.286 0.086
WT 0.379 0.492 0.128 0.466 0.096
GPT 0 - - - -
PSFT 0.035 - - - -
TS 0.552 0.307 lotic 0.788 lentic
0.152 lotic 0.117 lentic
0.665 0.071
Table 6. Occupancy estimates (Ψ) for reptiles detected during visual encounter (VES) surveys in
2010. Naïve occupancy rates (number of sites where detected / number of sites surveyed) are
provided for each species. For species with sufficient detections, we estimated detection
probabilities (p) and corrected occupancy estimates for bias due to imperfect detection.
Standard errors (S.E.) are provided for estimates.
Species Naïve Ψ Ψ S.E. p S.E.
WGS 0.138 0.18 0.085 varied with cloud cover (-)
variable
PGS 0.069 0.114 0.089 0.305 0.17
EYR 0.069
BS 0.034
PR 0.069
WPT 0.103
SST 0.034
ST 0.034
NSL 0.069
27
Table 7. Comparison between vehicle mortality rates documented for the same 1-mile stretches
of road (n = 5) surveyed by WYNDD in 2009 & 2010.
Route 2009 Date
2010 Date
2009 Mortality
Rate 2009 Species
2010 Mortality
Rate 2010 Species
BTRD07 5/27 5/25, 6/21 0 - 0 -
RD0902 5/26, 6/27 5/25, 6/14 1 2 Bullsnake 1 2 Bullsnake
RD0903 5/28 5/25, 6/14 0 - 0 -
RD0907 6/5, 6/28 7/19 3 5 Bullsnake 1 Western Painted Turtle
4
1 Prairie Rattlesnake 1 Bullsnake 1 Common Gartersnake 1 Unknown toad
RD0908 6/5, 6/29 7/19 3
3 Bullsnake 1 Eastern Yellowbelly Racer 1 Prairie Rattlesnake 1 Western Painted Turtle
11
4 Bullsnake 2 Common Gartersnake 1 Northern Leopard Frog 4 Unknown toad
Avg. mortalities/mile 1.4
3.2

28
Table 8. Results of amphibian and reptile surveys in key areas of the Powder River Basin identified by the BLM. Type of surveys
conducted varied between sites based on habitat present. We recorded species detected, if water was present, if amphibians
sampled tested positive for chytrid fungus, and if dead salamanders were found. Notes about amphibian/reptile habitat at each site
area also reported. Detailed species information can be found on Figures 5-14 and in corresponding GIS shapefiles.
BLM Special Interest Areas
Surveys Conducted
Species Detected Water Present?
Chytrid Detected?
Dead Salamanders?
Notes
Burnt Hollow Management Area
3 VES (lentic) opportunistic
Great Plains Toad Boreal Chorus Frog Bullsnake Northern Leopard Frog Woodhouse's Toad?
Yes Yes No Area was mostly eroded clay with no obvious large rock outcrops; creeks all dry. Only a few ponds present. Found large adult toad with NO CRANIAL CRESTS believed by WGFD and WYNDD experts to be aberrant Woodhouse's Toad.
Welch Management Area
2 Roadkill 3 VES (lotic) 4 Rock outcrop
Bullsnake Common Gartersnake Northern Leopard Frog Northern Sagebrush Lizard Prairie Rattlesnake Spiny Softshell Turtle Gartersnake Sp. Toad sp.
Yes 2009 only n/a Tongue River flows through area. Rock outcrops present. Highest roadkill rates in 2009 and 2010 along 2 sections of SR338, especially where highway cross the Tongue River.
Van Houten Draw Area
2 VES (1 lotic, 1 lentic)
Tiger Salamander Woodhouse's Toad
Yes No Yes Small creek that was dry for long stretches. Cattails present in small bunches. Also a small CBNG pond with submerged grasses.
Middle Fork Area near Kaycee
3 Rock outcrop 2 Nocturnal call opportunistic
Boreal Chorus Frog Bullsnake Northern Sagebrush Lizard
Nearby on private land
n/a n/a No water except on private land along Barnum Road. Rocky slopes and rock outcrops present near canyon. Sagebrush, juniper, and cacti present near rock outcrops.
Ice Cave 2 VES (lentic) 2 Rock outcrop
Tiger Salamander Toad sp.
Yes n/a Yes Small stock ponds present with heavy cattle disturbance. Ponds had reeds and submerged vegetation. Rock outcrops with sagebrush present.

29
Mosier Gulch opportunistic Bullsnake No n/a n/a Conducted multiple opportunistic surveys throughout the survey season in Mosier Gulch. Total search time 9-11 hours.
Fortification Creek Area
4 VES (2 lentic, 2 lotic) 2 Nocturnal Call 3 Rock outcrop opportunistic
Boreal Chorus Frog Northern Leopard Frog Woodhouse's Toad Tiger Salamander Bullsnake Eastern Yellowbelly Racer Plains Gartersnake Northern Sagebrush Lizard Gartersnake sp. Toad sp. Turtle sp.
Yes No Yes Most surveys right along Fortification Creek and Fortification Road. Creek varied from dry spots to deep pools. Lots of invertebrates and submerged vegetation present. Ducks also seen. Local landowner reported seeing turtles in the area. Small, often sandy rock outcrops present.
Wild Horse Creek
2 VES (lotic) 1 Nocturnal call
Northern Leopard Frog Boreal Chorus Frog Eastern Yellowbelly Racer Bullsnake
Yes n/a n/a Wild Horse Creek had lots of fish. Tall grass along shoreline was filled with grasshoppers making VES surveys difficult. Lots of dragonflies also present. Nocturnal call route had Wild Horse Creek on the north and the Powder River on the south.
Dead Horse Reservoir 2
none n/a No n/a n/a Did not survey due to lack of water.
Dry Creek Area 3 VES (1 lotic, 2 lentic)
Boreal Chorus Frog Woodhouse's Toad Tiger Salamander Bullsnake Wandering Gartersnake
Yes Yes No Dry Creek itself had some stretches with water and some stretches with just patchy pools. Also surveyed 2 ponds in the Flowing E area. Both had lots of pondweed and algae present.
Petrified Tree Area
opportunistic Eastern Yellowbelly Racer
No n/a n/a Conducted opportunistic searches for ~2 hours but no water present.

30
Figure 1. Map of the Powder River Basin and Welch Management Area where amphibian and
reptile surveys were conducted by WYNDD from 2008 to2010.
Welch Mgmt Area

31
Figure 2. Location of proposed monitoring sites for amphibians and reptiles in the Powder
River Basin and surrounding area. Surveys include nocturnal call surveys, Visual Encounter
Surveys (VES) at water bodies, and roadkill/basking surveys along roads. Additional long-
term monitoring sites are being established by the USGS along the Powder River and are not
included on this map. See Table 3 for specific location information.

32
Figure 3. Location of amphibian and reptile surveys conducted in the Powder River Basin in
2010. Surveys included nocturnal call surveys, Visual Encounter Surveys (VES) at water
bodies, roadkill/basking surveys along roads, and rock outcrop VES surveys for reptiles.
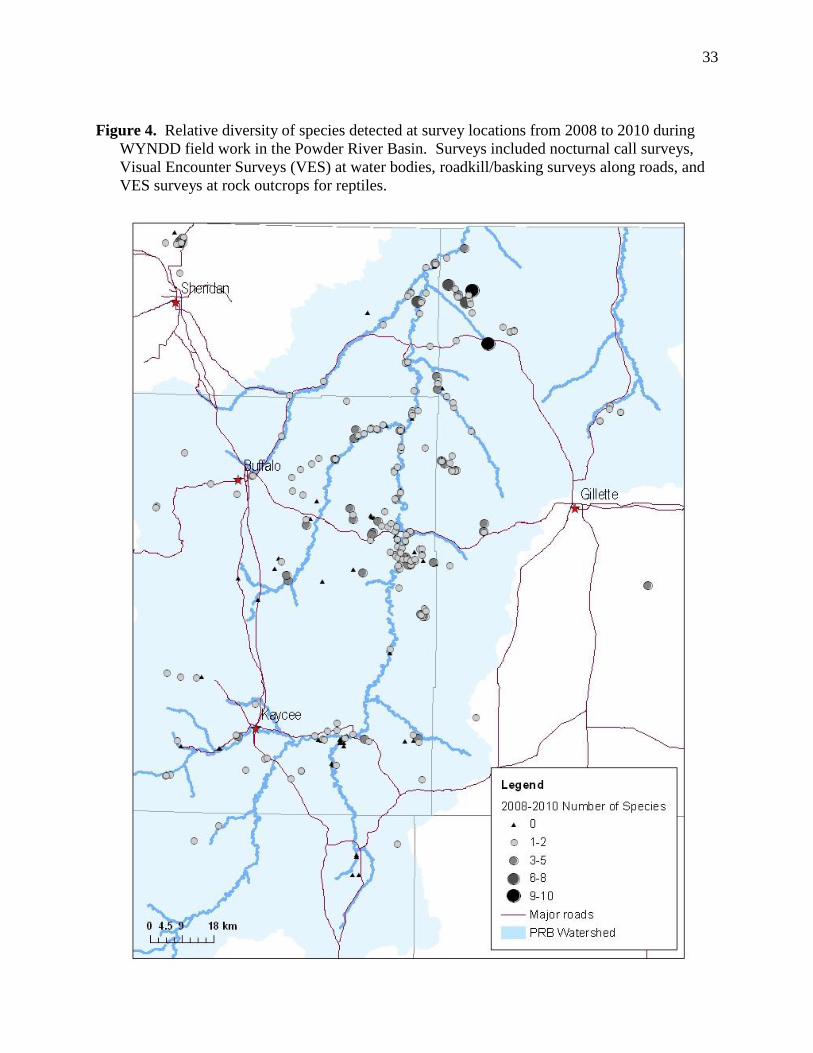
33
Figure 4. Relative diversity of species detected at survey locations from 2008 to 2010 during
WYNDD field work in the Powder River Basin. Surveys included nocturnal call surveys,
Visual Encounter Surveys (VES) at water bodies, roadkill/basking surveys along roads, and
VES surveys at rock outcrops for reptiles.

34
Figure 5. Locations of occurrences for Northern Leopard Frogs and Boreal Chorus Frogs
detected 2008-2010 during WYNDD field surveys in the Powder River Basin.

35
Figure 6. Locations of occurrences for Woodhouse‟s Toads detected 2008-2010 during
WYNDD field surveys in the Powder River Basin.

36
Figure 7. Locations of occurrences for Tiger Salamanders detected 2008-2010 during WYNDD
field surveys in the Powder River Basin. Locations where dead or dying salamanders were
documented are noted.
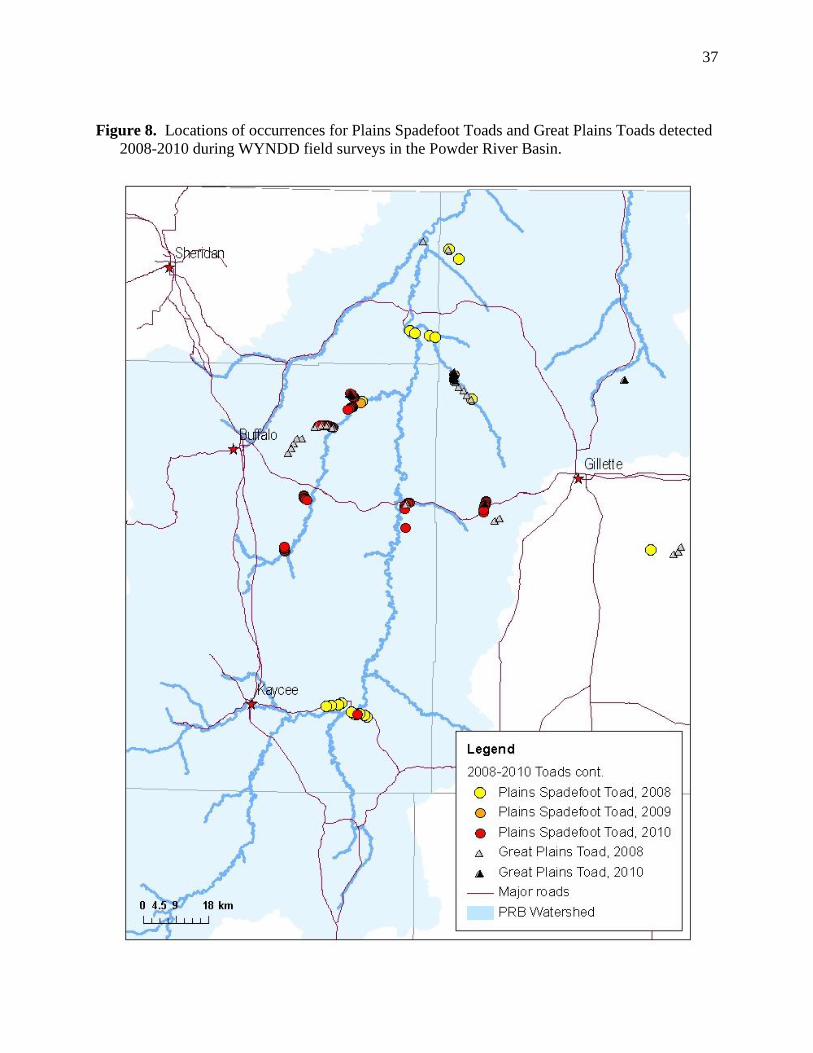
37
Figure 8. Locations of occurrences for Plains Spadefoot Toads and Great Plains Toads detected
2008-2010 during WYNDD field surveys in the Powder River Basin.

38
Figure 9. Locations of occurrences for Bullsnakes detected 2008-2010 during WYNDD field
surveys in the Powder River Basin.

39
Figure 10. Locations of occurrences for Prairie Rattlenakes detected 2008-2010 during
WYNDD field surveys in the Powder River Basin.
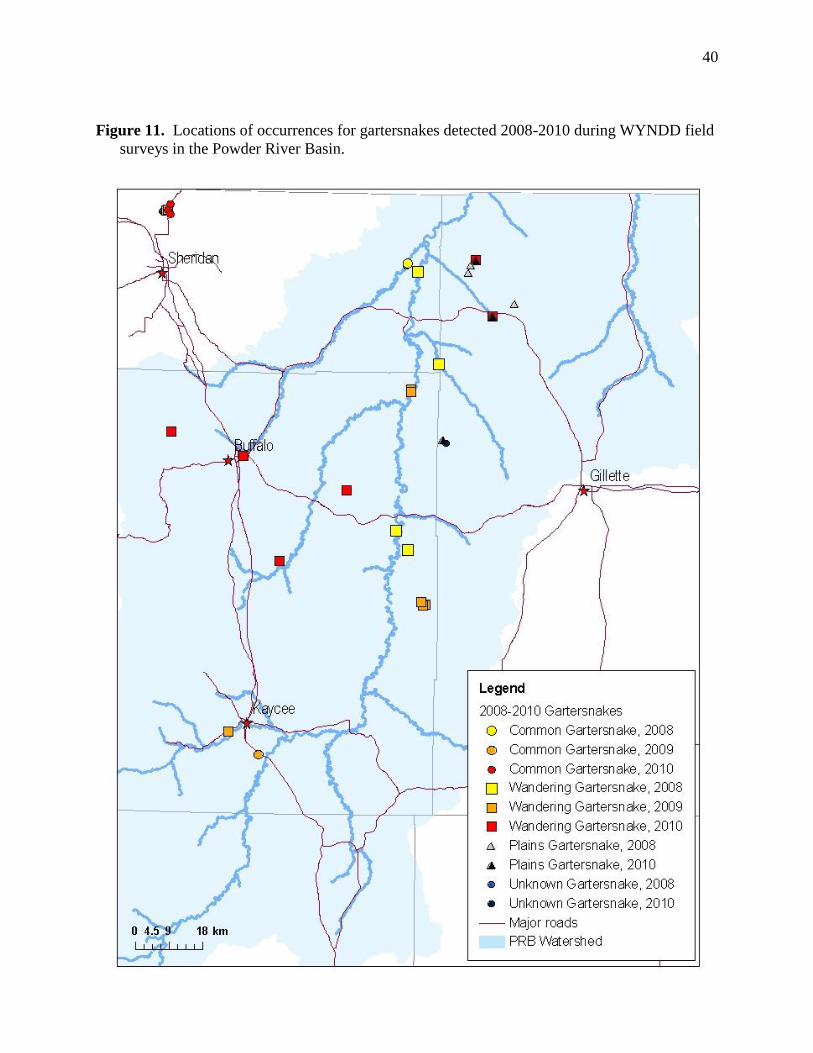
40
Figure 11. Locations of occurrences for gartersnakes detected 2008-2010 during WYNDD field
surveys in the Powder River Basin.
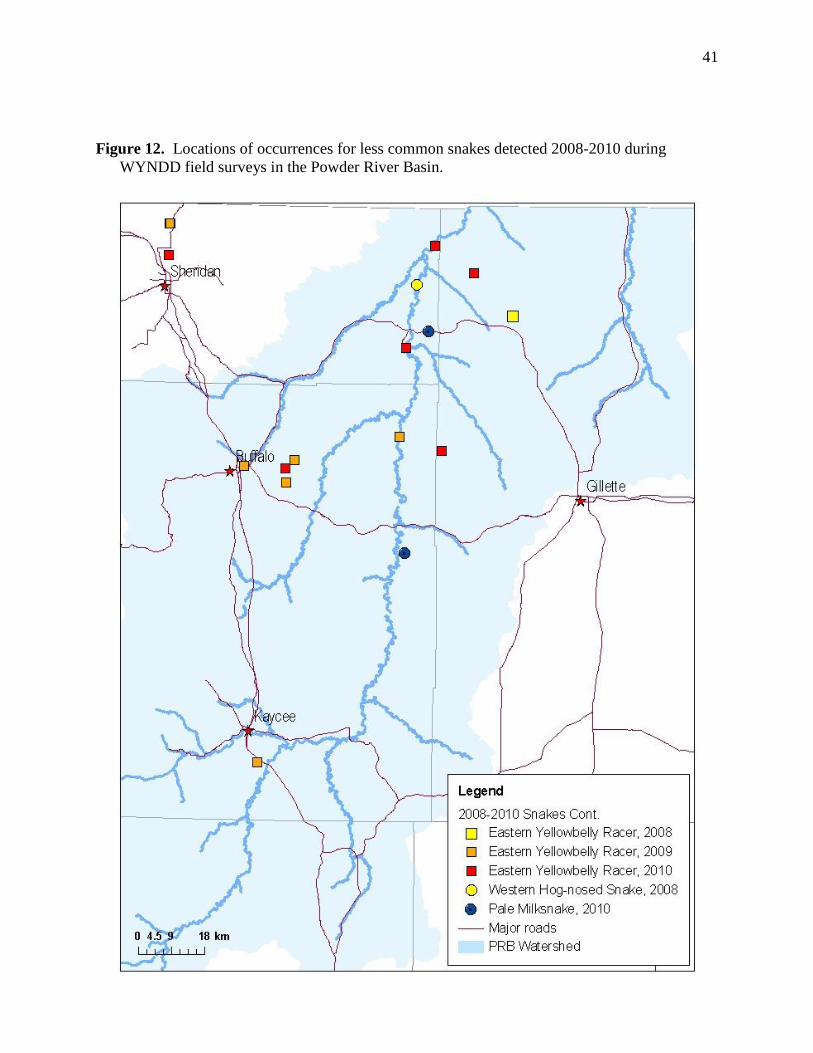
41
Figure 12. Locations of occurrences for less common snakes detected 2008-2010 during
WYNDD field surveys in the Powder River Basin.

42
Figure 13. Locations of occurrences for Northern Sagebrush Lizard and Greater Short-horned
Lizards detected 2008-2010 during WYNDD field surveys in the Powder River Basin.

43
Figure 14. Locations of occurrences for turtles detected 2008-2010 during WYNDD field
surveys in the Powder River Basin.
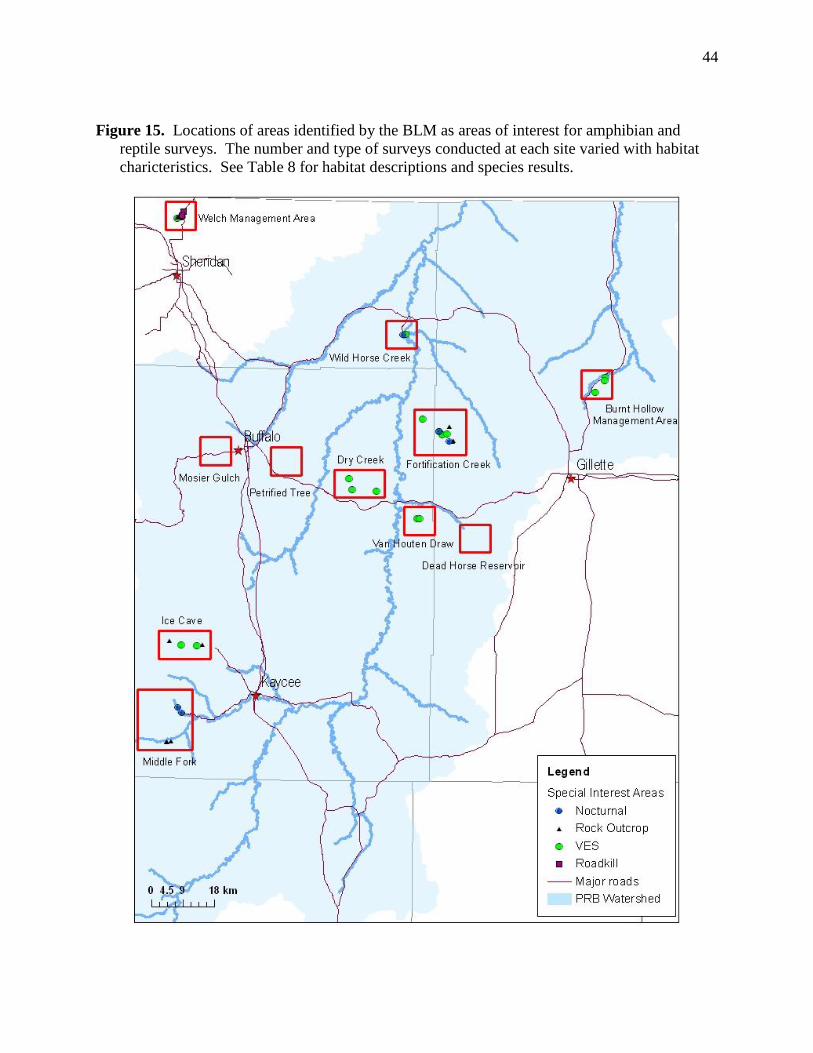
44
Figure 15. Locations of areas identified by the BLM as areas of interest for amphibian and
reptile surveys. The number and type of surveys conducted at each site varied with habitat
charicteristics. See Table 8 for habitat descriptions and species results.
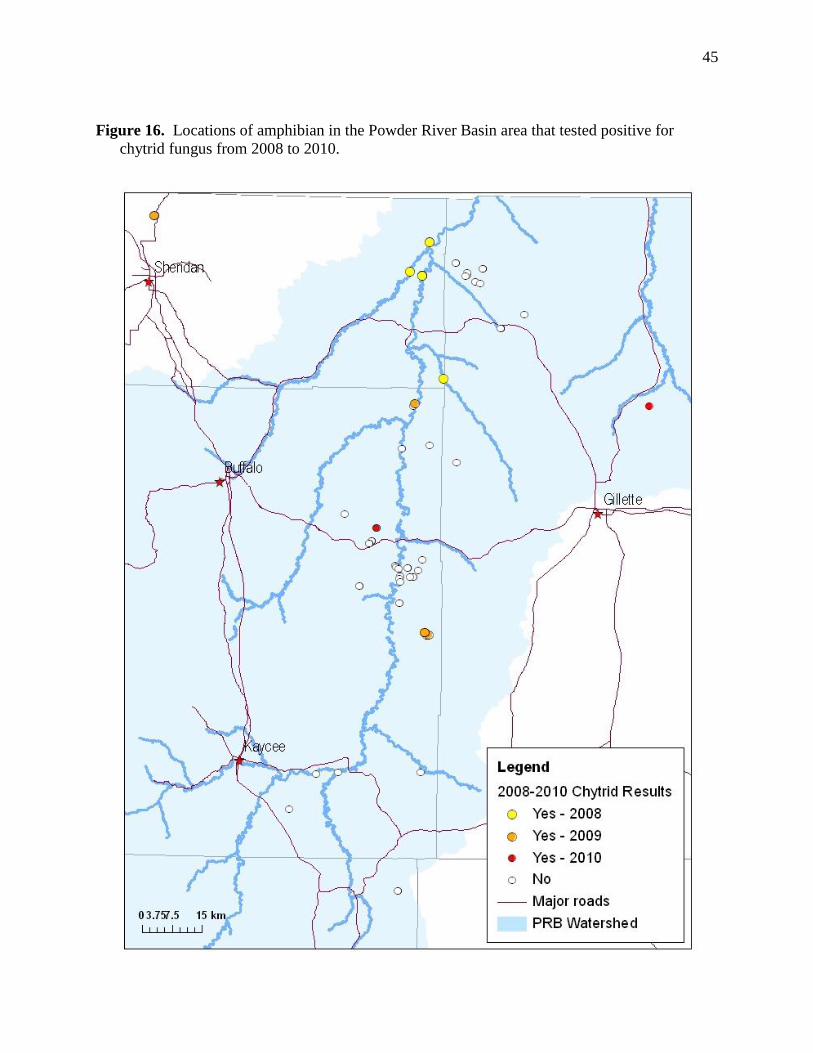
45
Figure 16. Locations of amphibian in the Powder River Basin area that tested positive for
chytrid fungus from 2008 to 2010.