Inv pres q12016_final
38
1Q16 1Q16 Financial and operating results for the period ended March 31, 2016 April 28, 2016 Unless otherwise specified, comparisons in this presentation are between 1Q16 and 1Q15.
-
Upload
cnoservices -
Category
Investor Relations
-
view
1.070 -
download
0
Transcript of Inv pres q12016_final

1Q161Q16Financial and operating results for the period ended March 31, 2016April 28, 2016
Unless otherwise specified, comparisons in this presentation are between 1Q16 and 1Q15.

Forward-Looking StatementsCertain statements made in this presentation should be considered forward-looking statements as defined in the Private Securities Litigation Reform Act of 1995. These include statements about future results of operations and capital plans. We caution investors that these forward-looking statements are not guarantees of future performance, and actual results may differ materially. Investors should consider the important risks and uncertainties that may cause actual results to differ, including those included in our press release issued on April 27, 2016, our Quarterly Reports on Form 10-Q, our Annual Report on Form 10-K and th fili k ith th S iti d E h C i i Wother filings we make with the Securities and Exchange Commission. We
assume no obligation to update this presentation, which speaks as of today’s date.
CNO Financial Group | 1Q2016 Earnings | April 28, 2016 2
Non-GAAP MeasuresThis presentation contains the following financial measures that differ from the comparable measures under Generally Accepted Accounting Principles (GAAP): operating earnings measures; book value excluding accumulated other comprehensiveoperating earnings measures; book value, excluding accumulated other comprehensive income (loss) per share; operating return measures; earnings before the net loss on the sale of CLIC and gain (loss) on reinsurance transactions, the earnings of CLIC prior to being sold, net realized investment gains (losses), fair value changes in embedded derivative liabilities, fair value changes related to the agent deferred compensation plan,derivative liabilities, fair value changes related to the agent deferred compensation plan, loss on extinguishment of debt, other non-operating items, corporate interest expense and taxes; and debt to capital ratios, excluding accumulated other comprehensive income (loss). Reconciliations between those non-GAAP measures and the comparable GAAP measures are included in the Appendix, or on the page such measure is presented.measures are included in the Appendix, or on the page such measure is presented.
While management believes these measures are useful to enhance understanding and comparability of our financial results, these non-GAAP measures should not be considered substitutes for the most directly comparable GAAP measures.
Additional information concerning non-GAAP measures is included in our periodic filings with the Securities and Exchange Commission that are available in the “Investors – SEC Filings” section of CNO’s website, www.CNOinc.com.
CNO Financial Group | 1Q2016 Earnings | April 28, 2016 3

CNO Financial Group | 1Q2016 Earnings | April 28, 2016 4

CNO1Q16 Summary(amounts in millions, except per share data)
Operating Earnings Per Share Excluding Significant Items*Notable Items
Continued franchise growth‒ NAP increased 2% ‒ Collected premium up 11%
1Q15$0.30
1Q16$0.26
p p‒ Policies in-force grew 1%‒ Bankers Life annuity account values up 2%
Operating EPS (excluding significant
Operating Earnings Excl. Significant Items* $60.1 $46.6
Operating EPS (excluding significant items) down 13%
Returned an additional $103 million to Weighted Average
Shares Outstanding 202.3 182.1shareholders
CNO Financial Group | 1Q2016 Earnings | April 28, 2016 5
* A non-GAAP measure. Refer to the Appendix for a reconciliation to the corresponding GAAP measure.

Tennenbaum Capital Partners (TCP) Investment
Strategic investment in proven asset management firm
Tennenbaum Capital Partners‒ Asset manager specializing in middle market direct lending and special situations investing
‒ Experienced management with solid long-term track record
‒ Will continue to operate on a stand-alone basis under its present executive leadership with CNO representation on the TCP Management Committee
Rationale for transaction
‒ Access to leading-edge proprietary knowledge and skill sets in asset classes outside of current core competencies
‒ Diversifies sources of general account investment income
‒ Investments are suitable for our long duration lines of business
CNO Financial Group | 1Q2016 Earnings | April 28, 2016 6
Investments are suitable for our long duration lines of business
‒ Further utilize our valuable tax assets

1Q16 Sales and Distribution Results Bankers Life($ millions)($ millions)
Quarterly NAP* 1Q NAP down 2%
‒ Decreases in life and Medicare supplement; partially offset by higher annuity and LTC
Collected premiums up 13%
1Q15$61.6
2Q15$61.3
3Q15$59.9
4Q15$69.1
1Q16$60.3
Collected premiums up 13%
Agent metrics‒ New agent recruiting stabilized‒ Average producing agents down 6%; agent
productivity up 4%
Third party fee income up 13%
Third Party Policies Sold** 5,392 4,273 2,980 20,711 3,703
Trailing 4-Quarters NAP $260.1 $258.3 $256.4 $251.9 $250.6
Collected Premiums $584.2 $603.9 $648.7 $654.5 $660.7
CNO Financial Group | 1Q2016 Earnings | April 28, 2016 7* Third party sales are excluded from NAP in all periods.** Includes Medicare Advantage, Medicare supplement, PDP, Dental/Vision and ACA products
(prior periods have been restated to include ACA product sales).
Trailing 4-Quarters Third PartyFee Income, Net $15.8 $16.4 $16.6 $17.6 $17.9

Washington National1Q16 Sales and Di t ib ti R lt
gDistribution Results($ millions)
Quarterly NAP 1Q NAP up 4%
‒ Worksite sales up 27%‒ Individual sales down 7% 1Q15
$22.6
2Q15$25.7
3Q15$25.8
4Q15$26.3
1Q16$23.4
Growth in PMA agent force‒ Average producing agents up 9%
$
Supplemental health collected premiums up 6%
Trailing 4-Quarters NAP $99.8 $100.2 $100.4 $100.4 $101.2
CNO Financial Group | 1Q2016 Earnings | April 28, 2016 8
Supplemental Health Collected Premiums $132.7 $136.1 $138.6 $137.4 $141.1

1Q16 Sales and Di t ib ti R lt
Colonial PennDistribution Results
($ millions)
Quarterly NAP
1Q15$21.1
2Q15 3Q15
1Q16$24.1
1Q NAP up 14%‒ Continued strong sales growth‒ 8th consecutive quarter of YOY growth
2Q15$18.5
3Q15$18.9
4Q15$15.6
Collected premiums up 8%
1Q EBIT of ($6.8) million( )‒ Inforce EBIT of $12.7 million, up 20%
2016 EBIT guidance of $0-6 million
Trailing 4-Quarters NAP $68.9 $70.9 $73.4 $74.1 $77.1
$ $ $ $ $
CNO Financial Group | 1Q2016 Earnings | April 28, 2016 9
Collected Premiums $65.1 $65.1 $66.7 $66.0 $70.1
Inforce EBIT $10.6 $13.3 $14.9 $14.8 $12.7

1Q Consolidated Financial Highlights CNO
Earnings Remain Strong‒ Operating earnings per diluted share* of $0.27; $0.26 excluding significant items
‒ Unfavorable alternative investment results
‒ Operating ROE* of 8.9%; 8.3% excluding significant items
Continued Strength in Cash Flows and Key Capital Measures‒ Estimated consolidated risk-based capital of 441%, reflecting $89 million of dividends paid to
the Holding Companythe Holding Company
‒ Leverage* of 19.8%
‒ Holding company cash and investments of $375 million, essentially flat to year-end 2015
‒ Expect to fully utilize life NOL’ s in 2Q 2016 and begin paying cash taxes in 3Q 2016
‒ Repurchased $90 million of common stock; maintaining 2016 share repurchase guidance range of $275-$375 million, absent compelling alternatives
CNO Financial Group | 1Q2016 Earnings | April 28, 2016 10
g $ $ , p g
* A non-GAAP measure. See the Appendix for a reconciliation to the corresponding GAAP measure.

($ millions)Segment Earnings CNO
1Q16 EarningsSegment EBIT Excluding Significant Items*
$29.1 $31.3
$103.5$114.7
$106.6
$122.2
$84 3
Alternative investment returns negatively impacted Bankers Life and
$28.5 $30.6
$26.3
$84.3 Washington National; Corporate segment results impacted by COLI investments
B k Lif 1Q15 lt fl t
$4 2
$82.2 $86.4
$79.8
$89.1
$69.9
Bankers Life 1Q15 results reflect favorable Medicare supplement claims
C l i l P lt fl t hi h$(1.3)
$(5.0) $(4.4) $(4.9)
$(5.1)$(5.9)
$4.2 $0.6 $6.7
$(6.8)
1Q15 2Q15 3Q15 4Q15 1Q16
Corporate CP BLC WN
Colonial Penn results reflect higher marketing spend to drive profitable growth
CNO Financial Group | 1Q2016 Earnings | April 28, 2016 11* A non-GAAP measure. See the Appendix for a reconciliation to the corresponding GAAP measure.
($ millions)Health Margins CNO
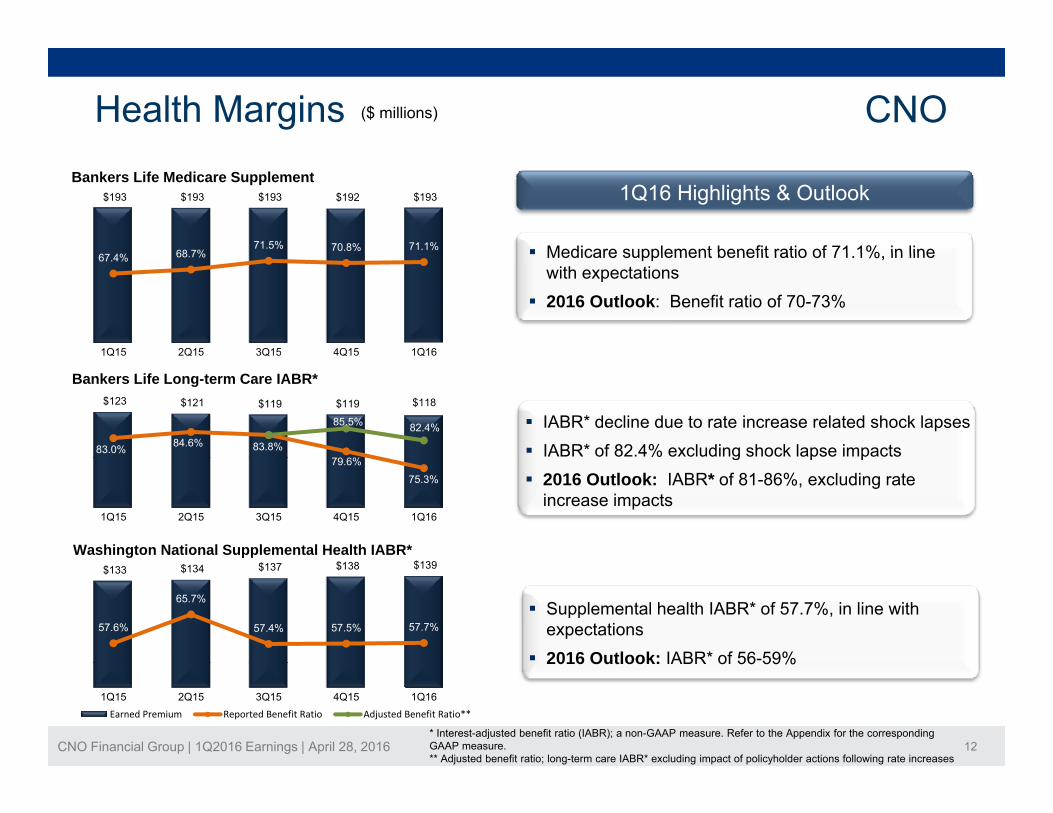
1Q16 Highlights & OutlookBankers Life Medicare Supplement
$193 $193 $193 $192 $193
68 7%71.5% 70.8% 71.1% Medicare supplement benefit ratio of 71 1% in line67.4% 68.7%
1Q15 2Q15 3Q15 4Q15 1Q16
Medicare supplement benefit ratio of 71.1%, in line with expectations
2016 Outlook: Benefit ratio of 70-73%
Bankers Life Long-term Care IABR*
1Q15 2Q15 3Q15 4Q15 1Q16
$123 $121 $119 $119 $118
83.0% 84.6% 83.8%79 6%
85.5% 82.4% IABR* decline due to rate increase related shock lapses IABR* of 82.4% excluding shock lapse impacts
$Washington National Supplemental Health IABR*
79.6%
75.3%
1Q15 2Q15 3Q15 4Q15 1Q16
g p p 2016 Outlook: IABR* of 81-86%, excluding rate
increase impacts
$133 $134 $137 $138 $139
57.6%
65.7%
57.4% 57.5% 57.7% Supplemental health IABR* of 57.7%, in line with
expectations 2016 Outlook: IABR* of 56-59%
CNO Financial Group | 1Q2016 Earnings | April 28, 2016 12
1Q15 2Q15 3Q15 4Q15 1Q16Earned Premium Reported Benefit Ratio Adjusted Benefit Ratio**
* Interest-adjusted benefit ratio (IABR); a non-GAAP measure. Refer to the Appendix for the corresponding GAAP measure. ** Adjusted benefit ratio; long-term care IABR* excluding impact of policyholder actions following rate increases
2016 Outlook: IABR of 56 59%

Investment Results CNO($ millions)( )
Average Invested Assets and Cash Realized Gains, Losses and Impairments
Gross Realized Gains$21,854 $21,956 $22,042 $22,219 $22,323
$10.0
Gross Realized Gains
Gross Realized Losses
Impairments$66.8
$ , ,
$300.1 $302.1 $298.2 $303.2 $291.0 Net Investment Income
$102.2 $103.1
$48.5
$93.1
$1 3 $7.9
$12.4
$18.3
$20.2**$22.6
$13 2
$23.3 $23.1
$42.7$51.0
1Q15 2Q15 3Q15 4Q15 1Q16
co e
$21.3 $15.4 $30.3 $1.3 $
Earned Yield*: 5.81% 5.78% 5.68% 5.72% 5.47%
New Money Rate: 5.36% 5.06% 5.21% 5.17% 4.90%
Pre-Pay / Call / Make-whole Income: $5.1 $9.9 $5.6 $10.3 $6.3
1Q15 2Q15 3Q15 4Q15
$13.21Q15 2Q15 3Q15 4Q15 1Q16
1Q16
Higher level of realized gains and losses due to repositioning in energy, CMBS, and emerging markets
Tightening spreads facilitated energy and emerging markets exposure reductions of $225 million (13%) and $148 million (23%) respectively
Alternative Investment Income: $6.1 $0.7 ($0.3) ($0.5) ($3.7)
New money rate benefited from wider spreads in early 1Q, but we remain reluctant to change risk appetite in
t t f l t i ld
CNO Financial Group | 1Q2016 Earnings | April 28, 2016 13* Earned Yield excludes FHLB.** Excludes $11.3 million gain on dissolution of variable interest entity.
(23%), respectively
Limited impairments
context of lower treasury yields
Alternative investment income down $10 million

CNOWrap-up
Committed to priorities and longer term objectives
‒ Re-energize growth, including ramp-up of BD/RIA‒ Focus on ROE expansion
Effective capital deployment‒ Effective capital deployment‒ Remain committed to reducing LTC exposure over time
Executive leadership changes aligned with driving profitable growth
CNO Financial Group | 1Q2016 Earnings | April 28, 2016 14

Questions and Answers
CNO Financial Group | 1Q2016 Earnings | April 28, 2016 15

Appendix
CNO Financial Group | 1Q2016 Earnings | April 28, 2016 16

Energy Sector Overview March 31 2016March 31, 2016
18%8%
1% 2%
A or Better
Overall exposure down $225 million (13%) from year-end 2015 due to portfolio repositioning
BBB
BB
B
Remaining exposure is reasonably calibrated to enterprise capital, is highly diversified, and has improved risk characteristics
Net unrealized loss substantially reduced from $104mm t d t $53 t 3/31/16
71%
CCC or Lowerat year-end to $53mm at 3/31/16
1Q16 NAIC downgrades of $91 million or 3 RBC points (within range of expectations)
Despite 1Q downgrades, exposure remains substantially
6%
12%3%
Midstream
Independent E&P
Despite 1Q downgrades, exposure remains substantially IG (90%)
HY (10%) weighted towards higher rated BB category and less volatile sectors (e.g., midstream)
F 2016 t t i ifi t i t f l t l
51%
28%
6% p
Oilfield Services
Integrated
Other
For 2016, expect most significant impact of long term low oil prices to be downgrades (RBC)
Portfolio underwritten to withstand a prolonged period of $30 oil
CNO Financial Group | 1Q2016 Earnings | April 28, 2016 17
28%

Producing Agent Counts
1st Yr 2nd Yr 3rd Yr + Total Qtr Avg (3) 1st Yr 2nd Yr 3rd Yr + Total Qtr Avg (3)
3/31/2016 2,182 626 1,895 4,703 4,548 418 117 372 907 904
Bankers Life (1) Washington National (2)
, , , ,
12/31/2015 2,051 584 1,927 4,562 4,565 410 127 367 904 899
9/30/2015 2,077 601 1,871 4,549 4,693 411 115 365 891 892
6/30/2015 2,484 606 1,891 4,981 4,939 423 132 346 901 882
3/31/2015 2,468 657 1,894 5,019 4,850 344 127 340 811 830
12/31/2014 2,258 664 1,868 4,790 4,842 365 128 337 830 831
12/31/2013 2,557 693 1,718 4,968 5,046 335 112 296 743 756
12/31/2012 2 429 662 1 600 4 691 4 850 298 108 269 675 68712/31/2012 2,429 662 1,600 4,691 4,850 298 108 269 675 687
12/31/2011 2,461 600 1,587 4,648 4,702
12/31/2010 2,199 668 1,486 4,353 4,391
12/31/2009 2,564 662 1,513 4,739 4,742
12/31/2008 2 489 651 1 324 4 464 4 41712/31/2008 2,489 651 1,324 4,464 4,417
12/31/2007 2,198 554 1,231 3,983 4,034
(1) Defined as the number of agents that have sold at least one policy in the period(2) Defined as active PMA appointed agents with $1,000 or more of New Annualized Premium in the prior 12 months(3) Agent counts at the end of each month used to calculate the average for the quarter
CNO Financial Group | 1Q2016 Earnings | April 28, 2016 18
(3) Agent counts at the end of each month used to calculate the average for the quarter
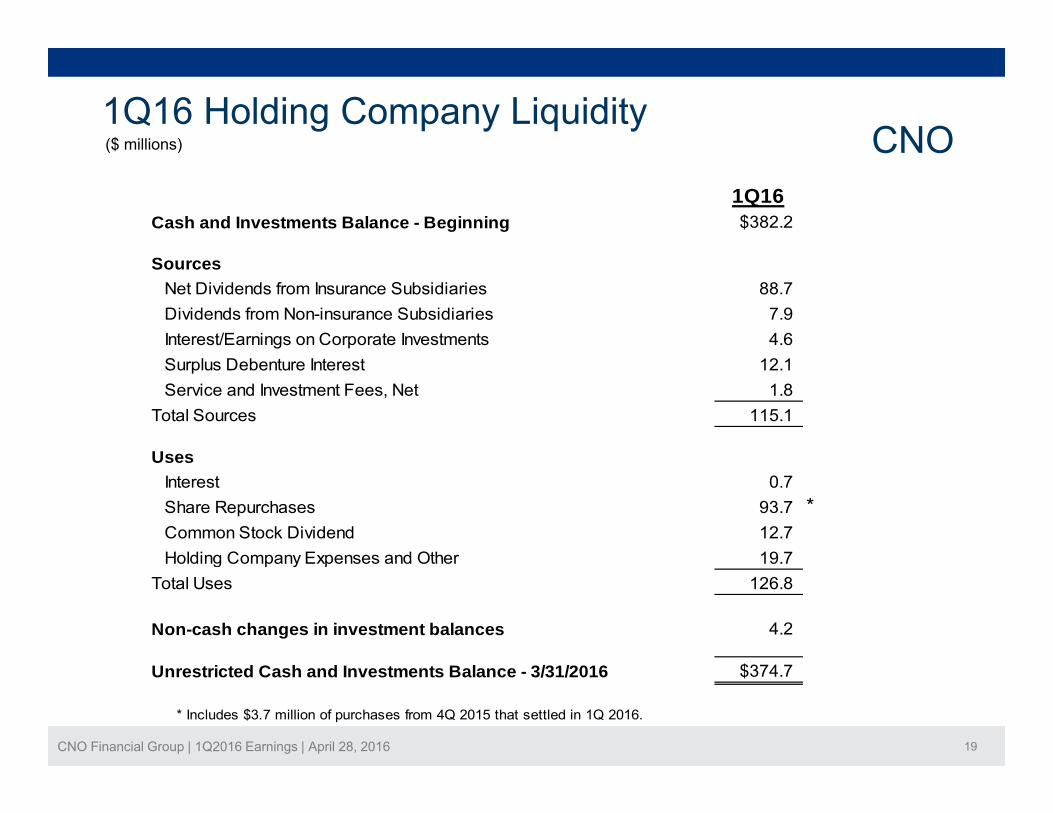
1Q16 Holding Company LiquidityCNO($ millions) CNO($ )
1Q16Cash and Investments Balance - Beginning $382.2
SourcesNet Dividends from Insurance Subsidiaries 88.7 Dividends from Non-insurance Subsidiaries 7.9 Interest/Earnings on Corporate Investments 4.6Surplus Debenture Interest 12.1Service and Investment Fees, Net 1.8
Total Sources 115.1
UsesUsesInterest 0.7Share Repurchases 93.7 *Common Stock Dividend 12.7Holding Company Expenses and Other 19 7Holding Company Expenses and Other 19.7
Total Uses 126.8
Non-cash changes in investment balances 4.2
CNO Financial Group | 1Q2016 Earnings | April 28, 2016 19
Unrestricted Cash and Investments Balance - 3/31/2016 $374.7
* Includes $3.7 million of purchases from 4Q 2015 that settled in 1Q 2016.

Leveraging Considerable Tax Assets CNO($ millions)($ millions)
1Q 2016 Loss Carryforwards Outlook and Value
Life$37
v Expect modest future valuation allowance releases
$883*
Non-Life
Life NOL’s expected to be fully utilized in 2Q 2016, reducing cash flows an estimated $15 million per quarter starting in 3Q 2016
Non Life$846
$177**
Majority of non-life NOL’s expire in 2023
Estimated economic value of $500 million @ 10% discount rate
Non-Life
Loss Carryforwards Valuation Allowance
CNO Financial Group | 1Q2016 Earnings | April 28, 2016 20
* Excludes $14 million related to state operating loss carryforwards and $12 million related to capital loss carryforwards.** Excludes $10 million related to state operating loss carryforwards and $7 million related to capital loss carryforwards.

f f f 1Q201
1Q15 Significant Items CNOThe table below summarizes the financial impact of the significant item on our 1Q2015 net operating income. Management believes that identifying the impact of these items enhances the understanding of our operating results (dollars in millions).
Three months ended
March 31, 2015*
E l di
Net Operating Income:
Bankers Life $ 82.2 $ - $ 82.2
Washington National
Actual results Significant items
Excluding significant
items
28 5 - 28 5Washington National
Colonial Penn
EBIT from business segments
Corporate Operations, excluding corporate interest expense
EBIT
104.8
28.5 - 28.5
- 103.5
(5.9) - (5.9)
104.8 -
(1.3) - (1.3)
103.5
Corporate interest expense
Operating earnings before tax
Tax expense on operating income
Net operating income * $ 60.1 $ - $ 60.1
(10.5) - (10.5)
93.0 - 93.0
32.9 - 32.9
Net operating income per diluted share* $ 0.30 $ - $ 0.30
* We had previously included one significant item in our 1Q15 net operating income analysis which represented the $1.9 million after tax impact of unfavorable supplemental health reserve developments in the Washington National segment related to claims incurred in prior periods. After a comprehensive review of claims conducted in 2Q15, it was ultimately determined that the claims liability at March 31, 2015 for supplemental health claims incurred in 1Q15 was deficient by a similar amount. Accordingly, we are no longer reporting this as a significant item.
CNO Financial Group | 1Q2016 Earnings | April 28, 2016 21
* A non-GAAP measure. See pages 26 and 28 for a reconciliation to the corresponding GAAP measure.
f f f 2Q201
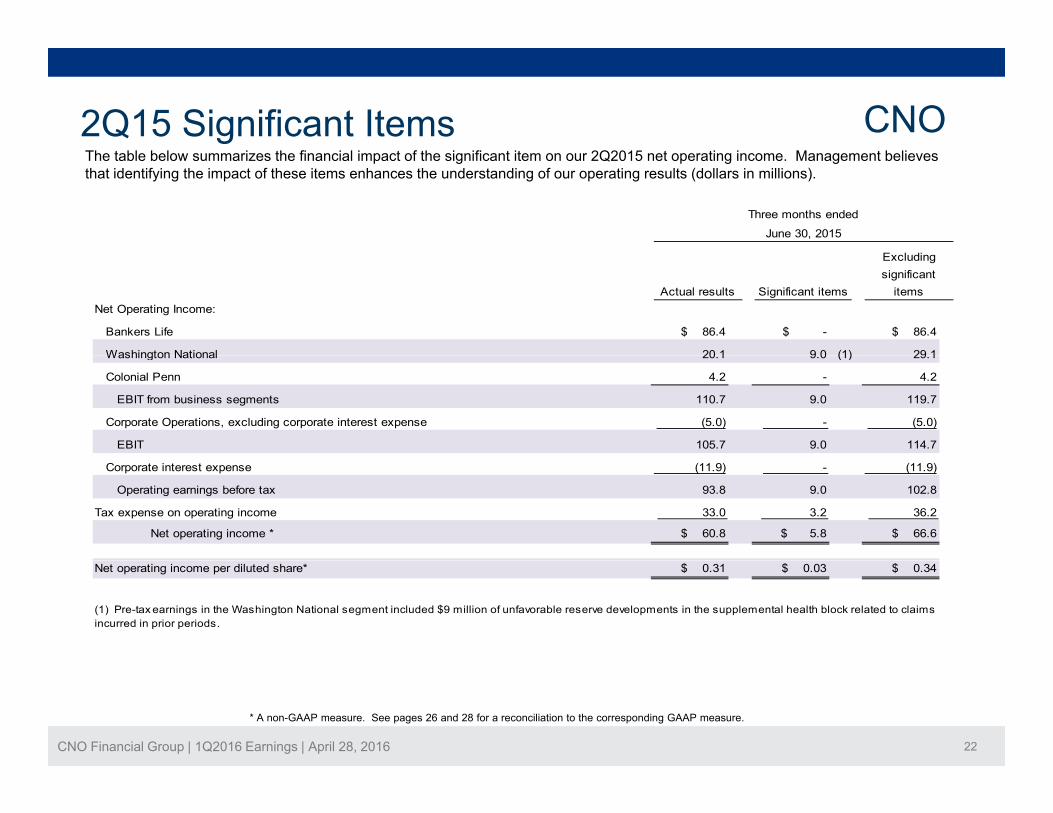
2Q15 Significant Items CNOThe table below summarizes the financial impact of the significant item on our 2Q2015 net operating income. Management believes that identifying the impact of these items enhances the understanding of our operating results (dollars in millions).
Three months ended
June 30, 2015
E l di
Net Operating Income:
Bankers Life $ 86.4 $ - $ 86.4
Washington National (1)20 1 9 0 29 1
Actual results Significant items
Excluding significant
items
Washington National (1)
Colonial Penn
EBIT from business segments
Corporate Operations, excluding corporate interest expense
EBIT
(5.0) - (5.0)
105.7 9.0 114.7
4.2 - 4.2
110.7 9.0 119.7
20.1 9.0 29.1
Corporate interest expense
Operating earnings before tax
Tax expense on operating income
Net operating income * $ 60.8 $ 5.8 $ 66.6
93.8 9.0 102.8
33.0 3.2 36.2
(11.9) - (11.9)
Net operating income per diluted share* $ 0.31 $ 0.03 $ 0.34
(1) Pre-tax earnings in the Washington National segment included $9 million of unfavorable reserve developments in the supplemental health block related to claims incurred in prior periods.
CNO Financial Group | 1Q2016 Earnings | April 28, 2016 22
* A non-GAAP measure. See pages 26 and 28 for a reconciliation to the corresponding GAAP measure.
f f f 3Q201
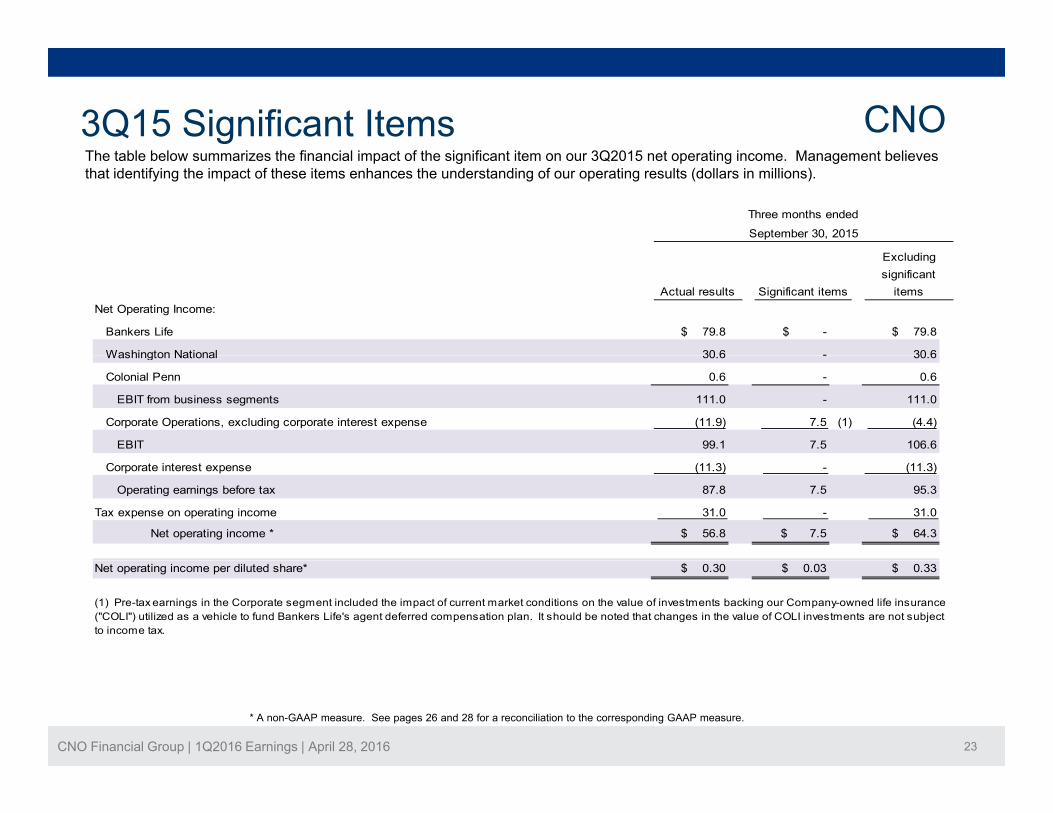
3Q15 Significant Items CNOThe table below summarizes the financial impact of the significant item on our 3Q2015 net operating income. Management believes that identifying the impact of these items enhances the understanding of our operating results (dollars in millions).
Three months ended
September 30, 2015
E l di
Net Operating Income:
Bankers Life $ 79.8 $ - $ 79.8
Washington National 30 6 - 30 6
Actual results Significant items
Excluding significant
items
Washington National
Colonial Penn
EBIT from business segments
Corporate Operations, excluding corporate interest expense (1)
EBIT
(11.9) 7.5 (4.4)
99.1 7.5 106.6
0.6 - 0.6
111.0 - 111.0
30.6 - 30.6
Corporate interest expense
Operating earnings before tax
Tax expense on operating income
Net operating income * $ 56.8 $ 7.5 $ 64.3
87.8 7.5 95.3
31.0 - 31.0
(11.3) - (11.3)
Net operating income per diluted share* $ 0.30 $ 0.03 $ 0.33
(1) Pre-tax earnings in the Corporate segment included the impact of current market conditions on the value of investments backing our Company-owned life insurance ("COLI") utilized as a vehicle to fund Bankers Life's agent deferred compensation plan. It should be noted that changes in the value of COLI investments are not subject to income tax.
CNO Financial Group | 1Q2016 Earnings | April 28, 2016 23
* A non-GAAP measure. See pages 26 and 28 for a reconciliation to the corresponding GAAP measure.

f f f Q201
4Q15 Significant Items CNOThe table below summarizes the financial impact of the significant item on our 4Q2015 net operating income. Management believes that identifying the impact of these items enhances the understanding of our operating results (dollars in millions).
Three months ended
December 31, 2015
Excluding
Net Operating Income:
Bankers Life $ 121.2 $ (32.1) (1) $ 89.1
Washington National (2)
Actual results Significant items
Excluding significant
items
32.3 (1.0) 31.3
Colonial Penn
EBIT from business segments
Corporate Operations, excluding corporate interest expense (3)
EBIT
C t i t t
127.1
(37.3) 122.2
(11 3) (11 3)
6.7 - 6.7
160.2 (33.1)
(0.7) (4.2) (4.9)
159.5
Corporate interest expense
Operating earnings before tax
Tax expense on operating income
Net operating income * $ 97.0 $ (25.7) $ 71.3
Net operating income per diluted share* $ 0 52 $ (0 14) $ 0 38
(11.3) - (11.3)
148.2 (37.3) 110.9
51.2 (11.6) 39.6
Net operating income per diluted share* $ 0.52 $ (0.14) $ 0.38
(2) Pre-tax earnings in the Washington National segment included $1.0 million of favorable impacts from our comprehensive annual actuarial review.
(1) Pre-tax earnings in the Bankers segment included: (i) $25.8 million of favorable impacts from our comprehensive annual actuarial review including the net impact from model enhancements and changes in assumptions related to mortality, long-term interest rates and the spread earned on fixed index annuities; and (ii) the $6.3 million release of long-term care reserves (net of the reduction in insurance intangibles) due to the impact of policyholder actions following rate increases.
CNO Financial Group | 1Q2016 Earnings | April 28, 2016 24
* A non-GAAP measure. See pages 26 and 28 for a reconciliation to the corresponding GAAP measure.
(3) Pre-tax earnings in the Corporate segment included a $4.2 million positive impact of current market conditions on the value of investments backing our Company-owned life insurance ("COLI") used as a vehicle to fund Bankers Life's agent deferred compensation plan.
f f f 1Q2016
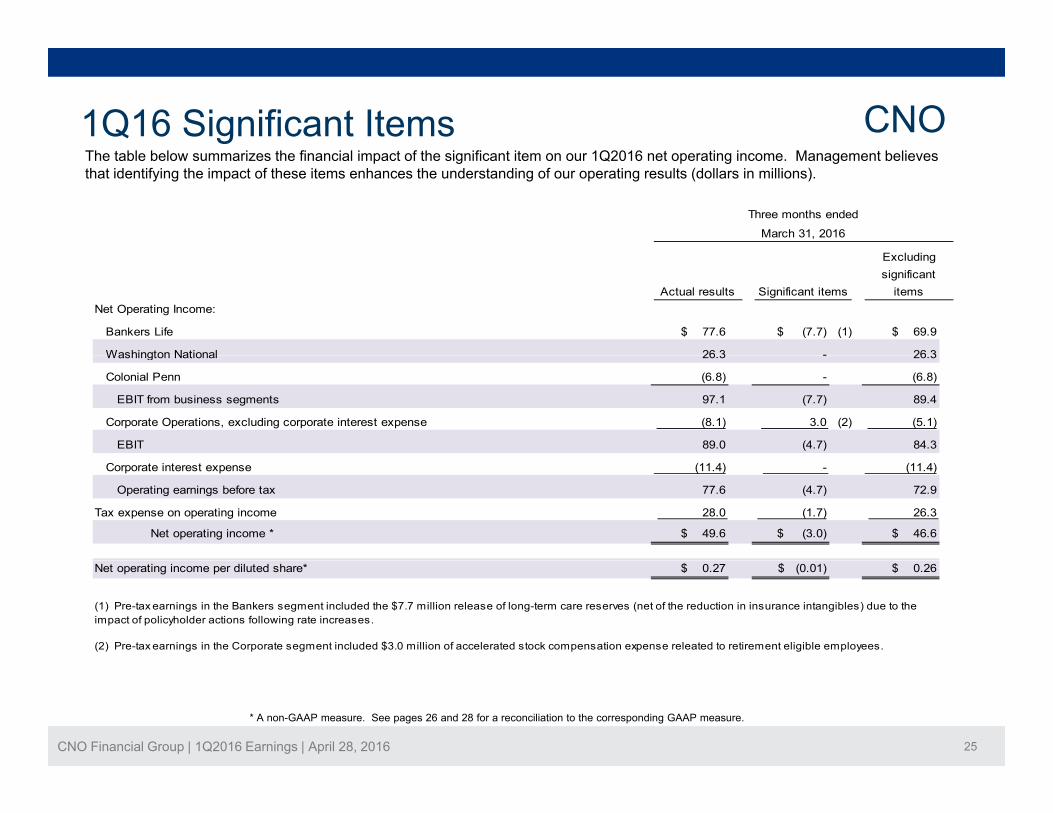
1Q16 Significant Items CNOThe table below summarizes the financial impact of the significant item on our 1Q2016 net operating income. Management believes that identifying the impact of these items enhances the understanding of our operating results (dollars in millions).
Three months ended
March 31, 2016
E l di
Net Operating Income:
Bankers Life $ 77.6 $ (7.7) (1) $ 69.9
Washington National
Actual results Significant items
Excluding significant
items
26 3 - 26 3Washington National
Colonial Penn
EBIT from business segments
Corporate Operations, excluding corporate interest expense (2)
EBIT
89.4
26.3 - 26.3
(4.7) 84.3
(6.8) - (6.8)
97.1 (7.7)
(8.1) 3.0 (5.1)
89.0
Corporate interest expense
Operating earnings before tax
Tax expense on operating income
Net operating income * $ 49.6 $ (3.0) $ 46.6
(11.4) - (11.4)
77.6 (4.7) 72.9
28.0 (1.7) 26.3
Net operating income per diluted share* $ 0.27 $ (0.01) $ 0.26
(2) Pre-tax earnings in the Corporate segment included $3.0 million of accelerated stock compensation expense releated to retirement eligible employees.
(1) Pre-tax earnings in the Bankers segment included the $7.7 million release of long-term care reserves (net of the reduction in insurance intangibles) due to the impact of policyholder actions following rate increases.
CNO Financial Group | 1Q2016 Earnings | April 28, 2016 25
* A non-GAAP measure. See pages 26 and 28 for a reconciliation to the corresponding GAAP measure.

Quarterly Earnings CNOy g
1Q15 2Q15 3Q15 4Q15 1Q16Bankers Life 82.2$ 86.4$ 79.8$ 121.2$ 77.6$
($ millions)
Washington National 28.5 20.1 30.6 32.3 26.3 Colonial Penn (5.9) 4.2 0.6 6.7 (6.8)
EBIT from business segments 104.8 110.7 111.0 160.2 97.1 Corporate operations, excluding interest expense (1.3) (5.0) (11.9) (0.7) (8.1) EBIT* 103.5 105.7 99.1 159.5 89.0 Corporate interest expense (10.5) (11.9) (11.3) (11.3) (11.4) p p ( ) ( ) ( ) ( ) ( ) Operating earnings before taxes 93.0 93.8 87.8 148.2 77.6 Tax expense on period income 32.9 33.0 31.0 51.2 28.0 Net operating income 60.1 60.8 56.8 97.0 49.6 Net realized investment gains (losses), net of related amortization and taxes (1.4) (6.8) (12.3) (10.3) (0.6) Fair value changes in embedded derivative liabilities, net of related amortization and taxes (8.3) 16.8 (10.2) 9.4 (19.2) Fair value changes related to the agent deferred compensation plan net of taxes - - - 9 8 (3 9)Fair value changes related to the agent deferred compensation plan, net of taxes 9.8 (3.9) Loss on extinguishment of debt, net of taxes - (21.3) - - - Valuation allowance for deferred tax assets and other tax items - - - 32.5 20.0 Other 2.4 (2.7) (0.5) (1.1) (0.4) Net income 52.8$ 46.8$ 33.8$ 137.3$ 45.5$
*Management believes that an analysis of earnings before net realized investment gains (losses), fair value changes in embedded derivative liabilities, fair value changes related to the agent deferred compensation plan, loss on extinguishment of debt, other non-operating items, corporate interest expense and taxes (“EBIT,” a non-GAAP financial measure) provides a clearer comparison of the operating results of the company quarter-over-quarter because it excludes: (1) net realized investment gains (losses); (2) fair value changes due to fluctuations in the interest rates used to discount embedded derivative liabilities related to our fixed index annuities that are unrelated to the company’s underlying fundamentals; (3) fair value changes related to the agent deferred compensation plan; (4) loss on extinguishment of debt; (5) charges in the valuation allowance for deferred tax assets; and (6) other non-operating items consisting primarily of equity in earnings of certain non-strategic investments and earnings attributable to variable interest entities The table above provides a reconciliation of EBIT
CNO Financial Group | 1Q2016 Earnings | April 28, 2016 26
items consisting primarily of equity in earnings of certain non strategic investments and earnings attributable to variable interest entities. The table above provides a reconciliation of EBIT to net income.

Information Related to Certain Non-GAAP Financial Measures
The following provides additional information regarding certain non-GAAP measures used in this presentation. A non-GAAP measure is a numerical measure of a company’s performance, financial position, or cash flows that excludes or includes amounts that are normally excluded or included in the most directly comparable measure calculated and presented in accordance with GAAP. While management believes these measures are useful to enhance understanding and comparability of our financial results these non-GAAP measuresare useful to enhance understanding and comparability of our financial results, these non-GAAP measures should not be considered as substitutes for the most directly comparable GAAP measures. Additional information concerning non-GAAP measures is included in our periodic filings with the Securities and Exchange Commission that are available in the “Investors – SEC Filings” section of CNO’s website, www.CNOinc.com.
Operating earnings measuresManagement believes that an analysis of net income applicable to common stock before net realized gains or losses, fair value changes due to fluctuations in the interest rates used to discount embedded derivative liabilities related to our fixed index annuities, fair value changes related to the agent deferred compensation plan, loss on extinguishment of debt, changes in our valuation allowance for deferred tax assets and other non-operating items consisting primarily of equity in earnings of certain non-strategic investments andnon-operating items consisting primarily of equity in earnings of certain non-strategic investments and earnings attributable to variable interest entities (“net operating income,” a non-GAAP financial measure) is important to evaluate the performance of the Company and is a key measure commonly used in the life insurance industry. Management uses this measure to evaluate performance because these items are unrelated to the Company’s continuing operations.
CNO Financial Group | 1Q2016 Earnings | April 28, 2016 27
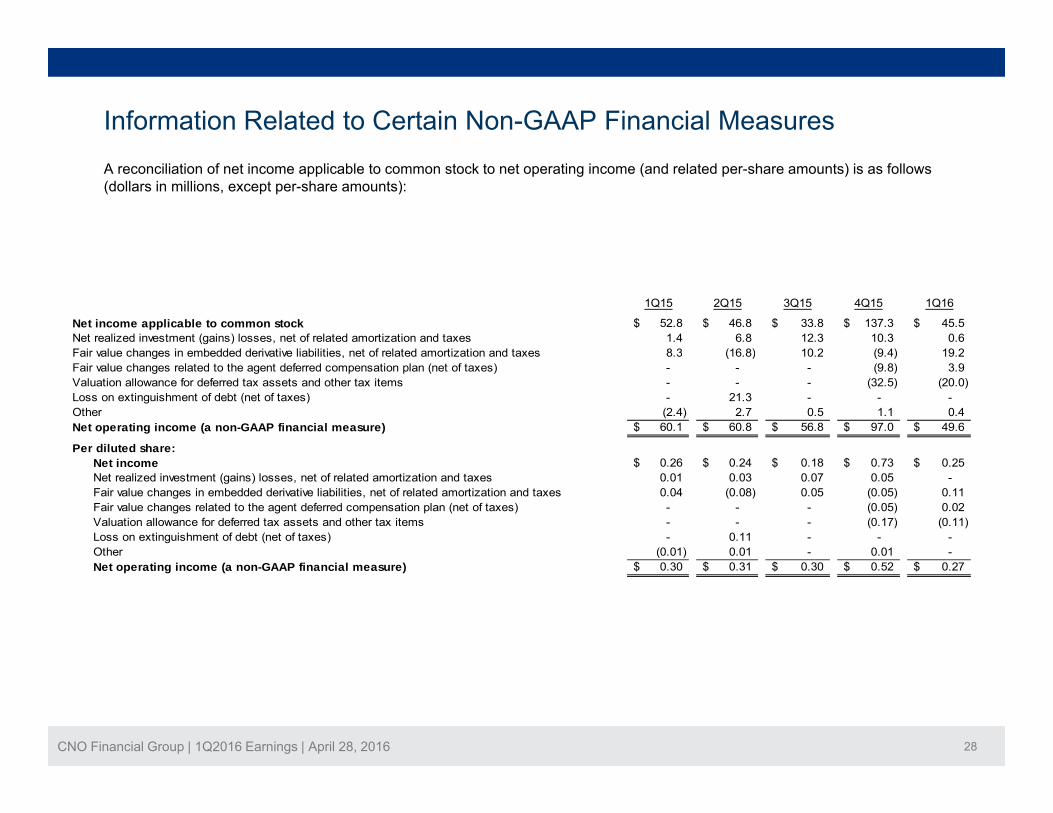
Information Related to Certain Non-GAAP Financial MeasuresA reconciliation of net income applicable to common stock to net operating income (and related per-share amounts) is as follows (dollars in millions, except per-share amounts):
1Q15 2Q15 3Q15 4Q15 1Q16
Net income applicable to common stock 52.8$ 46.8$ 33.8$ 137.3$ 45.5$ Net realized investment (gains) losses, net of related amortization and taxes 1.4 6.8 12.3 10.3 0.6 Fair value changes in embedded derivative liabilities, net of related amortization and taxes 8.3 (16.8) 10.2 (9.4) 19.2Fair value changes in embedded derivative liabilities, net of related amortization and taxes 8.3 (16.8) 10.2 (9.4) 19.2 Fair value changes related to the agent deferred compensation plan (net of taxes) - - - (9.8) 3.9 Valuation allowance for deferred tax assets and other tax items - - - (32.5) (20.0) Loss on extinguishment of debt (net of taxes) - 21.3 - - - Other (2.4) 2.7 0.5 1.1 0.4 Net operating income (a non-GAAP financial measure) 60.1$ 60.8$ 56.8$ 97.0$ 49.6$
Per diluted share:$ $ $ $ $Net income 0.26$ 0.24$ 0.18$ 0.73$ 0.25$
Net realized investment (gains) losses, net of related amortization and taxes 0.01 0.03 0.07 0.05 - Fair value changes in embedded derivative liabilities, net of related amortization and taxes 0.04 (0.08) 0.05 (0.05) 0.11 Fair value changes related to the agent deferred compensation plan (net of taxes) - - - (0.05) 0.02 Valuation allowance for deferred tax assets and other tax items - - - (0.17) (0.11) Loss on extinguishment of debt (net of taxes) - 0.11 - - - Other (0.01) 0.01 - 0.01 - Net operating income (a non-GAAP financial measure) 0.30$ 0.31$ 0.30$ 0.52$ 0.27$
CNO Financial Group | 1Q2016 Earnings | April 28, 2016 28
Information Related to Certain Non-GAAP Financial Measures
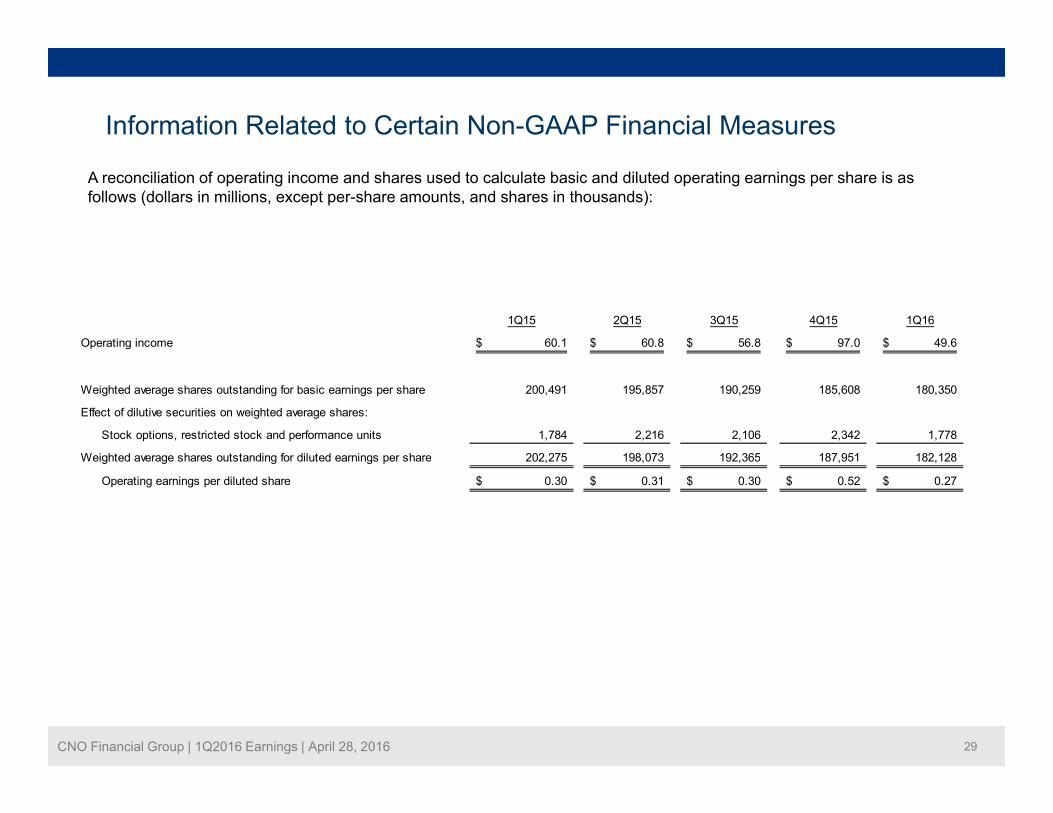
A reconciliation of operating income and shares used to calculate basic and diluted operating earnings per share is as follows (dollars in millions, except per-share amounts, and shares in thousands):
1Q15 2Q15 3Q15 4Q15 1Q16
Operating income 60.1$ 60.8$ 56.8$ 97.0$ 49.6$
Weighted average shares outstanding for basic earnings per share 200,491 195,857 190,259 185,608 180,350
Effect of dilutive securities on weighted average shares:
Stock options, restricted stock and performance units 1,784 2,216 2,106 2,342 1,778
Weighted average shares outstanding for diluted earnings per share 202 275 198 073 192 365 187 951 182 128Weighted average shares outstanding for diluted earnings per share 202,275 198,073 192,365 187,951 182,128
Operating earnings per diluted share 0.30$ 0.31$ 0.30$ 0.52$ 0.27$
CNO Financial Group | 1Q2016 Earnings | April 28, 2016 29
B k l dil t d h
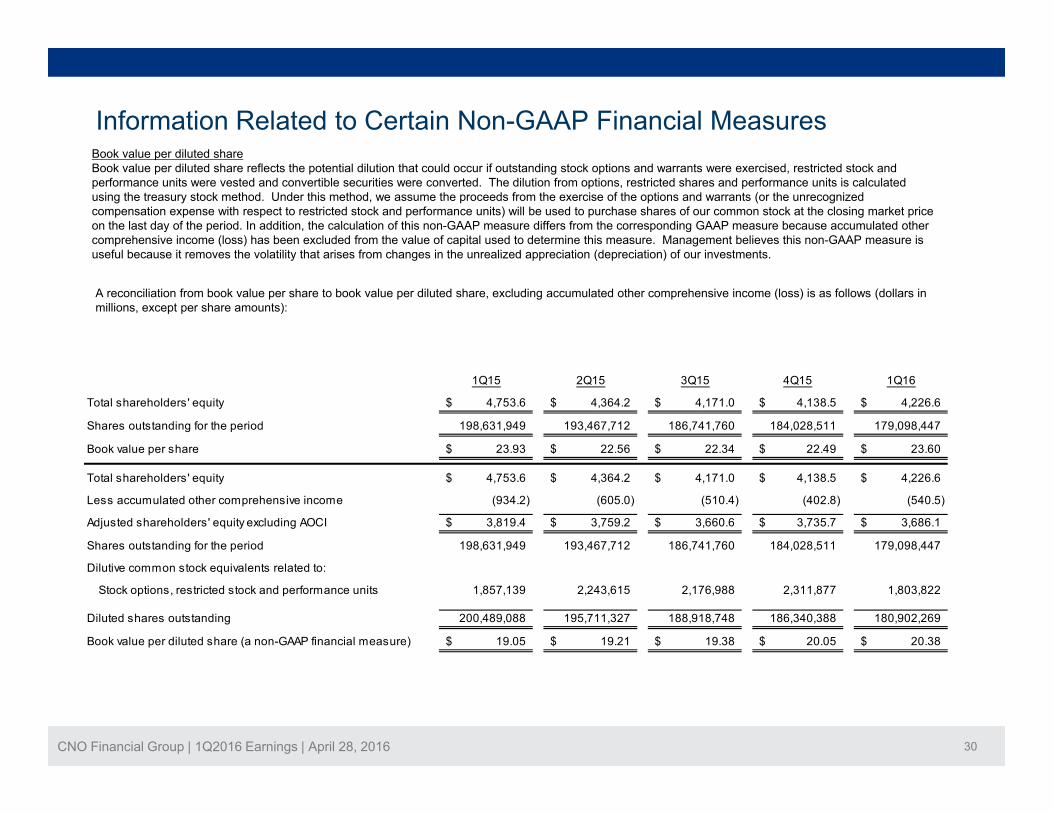
Information Related to Certain Non-GAAP Financial MeasuresBook value per diluted shareBook value per diluted share reflects the potential dilution that could occur if outstanding stock options and warrants were exercised, restricted stock and performance units were vested and convertible securities were converted. The dilution from options, restricted shares and performance units is calculated using the treasury stock method. Under this method, we assume the proceeds from the exercise of the options and warrants (or the unrecognized compensation expense with respect to restricted stock and performance units) will be used to purchase shares of our common stock at the closing market price on the last day of the period. In addition, the calculation of this non-GAAP measure differs from the corresponding GAAP measure because accumulated other comprehensive income (loss) has been excluded from the value of capital used to determine this measure. Management believes this non-GAAP measure is useful because it removes the volatility that arises from changes in the unrealized appreciation (depreciation) of our investmentsuseful because it removes the volatility that arises from changes in the unrealized appreciation (depreciation) of our investments.
A reconciliation from book value per share to book value per diluted share, excluding accumulated other comprehensive income (loss) is as follows (dollars in millions, except per share amounts):
1Q15 2Q15 3Q15 4Q15 1Q16
Total shareholders' equity 4,753.6$ 4,364.2$ 4,171.0$ 4,138.5$ 4,226.6$
Shares outstanding for the period 198,631,949 193,467,712 186,741,760 184,028,511 179,098,447
Book value per share 23.93$ 22.56$ 22.34$ 22.49$ 23.60$
Total shareholders' equity 4,753.6$ 4,364.2$ 4,171.0$ 4,138.5$ 4,226.6$
Less accumulated other comprehensive income (934.2) (605.0) (510.4) (402.8) (540.5)
Adjusted shareholders' equity excluding AOCI 3,819.4$ 3,759.2$ 3,660.6$ 3,735.7$ 3,686.1$
Shares outstanding for the period 198,631,949 193,467,712 186,741,760 184,028,511 179,098,447
Dilutive common stock equivalents related to:
Stock options, restricted stock and performance units 1,857,139 2,243,615 2,176,988 2,311,877 1,803,822
Diluted shares outstanding 200,489,088 195,711,327 188,918,748 186,340,388 180,902,269
Book value per diluted share (a non-GAAP financial measure) 19.05$ 19.21$ 19.38$ 20.05$ 20.38$
CNO Financial Group | 1Q2016 Earnings | April 28, 2016 30

Information Related to Certain Non-GAAP Financial Measures
The interest-adjusted benefit ratio (a non-GAAP measure) is calculated by dividing the product's insurance policy benefits less imputed interest income on the accumulated assets backing the insurance liabilities by insurance policy income. Interest income is an important factor in measuring the performance of longer duration health products. The net cash flows generally cause an accumulation of amounts in the early years of a policy (accounted for as reserve increases), which will be paid out as benefits in later policy years (accounted for as reserve decreases) Accordingly as the policies age the benefit ratio will typically increase but
Interest-adjusted benefit ratios
later policy years (accounted for as reserve decreases). Accordingly, as the policies age, the benefit ratio will typically increase, but the increase in the change in reserve will be partially offset by the imputed interest income earned on the accumulated assets. The interest-adjusted benefit ratio reflects the effects of such interest income offset. Since interest income is an important factor in measuring the performance of these products, management believes a benefit ratio, which includes the effect of interest income, is useful in analyzing product performance. The interest-adjusted benefit ratio excluding the impact of rate increases eliminates the release of reserves due to the impact of policyholder actions following rate increases.
1Q15 2Q15 3Q15 4Q15 1Q16
Bankers LifeLong-term care benefit ratiosEarned premium 122 6$ 120 5$ 119 0$ 118 6$ 118 5$Earned premium 122.6$ 120.5$ 119.0$ 118.6$ 118.5$ Benefit ratio before imputed interest income on reserves 137.8% 140.7% 141.1% 137.1% 132.9%Interest-adjusted benefit ratio 83.0% 84.6% 83.8% 79.6% 75.3%Interest-adjusted benefit ratio, exluding the impact of reserve releases due to rate increases 83.0% 84.6% 83.8% 85.5% 82.4%Underwriting margin (earned premium plus imputed interest income on reserves less policy benefits) 20.8$ 18.6$ 19.3$ 24.2$ 29.3$ Adjusted underwriting margin (excluding the impact of reserve releases due to rate increases) 20.8 18.6 19.3 17.2 20.9
Washington NationalSupplemental health benefit ratiosEarned premium 132.8$ 134.4$ 136.6$ 138.0$ 139.2$ Benefit ratio before imputed interest income on reserves 82.4% 90.3% 81.7% 81.8% 81.2%Interest-adjusted benefit ratio 57.6% 65.7% 57.4% 57.5% 57.7%Underwriting margin (earned premium plus imputed interest income on reserves less policy benefits) 56.2$ 46.1$ 58.2$ 58.6$ 58.9$
CNO Financial Group | 1Q2016 Earnings | April 28, 2016 31
g g ( p p p p y ) $ $ $ $ $

Information Related to Certain Non-GAAP Financial MeasuresOperating return measuresManagement believes that an analysis of net income applicable to common stock before the net loss on sale of CLIC and gain (loss) on reinsurance transactions, the earnings of CLIC prior to being sold, net realized gains or losses, fair value changes due to fluctuations in the interest rates used to discount embedded derivative liabilities related to our fixed index annuities, fair value changes related to the agent deferred compensation plan, loss on extinguishment of d bt h i l ti ll f d f d t t d th ti it i ti i il fdebt, changes in our valuation allowance for deferred tax assets and other non-operating items consisting primarily of equity in earnings of certain non-strategic investments and earnings attributable to variable interest entities (“net operating income,” a non-GAAP financial measure) is important to evaluate the performance of the Company and is a key measure commonly used in the life insurance industry. Management uses this measure to evaluate performance because these items are unrelated to the Company’s continuing operations.
Management also believes that an operating return, excluding significant items, is important as the impact of these items enhances the understanding of our operating results.
This non-GAAP financial measure also differs from return on equity because accumulated other comprehensive income (loss) has been excluded from the value of equity used to determine this ratio. Management believes this non-GAAP financial measure is useful because it removes the volatility that arises from changes in accumulated other comprehensive income (loss). Such volatility is often caused by changes in the estimated fair value of our investment portfolio resulting from changes in general market interest rates rather than the business decisions made by management.
In addition our equity includes the value of significant net operating loss carryforwards (included in income tax assets)In addition, our equity includes the value of significant net operating loss carryforwards (included in income tax assets). In accordance with GAAP, these assets are not discounted, and accordingly will not provide a return to shareholders (until after it is realized as a reduction to taxes that would otherwise be paid). Management believes that excluding this value from the equity component of this measure enhances the understanding of the effect these non-discounted assets have on operating returns and the comparability of these measures from period-to-period. Operating return measures are used in measuring the performance of our business units and are used as a basis for incentive
CNO Financial Group | 1Q2016 Earnings | April 28, 2016 32
measures are used in measuring the performance of our business units and are used as a basis for incentive compensation.

Information Related to Certain Non-GAAP Financial MeasuresTh l l ti f (i) ti t it l di l t d th h i i (l ) d tThe calculations of: (i) operating return on equity, excluding accumulated other comprehensive income (loss) and net operating loss carryforwards (a non-GAAP financial measure); (ii) operating return, excluding significant items, on equity, excluding accumulated other comprehensive income (loss) and net operating loss carryforwards (a non-GAAP financial measure); and (iii) return on equity are as follows (dollars in millions):
Trailing twelve months ended
1Q15 2Q15 3Q15 4Q15 1Q16
Operating income 277.1$ 266.6$ 246.8$ 274.7$ 264.2$
Operating income, excluding significant items 270.6$ 265.9$ 260.7$ 262.3$ 248.8$
Trailing twelve months ended
Net Income 332.2$ 300.9$ 217.3$ 270.7$ 263.4$
Average common equity, excluding accumulated othercomprehensive income (loss) and net operating losscarryforwards (a non-GAAP financial measure) 3,029.3$ 3,027.6$ 3,009.4$ 2,992.3$ 2,981.7$ y ( )
Average common shareholders' equity 4,746.6$ 4,692.0$ 4,563.1$ 4,425.5$ 4,290.9$
Operating return on equity, excluding accumulated othercomprehensive income (loss) and net operating losscarryforwards (a non-GAAP financial measure) 9.1% 8.8% 8.2% 9.2% 8.9%carryforwards (a non GAAP financial measure) 9.1% 8.8% 8.2% 9.2% 8.9%
Operating return, excluding significant items, on equity, excludingaccumulated other comprehensive income (loss) and netoperating loss carryforwards (a non-GAAP financial measure) 8.9% 8.8% 8.7% 8.8% 8.3%
Return on equity 7.0% 6.4% 4.8% 6.1% 6.1%
CNO Financial Group | 1Q2016 Earnings | April 28, 2016 33
q y
(Continued on next page)

Information Related to Certain Non-GAAP Financial MeasuresThe following summarizes: (i) operating earnings; (ii) significant items; (iii) operating earnings, excluding significant items; and (iv) net income (dollars in millions):
OperatingOperating earnings,earnings, excluding Netexcluding significant income -
Operating Significant significant items - trailing Net trailingearnings (a) items (b) items four quarters income four quarters
2Q14 71.3$ -$ 71.3$ 260.1$ 78.1$ 239.1$ 3Q14 76.6 (7.1) 69.5 266.8 117.4 73.5 4Q14 69.1 0.6 69.7 272.3 83.9 51.4 1Q15 60.1 - 60.1 270.6 52.8 332.2 2Q15 60.8 5.8 66.6 265.9 46.8 300.9 3Q15 56 8 7 5 64 3 260 7 33 8 217 33Q15 56.8 7.5 64.3 260.7 33.8 217.3 4Q15 97.0 (25.7) 71.3 262.3 137.3 270.7 1Q16 49.6 (3.0) 46.6 248.8 45.5 263.4
(a) - Operating earnings excludes the results from CLIC prior to being sold.(b) - The significant items have been discussed in prior press releases.( ) g p p
CNO Financial Group | 1Q2016 Earnings | April 28, 2016 34
(Continued on next page)

Information Related to Certain Non-GAAP Financial Measures
A reconciliation of pretax operating earnings (a non-GAAP financial measure) to net income is as follows (dollars in millions):
1Q15 2Q15 3Q15 4Q15 1Q16
Twelve months ended
Pretax operating earnings (a non-GAAP financial measure) 428.4$ 413.5$ 381.5$ 422.8$ 407.4$
Income tax (expense) benefit (151.3) (146.9) (134.7) (148.1) (143.2)
Operating return 277.1 266.6 246.8 274.7 264.2
Earnings of CLIC prior to being sold, net of taxes 8.5 - - - -
Net loss on sale of CLIC and gain (loss) on reinsurance transactions,inculding impact of taxes 28.3 25.8 2.9 - -
Net realized investment gains, net of related amortization and taxes 6.4 (7.9) (22.8) (30.8) (30.0)Net realized investment gains, net of related amortization and taxes 6.4 (7.9) (22.8) (30.8) (30.0)
Fair value changes in embedded derivative liabilities, net of relatedamortization and taxes (24.5) (2.9) (13.1) 7.7 (3.2)
Fair value changes related to the agent deferred compensation plan, net of taxes (17.4) (9.8) (9.8) 9.8 5.9
Loss on extinguishment or modification of debt (net of taxes) (0.4) (21.3) (21.3) (21.3) (21.3)
Valuation allowance for deferred tax assets and other tax items 54.9 50.9 34.1 32.5 52.5
Other (0.7) (0.5) 0.5 (1.9) (4.7)
CNO Financial Group | 1Q2016 Earnings | April 28, 2016 35
Net income 332.2$ 300.9$ 217.3$ 270.7$ 263.4$
(Continued on next page)
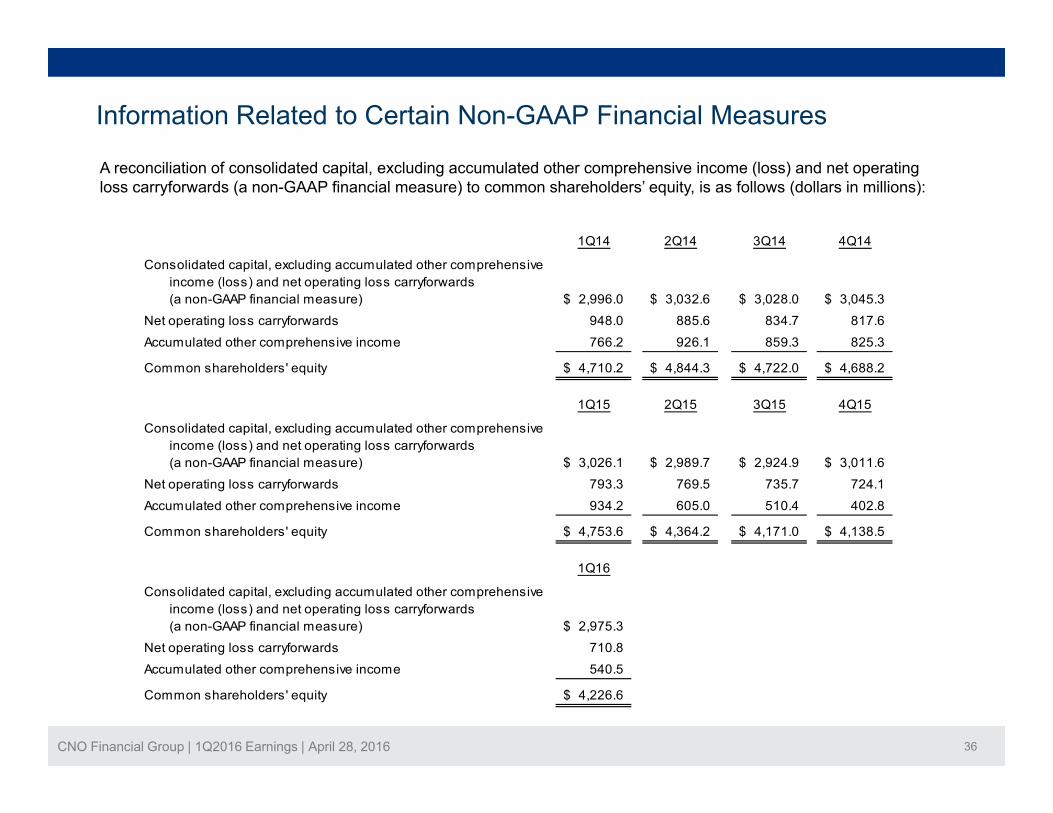
Information Related to Certain Non-GAAP Financial Measures
A reconciliation of consolidated capital, excluding accumulated other comprehensive income (loss) and net operating loss carryforwards (a non-GAAP financial measure) to common shareholders’ equity, is as follows (dollars in millions):
1Q14 2Q14 3Q14 4Q14
Consolidated capital, excluding accumulated other comprehensiveincome (loss) and net operating loss carryforwards (a non-GAAP financial measure) 2,996.0$ 3,032.6$ 3,028.0$ 3,045.3$
Net operating loss carryforwards 948.0 885.6 834.7 817.6
Accumulated other comprehensive income 766.2 926.1 859.3 825.3
Common shareholders' equity 4,710.2$ 4,844.3$ 4,722.0$ 4,688.2$
1Q15 2Q15 3Q15 4Q15
Consolidated capital, excluding accumulated other comprehensiveincome (loss) and net operating loss carryforwards ( GAAP fi i l ) 3 026 1$ 2 989 7$ 2 924 9$ 3 011 6$(a non-GAAP financial measure) 3,026.1$ 2,989.7$ 2,924.9$ 3,011.6$
Net operating loss carryforwards 793.3 769.5 735.7 724.1
Accumulated other comprehensive income 934.2 605.0 510.4 402.8
Common shareholders' equity 4,753.6$ 4,364.2$ 4,171.0$ 4,138.5$
1Q16
Consolidated capital, excluding accumulated other comprehensiveincome (loss) and net operating loss carryforwards (a non-GAAP financial measure) 2,975.3$
Net operating loss carryforwards 710.8
CNO Financial Group | 1Q2016 Earnings | April 28, 2016 36
Accumulated other comprehensive income 540.5
Common shareholders' equity 4,226.6$
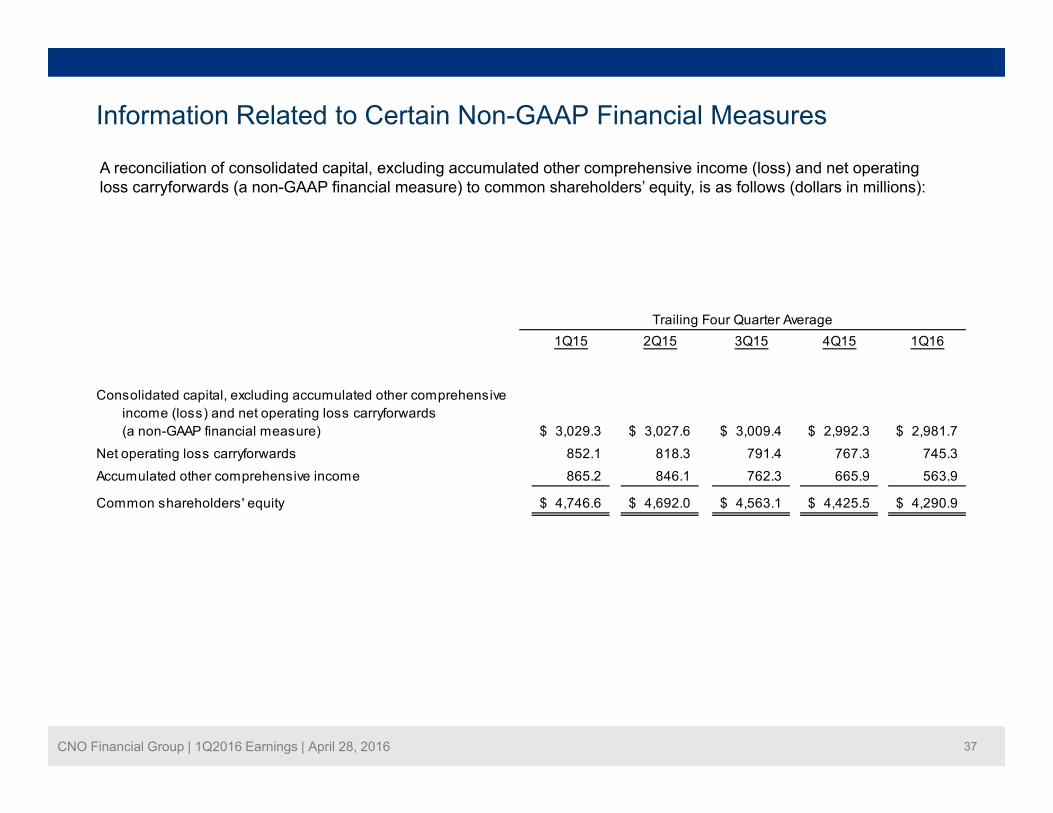
Information Related to Certain Non-GAAP Financial Measures
A reconciliation of consolidated capital, excluding accumulated other comprehensive income (loss) and net operating loss carryforwards (a non-GAAP financial measure) to common shareholders’ equity, is as follows (dollars in millions):
1Q15 2Q15 3Q15 4Q15 1Q16Trailing Four Quarter Average
Consolidated capital, excluding accumulated other comprehensiveincome (loss) and net operating loss carryforwards (a non-GAAP financial measure) 3,029.3$ 3,027.6$ 3,009.4$ 2,992.3$ 2,981.7$
Net operating loss carryforwards 852.1 818.3 791.4 767.3 745.3Net operating loss carryforwards 852.1 818.3 791.4 767.3 745.3
Accumulated other comprehensive income 865.2 846.1 762.3 665.9 563.9
Common shareholders' equity 4,746.6$ 4,692.0$ 4,563.1$ 4,425.5$ 4,290.9$
CNO Financial Group | 1Q2016 Earnings | April 28, 2016 37
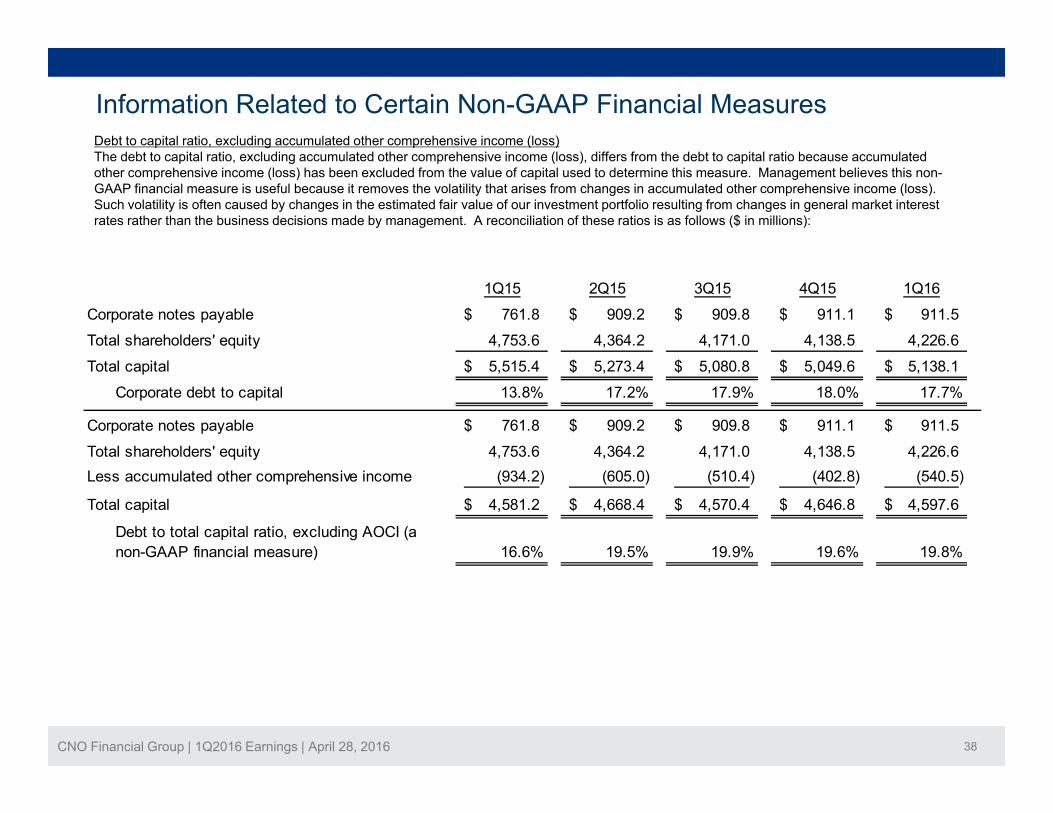
Information Related to Certain Non-GAAP Financial MeasuresDebt to capital ratio, excluding accumulated other comprehensive income (loss)The debt to capital ratio, excluding accumulated other comprehensive income (loss), differs from the debt to capital ratio because accumulated other comprehensive income (loss) has been excluded from the value of capital used to determine this measure. Management believes this non-GAAP financial measure is useful because it removes the volatility that arises from changes in accumulated other comprehensive income (loss). Such volatility is often caused by changes in the estimated fair value of our investment portfolio resulting from changes in general market interest rates rather than the business decisions made by management. A reconciliation of these ratios is as follows ($ in millions):
1Q15 2Q15 3Q15 4Q15 1Q16
Corporate notes payable 761.8$ 909.2$ 909.8$ 911.1$ 911.5$
Total shareholders' equity 4,753.6 4,364.2 4,171.0 4,138.5 4,226.6
Total capital 5,515.4$ 5,273.4$ 5,080.8$ 5,049.6$ 5,138.1$
Corporate debt to capital 13.8% 17.2% 17.9% 18.0% 17.7%
Corporate notes payable 761.8$ 909.2$ 909.8$ 911.1$ 911.5$
Total shareholders' equity 4,753.6 4,364.2 4,171.0 4,138.5 4,226.6 q y , , , , ,Less accumulated other comprehensive income (934.2) (605.0) (510.4) (402.8) (540.5)
Total capital 4,581.2$ 4,668.4$ 4,570.4$ 4,646.8$ 4,597.6$
Debt to total capital ratio, excluding AOCI (anon-GAAP financial measure) 16.6% 19.5% 19.9% 19.6% 19.8%
CNO Financial Group | 1Q2016 Earnings | April 28, 2016 38