InfluenceofthePercentageof TiO2 Dopedinto 2 …downloads.hindawi.com/archive/2012/304546.pdf ·...
7
International Scholarly Research Network ISRN Nanomaterials Volume 2012, Article ID 304546, 6 pages doi:10.5402/2012/304546 Research Article Influence of the Percentage of TiO 2 Doped into SiO 2 Matrix on Photocatalysis L. M. L. da Silva, F. da C. Silva, A. L. de Carvalho, L. Marc ¸al, M. Saltarelli, E. H. De Faria, L. A. Rocha, P. S. Calefi, K. J. Ciuffi, and E. J. Nassar Chemistry Department, Universidade de Franca, Avenida Dr. Armando Salles Oliveira, 201—Parque Universit´ ario, 14404-600 Franca, SP, Brazil Correspondence should be addressed to E. J. Nassar, [email protected] Received 18 June 2012; Accepted 31 July 2012 Academic Editors: M. C. Garcia-Gutierrez, I. Kholmanov, and J. Majimel Copyright © 2012 L. M. L. da Silva et al. This is an open access article distributed under the Creative Commons Attribution License, which permits unrestricted use, distribution, and reproduction in any medium, provided the original work is properly cited. The sol-gel process was employed in the preparation of titania-doped spherical nanosilica for application in photocatalysis. To this end, the silica matrix was doped with 1 and 10% titania, and the catalytic activity of the resulting solids in the degradation of rhodamine was tested. The synthesized materials were thermally treated at 120, 400, and 800 ◦ C. Differential thermal analysis did not evidence the titania-phase transition from anatase to rutile. Scanning electron microscopy revealed the formation of monodisperse spherical nanoparticles with sizes varying between 400 and 500 nm. The UV-Vis absorption spectra showed that the silica doped with 10% titania promoted 86% rhodamine degradation within 90 minutes, as compared to 40% in the case of the silica containing 1% titania. The silica matrix was demonstrated to affect the titania-phase transformation. 1. Introduction Advances in nanotechnology have enabled production of nanosized silica via the sol-gel process, and this material has been widely employed in scientific research as well as in engineering development. Nowadays, the sol-gel tech- nique is the method that is most commonly employed for the synthesis of silica nanoparticles. This route involves simultaneous hydrolysis and condensation of alkoxides, so that silica nanoparticles with several characteristics can be achieved [1]. The advantages of monodispersed nanometric particles have been demonstrated, and their importance for many industrial applications, for example, as catalysts, pigments, or pharmaceuticals, has been shown [2]. The sol- gel methodology is well known for being an easy and quick preparation method, and two routes can be used, namely, the hydrolytic and nonhydrolytic [3]. The hydrolytic sol- gel process is based on the inorganic polymerization of molecular precursors and involves evolution of a polymer through the sol and consequent formation of a network. The molecular precursor employed in the sol-gel process is essentially an alkoxide, and several combinations can be achieved, depending on the compound that is utilized in the reaction [4, 5]. The nonhydrolytic sol-gel process is based on the condensation reaction between a metallic or semimetallic halide and a metallic or semimetallic alkoxide, thereby generating an oxide [6, 7]. Titanium dioxide exists in two main forms, more specif- ically anatase and rutile. Countless applications have been described for these different phases, but titanium dioxide is mainly used in catalysis (photocatalysis) [8]. Various litera- ture works have discussed about the photocatalytic efficiency of titania-doped matrices in the case of nanoparticles and thin films [9–11]. Photocatalytic reactions are well established in the literature. In the specific case of titanium oxide, water adsorbed onto the titania surface is homolytically cleaved (h + +H 2 O adsorbed → H + + • OH) after the oxide is irradiated with light in the UV wavelength region of 290– 380 nm, corresponding to the titania band gap [8]. TiO 2
Transcript of InfluenceofthePercentageof TiO2 Dopedinto 2 …downloads.hindawi.com/archive/2012/304546.pdf ·...

International Scholarly Research NetworkISRN NanomaterialsVolume 2012, Article ID 304546, 6 pagesdoi:10.5402/2012/304546
Research Article
Influence of the Percentage of TiO2 Doped intoSiO2 Matrix on Photocatalysis
L. M. L. da Silva, F. da C. Silva, A. L. de Carvalho, L. Marcal, M. Saltarelli,E. H. De Faria, L. A. Rocha, P. S. Calefi, K. J. Ciuffi, and E. J. Nassar
Chemistry Department, Universidade de Franca, Avenida Dr. Armando Salles Oliveira, 201—Parque Universitario,14404-600 Franca, SP, Brazil
Correspondence should be addressed to E. J. Nassar, [email protected]
Received 18 June 2012; Accepted 31 July 2012
Academic Editors: M. C. Garcia-Gutierrez, I. Kholmanov, and J. Majimel
Copyright © 2012 L. M. L. da Silva et al. This is an open access article distributed under the Creative Commons AttributionLicense, which permits unrestricted use, distribution, and reproduction in any medium, provided the original work is properlycited.
The sol-gel process was employed in the preparation of titania-doped spherical nanosilica for application in photocatalysis. Tothis end, the silica matrix was doped with 1 and 10% titania, and the catalytic activity of the resulting solids in the degradation ofrhodamine was tested. The synthesized materials were thermally treated at 120, 400, and 800◦C. Differential thermal analysisdid not evidence the titania-phase transition from anatase to rutile. Scanning electron microscopy revealed the formation ofmonodisperse spherical nanoparticles with sizes varying between 400 and 500 nm. The UV-Vis absorption spectra showed thatthe silica doped with 10% titania promoted 86% rhodamine degradation within 90 minutes, as compared to 40% in the case ofthe silica containing 1% titania. The silica matrix was demonstrated to affect the titania-phase transformation.
1. Introduction
Advances in nanotechnology have enabled production ofnanosized silica via the sol-gel process, and this materialhas been widely employed in scientific research as well asin engineering development. Nowadays, the sol-gel tech-nique is the method that is most commonly employed forthe synthesis of silica nanoparticles. This route involvessimultaneous hydrolysis and condensation of alkoxides, sothat silica nanoparticles with several characteristics can beachieved [1]. The advantages of monodispersed nanometricparticles have been demonstrated, and their importancefor many industrial applications, for example, as catalysts,pigments, or pharmaceuticals, has been shown [2]. The sol-gel methodology is well known for being an easy and quickpreparation method, and two routes can be used, namely,the hydrolytic and nonhydrolytic [3]. The hydrolytic sol-gel process is based on the inorganic polymerization ofmolecular precursors and involves evolution of a polymerthrough the sol and consequent formation of a network.
The molecular precursor employed in the sol-gel processis essentially an alkoxide, and several combinations can beachieved, depending on the compound that is utilized inthe reaction [4, 5]. The nonhydrolytic sol-gel process isbased on the condensation reaction between a metallic orsemimetallic halide and a metallic or semimetallic alkoxide,thereby generating an oxide [6, 7].
Titanium dioxide exists in two main forms, more specif-ically anatase and rutile. Countless applications have beendescribed for these different phases, but titanium dioxide ismainly used in catalysis (photocatalysis) [8]. Various litera-ture works have discussed about the photocatalytic efficiencyof titania-doped matrices in the case of nanoparticles andthin films [9–11].
Photocatalytic reactions are well established in theliterature. In the specific case of titanium oxide, wateradsorbed onto the titania surface is homolytically cleaved(h+ + H2Oadsorbed → H+ + •OH) after the oxide isirradiated with light in the UV wavelength region of 290–380 nm, corresponding to the titania band gap [8]. TiO2
2 ISRN Nanomaterials
photocatalysis can be applied to the degradation of a numberof organic molecules, including pesticides and dyes, amongothers [12–15].
In this work the hydrolytic sol-gel route was utilized forpreparation of silica doped with 1 and 10% titania, andthe obtained material was employed in photocatalysis. Thesynthesized samples were characterized by thermal analysis,scanning electron microscopy, infrared spectroscopy, and X-ray diffraction. The photocatalytic activity of the preparedmaterials for the degradation of the dye rhodamine wasevaluated by means of UV/Vis absorption spectra.
2. Experimental
2.1. Preparation of the Silica Nanoparticles. Tetraethyl ortho-silicate (Si-(OC2H5)4, TEOS, 98%), titanium isopropox-ide (Ti(OC3H7)4, isoTi, 99%), and Rhodamine B (95%)were purchased from Sigma-Aldrich. Isopropyl alcohol andammonium hydroxide were acquired from Merck. Stocksolutions of dye were prepared via the dissolution ofappropriate amounts of the dye in distilled water.
The silica nanoparticles were obtained by basic catalysis,using 0.11 mol of isopropyl alcohol (solvent), 0.03 mol ofammonium hydroxide in aqueous medium. 3.23 mmol ofthe alkoxide precursor tetraethyl orthosilicate (TEOS) wasadded after 3 minutes of magnetic stirring at 40◦C. TitaniumIV isopropoxide (isoTi) was introduced into the reactionmixture after ten minutes, under continuous magneticstirring. The samples were centrifuged, washed with ethanol,and dried at 120◦C. The silica matrix was then doped with 1or 10% titania in relation to silica, and the resulting xerogelswere calcined at 400 or 800◦C.
2.2. Evaluation of the Photocatalytic Activity. The photo-catalytic activity of these materials was evaluated throughsuspension of 50 mg of catalyst in 10 mL of aqueous solutionof rhodamine (10−5 mol·L−1) that was kept under magneticstirring and artificial UV light (365 nm) at room tempera-ture. The xerogel was separated from the supernatant by cen-trifugation at 3500 rpm for 15 minutes. The concentrationof dye remaining in the supernatant was determined by UV-Vis spectroscopy, using a Hewlett-Packard Model 8453 diodearray spectrometer, in absorption maximum at 575 nm, afteran time of 15, 45, 60, and 90 minutes.
2.3. Characterization of the Catalysts. Thermal Analyses werecarried out using a Thermal Analyst TA Instrument SDTQ600 Simultaneous TGA/DTA/ DSC, in nitrogen, at aheating rate of 20◦C/min, from 25 to 1000◦C, under a N2
flow of 100 mL/min.X-ray diffraction (XRD) patterns of the powdered
samples were acquired on a Shimadzu model XRD 6000diffractometer.
Scanning electron microscopy (SEM) of the materialswas performed in a Carl Zeiss Model EVO 50 Cambridge(UK) microscope. The samples were coated with a thin goldlayer using a sputtering method.
The infrared absorption spectra (FTIR) were acquiredon a Bomem MB 100 spectrophotometer with Fouriertransform, using the KBr pellet technique, with a sample/KBrratio of 1 : 300.
3. Results and Discussion
The thermogravimetric curves (TG) evidenced occurrenceof mass losses up to 600◦C, corresponding to approximately13% of the sample mass. The maximum mass loss took placebetween 40 and 173◦C, which can be ascribed to loss of waterand solvent employed in the syntheses. The residual mass losswas detected between 200 and 600◦C, which can be ascribedto pyrolysis of organic matter remaining from the alkoxideprecursors.
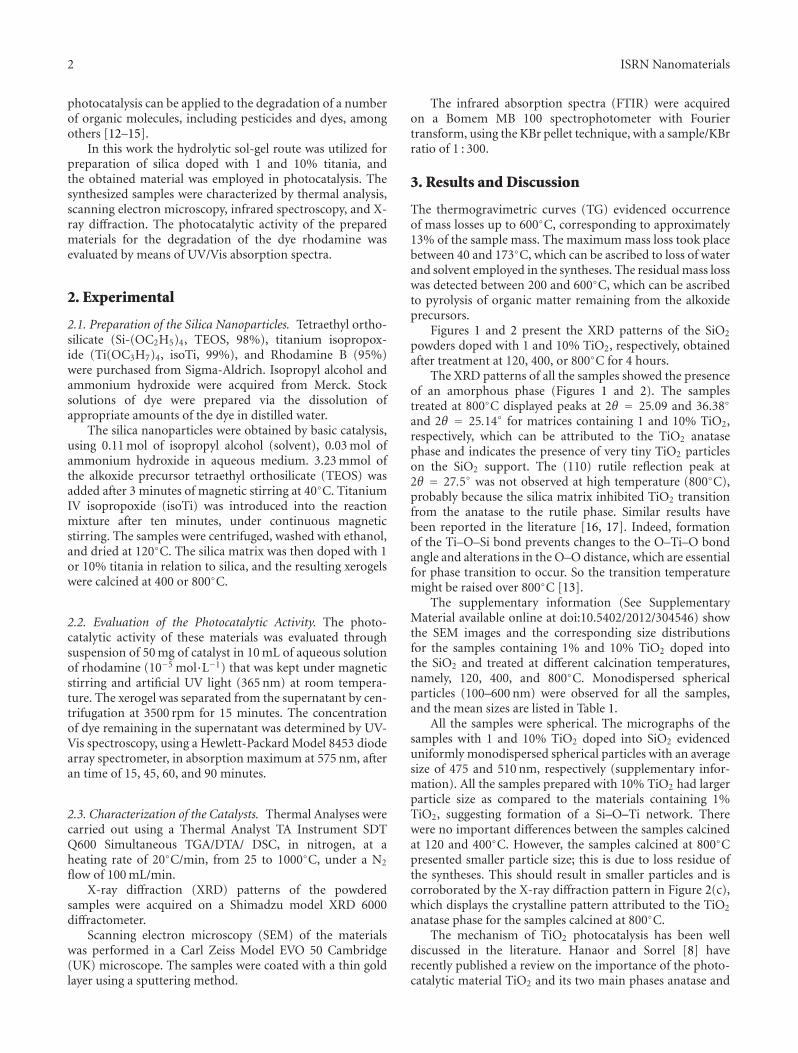
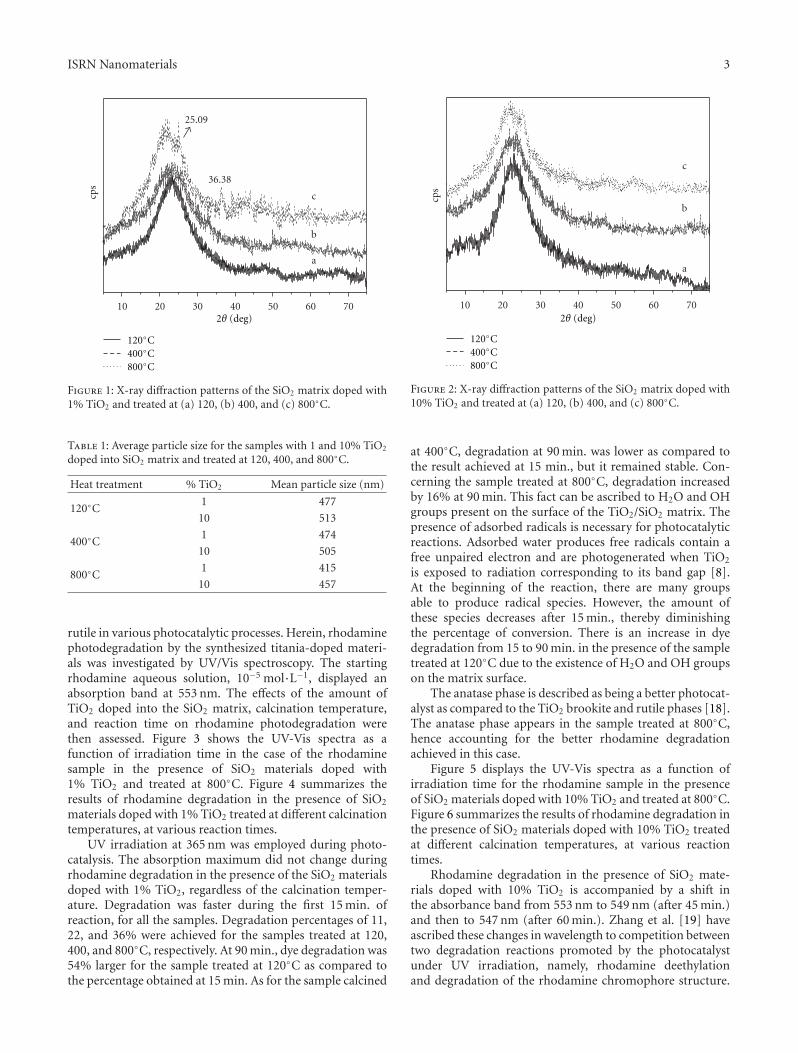
Figures 1 and 2 present the XRD patterns of the SiO2
powders doped with 1 and 10% TiO2, respectively, obtainedafter treatment at 120, 400, or 800◦C for 4 hours.
The XRD patterns of all the samples showed the presenceof an amorphous phase (Figures 1 and 2). The samplestreated at 800◦C displayed peaks at 2θ = 25.09 and 36.38◦
and 2θ = 25.14◦ for matrices containing 1 and 10% TiO2,respectively, which can be attributed to the TiO2 anatasephase and indicates the presence of very tiny TiO2 particleson the SiO2 support. The (110) rutile reflection peak at2θ = 27.5◦ was not observed at high temperature (800◦C),probably because the silica matrix inhibited TiO2 transitionfrom the anatase to the rutile phase. Similar results havebeen reported in the literature [16, 17]. Indeed, formationof the Ti–O–Si bond prevents changes to the O–Ti–O bondangle and alterations in the O–O distance, which are essentialfor phase transition to occur. So the transition temperaturemight be raised over 800◦C [13].
The supplementary information (See SupplementaryMaterial available online at doi:10.5402/2012/304546) showthe SEM images and the corresponding size distributionsfor the samples containing 1% and 10% TiO2 doped intothe SiO2 and treated at different calcination temperatures,namely, 120, 400, and 800◦C. Monodispersed sphericalparticles (100–600 nm) were observed for all the samples,and the mean sizes are listed in Table 1.
All the samples were spherical. The micrographs of thesamples with 1 and 10% TiO2 doped into SiO2 evidenceduniformly monodispersed spherical particles with an averagesize of 475 and 510 nm, respectively (supplementary infor-mation). All the samples prepared with 10% TiO2 had largerparticle size as compared to the materials containing 1%TiO2, suggesting formation of a Si–O–Ti network. Therewere no important differences between the samples calcinedat 120 and 400◦C. However, the samples calcined at 800◦Cpresented smaller particle size; this is due to loss residue ofthe syntheses. This should result in smaller particles and iscorroborated by the X-ray diffraction pattern in Figure 2(c),which displays the crystalline pattern attributed to the TiO2
anatase phase for the samples calcined at 800◦C.The mechanism of TiO2 photocatalysis has been well
discussed in the literature. Hanaor and Sorrel [8] haverecently published a review on the importance of the photo-catalytic material TiO2 and its two main phases anatase and
ISRN Nanomaterials 3
10 20 30 40 50 60 70
c
b
a
36.38
25.09
cps
120◦C400◦C800◦C
2θ (deg)
Figure 1: X-ray diffraction patterns of the SiO2 matrix doped with1% TiO2 and treated at (a) 120, (b) 400, and (c) 800◦C.
Table 1: Average particle size for the samples with 1 and 10% TiO2
doped into SiO2 matrix and treated at 120, 400, and 800◦C.
Heat treatment % TiO2 Mean particle size (nm)
120◦C1 477
10 513
400◦C1 474
10 505
800◦C1 415
10 457
rutile in various photocatalytic processes. Herein, rhodaminephotodegradation by the synthesized titania-doped materi-als was investigated by UV/Vis spectroscopy. The startingrhodamine aqueous solution, 10−5 mol·L−1, displayed anabsorption band at 553 nm. The effects of the amount ofTiO2 doped into the SiO2 matrix, calcination temperature,and reaction time on rhodamine photodegradation werethen assessed. Figure 3 shows the UV-Vis spectra as afunction of irradiation time in the case of the rhodaminesample in the presence of SiO2 materials doped with1% TiO2 and treated at 800◦C. Figure 4 summarizes theresults of rhodamine degradation in the presence of SiO2
materials doped with 1% TiO2 treated at different calcinationtemperatures, at various reaction times.
UV irradiation at 365 nm was employed during photo-catalysis. The absorption maximum did not change duringrhodamine degradation in the presence of the SiO2 materialsdoped with 1% TiO2, regardless of the calcination temper-ature. Degradation was faster during the first 15 min. ofreaction, for all the samples. Degradation percentages of 11,22, and 36% were achieved for the samples treated at 120,400, and 800◦C, respectively. At 90 min., dye degradation was54% larger for the sample treated at 120◦C as compared tothe percentage obtained at 15 min. As for the sample calcined
10 20 30 40 50 60 70
c
b
a
cps
120◦C400◦C800◦C
2θ (deg)
Figure 2: X-ray diffraction patterns of the SiO2 matrix doped with10% TiO2 and treated at (a) 120, (b) 400, and (c) 800◦C.
at 400◦C, degradation at 90 min. was lower as compared tothe result achieved at 15 min., but it remained stable. Con-cerning the sample treated at 800◦C, degradation increasedby 16% at 90 min. This fact can be ascribed to H2O and OHgroups present on the surface of the TiO2/SiO2 matrix. Thepresence of adsorbed radicals is necessary for photocatalyticreactions. Adsorbed water produces free radicals contain afree unpaired electron and are photogenerated when TiO2
is exposed to radiation corresponding to its band gap [8].At the beginning of the reaction, there are many groupsable to produce radical species. However, the amount ofthese species decreases after 15 min., thereby diminishingthe percentage of conversion. There is an increase in dyedegradation from 15 to 90 min. in the presence of the sampletreated at 120◦C due to the existence of H2O and OH groupson the matrix surface.
The anatase phase is described as being a better photocat-alyst as compared to the TiO2 brookite and rutile phases [18].The anatase phase appears in the sample treated at 800◦C,hence accounting for the better rhodamine degradationachieved in this case.
Figure 5 displays the UV-Vis spectra as a function ofirradiation time for the rhodamine sample in the presenceof SiO2 materials doped with 10% TiO2 and treated at 800◦C.Figure 6 summarizes the results of rhodamine degradation inthe presence of SiO2 materials doped with 10% TiO2 treatedat different calcination temperatures, at various reactiontimes.
Rhodamine degradation in the presence of SiO2 mate-rials doped with 10% TiO2 is accompanied by a shift inthe absorbance band from 553 nm to 549 nm (after 45 min.)and then to 547 nm (after 60 min.). Zhang et al. [19] haveascribed these changes in wavelength to competition betweentwo degradation reactions promoted by the photocatalystunder UV irradiation, namely, rhodamine deethylationand degradation of the rhodamine chromophore structure.

4 ISRN Nanomaterials
450 500 550 600 650
0
0.2
0.4
0.6
0.8
1553
Abs
orba
nce
Wavelength (nm)
15 min45 min
60 min90 min
Rhodamine 10−5 mol·L−1
Figure 3: Absorption spectra of rhodamine as a function ofirradiation time in the presence of SiO2 materials doped with 1%TiO2 treated at 800◦C.
15 45 60 900
10
20
30
40
50
Deg
rada
tion
(%
)
Time (min)
120◦C400◦C800◦C
Figure 4: Rhodamine degradation results in the presence of SiO2
materials doped with 1% TiO2 treated at different calcinationtemperatures.
According to Watanabe et al. [20], the •OH radicals prefer-ably react with the aromatic chromophore ring in solution,so rhodamine degradation occurs with no shifts in theabsorption band. Deethylation, on the other hand, occurs onthe surface of the titania-doped matrix and results in a blueshift of the absorbance band. This indicates that in the case ofthe samples containing 1% TiO2, photocatalysis takes placein solution all the time, whereas for the samples with 10%TiO2 there is competition between two types of degradationreactions after 15 min.
500 550 600
0
0.2
0.4
0.6
0.8
1
553
Abs
orba
nce
Wavelength (nm)
15 min45 min
60 min90 min
Rhodamine 10−5 mol·L−1
Figure 5: Absorption spectra of rhodamine as a function ofirradiation time in the presence of SiO2 materials doped with 10%TiO2 treated at 800◦C.
15 45 60 900
20
40
60
80
100
Time (min)
Deg
rada
tion
(%
)
120◦C400◦C800◦C
Figure 6: Rhodamine degradation results in the presence of SiO2
materials doped with 10% TiO2 treated at different calcinationtemperatures.
The rhodamine degradation reaction in the presence ofthe material containing 10% TiO2 was faster within the first15 min. for the sample treated at 800◦C, furnishing 70% dyedegradation, which had risen by 21% at 90 min. As for thesample treated at 120◦C, the percentage of degradation wasthe same as that obtained for the sample containing 1%TiO2, that is, around 10%, at 15 min. At 90 min., degradationrose by 110%. Photocatalysis in the presence of the samplecontaining 10% titania and treated at 400◦C afforded low
ISRN Nanomaterials 5
degradation yields: only 6.5% rhodamine was degraded upto 90 min.
The samples with 1 and 10% titania treated at 400◦C gavepoor results. The former yielded initial degradation of 21%,but this value decreased as a function of time to 18%, and thedegradation percentage was very low for the latter sample.As for the samples treated at 120 and 800◦C, there was anincrease in the degradation percentage as a function of time,but this rise was not directly proportional. It is noteworthythat a tenfold increase in TiO2 concentration elicited only atwofold rise in degradation.
These results show that the percentage of TiO2 is not themain factor influencing the rhodamine photodegradationreaction. There are many other parameters, such as TiO2
particle size and morphology, and the presence of H2O andOH groups, affecting this reaction.
Prior to the photocatalytic reactions, the infrared spec-tra of the prepared materials displayed a broad band at3420 cm−1, ascribed to water molecules and hydroxyl groups,and a band at 1641 cm−1 confirmed the presence of thesegroups. The shoulder at 1220 cm−1 is attributed to Ti–O–Ti asymmetric stretching [21]. The bands at 1092, 797,and 473 cm−1 correspond to Si–O–Si asymmetric stretchingvibration [15, 22–25]. The vibration mode at 954 cm−1
assigned to Si–OH can also be detected before photocatalysis.The latter process is based on the energy of the photons(3.2 eV) from titania to produce very strong oxidizing agents,which in turn are responsible for generation of •OH radicalsfrom water adsorbed onto the surface of the silica or fromSi–OH groups. After the photocatalytic reaction, the bandsat 3420 and 954 cm−1 decrease, which is evidence thatwater and/or –OH is necessary for titania photocalysis tooccur, as described by Herrmann [14]. The decrease inthe bands due to H2O and OH groups can explain thedegradation percentages obtained in the presence of thematerials containing 1 and 10% titania and treated at 800◦C.Dye degradation was high at 15 min. of reaction, but increasewas not so marked from 15 to 90 min.
4. Conclusion
The results of this work show the importance of temperature,reaction time, percentage of titania in the sample, andpresence of water and OH groups for the effectiveness ofrhodamine photodegradation. In industrial processes fordegradation of polluting dyes, TiO2 can be diluted into theSiO2 matrix, thereby reducing costs while promoting gooddegradation. The samples treated at 800◦C gave the bestyields, which were achieved during the first 15 minutes ofreaction. Thereafter, the percentage of degradation increasedno more than 20% of the value obtained at 15 minutes. Asfor the samples treated at 120◦C, degradation percentageincreased by approximately 50 and 100% at 90 minutes ascompared to 15 minutes for the materials with 1 and 10%TiO2, respectively. All these observations can be explainedby the presence of the H2O and OH groups on the surfaceof the SiO2 nanoparticles doped with TiO2. In the caseof the samples treated at 800◦C, the amount of Si–OH
and Ti–OH bonds on the surface of the nanoparticlesis lower, as compared to the samples treated at 120◦C.Moreover, for materials containing less TiO2 diluted intoSiO2, pollutant degradation in solution is favored overpollutant deethylation on the matrix surface.
Acknowledgments
The authors acknowledge FAPESP, CNPq, and CAPES(Brazilian research funding agencies) for support of thiswork and the Microscopy Laboratory of the FFCLRP, SaoPaulo University, Sao Paulo, Brazil.
References
[1] W. Stober, A. Fink, and E. Bohm, “Controlled growth ofmonodisperse silica spheres in the micron size range,” Journalof Colloid and Interface Science, vol. 26, no. 1, pp. 62–69, 1968.
[2] A. S. de Dios and M. E. Dıaz-Garcıa, “Multifunctionalnanoparticles: analytical prospects,” Analytica Chimica Acta,vol. 666, no. 1-2, pp. 1–22, 2010.
[3] J. D. Wright and N. A. J. Sommerdijk, Sol-Gel MaterialsChemistry and Applications, Taylor & Francis, 2003.
[4] L. L. Hench and J. K. West, “The sol-gel process,” ChemicalReviews, vol. 90, no. 1, pp. 33–72, 1990.
[5] C. J. Brinker and G. W. Scherer, Sol-Gel Science: The Physicsand Chemistry of Sol-Gel Processing, Academic Press, SanDiego, Calif, USA, 1990.
[6] S. Acosta, R. J. P. Corriu, D. Leclercq, P. Lefevre, P. H.Mutin, and A. Vioux, “Preparation of alumina gels by anon-hydrolytic sol-gel processing method,” Journal of Non-Crystalline Solids, vol. 170, no. 3, pp. 234–242, 1994.
[7] O. J. de Lima, H. C. Sacco, D. C. Oliveira et al., “Porphyrinsentrapped in an alumina matrix,” Journal of Materials Chem-istry, vol. 11, no. 10, pp. 2476–2481, 2001.
[8] D. A. H. Hanaor and C. C. Sorrell, “Review of the anatase torutile phase transformation,” Journal of Materials Science, vol.46, no. 4, pp. 855–874, 2011.
[9] L. Ge, M. Xu, M. Sun, and H. Fang, “Fabrication andcharacterization of nano TiO2 thin films at low temperature,”Materials Research Bulletin, vol. 41, no. 9, pp. 1596–1603, 2006.
[10] H. Shin, H. S. Jung, K. S. Hong, and J.-K. Lee, “Crystal phaseevolution of TiO2 nanoparticles with reaction time in acidicsolutions studied via freeze-drying method,” Journal of SolidState Chemistry, vol. 178, no. 1, pp. 15–21, 2005.
[11] S. Jin and F. Shiraishi, “Photocatalytic activities enhancedfor decompositions of organic compounds over metal-photo-depositing titanium dioxide,” Chemical Engineering Journal,vol. 97, no. 2–3, pp. 203–211, 2004.
[12] K. Melghit and S. S. Al-Rabaniah, “Photodegradation ofCongo red under sunlight catalysed by nanorod rutile TiO2,”Journal of Photochemistry and Photobiology A, vol. 184, no. 3,pp. 331–334, 2006.
[13] Y. Jin, A. Li, S. G. Hazelton et al., “Amorphous silica nanohy-brids: synthesis, properties and applications,” CoordinationChemistry Reviews, vol. 253, no. 23-24, pp. 2998–3014, 2009.
[14] J.-M. Herrmann, “Photocatalysis fundamentals revisited toavoid several misconceptions,” Applied Catalysis B, vol. 99, no.3-4, pp. 461–468, 2010.
[15] L. Marcal, E. H. de Faria, M. Saltarelli et al., “Amine-functionalized titanosilicates prepared by the sol-gel processas adsorbents of the Azo-Dye orange II,” Industrial and

6 ISRN Nanomaterials
Engineering Chemistry Research, vol. 50, no. 1, pp. 239–246,2011.
[16] Y. Chen, K. Wang, and L. Lou, “Photodegradation of dyepollutants on silica gel supported TiO2 particles under visiblelight irradiation,” Journal of Photochemistry and PhotobiologyA, vol. 163, no. 1–2, pp. 281–287, 2004.
[17] K. Y. Jung, S. B. Park, and S.-K. Ihm, “Local structureand photocatalytic activity of B2O3-SiO2/TiO2 ternary mixedoxides prepared by sol-gel method,” Applied Catalysis B, vol.51, no. 4, pp. 239–245, 2004.
[18] K. Y. Jung and S. B. Park, “Enhanced photoactivity of silica-embedded titania particles prepared by sol-gel process for thedecomposition of trichloroethylene,” Applied Catalysis B, vol.25, no. 4, pp. 249–256, 2000.
[19] Y. Zhang, H. Xu, Y. Xu, H. Zhang, and Y. Wang, “The effectof lanthanide on the degradation of RB in nanocrystallineLn/TiO2 aqueous solution,” Journal of Photochemistry andPhotobiology A, vol. 170, no. 3, pp. 279–285, 2005.
[20] T. Watanabe, T. Takizawa, and K. Honda, “Photocatalysisthrough excitation of adsorbates. 1. Highly efficient N-deethylation of rhodamine B adsorbed to cadmium sulfide,”The Journal of Physical Chemistry, vol. 81, no. 19, pp. 1845–1851, 1977.
[21] C. Zhu, L. Wang, L. Kong et al., “Photocatalytic degradationof AZO dyes by supported TiO2 + UV in aqueous solution,”Chemosphere, vol. 41, no. 3, pp. 303–309, 2000.
[22] S. Kein, S. Thorimbert, and W. F. Maier, “Amorphousmicroporous titania–silica mixed oxides: preparation, charac-terization, and catalytic redox properties,” Journal of Catalysis,vol. 163, no. 2, pp. 476–488, 1996.
[23] H. Zhang and J. F. Banfield, “Thermodynamic analysis ofphase stability of nanocrystalline titania,” Journal of MaterialsChemistry, vol. 8, no. 9, pp. 2073–2076, 1998.
[24] X. Gao and I. E. Wachs, “Titania-silica as catalysts: molecularstructural characteristics and physico-chemical properties,”Catalysis Today, vol. 51, no. 2, pp. 233–254, 1999.
[25] E. J. Nassar, C. R. Neri, P. S. Calefi, and O. A. Serra,“Functionalized silica synthesized by sol-gel process,” Journalof Non-Crystalline Solids, vol. 247, no. 1–3, pp. 124–128, 1999.

Submit your manuscripts athttp://www.hindawi.com
ScientificaHindawi Publishing Corporationhttp://www.hindawi.com Volume 2014
CorrosionInternational Journal of
Hindawi Publishing Corporationhttp://www.hindawi.com Volume 2014
Polymer ScienceInternational Journal of
Hindawi Publishing Corporationhttp://www.hindawi.com Volume 2014
Hindawi Publishing Corporationhttp://www.hindawi.com Volume 2014
CeramicsJournal of
Hindawi Publishing Corporationhttp://www.hindawi.com Volume 2014
CompositesJournal of
NanoparticlesJournal of
Hindawi Publishing Corporationhttp://www.hindawi.com Volume 2014
Hindawi Publishing Corporationhttp://www.hindawi.com Volume 2014
International Journal of
Biomaterials
Hindawi Publishing Corporationhttp://www.hindawi.com Volume 2014
NanoscienceJournal of
TextilesHindawi Publishing Corporation http://www.hindawi.com Volume 2014
Journal of
NanotechnologyHindawi Publishing Corporationhttp://www.hindawi.com Volume 2014
Journal of
CrystallographyJournal of
Hindawi Publishing Corporationhttp://www.hindawi.com Volume 2014
The Scientific World JournalHindawi Publishing Corporation http://www.hindawi.com Volume 2014
Hindawi Publishing Corporationhttp://www.hindawi.com Volume 2014
CoatingsJournal of
Advances in
Materials Science and EngineeringHindawi Publishing Corporationhttp://www.hindawi.com Volume 2014
Smart Materials Research
Hindawi Publishing Corporationhttp://www.hindawi.com Volume 2014
Hindawi Publishing Corporationhttp://www.hindawi.com Volume 2014
MetallurgyJournal of
Hindawi Publishing Corporationhttp://www.hindawi.com Volume 2014
BioMed Research International
MaterialsJournal of
Hindawi Publishing Corporationhttp://www.hindawi.com Volume 2014
Nano
materials
Hindawi Publishing Corporationhttp://www.hindawi.com Volume 2014
Journal ofNanomaterials