Influence of host galaxy morphology on the properties of ...
12
PoS(Multif2019)015 Influence of host galaxy morphology on the properties of Type Ia supernovae from JLA and Pantheon compilations Maria Pruzhinskaya * Lomonosov Moscow State University, Sternberg Astronomical Institute, Universitetsky pr. 13, Moscow 119234, Russia E-mail: [email protected] Alexandra Novinskaya Lomonosov Moscow State University, Faculty of Physics, Leninskie Gory, 1-2, Moscow, 119991, Russia E-mail: [email protected] Philippe Rosnet Université Clermont Auvergne, CNRS/IN2P3, LPC, Clermont-Ferrand, France E-mail: [email protected] Nicoleta Pauna Université Clermont Auvergne, CNRS/IN2P3, LPC, Clermont-Ferrand, France E-mail: [email protected] In this work we show the correlation between host galaxy morphology and light curve parameters of Type Ia supernovae. The analysis is based on two most recent cosmological samples of su- pernovae: JLA (Joint Light-curve Analysis) and Pantheon. We confirm that the stretch-parameter depends on the host morphology, but there is no any correlation for the colour. This result is in the line of other analyses showing the environment dependence of Type Ia supernova light curves. We stress the importance of including the host morphology term to the supernova standardization procedure. Multifrequency Behaviour of High Energy Cosmic Sources - XIII - MULTIF2019 3-8 June 2019 Palermo, Italy * Speaker. c Copyright owned by the author(s) under the terms of the Creative Commons Attribution-NonCommercial-NoDerivatives 4.0 International License (CC BY-NC-ND 4.0). https://pos.sissa.it/
Transcript of Influence of host galaxy morphology on the properties of ...
PoS(Multif2019)015
Influence of host galaxy morphology on theproperties of Type Ia supernovae from JLA andPantheon compilations
Maria Pruzhinskaya∗
Lomonosov Moscow State University, Sternberg Astronomical Institute, Universitetsky pr. 13,Moscow 119234, RussiaE-mail: [email protected]
Alexandra NovinskayaLomonosov Moscow State University, Faculty of Physics, Leninskie Gory, 1-2, Moscow, 119991,RussiaE-mail: [email protected]
Philippe RosnetUniversité Clermont Auvergne, CNRS/IN2P3, LPC, Clermont-Ferrand, FranceE-mail: [email protected]
Nicoleta PaunaUniversité Clermont Auvergne, CNRS/IN2P3, LPC, Clermont-Ferrand, FranceE-mail: [email protected]
In this work we show the correlation between host galaxy morphology and light curve parametersof Type Ia supernovae. The analysis is based on two most recent cosmological samples of su-pernovae: JLA (Joint Light-curve Analysis) and Pantheon. We confirm that the stretch-parameterdepends on the host morphology, but there is no any correlation for the colour. This result is inthe line of other analyses showing the environment dependence of Type Ia supernova light curves.We stress the importance of including the host morphology term to the supernova standardizationprocedure.
Multifrequency Behaviour of High Energy Cosmic Sources - XIII - MULTIF20193-8 June 2019Palermo, Italy
∗Speaker.
c© Copyright owned by the author(s) under the terms of the Creative CommonsAttribution-NonCommercial-NoDerivatives 4.0 International License (CC BY-NC-ND 4.0). https://pos.sissa.it/

PoS(Multif2019)015
Type Ia Supernova environment Maria Pruzhinskaya
1. Introduction
Among the other types of supernovae, Type Ia supernovae (SNe Ia) have less luminosity dis-persion at maximum light and show higher optical luminosities. These two properties allowed touse them as cosmological distance indicators that led to the discovery of the accelerating expansionof the Universe [1, 2]. The most recent analysis of SNe Ia indicates that considering a flat ΛCDMcosmology, our Universe is accelerating with ΩΛ = 0.702±0.022 [3].
In the early studies it was widely assumed that SNe Ia have universal light curves and a con-stant absolute magnitude at maximum ("standard candles"). This was explained by the similarityof the physical processes that lead to the outburst phenomenon. Generally, the outburst is a ther-monuclear explosion of a C-O white dwarf whose mass has become close to or larger than theChandrasekhar mass. In fact, after the detailed observations of a large number of supernovaehad been accomplished, it became clear that the absolute magnitude at maximum can vary within∼ 1 mag. The reasons of luminosity dispersion could be different. First, the mechanism of massincrease by white dwarf is not universal: it can be due to the matter accretion on the white dwarffrom the companion star (so-called "single-degenerate (SD) scenario") or the merger of two whitedwarfs ("double-degenerate (DD) scenario"). Additionally there exist some alternative scenarios,like sub-Chandrasekhar, that is usually associated with weak explosions. These scenarios have in-ternal freedom that results in significant variations in observed light curves of SNe Ia: like pointof deflagration-to-detonation transition (for SD scenario), or difference in total mass (for DD sce-nario). Another important factor which could violate the "standard candle" hypothesis is dust. Dustaround the supernovae, as well as in the host galaxy, surely affects light curve behavior. The dis-tribution and properties of dust in host galaxies of supernovae could be different from that in theMilky Way. In addition, the initial chemical composition of the progenitor stars also complicatesthe picture. A lower metallicity involves an increase of the Chandrasekhar limit and could affectthe explosion process. For example, in elliptical galaxies or in halo of spiral galaxies only old,i.e. metal-poor, stars with an age comparable to that of the Universe are located; on the contraryin the star formation regions of spiral galaxies there are young metal-rich stars. The above-listedfactors (age, chemical composition of the region around SN, presence of dust) could be consideredas environmental effects.
Fortunately, it was established that supernovae are "standardized candles" (see Section 2),that allowed to improve a lot the accuracy of distance measurements. However, the dispersionon the Hubble diagram still remains. For instance, in the most recent cosmological analysis allSNe are standardized with an intrinsic residual dispersion of about 0.11 mag. It could be due tothe environmental effects that are not accounted by current standardization methods. Therefore,the SN Ia standardization procedure is one of the main sources of systematic uncertainties in thecosmological results.
2. Rust-Pskovskii relation
The discovery of the accelerating expansion of the Universe would not have been possiblewithout the discovery of one of the most important relation in supernova cosmology — the relationbetween the peak luminosity of Type Ia supernovae and their luminosity decline rate after the
1
PoS(Multif2019)015
Type Ia Supernova environment Maria Pruzhinskaya
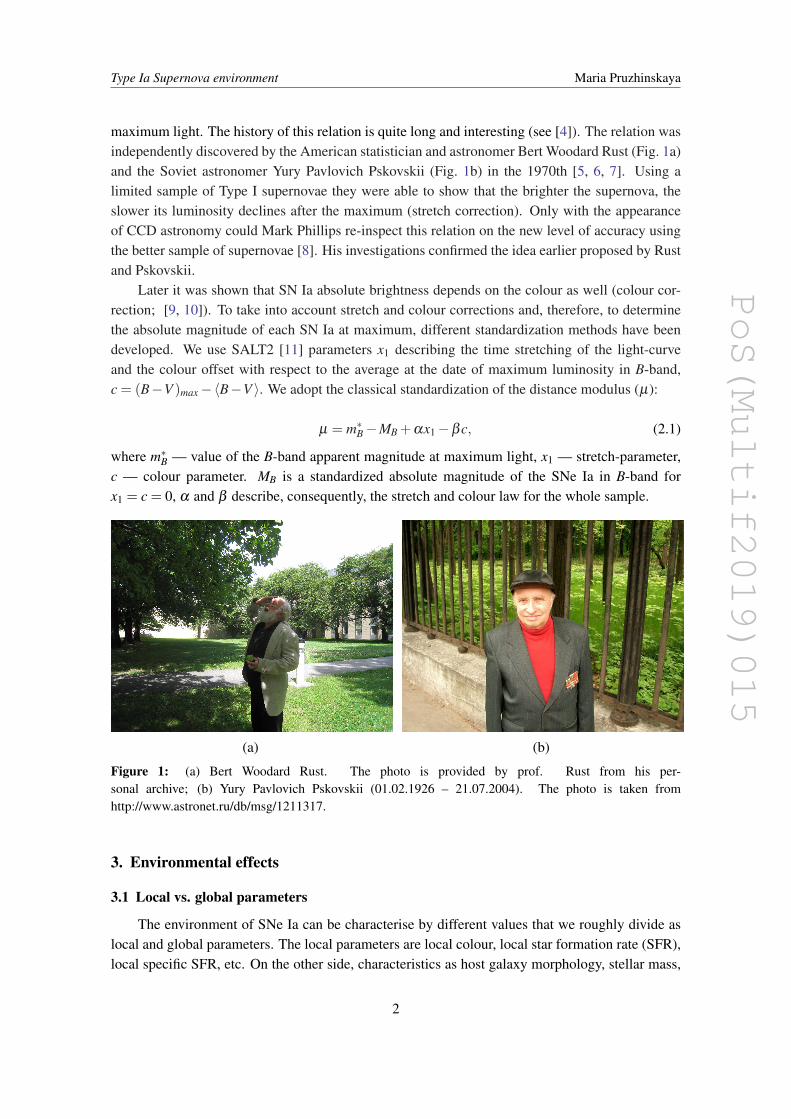
maximum light. The history of this relation is quite long and interesting (see [4]). The relation wasindependently discovered by the American statistician and astronomer Bert Woodard Rust (Fig. 1a)and the Soviet astronomer Yury Pavlovich Pskovskii (Fig. 1b) in the 1970th [5, 6, 7]. Using alimited sample of Type I supernovae they were able to show that the brighter the supernova, theslower its luminosity declines after the maximum (stretch correction). Only with the appearanceof CCD astronomy could Mark Phillips re-inspect this relation on the new level of accuracy usingthe better sample of supernovae [8]. His investigations confirmed the idea earlier proposed by Rustand Pskovskii.
Later it was shown that SN Ia absolute brightness depends on the colour as well (colour cor-rection; [9, 10]). To take into account stretch and colour corrections and, therefore, to determinethe absolute magnitude of each SN Ia at maximum, different standardization methods have beendeveloped. We use SALT2 [11] parameters x1 describing the time stretching of the light-curveand the colour offset with respect to the average at the date of maximum luminosity in B-band,c = (B−V )max−〈B−V 〉. We adopt the classical standardization of the distance modulus (µ):
µ = m∗B−MB +αx1−βc, (2.1)
where m∗B — value of the B-band apparent magnitude at maximum light, x1 — stretch-parameter,c — colour parameter. MB is a standardized absolute magnitude of the SNe Ia in B-band forx1 = c = 0, α and β describe, consequently, the stretch and colour law for the whole sample.
(a) (b)
Figure 1: (a) Bert Woodard Rust. The photo is provided by prof. Rust from his per-sonal archive; (b) Yury Pavlovich Pskovskii (01.02.1926 – 21.07.2004). The photo is taken fromhttp://www.astronet.ru/db/msg/1211317.
3. Environmental effects
3.1 Local vs. global parameters
The environment of SNe Ia can be characterise by different values that we roughly divide aslocal and global parameters. The local parameters are local colour, local star formation rate (SFR),local specific SFR, etc. On the other side, characteristics as host galaxy morphology, stellar mass,
2

PoS(Multif2019)015
Type Ia Supernova environment Maria Pruzhinskaya
SFR, and galactocentric distance can be referred as global parameters. It is obvious that localparameters provide the more accurate description of the SN environment. However, the currentstate of the data processing and the resolution of the largest telescopes do not allow measuring localparameters at medium and high redshifts with a good accuracy. That is why study of influence ofthe local parameters on the SNe Ia properties are based on low-redshift supernova samples. Forexample, the most recent analysis of the local specific SFR in 1 kpc region around supernovae isdone for 141 objects of the Nearby Supernova Factory [12] with redshift 0.02< z< 0.08 [13]. Fromthat point it is more expedient to use global parameters, for example, host galaxy morphology. Atthe moment, it is possible to determine the morphology of the most distant Hubble galaxies withz > 1 [14], which makes the study of host morphology impact possible even for cosmologicalsupernovae.
Moreover, the number of discovered supernovae increases dramatically. In epoch of LSSTmillions of SNe will be discovered every year. In this sense the accurate measurements of the localenvironmental parameters for each supernovae become very expensive since it requires time on thelargest telescopes. The global parameters on the contrary are easier to obtain, for example, pro-cessing the images of wide-field photometric surveys with use of traditional astronomical methodsas well as machine learning techniques (e.g., [15]).
It is worth to stress that local and global parameters correlate to each other. The comparisonbetween host morphological type and local SFR in 1 kpc region around supernovae for nearbysupernova sample [16], is shown in Fig. 2. To plot Fig. 2 we determined the supernova host mor-phology using SIMBAD1, HyperLEDA2, and NED3 astronomical databases. See also figure 10of [17] for the dependence between the local U −V rest-frame colour in a region of 3 kpc aroundthe supernova and the stellar mass of the host galaxy of SNLS (SuperNovae Legacy Survey), SDSS(Sloan Digital Sky Survey), and low-redsfiht supernovae.
Taking into account all of the above, in this work we use host galaxy morphology to describethe supernova environment. We study its impact on two cosmological samples of supernovae: JointLight-curve Analysis (JLA; [18]) and Pantheon [3].
3.2 JLA supernova sample
JLA sample of supernovae includes 740 spectroscopically confirmed SNe Ia up to the redshiftz' 1.3. Supernovae are collected from nearby, SDSS, SNLS, and HST (Hubble Space Telescope)surveys [18]. According to this analysis the Universe is accelerating with ΩΛ = 0.705±0.034 forΛCDM cosmology.
In [19] the host galaxy morphology for 192 SNe Ia from the JLA sample was derived. Thesupernovae were divided into three categories depending on host morphology: elliptical/lenticular(E/L), early-type spiral (ES), and late-type spiral galaxies (LS).
It was found that:
• Stretch parameter x1 is closely correlated with host morphology: the low-stretch (fast de-cline) SNe usually exploded in E/L galaxies, i.e. in old stellar population environment.
1http://simbad.u-strasbg.fr/simbad/2http://leda.univ-lyon1.fr/3https://ned.ipac.caltech.edu/
3

PoS(Multif2019)015
Type Ia Supernova environment Maria Pruzhinskaya
E E/S0 S0 S0/a Sa Sab Sb Sbc Sc Sd S−6
−5
−4
−3
−2
log( Σ S
FR/[ M
kpc−
2yr−
1])
Figure 2: Local star formation rate in 1 kpc region around supernovae vs. morphological type of the hostsfor the SN sample from [16]. The upper limits on the local SFR are marked by red triangles.
• There is no statistically significant trend for the colour parameter.
• Trend in the stretch nuisance parameter α exists. Its value decreases from E/L to LS galaxies(see Fig. 3).
• In old stellar population and with low dust environment, supernovae are intrinsically fainterafter stretch and colour corrections. This conclusion contradicts the results obtained by [20](see also [21] and references in it). However, our results are consistent within 1-σ for allsubsamples, that makes them insignificant.
• Host galaxy morphology affects the residual dispersion in distance modulus on the Hubblediagram. It was noticed that SNe Ia in LS are more homogeneous with ∆µ RMS = 0.115±0.010 against ∆µ RMS = 0.138±0.007 for the full sample.
3.3 Pantheon supernova sample
Cosmological supernova sample Pantheon consists of 1048 objects with redshifts up to z '2.3 [3]. Pantheon also represents a compilation from several surveys: 177 nearby supernovae(0.01 < z < 0.1), 335 SDSS supernovae, 236 SNLS supernovae, 279 objects from Pan-STARRSsurvey and 21 HST supernovae. Pantheon is the largest cosmological SN sample to date. Themain advantages of Pantheon compared to previous compilations are: an intercalibration betweendifferent surveys and a thorough investigation of systematic uncertainties.
To analyse how the morphological type of host galaxies affects the supernova luminosity andstandardization parameters we, first, determined the host morphology according to the Hubble
4

PoS(Multif2019)015
Type Ia Supernova environment Maria Pruzhinskaya
Figure 3: Joint confidence contours (1- and 2-σ ) in two-parameter plots of α , β , and MB for the Hubblediagram fits with Eq. 2.1 and fixed ΛCDM cosmology with ΩΛ = 0.705, where SNe are split accordingto the host galaxy morphology into three categories (elliptical/lenticular, early-type spiral, and late-typespiral galaxies). The black crosses represent the best fitting values (α = 0.141, β = 3.101, MB = −19.05)from [18].
classification. To do that, we used several astronomical databases (SIMBAD, HyperLEDA, NED)as well as individual publications.
Based on these sources we found the host morphology of 248 SNe Ia from the Pantheonsample. In cases when the morphological classification given by different sources is controversial,we made a visual classification. The final distribution of SN Ia hosts by morphological types isgiven in Fig. 4. As it is seen from the plot, the distribution is uneven. That is why we combined the"close" morphological types with each other (see Table 1). We considered four groups:
• E-S0/a — elliptical and lenticular galaxies (low star formation rate, old stellar population,low amounts of dust);
• Sa-Sb — early type spirals (tightly wound arms);
5

PoS(Multif2019)015
Type Ia Supernova environment Maria Pruzhinskaya
Table 1: Distribution of host galaxies of Pantheon SNe Ia according to their morphological type.E S0/E S0 S0/a Sa Sab Sb Sbc Sc Scd Sd S Irr
(20) (17) (25) (10) (25) (6) (45) (12) (48) (1) (4) (6) (29)E–S0/a (72) Sa–Sb (76) Sbc–Sd (65) — Irr (29)
• Sbc-Sd — late type spirals (loosely wound and weak arms);
• Irr — irregular (no arms, no bulge, irregular profile, low surface brightness).
3.3.1 x1 and c parameters
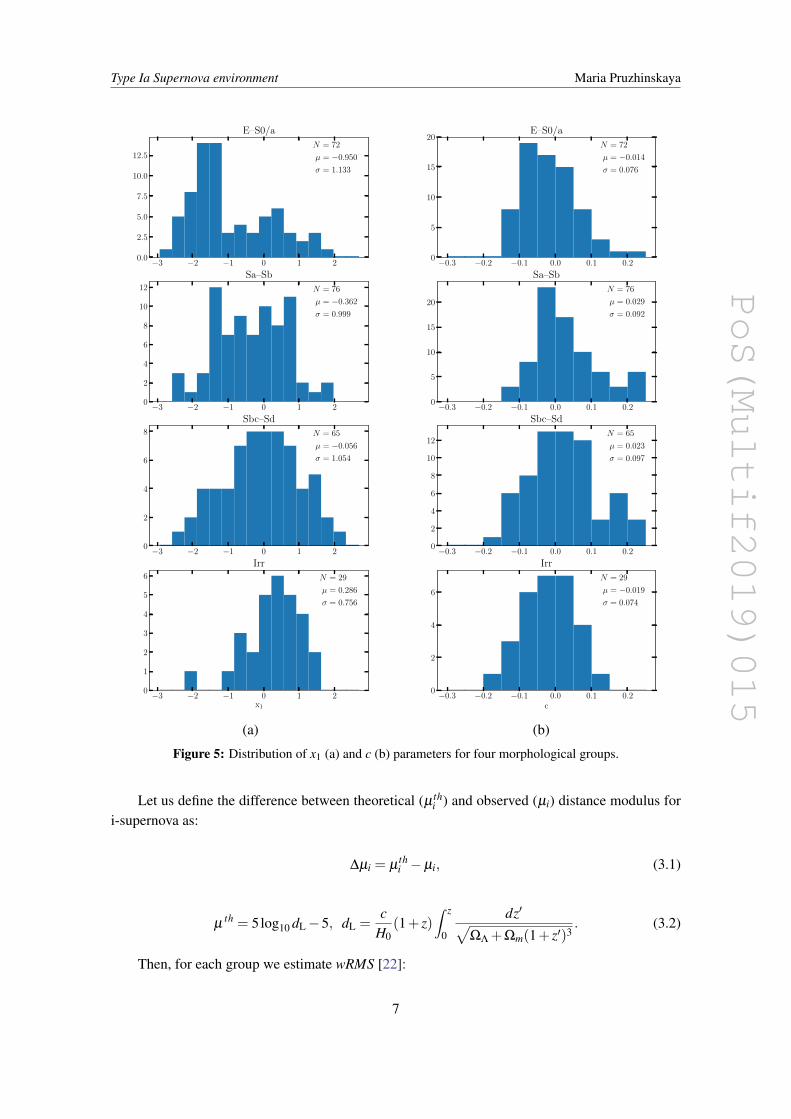
The distribution of Pantheon supernova by x1 parameter for four morphological groups isshown in Fig. 5a. It is seen that supernovae with low-stretch parameter prevail in elliptical andlenticular galaxies, middle stretch values are typical for spirals and highest x1 we found for SNe Iaexploded in irregular galaxies. The same analysis but for c parameter (Fig. 5b) did not revealany dependencies. This is consistent with the previous results obtained on other SNe Ia samples(e.g., [21]).
E E/S0 S0 S0/a S Sa Sab Sb Sbc Sc Scd Sd Irr0
10
20
30
40
50
Num
ber o
f gal
axie
s
Figure 4: Histogram shows the distribution of host galaxies of Pantheon SNe Ia by morphological typeaccording to the Hubble classification.
3.3.2 Hubble diagram
Using 248 SNe Ia from Pantheon, we plotted the Hubble diagram (Fig. 6) and calculatedthe residual dispersion in distance modulus for four groups (see Table 2). The standardizationparameters and ΩΛ are fixed at this step to the best-fit values in Pantheon analysis [3].
6
PoS(Multif2019)015
Type Ia Supernova environment Maria Pruzhinskaya
−3 −2 −1 0 1 20.0
2.5
5.0
7.5
10.0
12.5
N = 72
µ = −0.950
σ = 1.133
E–S0/a
−3 −2 −1 0 1 20
2
4
6
8
10
12 N = 76
µ = −0.362
σ = 0.999
Sa–Sb
−3 −2 −1 0 1 20
2
4
6
8 N = 65
µ = −0.056
σ = 1.054
Sbc–Sd
−3 −2 −1 0 1 2x1
0
1
2
3
4
5
6 N = 29
µ = 0.286
σ = 0.756
Irr
(a)
−0.3 −0.2 −0.1 0.0 0.1 0.20
5
10
15
20N = 72
µ = −0.014
σ = 0.076
E–S0/a
−0.3 −0.2 −0.1 0.0 0.1 0.20
5
10
15
20
N = 76
µ = 0.029
σ = 0.092
Sa–Sb
−0.3 −0.2 −0.1 0.0 0.1 0.20
2
4
6
8
10
12N = 65
µ = 0.023
σ = 0.097
Sbc–Sd
−0.3 −0.2 −0.1 0.0 0.1 0.2c
0
2
4
6
N = 29
µ = −0.019
σ = 0.074
Irr
(b)
Figure 5: Distribution of x1 (a) and c (b) parameters for four morphological groups.
Let us define the difference between theoretical (µ thi ) and observed (µi) distance modulus for
i-supernova as:
∆µi = µthi −µi, (3.1)
µth = 5log10 dL−5, dL =
cH0
(1+ z)∫ z
0
dz′√ΩΛ +Ωm(1+ z′)3
. (3.2)
Then, for each group we estimate wRMS [22]:
7

PoS(Multif2019)015
Type Ia Supernova environment Maria Pruzhinskaya
0.00 0.05 0.10 0.15 0.20 0.25 0.30 0.35z
34
36
38
40
mu
ESO/ESO/aSOSaSabSb
SbcScScdSdSIrr
Figure 6: Hubble diagram for 248 Pantheon supernovae.
Table 2: wRMS for four groups and in total for 248 Pantheon supernovae.Group ∆µ wRMSE-S0/a 0.1484Sa-Sb 0.1526Sbc-Sd 0.1608Irr 0.1358Full sample 0.1449
wRMS =
√√√√(
N
∑i=1
wi
)−1 N
∑i=1
wi∆µ2i , (3.3)
wi = σ−2i , (3.4)
where wi is weight of i-supernova.From Table 2 we could see that the residual dispersion in distance modulus differs for the
supernovae exploded in different type of galaxies. So, wRMS is smallest for SNe Ia in irregulargalaxies. This could reflect the fact that SN properties depends on host morphology — in some
8

PoS(Multif2019)015
Type Ia Supernova environment Maria Pruzhinskaya
hosts supernovae are more "standard" and therefore their dispersion on the Hubble diagram issmaller.
4. Conclusions
We studied the influence of host galaxy morphology on light curve parameters of the JLA andPantheon Type Ia supernovae. We confirmed that the stretch parameter of SNe Ia is correlatedwith the host galaxy type. The supernovae with lower stretch are hosted mainly by elliptical andlenticular galaxies. The correlation for colour parameter has not been found. This conclusionaccords to other researches that characterise the environment with the local parameters like localstar formation rate, local colour and etc.
The host galaxy morphology affects the residual dispersion on the Hubble diagram. JLASNe Ia in late-type spiral galaxies are more homogeneous in comparison with others. Therefore,we confirm that the supernova properties depend on their environment and the incorporation ofa host galaxy term into the Hubble diagram fit is expected to be crucial for future cosmologicalanalyses.
5. Acknowledgements
M. Pruzhinskaya acknowledges support from RSF grant 18-72-00159 for analysis of the envi-ronmental effects for Pantheon supernova sample. A. Novinskaya acknowledges support from theProgram of Development of M.V. Lomonosov Moscow State University (Leading Scientific School"Physics of stars, relativistic objects and galaxies").
References
[1] A. G. Riess, A. V. Filippenko, P. Challis, A. Clocchiatti, A. Diercks, P. M. Garnavich et al.,Observational Evidence from Supernovae for an Accelerating Universe and a CosmologicalConstant, AJ 116 (Sept., 1998) 1009–1038.
[2] S. Perlmutter, G. Aldering, G. Goldhaber, R. A. Knop, P. Nugent, P. G. Castro et al., Measurements ofOmega and Lambda from 42 High-Redshift Supernovae, ApJ 517 (June, 1999) 565–586.
[3] D. M. Scolnic, D. O. Jones, A. Rest, Y. C. Pan, R. Chornock, R. J. Foley et al., The CompleteLight-curve Sample of Spectroscopically Confirmed SNe Ia from Pan-STARRS1 and CosmologicalConstraints from the Combined Pantheon Sample, ApJ 859 (June, 2018) 101, [1710.00845].
[4] M. V. Pruzhinskaya and S. M. Lisakov, How supernovae became the basis of observationalcosmology, Journal of Astronomical History and Heritage 19 (Dec, 2016) 203–215, [1608.04192].
[5] B. W. Rust, Use of supernovae light curves for testing the expansion hypothesis and othercosmological relations, Ph.D. thesis, Oak Ridge National Lab., TN., 1974.
[6] I. P. Pskovskii, Light curves, color curves, and expansion velocity of type I supernovae as functions ofthe rate of brightness decline, Soviet Ast. 21 (Dec., 1977) 675–682.
[7] Y. P. Pskovskii, Photometric classification and basic parameters of type I supernovae, Soviet Ast. 28(Dec., 1984) 658–664.
[8] M. M. Phillips, The absolute magnitudes of Type IA supernovae, ApJL 413 (Aug., 1993) L105–L108.
9
PoS(Multif2019)015
Type Ia Supernova environment Maria Pruzhinskaya
[9] M. Hamuy, M. M. Phillips, N. B. Suntzeff, R. A. Schommer, J. Maza and R. Aviles, The AbsoluteLuminosities of the Calan/Tololo Type IA Supernovae, AJ 112 (Dec., 1996) 2391,[astro-ph/9609059].
[10] R. Tripp, A two-parameter luminosity correction for Type IA supernovae, A&A 331 (Mar., 1998)815–820.
[11] J. Guy, P. Astier, S. Baumont, D. Hardin, R. Pain, N. Regnault et al., SALT2: using distant supernovaeto improve the use of type Ia supernovae as distance indicators, A&A 466 (Apr., 2007) 11–21.
[12] G. Aldering, G. Adam, P. Antilogus, P. Astier, R. Bacon, S. Bongard et al., Overview of the NearbySupernova Factory, in SPIE Conference Series, vol. 4836, pp. 61–72, Dec., 2002.
[13] M. Rigault, V. Brinnel, G. Aldering, P. Antilogus, C. Aragon, S. Bailey et al., Strong Dependence ofType Ia Supernova Standardization on the Local Specific Star Formation Rate, arXiv e-prints (Jun,2018) arXiv:1806.03849, [1806.03849].
[14] J. Meyers, G. Aldering, K. Barbary, L. F. Barrientos, M. Brodwin, K. S. Dawson et al., THEHUBBLESPACE TELESCOPECLUSTER SUPERNOVA SURVEY. III. CORRELATED PROPERTIES OF TYPEia SUPERNOVAE AND THEIR HOSTS AT 0.9 less z less 1.46, The Astrophysical Journal 750 (apr,2012) 1.
[15] H. Domínguez Sánchez, M. Huertas-Company, M. Bernardi, D. Tuccillo and J. L. Fischer, Improvinggalaxy morphologies for SDSS with Deep Learning, Monthly Notices of the Royal AstronomicalSociety 476 (02, 2018) 3661–3676,[http://oup.prod.sis.lan/mnras/article-pdf/476/3/3661/24507962/sty338.pdf].
[16] M. Rigault, G. Aldering, M. Kowalski, Y. Copin, P. Antilogus, C. Aragon et al., Confirmation of aStar Formation Bias in Type Ia Supernova Distances and its Effect on the Measurement of the HubbleConstant, ApJ 802 (Mar, 2015) 20, [1412.6501].
[17] M. Roman, D. Hardin, M. Betoule, P. Astier, C. Balland, R. S. Ellis et al., Dependence of Type Iasupernova luminosities on their local environment, Astronomy and Astrophysics 615 (Jul, 2018) A68,[1706.07697].
[18] M. Betoule, R. Kessler, J. Guy, J. Mosher, D. Hardin, R. Biswas et al., Improved cosmologicalconstraints from a joint analysis of the sdss-ii and snls supernova samples", A&A 568 (2014) 32.
[19] V. Henne, M. V. Pruzhinskaya, P. Rosnet, P.-F. Léget, E. E. O. Ishida, A. Ciulli et al., The influence ofhost galaxy morphology on the properties of Type Ia supernovae from the JLA compilation, New A 51(Feb., 2017) 43–50, [1608.03674].
[20] M. Hicken, W. M. Wood-Vasey, S. Blondin, P. Challis, S. Jha, P. L. Kelly et al., Improved DarkEnergy Constraints from ˜100 New CfA Supernova Type Ia Light Curves, ApJ 700 (Aug., 2009)1097–1140, [0901.4804].
[21] M. Sullivan, A. Conley, D. A. Howell, J. D. Neill, P. Astier, C. Balland et al., The dependence of TypeIa Supernovae luminosities on their host galaxies, MNRAS 406 (Aug., 2010) 782–802,[1003.5119].
[22] S. Blondin, K. S. Mandel and R. P. Kirshner, Do spectra improve distance measurements of Type Iasupernovae?, A&A 526 (Feb, 2011) A81, [1012.0005].
10

PoS(Multif2019)015
Type Ia Supernova environment Maria Pruzhinskaya
DISCUSSION
WOLFGANG KUNDT’s Comment: Maria, you mentioned a thermally exploding white dwarfthat gave rise to a SN of type Ia. There is the problem that for non-negligible gravity, explosionsdriven by non-relativistic pistons cool too fast for escape motion, i.e recollapse before expansion,like fountains. You should allow your white dwarf to tap a relativistic reservoir.
JIM BEALL: Do you find evidence of the possible different constitution of the SN depending onWD–WD or opposite to WD–normal stars?
MARIA PRUZHINSKAYA: By now we do not know which mechanism (SD or DD) works orif both in which proportion. From the observational point of view, polarimetric and spectropo-larimetric observations could shed light on this problem. In case of DD explosion, the specificangular momentum of matter is higher than in the SD scenario. This could lead to an anisotropyof the explosion and asymmetrical loss of envelope and, consequently, a significant polarization ofoptical radiation is expected. Thereby, the registration of significant (more than 2%) polarizationcan be an independent argument for a model of merging white dwarfs. It should be noted that thecontinuum polarization depends on the geometry of the explosion but line polarization associateswith distribution of matter around supernovae.
11