
Influence of Geometric Simplifications on Lightning Strike ...
18
Progress In Electromagnetics Research C, Vol. 83, 15–32, 2018 Influence of Geometric Simplifications on Lightning Strike Simulations Guadalupe G. Gutierrez 1, * , Sergio F. Romero 2 , Monica Gonzaga 3 , Enrique Pascual-Gil 1 , Luis D. Angulo 4 , Miguel R. Cabello 4 , and Salvador G. Garcia 4 Abstract—This paper discusses the influence of simplifications in models used in the design of electromagnetic protection against indirect effects of lightning strikes. A real and complex test case such as the power plant of an A400M aircraft, simulated with the FDTD method, is chosen for this. The parameters studied are the inclusion/removal of installations, modification of electrical contacts, material properties, and changes in the cable characteristics. The simulations performed allow us to quantify the impact of different simplification approaches and, in consequence, to draw conclusions on the relative importance of different model features, being the most important ones to maintain the electrical contacts, to include installations and cables carrying high currents, to consider different materials, to respect the accurate cable routes or to take care of isolated equipment. 1. INTRODUCTION A commercial aircraft is subject to at least one lightning strike per year [1]. The effects of these strikes can be categorised into two kinds of damaging effects: direct or indirect [1]. Direct effects consist of physical damage to the structure due to direct attachment or to current flow. Indirect effects, on which we focus this study, are generated by voltage and current transients in the electrical wiring. These transients are caused by the electromagnetic (EM) field created by the lightning current which flows along the aircraft surface. This EM field penetrates the fuselage through apertures such as windows or by diffusion through parts made of composite materials. Inside the aircraft, these transients can overcome the immunity limit of the equipment, generating failures and/or damage, compromising aircraft safety. Among the indirect effects, the most significant parameters are rates of current rise and decay, and peak amplitude [2–5]. The aim of lightning protection is to prevent catastrophic accidents arising from a lightning strike, to ensure a safe flight and landing [1, 2, 6, 7]. Computational electromagnetic (CEM) tools can help predict the response of a complex structure. A wide variety of algorithms and methods have been developed to address the electrically large problems that are often encountered in the aircraft industry. This advance, together with the exponential growth of computational capabilities, makes it possible to estimate transfer functions between a lightning strike and internal fields or the currents induced on bundles in a complete aircraft. These methods can be applied during the certification process and the life-cycle of an aircraft, thus increasing flight safety. CEM methods also make it possible to carry out parametric studies during the design phase, when changes are simpler and less costly. However, the development of suitable EM models for complex structures is a time-consuming process. As a first step, a geometric simplification is needed, since the full digital mock-up cannot be directly managed by EM simulators. This simplification is a crucial task, which usually implies the elimination of very small parts and details, such as holes, bolts and nuts, Received 10 January 2018, Accepted 17 March 2018, Scheduled 4 April 2018 * Corresponding author: Guadalupe Gutierrez Gutierrez ([email protected]). 1 Airbus Defence and Space, Getafe, Spain. 2 INTA, Torrejon de Ardoz, Spain. 3 CT Ingenieros, Getafe, Spain. 4 Department of Electromagnetism, University of Granada, Granada, Spain.
Transcript of Influence of Geometric Simplifications on Lightning Strike ...

Progress In Electromagnetics Research C, Vol. 83, 15–32, 2018
Influence of Geometric Simplifications on Lightning StrikeSimulations
Guadalupe G. Gutierrez1, *, Sergio F. Romero2, Monica Gonzaga3, Enrique Pascual-Gil1,Luis D. Angulo4, Miguel R. Cabello4, and Salvador G. Garcia4
Abstract—This paper discusses the influence of simplifications in models used in the design ofelectromagnetic protection against indirect effects of lightning strikes. A real and complex test casesuch as the power plant of an A400M aircraft, simulated with the FDTD method, is chosen for this.The parameters studied are the inclusion/removal of installations, modification of electrical contacts,material properties, and changes in the cable characteristics. The simulations performed allow us toquantify the impact of different simplification approaches and, in consequence, to draw conclusionson the relative importance of different model features, being the most important ones to maintainthe electrical contacts, to include installations and cables carrying high currents, to consider differentmaterials, to respect the accurate cable routes or to take care of isolated equipment.
1. INTRODUCTION
A commercial aircraft is subject to at least one lightning strike per year [1]. The effects of these strikescan be categorised into two kinds of damaging effects: direct or indirect [1]. Direct effects consist ofphysical damage to the structure due to direct attachment or to current flow. Indirect effects, on whichwe focus this study, are generated by voltage and current transients in the electrical wiring. Thesetransients are caused by the electromagnetic (EM) field created by the lightning current which flowsalong the aircraft surface. This EM field penetrates the fuselage through apertures such as windows or bydiffusion through parts made of composite materials. Inside the aircraft, these transients can overcomethe immunity limit of the equipment, generating failures and/or damage, compromising aircraft safety.Among the indirect effects, the most significant parameters are rates of current rise and decay, andpeak amplitude [2–5]. The aim of lightning protection is to prevent catastrophic accidents arising froma lightning strike, to ensure a safe flight and landing [1, 2, 6, 7].
Computational electromagnetic (CEM) tools can help predict the response of a complex structure.A wide variety of algorithms and methods have been developed to address the electrically large problemsthat are often encountered in the aircraft industry. This advance, together with the exponential growthof computational capabilities, makes it possible to estimate transfer functions between a lightning strikeand internal fields or the currents induced on bundles in a complete aircraft. These methods can beapplied during the certification process and the life-cycle of an aircraft, thus increasing flight safety.CEM methods also make it possible to carry out parametric studies during the design phase, whenchanges are simpler and less costly. However, the development of suitable EM models for complexstructures is a time-consuming process. As a first step, a geometric simplification is needed, since thefull digital mock-up cannot be directly managed by EM simulators. This simplification is a crucial task,which usually implies the elimination of very small parts and details, such as holes, bolts and nuts,
Received 10 January 2018, Accepted 17 March 2018, Scheduled 4 April 2018* Corresponding author: Guadalupe Gutierrez Gutierrez ([email protected]).1 Airbus Defence and Space, Getafe, Spain. 2 INTA, Torrejon de Ardoz, Spain. 3 CT Ingenieros, Getafe, Spain. 4 Department ofElectromagnetism, University of Granada, Granada, Spain.

16 Gutierrez et al.
and may also call for surfaces to be redefined [8, 9]. The analysis of uncertainties associated with thisprocess is currently the focus of much research attention. Statistical methods dealing with uncertaintiesin the parameters of cables, materials, circuits, etc., such as those based on Monte Carlo analysis or onstochastic Finite Difference Time Domain (FDTD) modelling [10, 11], are still either computationallyprohibitive or too limited, to be applied to the complexity of a modern aircraft. For this reason, theengineer’s experience in managing the information included in the digital mock-up plays a fundamentalrole in the success of this process.
This paper contributes to our understanding of these questions by quantifying the impact of differentsimplification approaches, in order to enrich the few literature that can be found on this subject. To doso, we employ a test case based on the power plant of the A400M aircraft [12] to assess which parametersare most influential in an EM simulation, by conducting a heuristic approach based on an affordable setof simulations chosen as representative according to our engineering experience. In particular, we studythe inclusion of installations (that is, physical structures needed to install the systems in the aircraft fortheir correct support and operation), the maintenance of electrical contacts, the assignation of materials,and the selection of appropriate cables with their significant properties. We then estimate the sensitivityof these simulation results to variations in the EM model. Theoretical guidelines are provided, and, inaddition, a quantitative notion of the error magnitude which is made with these approximations. Thefactors which should be taken into account in a 3D EM model for lightning indirect effects are analyzedusing this real and complex test case, so as to quantify their influence in the simulation results. Otherfactors are revealed as not important for this kind of simulations.
The rest of the paper is organized as follows. In Section 2, the model of the power plant is described,and the features of the simulations performed are explained. Section 3 presents the results obtainedand discusses the modifications taken into account. Finally, in Section 4, we draw the main conclusionsof our analysis.
2. SIMULATION DETAILS
2.1. Model Details
The EM model of the A400M power plant represented in Fig. 1 was selected for our parametric studyfor two main reasons: it is a very complex and complete model, which allows us to perform most ofthe modifications needed for this study, and its size is affordable, and so a large number of simulations
Figure 1. A400M power plant EM model (carbon fibre nacelle shown in white with a degree oftransparency; the metallic nacelle is in yellow, the mounting is in green, the engine is in red, theequipment is in brown, the systems are in cyan and the harnesses are in dark blue).

Progress In Electromagnetics Research C, Vol. 83, 2018 17
can be performed. The power plant has three main structural components: the engine, the mountingand the nacelle. The lightning channel, represented by a nodal electric current density source [13], waschosen to impact the power plant at the nose and to exit it via the mounting to the wing, which is oneof the most common situations. In this configuration, the mounting is the principal massive metallicstructure along which the current flows. The nacelle includes the fairings, which are mainly made ofcarbon fibre composite (CFC). For the reference model used in our comparisons, all the equipment andinstallations are included. The total length of the power plant is around 6m.
Four overbraided harnesses were included in the model to analyse the currents induced on them.They have been especially selected between the real harnesses of the power plant to cover the differentzones of the model. Their description is as follows:.
• The Controller Area Network bus (CANBUS) harness has 17 branches, with sizes from 300 to1500 mm, that interconnect 10 items of equipment around the engine.
• The Electronic Control Unit (ECU) and the Air Cooled Oil Cooler (ACOC) Actuator are connectedthrough the ECU-ACOC harness. This is a simple cable with no branches, about 4m long.
• The H502 harness connects two fire detection sensors located in the nacelle and extends 6 m acrossthe lower fairing, with no branches.
• PBCU-FW is a harness with 7 branches, measuring no more than 600 mm, located between themounting and the upper fairing. It connects the Propeller Brake Control Unit (PBCU) with thefirewall (FW) to the wing.
2.2. Simulation Description
We analyse the induced current response to a severe first return stroke of a lightning bolt. This waveform(WF A) consists of a double exponential with 200 kA peak current and around 6.4µs rise time [14]. InAugust 2008, IEEE issued and standard defining the Feature Selective Validation (FSV) technique forthe comparison of different traces in CEM [15–17]. However, in this work, we have focused the study inanalysing the main parameters which must be considered in order to provide an aircraft with lightningstrike protection in compliance with international certification requirements. Both time and frequencydomains are analysed, since they contain different information: peak amplitude and time to peak (timeinterval from the start of the simulation until the peak is reached) are, in general, straightforward toanalyse in the time domain, while main resonances are more easily analysed in the frequency domain.In the time domain, a Gaussian derivative, shorter than WF A but covering the same spectral range,was used as an excitation waveform, and the results obtained were transformed into WF A response.For the reference configuration, the simulation using directly the WF A has been performed, leading toexactly the same peak currents and times to peak, which are the values analysed in the present study. Inthe frequency domain, a Gaussian waveform was used to excite the structure so as to reach frequenciesup to 50 MHz, which were taken as the upper limit of a lightning strike excitation.
In this study, two kinds of observables were considered:• 26 probes for the currents induced at each cable branch: 17 from the CANBUS harness, 1 from
ECU-ACOC, 1 from H502 and 7 from the PBCU-FW harness. These probes measure the currentat particular thin wire nodes [18]. As typical in EMC testing, current probes were placed at adistance of 50 mm from the harness end for ending branches [19], and in the middle of the branchfor the intermediate branches.
• Bulk current probes at the 6 main installations, to determine the current that flows across theirsurfaces. They compute the currents within an integral contour utilizing Ampere’s law [20].The actual transient level (ATL), which reflects the current and voltage waveforms and levels that
are induced on the aircraft at the port of the cable networks, is determined from simulations [3–5, 14, 19],and leaves little margin for errors or tolerances. In our study, differences of over 1 dB (12.2% error)were considered significant.
A Cartesian FDTD mesh with a constant space-step of 10 mm, small enough to solve thefrequencies of interest and to represent the details of the A400M PWP, while big enough to lead toaffordable simulations, was employed for the simulations. Mur’s [21] absorbing boundary conditions,computationally lighter than those based on the perfectly matching layer condition [22], were employed

18 Gutierrez et al.
to truncate the domain, yielding a problem size of around 100 Mcells. A time-step of 15 ps wasemployed to meet the Courant-Friedrichs-Lewy (CFL) stability condition [22]. A total time of 10 µswas simulated, which was sufficient to obtain reasonable convergence of the currents. A computationtime of approximately 46 hours, using 2 Intel Xeon eight-core 2.9 GHz nodes with 128 GB of memory(400 Mcells/s), was required for each configuration.
2.3. Simulation Tools
Several EM simulation tools can be used in the design of protection against lightning strikes. Of these,we selected the one based on the FDTD technique [22] as the most suitable method for this kindof problem, as it obtains the solution in the whole frequency range with a single execution. In thisstudy, the 3D CAD CATIA V5 R21 [23], FDTD mesher CADfix V8.1 SP2.0 64 bit [24], and FDTDsolver UGRFDTD R2660 [25] were used to generate the simplified CAD, to mesh it and to simulate it,respectively.
CADfix allows the user to mesh the region where EM propagation is to be calculated. It servesas a graphical user interface which can import data from computer-aided design (CAD) models. Allrelevant EM properties (permittivity, permeability, impedance, etc.) can be defined, together with theboundary conditions, mesh density, probe locations, etc. CADfix generates a text file containing all theinformation needed to specify the problem, and this can provide the input to UGRFDTD. This solveris a state-of-the-art parallel 3D full-wave EM simulation tool which uses the FDTD method [22, 26],combined with a multiconductor transmission line (MTLN) solver [27] to adress the cabling. It hasbeen developed by UGR in collaboration with Airbus Defence and Space within several research andtechnology projects [28, 29]. It is especially suited to deal with HIRF/Lightning/NEMP electrically-large EMC problems [30–33], and can account for complex structures, materials, cables, compositethin-panels, etc. A variety of output data can be obtained including the electric current and voltagetransient profiles stressing electric/electronic equipment considered in this study.
3. ANALYSIS OF RESULTS
Four different kinds of tests were analysed. The main results from the most conclusive cases are presentedand explained in this section. In the following tables, Δ (dB), Δ or Δpeak (dB) stand for the amplitudedifferences in dB between the peak current in the modified model with respect to the reference model,and Δt (µs) or Δt stand for the differences in µs between the time to peak in the modified model withrespect to the reference model.
3.1. Removal of Components
Since the geometric simplification is extremely time consuming (it can require years for a completeaircraft), when a complex geometry is to be simplified, it is important to know which components(equipment, systems, installations, etc.) are relevant for the model. To assess the effects of their removal,we carried out simulations and studied the peak currents induced. The differences observed with respectto the reference model are shown in Table 1.
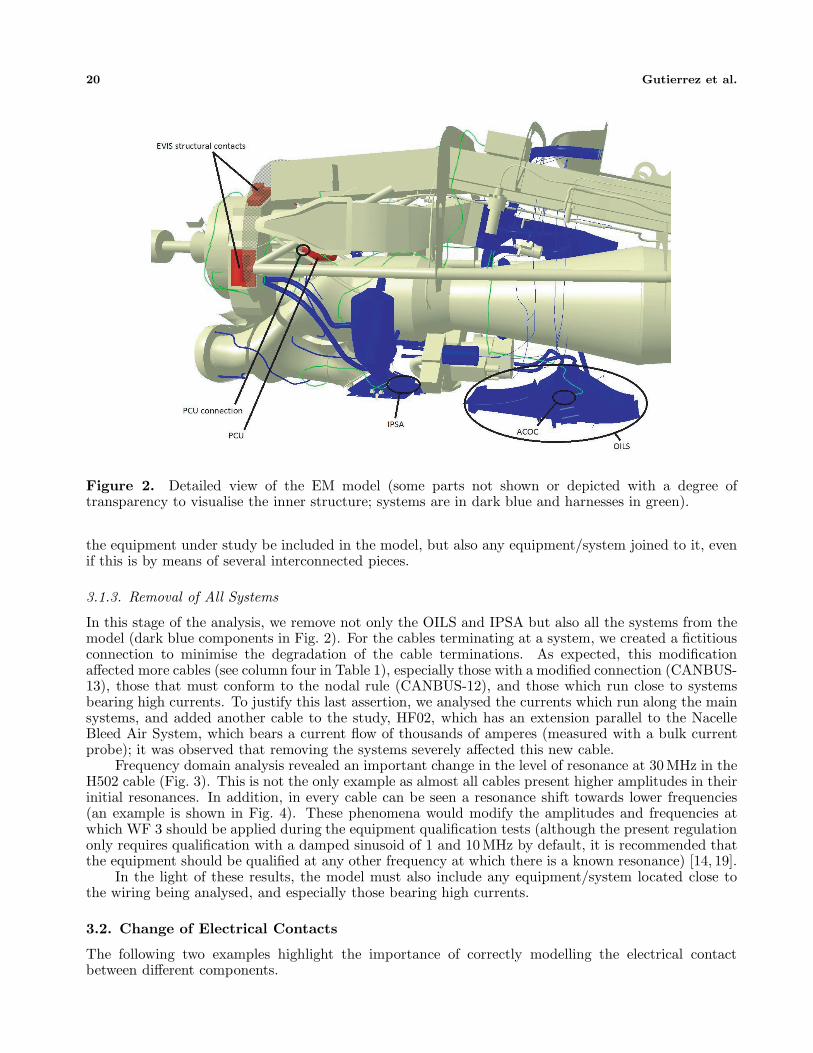
3.1.1. Removal of Oil System (OILS)
The OILS is located far from the majority of cable branches but in electrical contact with ACOC, whichis one termination of the ECU-ACOC harness (Fig. 2). The currents in two branches, ECU-ACOC andCANBUS-15, change significantly after this removal. The change in the ECU-ACOC harness couldhave been estimated a priori as the ACOC system is in electrical contact with the OILS. Less obviousis the variation in the current induced along the CANBUS-15. This is explained by two facts. Firstly,this branch ends at ECU and runs parallel to the ECU-ACOC cable, and so there is a large mutualinductance. Secondly, as shown below, significant variations are almost always observed in the currentsat CANBUS-15, whatever the modification made to the model, because its current is very low, andso any variation is very noticeable. Moreover, many modifications in the model can produce a changein the waveform within this cable, significantly affecting its peak current. However, this is not always

Progress In Electromagnetics Research C, Vol. 83, 2018 19
Table 1. Removal of components.
BranchOILS IPSA SystemsΔ(dB) Δ(dB) Δ(dB)
CANBUS-1 0.0 0.0 1.1CANBUS-2 0.0 0.0 1.0CANBUS-3 0.0 0.0 1.0CANBUS-4 0.0 0.0 1.0CANBUS-5 0.0 0.1 1.0CANBUS-6 0.0 0.0 1.2CANBUS-7 0.0 0.0 1.4CANBUS-8 0.0 0.0 0.8CANBUS-9 0.0 −0.1 0.8CANBUS-10 0.0 0.0 0.2CANBUS-11 0.0 0.0 1.1CANBUS-12 0.0 0.0 2.3CANBUS-13 0.1 0.5 −6.9CANBUS-14 0.0 0.1 0.4CANBUS-15 1.4 6.9 12.7CANBUS-16 0.1 0.3 0.9CANBUS-17 0.0 0.0 −0.3
ECU-ACOC-1 1.2 1.1 2.5H502-1 0.5 0.0 −0.7
PBCU-FW-1 0.0 0.0 0.2PBCU-FW-2 0.0 0.0 0.1PBCU-FW-3 0.0 0.0 0.1PBCU-FW-4 0.0 0.0 0.0PBCU-FW-5 0.0 0.0 0.0PBCU-FW-6 0.0 0.0 0.0PBCU-FW-7 0.0 0.0 0.0
HF02 n/a n/a 10.6
true for cables carrying small currents; thus, the PBCU-FW-1 current is also very low, but, since it islocated further away, it is less affected by modifications.
In view of these results, we conclude that not including an equipment item or system in the modelcould be an unwise decision, negatively affecting the assessment made of equipment in electrical contactwith the equipment/system excluded.
3.1.2. Removal of the Inlet Particle Separator Actuator (IPSA)
The conclusions reached in the above section hold even for the removal of a small item of equipment(IPSA in Fig. 2), when its electrical connection with the cable termination under analysis is not soevident. There is no cable connecting the IPSA, but it is in contact with the OILS by means of thelower fairing, and, as observed above, the OILS, in turn, is in electrical contact with ACOC. In thiscase, considerable differences are also evident at CANBUS-15 and ECU-ACOC, as shown in the thirdcolumn of Table 1.
Therefore, we conclude that not only must the equipment/systems in direct electrical contact with
20 Gutierrez et al.
Figure 2. Detailed view of the EM model (some parts not shown or depicted with a degree oftransparency to visualise the inner structure; systems are in dark blue and harnesses in green).
the equipment under study be included in the model, but also any equipment/system joined to it, evenif this is by means of several interconnected pieces.
3.1.3. Removal of All Systems
In this stage of the analysis, we remove not only the OILS and IPSA but also all the systems from themodel (dark blue components in Fig. 2). For the cables terminating at a system, we created a fictitiousconnection to minimise the degradation of the cable terminations. As expected, this modificationaffected more cables (see column four in Table 1), especially those with a modified connection (CANBUS-13), those that must conform to the nodal rule (CANBUS-12), and those which run close to systemsbearing high currents. To justify this last assertion, we analysed the currents which run along the mainsystems, and added another cable to the study, HF02, which has an extension parallel to the NacelleBleed Air System, which bears a current flow of thousands of amperes (measured with a bulk currentprobe); it was observed that removing the systems severely affected this new cable.
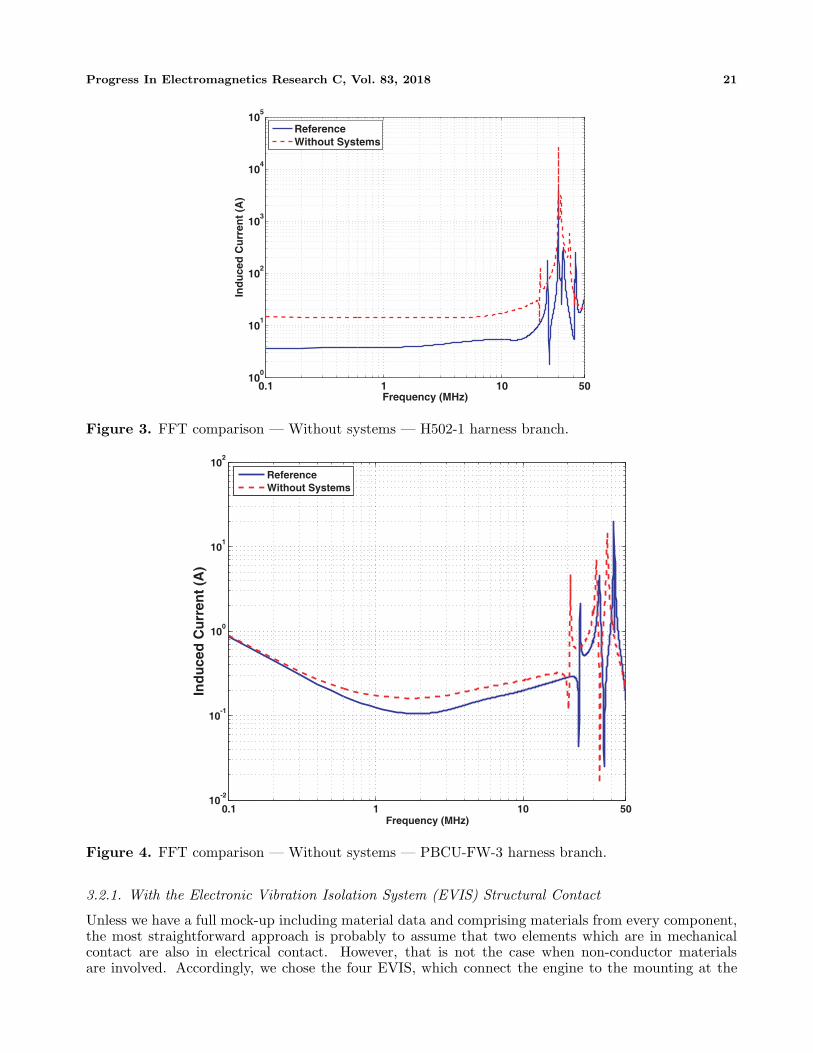
Frequency domain analysis revealed an important change in the level of resonance at 30 MHz in theH502 cable (Fig. 3). This is not the only example as almost all cables present higher amplitudes in theirinitial resonances. In addition, in every cable can be seen a resonance shift towards lower frequencies(an example is shown in Fig. 4). These phenomena would modify the amplitudes and frequencies atwhich WF 3 should be applied during the equipment qualification tests (although the present regulationonly requires qualification with a damped sinusoid of 1 and 10 MHz by default, it is recommended thatthe equipment should be qualified at any other frequency at which there is a known resonance) [14, 19].
In the light of these results, the model must also include any equipment/system located close tothe wiring being analysed, and especially those bearing high currents.
3.2. Change of Electrical Contacts
The following two examples highlight the importance of correctly modelling the electrical contactbetween different components.
Progress In Electromagnetics Research C, Vol. 83, 2018 21
0.1 1 10 5010
0
101
102
103
104
105
Frequency (MHz)
Ind
uce
d C
urr
ent
(A)
ReferenceWithout Systems
Figure 3. FFT comparison — Without systems — H502-1 harness branch.
0.1 1 10 5010
-2
10-1
100
101
102
Frequency (MHz)
Ind
uce
d C
urr
ent
(A)
ReferenceWithout Systems
Figure 4. FFT comparison — Without systems — PBCU-FW-3 harness branch.
3.2.1. With the Electronic Vibration Isolation System (EVIS) Structural Contact
Unless we have a full mock-up including material data and comprising materials from every component,the most straightforward approach is probably to assume that two elements which are in mechanicalcontact are also in electrical contact. However, that is not the case when non-conductor materialsare involved. Accordingly, we chose the four EVIS, which connect the engine to the mounting at the

22 Gutierrez et al.
front part of the model, but which are insulating (Fig. 2). The electrical connection is guaranteed byfour bonding jumpers because the current must pass from the engine to the mounting. Nevertheless,even though there is an electrical connection, the induction diminishes if this connection is made bystructural means rather than by bonding braids. As can be seen in the second column of Table 2, thisis more significant for the cables that connect equipment to the engine, because of the smaller amountof current flowing through the engine. The third column in Table 2 also shows that most of the cablesaffected are subject to a delay in the peak time. In every cable, there is a resonance shift towards higherfrequencies, as explained above, and this could lead to problems in performing the qualification withWF 3.
Table 2. Change of electrical contacts.
Branch With EVIS Str Without PCU ConnΔ(dB) Δt(µs) Δ(dB)
CANBUS-1 −19.6 −0.3 −0.1CANBUS-2 −19.3 1.3 0.6CANBUS-3 −17.7 8.5 1.9CANBUS-4 −18.8 −0.5 −0.9CANBUS-5 −18.5 −1.4 −2.8CANBUS-6 −8.1 0.1 1.7CANBUS-7 −8.6 0.5 1.7CANBUS-8 −6.5 −0.7 1.5CANBUS-9 −2.7 4.9 −5.5CANBUS-10 −13.0 8.6 −27.9CANBUS-11 −12.7 7.7 −∞CANBUS-12 −12.0 6.0 −22.6CANBUS-13 −15.6 2.1 6.6CANBUS-14 −13.0 5.1 −3.1CANBUS-15 18.2 14.4 16.3CANBUS-16 −15.0 0.9 −1.9CANBUS-17 0.0 0.0 0.0
ECU-ACOC-1 −20.1 13.7 −0.5H502-1 −2.6 −0.4 0.0
PBCU-FW-1 5.0 17.1 −0.2PBCU-FW-2 0.5 −0.4 0.0PBCU-FW-3 −0.4 0.3 0.0PBCU-FW-4 0.2 −0.1 0.0PBCU-FW-5 0.0 0.1 0.0PBCU-FW-6 0.0 0.0 0.0PBCU-FW-7 0.0 0.0 0.0
There is a huge reduction in the current induced in the model with EVIS, and therefore we concludethat adding a structural contact where one does not exist, even though there is another form of electricalcontact, could lead to insufficient qualification/protection, jeopardising the safety of the aircraft.
3.2.2. Without Propeller Control Unit (PCU) Connection
Mock-ups are usually divided into discrete zones so that it is not necessary to open up the complete modelin order to see one particular item, thus reducing memory requirements. The PCU is an equipment

Progress In Electromagnetics Research C, Vol. 83, 2018 23
element which is joined to the engine by a set of cylinders (Fig. 2) represented in different zones of themock-up. The fourth column of Table 2 shows how the currents induced would change if one of thesecylinders were not included. This might happen if the zone in which it is located were not present on thescreen. Not only CANBUS-11, which is the branch connected to PCU and thus in open circuit in themodified configuration, but virtually the entire harness would be affected, in order to meet the nodalrule. The error might be readily apparent if the CANBUS-11 branch is analysed; on the other hand,the PCU might be beyond of the scope of observation; nevertheless, its error would be propagated tothe branches of the equipment being studied. Frequency domain results show that, even when thereis no direct current flowing along CANBUS-11 (remember the −∞ obtained in the time domain), theresonance at 25 MHz strengthens (Fig. 5). In consequence, when a cable termination is disconnected,the high frequency must be considered. Simulating this equipment as being isolated would lead us toqualify the equipment with a WF 3 of high amplitude at 25 MHz, when in reality there is no reason todo so.
0.1 1 10 5010
-1
100
101
102
103
104
105
Frequency (MHz)
Ind
uce
d C
urr
ent
(A)
ReferenceWithout PCU Connection
Figure 5. FFT comparison — Without PCU connection — CANBUS-11 harness branch.
Therefore, we conclude that the electrical contacts between the equipment and the whole modelare of prime importance, so much so that if these questions were ignored, systems could be incorrectlyqualified.
3.3. Inclusion of Non-PEC Materials
The configurations presented below were devised to enable us to analyse the consideration of materialsother than perfect electric conductors (PEC).
3.3.1. PEC
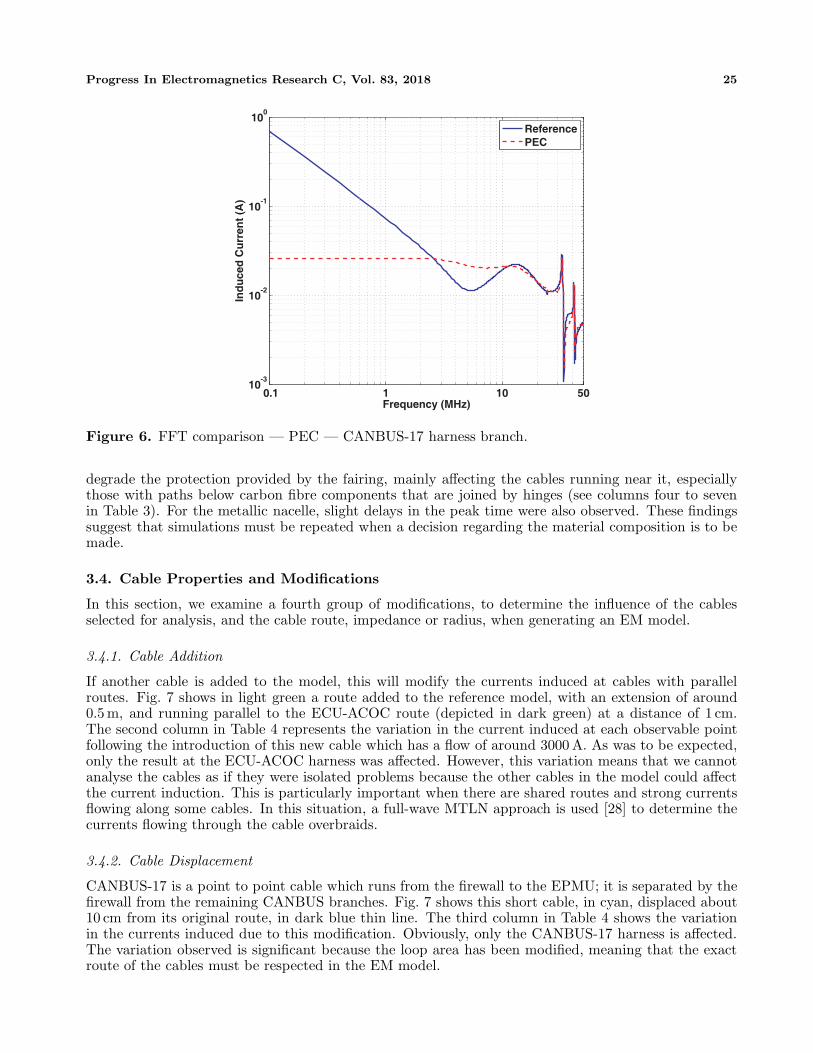
Most of the nacelle is made of carbon fibre, and it can be modelled using thin layer sub-cell models,as described in [34]. In the present study mean values of conductivity and thickness for the thin-layermaterial were assigned and no anisotropy was taken into account (conductivity of 2.2 · 104 S/m and2mm of thickness for CFC and conductivity of 3.3 ·104 S/m and 2 mm of thickness for CFC with bronzemesh). The second and third columns of Table 3 show what happens if it is modelled simply as a PEC.In general, current induction is expected to be lower, due to the better shielding effectiveness of PECmaterials, which provide greater protection against lightning strikes and prevent the field leakage within

24 Gutierrez et al.
Table 3. Material assignation (Δ is in db and Δt in µs).
BranchPEC Lossy RefCFC Lossy RefPEC
Δ Δt Δ Δt Δ ΔtCANBUS-1 0.1 0.1 −0.1 −0.1 −0.1 0.0CANBUS-2 0.0 0.1 0.0 0.1 0.0 0.0CANBUS-3 −0.1 −0.1 0.1 0.2 0.2 0.1CANBUS-4 0.1 0.2 0.0 0.1 0.0 0.2CANBUS-5 0.2 0.4 −0.1 0.0 0.0 0.1CANBUS-6 0.0 0.0 0.0 0.1 0.0 0.1CANBUS-7 0.0 −0.1 0.0 0.0 0.0 0.1CANBUS-8 0.1 0.3 0.1 0.1 0.1 0.1CANBUS-9 −1.0 −2.8 0.2 0.1 0.2 0.1CANBUS-10 −0.3 −0.5 0.0 0.1 0.1 0.1CANBUS-11 −0.2 −0.5 0.1 0.1 0.1 0.1CANBUS-12 −0.2 −0.4 0.2 0.0 0.2 0.0CANBUS-13 −0.2 −0.4 0.6 0.4 0.7 0.8CANBUS-14 −0.2 −0.3 0.3 0.2 0.3 0.3CANBUS-15 2.5 1.8 2.9 2.2 5.9 6.8CANBUS-16 −0.1 −0.1 0.4 0.3 0.5 0.5CANBUS-17 −43.1 −12.5 −0.3 0.0 −1.2 −0.3
ECU-ACOC-1 0.4 0.7 −1.7 −1.4 −1.8 −1.7H502-1 −5.8 −9.3 4.4 −3.7 8.5 4.9
PBCU-FW-1 0.0 1.3 17.1 13.5 19.6 11.9PBCU-FW-2 −22.5 −13.4 2.6 −0.4 14.0 12.7PBCU-FW-3 −28.8 −11.4 −5.6 2.6 26.5 11.6PBCU-FW-4 −45.1 −13.9 3.1 −0.4 34.6 10.4PBCU-FW-5 −42.3 −12.2 1.2 0.2 1.9 −2.3PBCU-FW-6 −44.9 −12.0 1.1 0.3 2.5 −2.2PBCU-FW-7 −40.3 −12.4 1.2 0.2 1.6 −2.3
the structure. On the other hand, the slight delays in the peak time that are observed in the carbonfibre nacelle, due to its electrical resistance, especially in the branches running near the fairings, that is,CANBUS-17, H502 and PBCU-FW harnesses, disappear when everything is PEC. Frequency domainresults show that the induction only decreases at low frequencies, since at high frequencies the carbonfibre is close to being a PEC (Fig. 6).
3.3.2. Lossy Hinges
The hinges are sometimes made of fibre, in order to save weight. In this section, we study the effect oflossy hinges on protection against lightning. To do so, properties of isotropic material with a conductivityof 103 S/m were assigned to the door hinges. This modification was first carried out in the referencemodel, that is, with the carbon fibre nacelle. Subsequently, the same modification was performed inthe completely metallic model analysed in the previous section. In both cases, lossy hinges moderately
Progress In Electromagnetics Research C, Vol. 83, 2018 25
0.1 1 10 5010
-3
10-2
10-1
100
Frequency (MHz)
Ind
uce
d C
urr
ent
(A)
ReferencePEC
Figure 6. FFT comparison — PEC — CANBUS-17 harness branch.
degrade the protection provided by the fairing, mainly affecting the cables running near it, especiallythose with paths below carbon fibre components that are joined by hinges (see columns four to sevenin Table 3). For the metallic nacelle, slight delays in the peak time were also observed. These findingssuggest that simulations must be repeated when a decision regarding the material composition is to bemade.
3.4. Cable Properties and Modifications
In this section, we examine a fourth group of modifications, to determine the influence of the cablesselected for analysis, and the cable route, impedance or radius, when generating an EM model.
3.4.1. Cable Addition
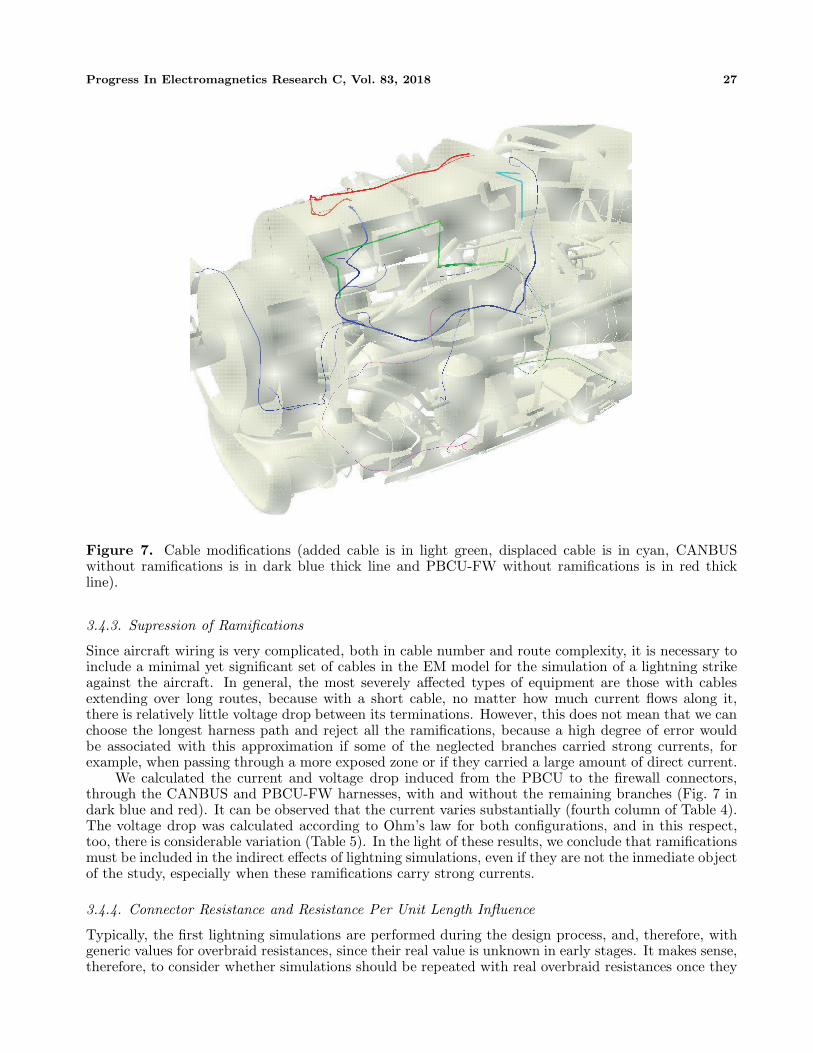
If another cable is added to the model, this will modify the currents induced at cables with parallelroutes. Fig. 7 shows in light green a route added to the reference model, with an extension of around0.5 m, and running parallel to the ECU-ACOC route (depicted in dark green) at a distance of 1 cm.The second column in Table 4 represents the variation in the current induced at each observable pointfollowing the introduction of this new cable which has a flow of around 3000 A. As was to be expected,only the result at the ECU-ACOC harness was affected. However, this variation means that we cannotanalyse the cables as if they were isolated problems because the other cables in the model could affectthe current induction. This is particularly important when there are shared routes and strong currentsflowing along some cables. In this situation, a full-wave MTLN approach is used [28] to determine thecurrents flowing through the cable overbraids.
3.4.2. Cable Displacement
CANBUS-17 is a point to point cable which runs from the firewall to the EPMU; it is separated by thefirewall from the remaining CANBUS branches. Fig. 7 shows this short cable, in cyan, displaced about10 cm from its original route, in dark blue thin line. The third column in Table 4 shows the variationin the currents induced due to this modification. Obviously, only the CANBUS-17 harness is affected.The variation observed is significant because the loop area has been modified, meaning that the exactroute of the cables must be respected in the EM model.

26 Gutierrez et al.
Table 4. Cable properties and modifications.
Cable modifications
BranchAddition Displacement Ramifications
Δ(dB) Δ(dB) Δ(dB)
CANBUS-1 −0.3 0.0 −22.2
CANBUS-2 −0.2 0.0 n/a
CANBUS-3 −0.1 0.0 −16.8
CANBUS-4 −0.2 0.0 n/a
CANBUS-5 −0.3 0.1 −21.6
CANBUS-6 −0.1 0.0 n/a
CANBUS-7 −0.1 0.0 n/a
CANBUS-8 −0.1 0.0 n/a
CANBUS-9 0.0 0.0 n/a
CANBUS-10 −0.3 0.0 −18.1
CANBUS-11 −0.2 0.0 n/a
CANBUS-12 −0.1 0.0 −14.9
CANBUS-13 0.4 0.0 n/a
CANBUS-14 0.1 0.0 −17.6
CANBUS-15 15.2 0.0 n/a
CANBUS-16 −0.3 0.0 −17.7
CANBUS-17 0.0 −6.9 n/a
ECU-ACOC-1 −6.3 0.0 n/a
H502-1 0.0 0.0 n/a
PBCU-FW-1 −0.6 0.0 21.2
PBCU-FW-2 0.0 0.0 n/a
PBCU-FW-3 −0.1 0.0 3.7
PBCU-FW-4 0.0 0.0 n/a
PBCU-FW-5 0.0 0.0 −6.7
PBCU-FW-6 0.0 0.0 n/a
PBCU-FW-7 0.0 0.0 −0.6
Connector resistances Pig-tails Reduced radius
Branch
Rc=10mΩ Rc=100Ω
R/l=10mΩ/m L 40% 80%
Δ(dB) Δ(dB) Δt(µs) Δ(dB) Δ(dB) Δ(dB)
CANBUS-1 −0.3 −41.2 −5.4 −0.8 −0.8 −2.3
CANBUS-2 −0.4 −48.2 −5.3 −1.1 −0.8 −2.2
CANBUS-3 −0.5 −42.2 −5.3 −1.7 −0.7 −2.1
CANBUS-4 −0.4 −44.1 −5.2 −0.9 −0.8 −2.3
CANBUS-5 −0.3 −37.4 −5.2 −0.6 −0.8 −2.4
CANBUS-6 −0.3 −34.0 −5.5 −0.4 −0.9 −2.5
CANBUS-7 −0.3 −37.7 −5.6 −0.6 −0.9 −2.5
CANBUS-8 −0.1 −27.6 −5.7 0.3 −0.9 −2.5
CANBUS-9 −0.4 −44.4 −8.2 −0.7 −0.7 −2.1
CANBUS-10 −0.4 −58.4 −5.7 −1.0 −0.7 −2.1
CANBUS-11 −0.3 −42.9 −6.0 −0.7 −0.7 −2.1
CANBUS-12 −0.2 −33.9 −6.0 −0.4 −0.7 −1.9
CANBUS-13 −0.3 −42.7 −6.0 −0.5 −0.8 −2.3
CANBUS-14 −0.3 −36.4 −5.9 −0.4 −0.7 −2.0
CANBUS-15 −0.6 −15.1 −2.6 −7.9 −0.6 −2.1
CANBUS-16 −0.3 −38.9 −5.8 −0.5 −0.7 −2.0
CANBUS-17 −0.9 −64.3 −14.4 −1.4 −0.8 −2.2
ECU-ACOC-1 −0.2 −35.3 −5.2 −0.2 −0.7 −1.9
H502-1 −0.5 −39.1 −14.8 −0.3 −0.8 −2.4
PBCU-FW-1 −0.2 −37.8 −0.4 1.0 −1.6 −4.9
PBCU-FW-2 −0.4 −55.1 −14.8 −0.6 −0.8 −2.4
PBCU-FW-3 −0.2 −50.3 −12.8 0.4 −0.9 −2.5
PBCU-FW-4 −0.9 −63.5 −14.5 −1.3 −0.8 −2.4
PBCU-FW-5 −0.6 −54.4 −14.2 −0.7 −0.8 −2.4
PBCU-FW-6 −0.7 −56.0 −14.1 −0.7 −0.8 −2.4
PBCU-FW-7 −0.6 −55.9 −14.3 −0.7 −0.8 −2.4
Progress In Electromagnetics Research C, Vol. 83, 2018 27
Figure 7. Cable modifications (added cable is in light green, displaced cable is in cyan, CANBUSwithout ramifications is in dark blue thick line and PBCU-FW without ramifications is in red thickline).
3.4.3. Supression of Ramifications
Since aircraft wiring is very complicated, both in cable number and route complexity, it is necessary toinclude a minimal yet significant set of cables in the EM model for the simulation of a lightning strikeagainst the aircraft. In general, the most severely affected types of equipment are those with cablesextending over long routes, because with a short cable, no matter how much current flows along it,there is relatively little voltage drop between its terminations. However, this does not mean that we canchoose the longest harness path and reject all the ramifications, because a high degree of error wouldbe associated with this approximation if some of the neglected branches carried strong currents, forexample, when passing through a more exposed zone or if they carried a large amount of direct current.
We calculated the current and voltage drop induced from the PBCU to the firewall connectors,through the CANBUS and PBCU-FW harnesses, with and without the remaining branches (Fig. 7 indark blue and red). It can be observed that the current varies substantially (fourth column of Table 4).The voltage drop was calculated according to Ohm’s law for both configurations, and in this respect,too, there is considerable variation (Table 5). In the light of these results, we conclude that ramificationsmust be included in the indirect effects of lightning simulations, even if they are not the inmediate objectof the study, especially when these ramifications carry strong currents.
3.4.4. Connector Resistance and Resistance Per Unit Length Influence
Typically, the first lightning simulations are performed during the design process, and, therefore, withgeneric values for overbraid resistances, since their real value is unknown in early stages. It makes sense,therefore, to consider whether simulations should be repeated with real overbraid resistances once they
28 Gutierrez et al.
Table 5. Without ramifications — Voltage.
Harness Equipment Δpeak(dB)CANBUS PBCU −5.2PBCU-FW PBCU 1.8
are known. To address this question, we doubled the connector resistance (from 5 to 10 mΩ) andthe overbraid resistance per unit length (from 5 to 10 mΩ/m), which would be a reasonable variationbetween generic and real values. As shown in the fifth column of Table 4, the induced peak currentsundergo slight variations. As expected, the most severely affected cables are CANBUS-17, because it isvery short and has a connector resistance at both terminations, and the PBCU-FW harness, becauseits branches are very short and most of them end in a connector resistance. This study reveals that itis not necessary to repeat the simulations introducing the real resistance values provided that these areof the same order as the generic resistances used in the initial simulations.
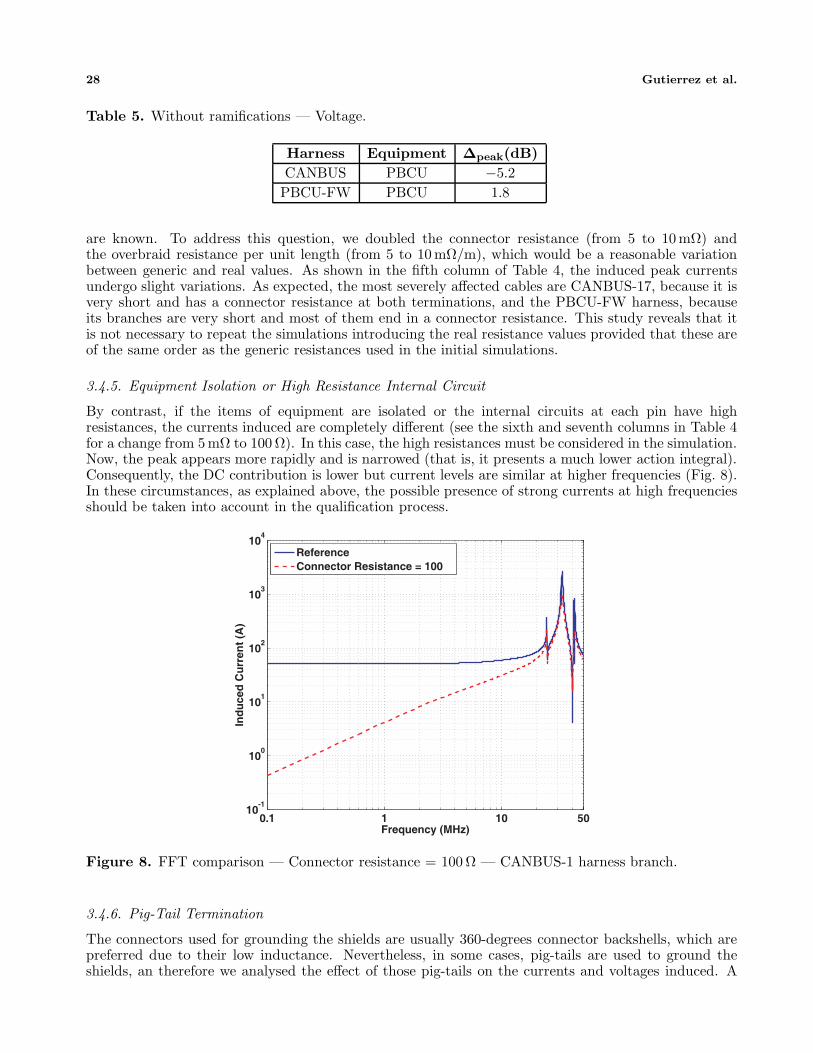
3.4.5. Equipment Isolation or High Resistance Internal Circuit
By contrast, if the items of equipment are isolated or the internal circuits at each pin have highresistances, the currents induced are completely different (see the sixth and seventh columns in Table 4for a change from 5 mΩ to 100 Ω). In this case, the high resistances must be considered in the simulation.Now, the peak appears more rapidly and is narrowed (that is, it presents a much lower action integral).Consequently, the DC contribution is lower but current levels are similar at higher frequencies (Fig. 8).In these circumstances, as explained above, the possible presence of strong currents at high frequenciesshould be taken into account in the qualification process.
0.1 1 10 5010
-1
100
101
102
103
104
Frequency (MHz)
Ind
uce
d C
urr
ent
(A)
ReferenceConnector Resistance = 100
Figure 8. FFT comparison — Connector resistance = 100 Ω — CANBUS-1 harness branch.
3.4.6. Pig-Tail Termination
The connectors used for grounding the shields are usually 360-degrees connector backshells, which arepreferred due to their low inductance. Nevertheless, in some cases, pig-tails are used to ground theshields, an therefore we analysed the effect of those pig-tails on the currents and voltages induced. A

Progress In Electromagnetics Research C, Vol. 83, 2018 29
pig-tail inductance of 100 nH was selected, corresponding approximately to a pig-tail 10 cm long andwith a diameter of 1.5 mm. Column eight in Table 4 shows the results obtained. The current variationswere not so large as to modify the surrounding currents, and lower inductions were generally found.However, it is crucial to take into account the effect in the voltage induced, because the voltage dropacross an inductor is proportional to the time derivative of the current, and then, this term can have avery high value.
3.4.7. Cable Radii
The MTLN approach of [27] is an extension of the classical Holland treatment of thin wires [18] whichtakes into account the coupling between parallel wires as well as that with the rest of the structure. Inthe Holland model, the radius of the cable impacts on the maximum time step for stability [35] andthis must often be reduced in simulations in order to achieve a stable solution. In this section, weanalyse the viability of this measure. To do so, we reduced the cable radius by 40% and 80% (from5 · 10−4 m down to 3 · 10−4 m and 1 · 10−4 m, respectively). The results of these modifications are shownin Table 4, columns nine and ten. The variation in the induced current is low for the 40% reduction andsubstantial for 80%. However, in this latter case, the deviation was not especially alarming, in view ofthe dramatic reduction made in the radius. Severe reductions could be considered valid keeping a greatersafety margin in the ATL. Thus, the error associated with this limitation is low and, consequently, theapproximation is acceptable when the decrease is moderate, and can also be considered acceptable whenlarger margins are incorporated for extreme decreases in cable radius.
The results obtained can be theoretically justified taking into account the per unit length (PUL)autoinductance of a single thin wire over an indefinite ground plane in free space (Fig. 9). The distancebetween the wiring and the ground plane in a complex model such as a power plant is not a cleandimension, but, in this case, it takes approximately an average value of 100 times the wire radius.Making use of the equation shown in Fig. 9 for this separation value, we find that a 40% reductionin cable radius produces a current difference of −0.8 dB, while an 80% reduction produces a currentdifference of −2.3 dB, which is in agreement with the mean differences shown in columns nine and tenof Table 4.
Figure 9. PUL parameters of a single thin wire over an indefinite ground plane in free space.
30 Gutierrez et al.
4. CONCLUSIONS
This study considers various simplifications carried out in EM modelling and quantifies their influenceson the resultant ATLs. From the results obtained, we conclude that:
• It is of fundamental importance to maintain the electrical contacts in the simplified EM model inthe same form as in the original.
• The model must include at least the installations/systems/equipment that are directlyor indirectly connected to the wiring under analysis, and, in addition, to surroundinginstallations/systems/equipment when they carry strong currents.
• As the results may vary according to the materials used, different simulations must be carried outwhen the material composition of the structure is varied.
• Concerning the cables, there are several important considerations. First, their position must bemaintained accurately. Second, surrounding cables carrying strong currents must be included, andalso harness ramifications, even if they are not directly the object of the study, especially thosecarrying strong currents. Third, exact harness impedance values are not very important, unlessthey are widely different from the generic values. By contrast, the isolation of the equipmentand/or connector pins must, obviously, be considered; moreover, when a cable termination isdisconnected, the possible existence of strong currents at high frequencies must be taken intoconsideration. Finally, the use of radius values moderately lower than the real ones produces verylittle degradation, and can be acceptable with greater reductions if safety margins are increased.
The present paper focuses on the indirect effects detected in lightning strike simulations. The aboveconclusions are valid for a frequency spectrum up to around 50 MHz. Of course, a similar study couldalso be made for high intensity radiated fields (HIRF), i.e., those with a plane wave or antenna sourcecovering the range from 10 kHz to 18 GHz, and the appropriate observables, in order to determineelectromagnetic behaviour variations with EM model modifications with respect to this threat. Forconductive effects, which are the most important ones up to 400 MHz, the cases analysed in this paperwould be useful, whereas for radiated ones, the most important of which start at 100 MHz, in additionto the cases analysed in this paper. Other tests should probably be designed in order to draw thecorresponding conclusions. The analysis method employed should be appropriate for this phenomenon,completely in the frequency domain and in accordance with HIRF regulation.
ACKNOWLEDGMENT
This work has received funding from the Projects TEC2013-48414-C3-01, TEC2013-48414-C3-2-R,TEC2016-79214-C3-1-R, TEC2016-79214-C3-3-R, and TEC2015-68766-REDC (Spanish MINECO, EUFEDER), P12-TIC-1442 (J. de Andalucia, Spain), Alhambra-UGRFDTD (AIRBUS DS), and by theCSIRC alhambra.ugr.es supercomputing center.
REFERENCES
1. Rakov, V. A. and M. A. Uman, Lightning: Physics and Effects, Cambridge University Press, 2003.2. Fisher, F. A., J. A. Plumer, and R. A. Perala, Aircraft Lightning Protection Handbook, Federal
Aviation Administration, September 1989.3. SAE ARP 5415, rev A, February 2008 / EUROCAE ED-81 rev A1, August 1999, User’s Manual
for Certification of Aircraft Electrical/Electronic Systems for the Indirect Effects of Lightning.4. AC 20-136B, Protection of Aircraft Electrical/Electronic Systems against the Indirect Effects of
Lightning, September 2011.5. Goodloe, C. C., Lightning Protection Guidelines for Aerospace Vehicle, NASA, May 1999.6. Odam, G. A. M., A. W. Hanson, and R. H. Evans, Lightning Protection Requirements for Aircraft
a Proposed Specification, Defence Research Agency, Controller HMSO London, Revised Issue 1,May 1991.

Progress In Electromagnetics Research C, Vol. 83, 2018 31
7. Uman, M. A., The Art and Science of Lightning Protection, Cambridge University Press, 2008.8. Gil, E. P. and G. G. Gutierrez, “Simplification and cleaning of complex CAD models for EMC
simulations,” International Symposium on Electromagnetic Compatibility EMC Europe, York, UK,2011.
9. Nogueira de Sao Jose, A., A. Colin, J. Fujioka Mologni, G. Maciulis Dip, U. do CarmoResende, and S. Trindade Mordente Goncalves, “Computational savings based on three-dimensionalautomotive geometries’ simplifications in electromagnetics simulations,” International Conferenceon Microwave and Optoelectronics, Rio de Janeiro, 2013.
10. Smith, S. M. and C. Furse, “Stochastic FDTD for analysis of statistical variation in electromagneticfields,” IEEE Transactions on Antennas and Propagation, Vol. 60, 3343–3350, July 2012.
11. Pyrialakos, G., T. Zygiridis, N. Kantartzis, and T. Tsiboukis, “FDTD analysis of 3D lightningproblems with material uncertainties on GPU architecture,” Proc. Int. Symp. ElectromagneticCompatibility, 577–582, Sept. 2014.
12. “A400M,” http://militaryaircraft-airbusds.com/aircraft/a400m/a400mabout.aspx.13. “SEMBA by UGR (2013),” http://www.sembahome.org/.14. EUROCAE ED-84, Septembre 1997 / SAE ARP 5412, rev A, February 2005, Aircraft Lightning
Environment and Related Test Waveforms Standard.15. I. Standard P1557, Standard for Validation of Computational Electromagnetics Computer Modelling
and Simulation, Part 1, 2, 2008.16. Duffy, A., A. Martin, A. Orlandi, G. Antonini, T. Benson, and M. Woolfson, “Feature Selective
Validation (FSV) for validation of Computational Electromagnetics (CEM). Part I — TheFSV method,” IEEE Transactions on Electromagnetics Compatibility, Vol. 48, No. 3, 449–459,August 2006.
17. Orlandi, A., A. Duffy, B. Archambeault, G. Antonini, D. Coleby, and S. Connor, “Feature SelectiveValidation (FSV) for validation of Computational Electromagnetics (CEM). Part II — Assessmentof FSV performance,” IEEE Transactions on Electromagnetics Compatibility, Vol. 48, No. 3, 460–467, August 2006.
18. Holland, R. and L. Simpson, “Finite-difference analysis of EMP coupling to thin struts and wires,”IEEE Transactions on Electromagnetic Compatibility, No. 2, 88–97, 1981.
19. RTCA/DO-160, issue G, December 2010 / EUROCAE ED-14, issue G, May 2011, EnvironmentalConditions and Test Procedures for Airborne Equipment.
20. Serway, R. A. and J. W. Jewett, Jr., Principles of Physics, Brooks/Cole, 2013.21. Mur, G., “Absorbing boundary conditions for the finite-difference approximation of the time-
domain electromagnetic-field equations,” IEEE Transactions on Electromagnetic Compatibility,Vol. 23, 377–382, November 1981.
22. Taflove, A. and S. Hagness, Computational Electrodynamics: The Finite-Difference Time-DomainMethod, Artech House, Norwood, MA, 2005.
23. “CATIA by Dassault Systemes,” http://www.3ds.com.24. “CADfix,” http://www.transcendata.com/products/cadfix/.25. Garcia, S. G., J. Alvarez, L. D. Angulo, and M. R. Cabello, “UGRFDTD EM solver,”
http://www.sembahome.org/.26. Yee, K. S., “Numerical solution of initial boundary value problems involving Maxwell’s equations
in isotropic media,” IEEE Transactions on Antennas and Propagation, Vol. 14, No. 3, 302–307,1966.
27. Berenger, J.-P., “A multiwire formalism for the fdtd method,” IEEE Transactions onElectromagnetic Compatibility, Vol. 42, No. 3, 257–264, 2000.
28. “HIRF-SE project (2008),” http://hirfse.axessim.eu/.29. “Alhambra-UGRFDTD by CSIRC (2013),” https://alhambra.ugr.es/.30. Romero, S. F., G. G. Gutierrez, A. L. Morales, and M. A. Cancela, “Validation procedure of
low level coupling tests on real aircraft structure,” International Symposium on ElectromagneticCompatibility EMC Europe, 2012.

32 Gutierrez et al.
31. Gutierrez, G. G., J. Alvarez, E. Pascual-Gil, M. Bandinelli, R. Guidi, V. Martorelli, M. F. Pantoja,M. R. Cabello, and S. G. Garcia, “HIRF virtual testing on the C-295 aircraft: On the application ofa pass/fail criterion and the FSV method,” IEEE Transactions on Electromagnetic Compatibility,Vol. 56, No. 4, 854–863, 2014.
32. Gutierrez, G. G., D. M. Romero, M. R. Cabello, E. Pascual-Gil, L. D. Angulo, and S. G. Garcia,“On the design of aircraft electrical structure networks,” IEEE Transactions on ElectromagneticCompatibility, Vol. 2, No. 58, 401–408, 2016.
33. Gutierrez, G. G., S. F. Romero, J. Alvarez, S. G. Garcia, and E. P. Gil, “On the use of FDTDfor HIRF validation and certification,” Progress In Electromagnetics Research Letters, Vol. 32,145–156, 2012.
34. Cabello, M. R., L. D. Angulo, J. Alvarez, I. Flintoft, S. Bourke, J. Dawson, R. G. Martin, andS. G. Garcia, “A hybrid crank-nicolson fdtd subgridding boundary condition for lossy thin-layermodeling,” IEEE Transactions on Microwave Theory and Techniques, Vol. 65, 1397–1406, 2017.
35. Schmidt, S. and G. Lazzi, “Use of the FDTD thin-strut formalism for biomedical telemetry coildesigns,” IEEE Transactions on Microwave Theory and Techniques, Vol. 52, No. 8, 1952–1956,2004.


![IftheCurrentCliqueAlgorithmsareOptimal, …this quote even today, 40 years after Valiant’s result. Follow-up works proposed simplifications of the algorithm [Ryt95], generalized](https://static.fdocuments.in/doc/165x107/5e6fa5da3c23c151721632ab/ifthecurrentcliquealgorithmsareoptimal-this-quote-even-today-40-years-after-valiantas.jpg)