Introductory guidance on petroleum hydrocarbon soil vapour ... Hydrocarbon Hydrocarbon Hydrocarbon...
28
Introductory guidance on petroleum hydrocarbon soil vapour assessment
Transcript of Introductory guidance on petroleum hydrocarbon soil vapour ... Hydrocarbon Hydrocarbon Hydrocarbon...

Introductory guidance on petroleum hydrocarbonsoil vapour assessment

Copyright © 2011 by the Energy Institute, London.The Energy Institute is a professional membership body incorporated by Royal Charter 2003.Registered charity number 1097899, EnglandAll rights reserved
No part of this book may be reproduced by any means, or transmitted or translated intoa machine language without the written permission of the publisher.
ISBN 978 0 85293 611 5
Published by the Energy Institute
The information contained in this publication is provided for general information purposes only. Whilst the Energy Institute and the contributors have applied reasonable care in developing this publication, no representations or warranties, express or implied, are made by the Energy Institute or any of the contributors concerning the applicability, suitability, accuracy or completeness of the information contained herein and the Energy Institute and the contributors accept no responsibility whatsoever for the use of this information. Neither Energy Institute nor any of the contributors shall be liable in any way for any liability, loss, cost or damage incurred as a result of the receipt or use of the information contained herein.
Further copies can be obtained from: Portland Customer Services, Commerce Way, Whitehall Industrial Estate, Colchester CO2 8HP, UK. t: +44 (0)1206 796 351 e: [email protected]
Electronic access to EI and IP publications is available via our website, www.energypublishing.org.Documents can be purchased online as downloadable pdfs or on an annual subscription for single users and companies.For more information, contact the EI Publications Team.e: [email protected]
ACKNOWLEDGMENTS
This introductory guidance was commissioned by the Energy Institute’s Soil Waste Groundwater Group.
The Energy Institute wishes to record its appreciation of the work carried out by Geosyntec Consultants, Inc. and also its gratitude for the valuable contributions made by members of the Soil Waste Groundwater Group during the development of this document.
The EI gratefully acknowledges the financial contributions towards the scientific and technical programme from the following companies
BG Group Murco Petroleum LtdBP Exploration Operating Co Ltd NexenBP Oil UK Ltd Premier OilCentrica RWE npowerChevron Saudi AramcoConocoPhillips Ltd Shell UK Oil Products LimitedEDF Energy Shell U.K. Exploration and Production LtdENI Statoil HydroE. ON UK Talisman Energy (UK) LtdExxonMobil International Ltd Total E&P UK plcKuwait Petroleum International Ltd Total UK LimitedMaersk Oil North Sea UK Limited World Fuel Services

1Contents
Contents
1 Introduction . . . . . . . . . . . . . . . . . . . . . . . . . . . . . . . . . . . . . . . . . . . . . . .2 2 Why is it challenging to assess risks from vapour intrusion? . . . . . . .5
3 How do soil vapour samples fit into vapour intrusion assessment?. .7 Soil samples . . . . . . . . . . . . . . . . . . . . . . . . . . . . . . . . . . . . . . . . . . . . . . . .7 Groundwater samples . . . . . . . . . . . . . . . . . . . . . . . . . . . . . . . . . . . . . . . . .7 Soil vapour samples . . . . . . . . . . . . . . . . . . . . . . . . . . . . . . . . . . . . . . . . . .8 Sub-slab samples . . . . . . . . . . . . . . . . . . . . . . . . . . . . . . . . . . . . . . . . . . . .8 Soil vapour samples collected at deeper depths outside the building . . . . . .8
4 Why isn’t soil vapour sampling more universally accepted? . . . . . . .11
5 Key considerations in designing a soil vapour sampling programme. . 15 Scoping considerations . . . . . . . . . . . . . . . . . . . . . . . . . . . . . . . . . . . . . . .15 Geologic characterisation . . . . . . . . . . . . . . . . . . . . . . . . . . . . . . . . . . . . .15 Equipment contamination . . . . . . . . . . . . . . . . . . . . . . . . . . . . . . . . . . . . .16 Soprtion losses . . . . . . . . . . . . . . . . . . . . . . . . . . . . . . . . . . . . . . . . . . . . .16 Leaks in annular seals and above-ground fittings . . . . . . . . . . . . . . . . . . . .18 Purging and field screening . . . . . . . . . . . . . . . . . . . . . . . . . . . . . . . . . . . .18 Flow and vacuum limitations in low permeability soils . . . . . . . . . . . . . . . .19 Monitoring soil gas permeability . . . . . . . . . . . . . . . . . . . . . . . . . . . . . . . .19 Sample shipping, storage and handling . . . . . . . . . . . . . . . . . . . . . . . . . . .19 Adsorptive media samples . . . . . . . . . . . . . . . . . . . . . . . . . . . . . . . . . . . .20 Availablility of laboratories with appropriate capabilities . . . . . . . . . . . . . .20
6 Summary and recommendations . . . . . . . . . . . . . . . . . . . . . . . . . . . . .22
Annex A References . . . . . . . . . . . . . . . . . . . . . . . . . . . . . . . . . . . . . . . . . .23

2 Section 1
Section 1
Introduction
UK government policy encourages the beneficial redevelopment of brownfield sites . The commercial incentive is often greater for land redeveloped for housing . Many of the hazardous substances of potential concern at contaminated sites are volatile organic compounds (VOCs), which can pose a health risk via subsurface vapour intrusion to indoor air (vapour intrusion) and this is often calculated to be the dominant exposure pathway for building occupants over VOC contaminated sites (e .g . CLEA model, 2009) . Therefore, concern over the potential for vapour intrusion commonly poses a barrier to brownfield redevelopment . A conceptualisation of the vapour intrusion processes and mechanisms is shown in Figure 1 .
Figure 1 Conceptualisation of vapour intrusion processes and mechanisms
Mathematical models of vapour intrusion exposures are conventionally used with conservative input values and/or assumptions (e .g . the Johnson and Ettinger 1991 Model assumes no degradation or source decay over time), and will usually tend to overestimate risks . Indoor air quality measurements will be confounded by VOC contributions from interior sources (consumer products, building materials) and constituents in outdoor air . Reliable measurement of soil vapour VOC concentrations can provide valuable information that is much less affected by background sources than indoor air sampling and can elucidate the role of biodegradation with more confidence than using mathematical models alone . This document provides the motivation, logic and rationale for the development of a guideline for soil vapour sampling and analyses in vapour intrusion assessments and a recommendation for the path forward .

3Section 1
This guide was developed by the Energy Institute, with the assistance of Geosyntec Consultants, Inc, with the objective of introducing principles of vapour migration and measurement .
It is also a precursor to more detailed guidance which is in preparation by the Energy Institute . The detailed guidance will set out the considerations and will make practical recommendations for the measurement of soil vapour . It is important to recognise that the potential for vapour intrusion is substantially different for petroleum hydrocarbons (PHCs) compared to chlorinated VOCs (Cl-VOCs) because natural soil microbes can very rapidly degrade PHCs in the presence of oxygen (DeVaull, 2007, API, 2005/2009, Abreu and Johnson, 2006) . PHC vapour concentrations are often biologically degraded to concentrations that pose no significant health risk within several metres of non-aqueous phase liquid (NAPL) hydrocarbons in the subsurface (Abreu and Johnson, 2006) and smaller distances where NAPL is not present (Davis, 2006, API, 2009), as shown in Figure 2 . Most Cl-VOCs are much less susceptible to biodegradation than petroleum hydrocarbons in natural settings (particularly aerobic soils) and are therefore more likely to enter overlying buildings at concentrations of potential concern .
Vapour intrusion is often calculated to be the exposure pathway of most significant potential risk if the risk assessment assumes there is no degradation of the vapours . Petroleum hydrocarbons are known to degrade at a rate that is often so fast that concentrations can be reduced below levels of health concern within distances of a few metres or less from the source if sufficient oxygen is present .
Understanding the conditions and locations under which degradation occurs and is sustainable is a key component of understanding the potential risks for petroleum hydrocarbons .
Introduction
4 Section 1
Figure 2: Normalized steady-state soil vapour PHC concentration distribution for a vapour source concentration of 4 mg/L. The top plots assume no biodegradation and the bottom plots include biodegradation with an average first order rate. (reprinted with permission (pending) from API, 2009).
-5-4-3-2-10
0.1
Dep
th b
gs (m
)SAND SILTY CLAY
-5-4-3-2-10
0.1
1E-7
1E-7
No biodegradation No biodegradation
h-1 h-1
Hydrocarbon Hydrocarbon
Hydrocarbon Hydrocarbon
0.9 0.8 0.60.40.2
0.9 0.8 0.60.40.2
Figure 2 Normalised steady-state soil vapour PHC concentration distribution for a vapour source concentration of 4 mg/L. The top plots assume no biodegradation and the bottom plots include biodegradation with an average first order rate (reprinted with permission from API, 2009)
Mathematical model simulations (Figure 2) show the potential for vapour intrusion for a non-degrading compound (top) and a degrading compound with fate similar to what is expected for PHCs (bottom) . Each image has a calculated attenuation factor (α, or alpha), which is the indoor air concentration divided by the subsurface concentration . The non-degrading compound is simulated to attenuate by a factor of about 1:1 000 in sand and 1:20 000 in silty clay from a 5 m depth to the air inside the 2 m deep basement (the difference is primarily due to the effect of the lower soil permeability for the silty clay scenario resulting in a lower simulated flow rate of soil gas into the building) . The degrading compound is simulated to attenuate by a factor of billions or more, which would reduce the concentrations below levels of any significant risk, or even levels of detection . The difference between these simulations indicates the degree of attenuation expected from biodegradation alone (factors of millions or more) . While these are only mathematical simulations, this is nevertheless consistent with trends observed in measured data .
UK policy promotes the development of brownfield sites over greenfield sites . Therefore, it is important to develop assessment methods that will provide reliable and cost-effective assessment of the potential vapour intrusion risks . Otherwise, there will be an unnecessary cost penalty associated with contaminated land management and redevelopment, which may hinder economic opportunities . Currently, attenuation of vapour concentrations attributable to biological activity is not treated rigorously in regulatory guidance documents for vapour intrusion assessment . Therefore, there is a strong case for developing methods to obtain representative vapour samples and help demonstrate the degree of biodegradation . A more comprehensive protocol for soil vapour assessment is in preparation as the second part of this guidance .
Introduction

5Section 2
Section 2
Why is it challenging to assess risks from vapour intrusion?
Experience has shown that assessment of vapour intrusion is challenging for several reasons . Risk-based indoor air target concentrations for some key PHCs are very low . There is no UK air quality standard for indoor air in homes; however, in 2004 an expert committee of the Department of Health (DH) recommended guidelines for the concentration of some indoor air pollutants in homes, and for benzene it recommended a guideline value of 5 μg/m3 (about 1,5 x 10⁻³ ppmv) as an annual average concentration .
Indoor air concentrations of benzene are often higher than the guideline value even in residences that are not affected by subsurface contamination (Dawson and McAlary, 2009) . Therefore, indoor and outdoor (a .k .a . ‘background’) sources of benzene (including consumer products, building materials, automotive emissions, filling station emissions, or other sources) must be accounted for in any vapour intrusion investigation . Background sources are also potentially significant for other PHCs . Short-term temporal changes in barometric pressure, wind and ventilation can contribute to considerable variability in indoor air concentrations, which further complicates the assessment of vapour intrusion risks . As a result, indoor air sampling and analysis alone will seldom provide an unambiguous assessment of the long-term average contribution of vapours from the subsurface, especially for petroleum hydrocarbons .
Assessing the potential risks posed by subsurface vapour requires an understanding of the source, pathway and receptor . The important information about the source is usually the location, distribution, relative proportions of the different hazardous substances and concentration . The maximum potential concentration for any single PHC as a vapour can be estimated by dividing its vapour pressure by atmospheric pressure . As an example, benzene has a vapour pressure of about 130 mm Hg at 25 oC, which corresponds to a maximum potential vapour concentration of about 170 000 ppmv (= 130 mm Hg/760 mm Hg x 106) . Expressed as mass per unit volume, this equals about 540 mg/L . It should be noted that benzene is often present as a compound of a mixture, and the vapour concentration for benzene in mixtures will be lower than that of pure benzene liquid, often by one to three orders of magnitude . Considering that the maximum potential subsurface concentration of benzene is about 100 000 000 times higher than the indoor air quality guideline goal, the potential for vapour intrusion risks cannot be discounted entirely on the basis of typical dilution factors for soil vapour to indoor air (100 to 10 000 times) . However, if biodegradation reduces the concentration of benzene by 10 000 to 1 000 000 times, then even a source of pure benzene would not pose a risk to indoor air in an overlying building .
Recent mathematical modelling (API, 2009) has shown that the extent of attenuation of hydrocarbon concentrations depends strongly on the concentration of vapours at the source and the separation distance between the source and the building . For moderate to low source concentrations (e .g . dissolved hydrocarbons in groundwater), a moderate separation distance (a few metres or less) of oxygen-rich soil is often sufficient to allow sufficient degradation to reduce health risks via vapour intrusion below acceptable levels . This is supported by an empirical analysis of data from hydrocarbon sites (Davis, 2006) . Conversely, high vapour source concentrations (e .g . vaporisation from a NAPL hydrocarbon near or above the water table) may result in a condition where oxygen is consumed at a rate
6 Section 2
that limits the degree of aerobic biodegradation, in which case vapour intrusion may pose a potential concern, even for aerobically degradable compounds, especially for buildings that are within several metres of the NAPL source . A condition that impedes the supply of oxygen to the subsurface (e .g . wet, fine textured shallow soils, concrete slabs, coated asphalt, etc .) may also limit the degree of biodegradation .
xL = 1 m
L = 2 m
L = 3 m
L = 5 m L = 10 m
x
Dissolved phase NAPL
1 .E-02
1 .E-03
1 .E-04
1 .E-05
1 .E-06
1 .E-07
1 .E-08
1 .E-09
1 .E-10
Att
enu
atio
n f
acto
r
0 .1 1 10 100 1 000Vapour source concentration
L = 1 m, λ = 0,79 (1/h) L = 2 m bgs, λ = 0,79 (1/h)
L = 3 m, λ = 0,79 (1/h) L = 5 m, λ = 0,79 (1/h)
L = 10 m, λ = 0,79 (1/h) L = 1 m, No biodegradation
L = 10 m, No biodegradation
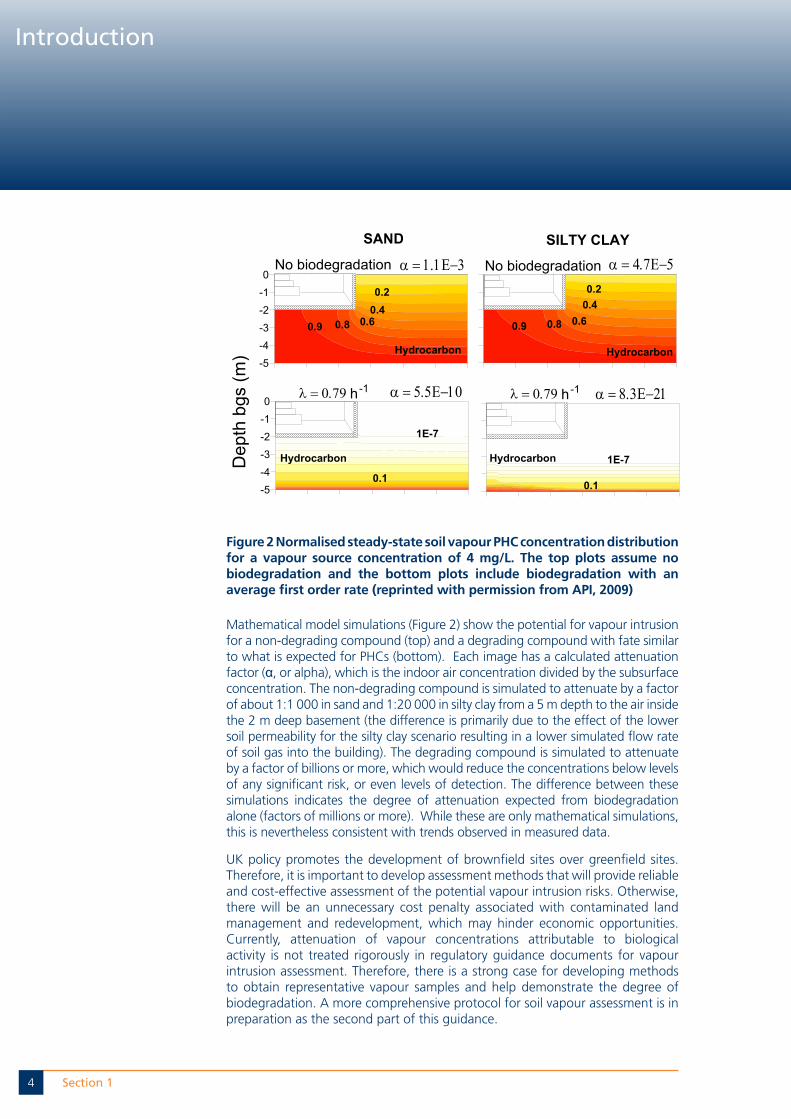
Figure 3 Relationship between simulated attenuation factor, source-building separation (L) and vapour source concentration for PHCs with a first order degradation rate of 0,79 hr-1. (after Abreu et al, 2009)
Figure 3 shows a chart of calculated attenuation factors for PHC vapours as a function of the maximum concentration of the source and the depth of the source relative to the deepest level of the overlying building . Highly concentrated sources are more likely to result in oxygen depletion, so the attenuation factors converge to the rates expected in the absence of degradation at higher PHC source concentrations . There is also less attenuation for shallower sources . The simulations indicate that unacceptable risks via vapour intrusion are much less likely for deeper or less concentrated sources .
Why is it challenging to assess risk from vapour intrusion?
7Section 3
Section 3
How do soil vapour samples fit into vapour intrusion assessment?
There is a variety of ways to assess subsurface concentrations of hazardous substances, the most common of which are collection and analysis of samples of soil (above the water table) and groundwater (below the water table) . For volatile substances, soil vapour sampling and analysis is also feasible, and in fact preferable for many reasons . When inhalation of vapours is the exposure pathway of most concern, a soil vapour sample can reduce the uncertainties inherent in predicting vapour concentrations from measured soil or groundwater concentrations using theoretical phase partitioning relationships . Additionally, there are some limitations to the use of soil and groundwater samples that should be considered .
SOIL SAMPLES
Soil samples are difficult to collect and transfer to a container for travel to a laboratory without significant losses of VOCs (USEPA, 1993) . The VOC losses can be minimised by immediate preservation with methanol; however, there is limited sensitivity for the soil analyses, and reporting limits may be too high to meet the data quality objectives for vapour intrusion assessments (i .e . soil with no detectable concentration could still pose a potential risk) . Furthermore, there are uncertainties associated with estimating concentrations of soil vapours from concentrations in bulk soil samples and the theory of phase partitioning requires considerable knowledge of the concentrations of all substances present and partitioning properties (porosity, moisture content and fraction of organic carbon) of the soil . Nevertheless, soil samples with very high concentrations are useful for identifying locations of sources of vapours, relative magnitudes of concentrations of various compounds, and possibly the presence of NAPLs . Unfortunately, the absence of very high concentrations in soil samples does not necessary confirm the absence of NAPLs; therefore, soil samples are generally used as only a supporting line of evidence for vapour intrusion assessments .
GROuNDWATER SAMPLES
Groundwater samples can be collected with minimal loss of VOCs and the methods of analysis are adequately sensitive to meet risk-based screening levels for the vapour intrusion pathway . Measured groundwater concentrations may or may not correlate strongly to soil vapour concentrations above the water table . For example, groundwater monitoring wells may have screened intervals that are long enough to encounter a range of groundwater concentrations, so that the blended groundwater sample may not be representative of the concentrations at the top of the water table, where vapours are generated . If the measured VOCs in groundwater reflect the VOC concentration in groundwater at the top of the aquifer and the VOCs partition to soil vapour without restriction, then the soil vapour concentration in local equilibrium at the point where the groundwater sample was collected may be estimated by multiplying the groundwater concentration by the dimensionless Henry’s Law Constant for the compound(s) of interest . However, there are cases where the infiltration of rainfall inhibits the movement of VOCs from groundwater to soil gas, and/or where there is a thick tension-saturated zone (capillary fringe) that impedes mass transfer from groundwater to soil vapour (McCarthy and Johnson, 1991) . In these cases, using groundwater samples and equilibrium phase partitioning calculations may overestimate concentrations of

8 Section 3
VOCs in soil vapour . For aerobically degradable compounds like PHCs, there may also be significant degradation if the unsaturated zone is aerobic . In the absence of NAPL, dissolved PHCs in groundwater will often pose a much lower risk of causing anaerobic conditions to develop over significant thicknesses in the vadose zone and may not pose a health risk . Therefore, it is important to select groundwater sampling methods that will not fail to identify the presence of NAPL .
SOIL VAPOuR SAMPLES
Soil vapour samples may be collected at various depths from locations outside a building, or immediately beneath the lowest floor of the building (referred to as sub-slab samples, where a concrete floor slab is present) . Both types are described in more detail in the following two sections .
Sub-SLAb SAMPLES
Sub-slab samples are the subsurface medium in closest physical proximity to the receptor, so their use may be expected to reduce the uncertainty in predicting indoor air concentrations, compared to deeper samples of soil vapour or groundwater . For this reason, some regulatory guidance documents recommend a combination of indoor air and sub-slab soil vapour samples as the preferred lines of evidence (e .g . NYSDOH, 2006) . This approach may have advantages for non-degrading compounds that are not typically present at background concentrations of concern (e .g . radon, trichloroethylene, mercury), but PHCs have different behaviour and background levels, so other assessment approaches are needed . PHC vapours emitted by indoor sources can migrate into shallow soil gas beneath and around foundations because indoor air pressure will occasionally be higher than the pressure in the subsurface . This can contribute background vapours to the subsurface sample, but it can also supply oxygen to the subsurface and facilitate biodegradation below the building . As a result, there may be very significant spatial and temporal variability in concentrations of PHC vapours in sub-slab samples, especially near foundation cracks (Luo et al, 2009) .
SOIL VAPOuR SAMPLES COLLECTED AT DEEPER DEPTHS OuTSIDE THE buILDING
Soil vapour samples collected at deeper depths outside the building are less likely to be affected by near-surface processes, conditions, and background sources and generally tend to show much less temporal and spatial variability (McAlary et al, in press, Luo et al, 2010) . No phase-partitioning calculations are required prior to comparing soil vapour concentrations to right-based target concentrations, in contrast to soil and groundwater samples . Vapour samples collected just above the water table can be used to assess the source strength and may be preferable for establishing source concentrations in mathematical modelling of the potential for vapour intrusion risks resulting from PHCs in groundwater, compared to groundwater samples . Measurement of flow and vacuum during soil gas probe purging also provides data to assess the gas permeability, as well as the potential for low-permeability or high moisture content layers that may be barriers to vapour transport .
Until recently in the UK, consistent spelling vapour intrusion site characterisation has consisted mainly of the collection and analysis of soil and groundwater samples . At petroleum hydrocarbon sites, soil vapour sampling is critical in assessing the potential for vapour intrusion because the distribution of oxygen is key factor that will affect the degree of degradation and the oxygen distribution is best assessed by direct measurement in soil vapour samples . Furthermore, the hydrocarbon soil vapour concentrations usually change dramatically over short distances, and may change over time, which is best characterized by depth-discrete soil vapour sampling .
How do soil vapour samples fit into vapour intrusion assessment?

9Section 3
Soil vapour sampling and analysis also provides unique insight into the role of biodegradation as a mechanism for attenuation with distance along the vapour transport path . If soil vapour samples are collected at different depths and analysed for concentrations of hydrocarbons, oxygen, and carbon dioxide, concentration profiles similar to those shown in Figure 4 are commonly found . Oxygen concentrations are typically near atmospheric levels (~21 %) in shallow samples, and decrease through the zone where biodegradation occurs . Hydrocarbon concentrations are highest at the depth of the vapour source, and decrease rapidly over the same interval where oxygen is consumed . Carbon dioxide is produced as a byproduct of the aerobic biodegradation of hydrocarbons, so an increase is CO2 concentrations with depth is a supporting line of evidence that degradation is occurring (although in organic-rich soils, this can also be attributable to natural soil respiration) .
1
soil surface
O2
CO2
VOCscleansoil
petroleumproduct
increasingdepth
VOCs
O2
flux
Figure 4 Typical vertical profiles for aerobic degradation of hydrocarbon vapours
Without soil vapour profiles, there will be some uncertainty regarding the extent to which degradation is occurring . For example, Roggemans et al . (2001) compiled and presented data from several hydrocarbon sites, and identified four main categories of behaviour, in which PHCs are degraded to a greater or lesser extent . For categories of sites where oxygen transport through or into the subsurface seemed to be the limiting factor for biodegradation (six of the 28 profiles studied), the observed behaviour was similar to expectations without biodegradation . Therefore, it is important to understand which conditions apply at a particular site under investigation, particularly the supply and distribution of oxygen . Soil vapour sampling is also one of the best ways to identify the presence of PHC sources above the water table, and collect data to distinguish primary and secondary sources where multiple releases are known or suspected (Michaelski et al, 2010) .
Another consideration is whether the vertical profile of concentrations is similar or different for locations beneath and beside the building . Model simulations indicate that there are more likely to be oxygen-deficient zones beneath buildings, and there have been some observations of this condition (Luo et al, 2010 and
How do soil vapour samples fit into vapour intrusion assessment?

10 Section 3
McAlary et al, in press), although there are relatively few detailed case studies to date . Figure 5 shows two simulations for identical conditions, except that one simulation is for a slab-on-grade (i .e . floor slab on ground level) building and the other is for a building with a 2 m deep basement . The simulations indicate that oxygen would be present below the slab-on-grade building, and as a result, vapour concentrations would be reduced a factor of about 10 trillion (i .e . far below levels of risk or detection) . The simulation of the basement scenario indicates anaerobic conditions beneath the building, which significantly reduces the amount of attenuation from biodegradation .
Figure 5: Effect of building type on soil gas concentration distribution for high vapour source concentration (100 mg/L) and biodegradation rate l = 0.79 h-1. Hydrocarbon and oxygen concentrations are normalized by source and atmospheric concentrations, respectively. (reprinted with permission (pending) from API, 2009)
0 2 4 6 8 10 12-7
-6
-5
-4
-3
-2
-1
0
-7
-6
-5
-4
-3
-2
-1
0
Hydrocarbon Oxygen
0.01
1E-51E-7
0.1
x (m)
Dep
th b
gs (m
)
0 2 4 6 8 10 12
1E-71E-5
0.010.1
Figure 5: Effect of building type on soil vapour concentration distribution for high vapour source concentration (100 mg/L) and biodegradation rate 0,79 h-1. Hydrocarbon and oxygen concentrations are normalised by source and atmospheric concentrations, respectively (reprinted with permission from API, 2009).
Note that soil vapour samples collected outside the building footprint may or may not match concentrations at comparable depths beneath the building . Also note that the vertical profile of PHC and oxygen concentrations at a location 2 m or more from the side of the building might be nearly the same for both of these scenarios . Aerobic biodegradation depends strongly on the supply of oxygen to the subsurface . In the United Kingdom, the housing stock includes a high proportion of suspended timber floors with passively ventilated sub-floor regions depending on the age of the building, and this likely facilitates more oxygen diffusion into the subsurface and associated degradation relative to the condition of a concrete floor slab simulated in Figure 5 . Understanding the source concentrations and distribution is an important factor in screening potential risks (Energy Institute, 2009) . This is a key part of the motivation for this document and the forthcoming companion protocol .
How do soil vapour samples fit into vapour intrusion assessment?

11Section 4
Section 4
Why isn’t soil vapour sampling more universally accepted?
Despite the potential advantages of soil vapour sampling and analysis for assessing vapour intrusion, there are concerns expressed by many regulatory agencies regarding the reliability for assessing potential human health risks . This is primarily because of two issues with data available to date: i) poor correlation between soil vapour and indoor air concentrations (Figure 6), and ii) spatial/temporal variability in the data .
The United States Environmental Protection Agency (USEPA) has compiled data from sites with known or suspected vapour intrusion and generated correlation plots between subsurface and indoor air concentrations (USEPA, 2008) . The expectation in these plots (e .g . Figure 6) is that there will be a positive correlation within a certain range . For comparison, the concentration of radon in indoor air is typically lower than the concentration in the subsurface by a factor of 1/100 to 1/10 000 in most cases, with an average dilution of about 1/500 (McHugh et al, 2008, Little et al, 1992, Gauthier, 2005) . Figure 6 does not show a very consistent correlation, and shows about five orders of magnitude range in the attenuation factor (note that virtually all of these data are for chlorinated compounds, where degradation would be expected to be minimal) . Some sample pairs show little or no attenuation (i .e . alpha ~1), which would either indicate that all the air inside the building is drawn from the subsurface, or there is a source inside the building that is migrating into the subsurface . The soil vapour data shown in Figure 6 were not collected according to any single sampling protocol, so the extent to which sampling bias contributed to variability is unknown . Furthermore, most regulatory guidance documents for vapour intrusion assessment have not clearly specified the rationale for selecting soil vapour sampling location, depths, frequency and number . As a result, there is an opportunity to advance the practice through improved consistency in the methods and rationale used for soil vapour sampling and analyses during subsurface vapour intrusion assessments .
Figure 6: Correlation between concentrations of volatile organic chemical (VOC) vapours measured in soil gas samples and indoor air in nearby buildings (USEPA, 2008).
1.E-03
1.E-02
1.E-01
1.E+00
1.E+01
1.E+02
1.E+03
1.E+04
1.E-02 1.E-01 1.E+00 1.E+01 1.E+02 1.E+03 1.E+04 1.E+05 1.E+06 1.E+07 1.E+08
Indo
or A
ir Co
ncen
tratio
n (u
g/m
3) EPA Data (IA > RL)
EPA Data (IA < RL)
Alpha = 1.0
Alpha = 1E-1
Alpha = 1E-2
Alpha = 1E-3
Alpha = 1E-4
Alpha = 1E-5
Soil Gas (ug/m3)
Figure 6 Correlation between concentrations of VOC vapours measured in soil vapour samples and indoor air in nearby buildings (uSEPA, 2008)
The spatial and temporal variability in soil-vapour concentrations can be significant at some sites depending on numerous factors, including water-table fluctuations (i .e . the potential for residual NAPL sources to be alternately submerged below the water table then exposed to the overlying unsaturated soils), meteorological events (i .e . precipitation, barometric pressure changes) and geologic heterogeneity . Where these factors are either simple or well-understood, soil vapour behaviour generally follows theory quite well .
12 Section 4
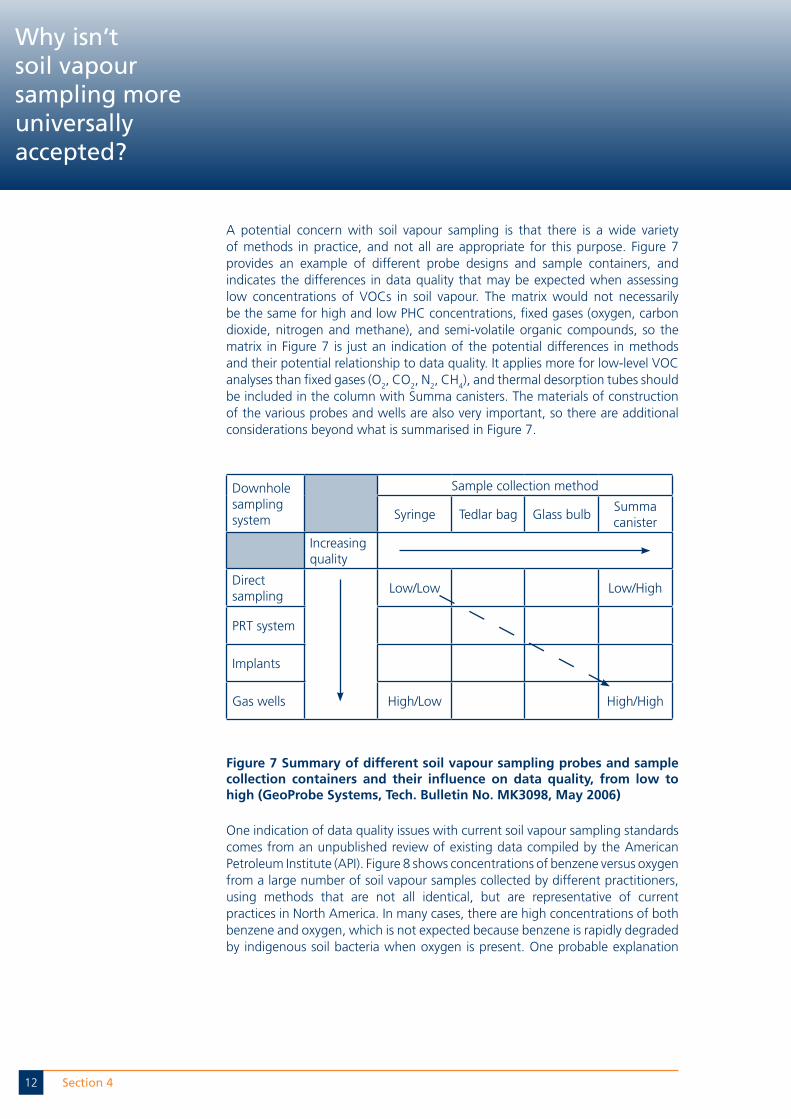
A potential concern with soil vapour sampling is that there is a wide variety of methods in practice, and not all are appropriate for this purpose . Figure 7 provides an example of different probe designs and sample containers, and indicates the differences in data quality that may be expected when assessing low concentrations of VOCs in soil vapour . The matrix would not necessarily be the same for high and low PHC concentrations, fixed gases (oxygen, carbon dioxide, nitrogen and methane), and semi-volatile organic compounds, so the matrix in Figure 7 is just an indication of the potential differences in methods and their potential relationship to data quality . It applies more for low-level VOC analyses than fixed gases (O2, CO2, N2, CH4), and thermal desorption tubes should be included in the column with Summa canisters . The materials of construction of the various probes and wells are also very important, so there are additional considerations beyond what is summarised in Figure 7 .
Downhole sampling system
Sample collection method
Syringe Tedlar bag Glass bulbSumma canister
Increasing quality
Direct sampling
Low/Low Low/High
PRT system
Implants
Gas wells High/Low High/High
Figure 7 Summary of different soil vapour sampling probes and sample collection containers and their influence on data quality, from low to high (GeoProbe Systems, Tech. bulletin No. MK3098, May 2006)
One indication of data quality issues with current soil vapour sampling standards comes from an unpublished review of existing data compiled by the American Petroleum Institute (API) . Figure 8 shows concentrations of benzene versus oxygen from a large number of soil vapour samples collected by different practitioners, using methods that are not all identical, but are representative of current practices in North America . In many cases, there are high concentrations of both benzene and oxygen, which is not expected because benzene is rapidly degraded by indigenous soil bacteria when oxygen is present . One probable explanation
Why isn’t soil vapour sampling more universally accepted?

13Section 4
for the samples with high concentrations of both oxygen and benzene is that the oxygen in the samples was contributed by a leak of atmospheric air during sample collection .
Figure 8: Benzene versus oxygen concentrations from a database of soil gas data compiled by API (used with permission).
1.0E-01
1.0E+00
1.0E+01
1.0E+02
1.0E+03
1.0E+04
1.0E+05
1.0E+06
1.0E+07
1.0E+08
1.0E+09
0 5 10 15 20 25
Oxygen Concentration in Soil Gas (%)
Ben
zene
Con
cent
ratio
n in
Soi
l Gas
(ug/
m3)
Figure 8 benzene versus oxygen concentrations from a database of soil vapour data compiled by API (used with permission)
It is instructive to understand the root cause of variations in soil vapour sampling methods . If the goal is to assess potentially explosive concentrations of methane near a landfill, the concentrations of interest are greater than 5 %v/v (50 000 ppmv) . Where the goal is to assess whether there has likely been a release of VOCs from an underground storage tank, the target concentrations are typically in the order of 0,01 %v/v (100 ppmv) . For subsurface vapour intrusion assessments, the chemical-specific soil vapour concentration screening levels are commonly on the order of 0,010 - 0,1 ppmv (corresponding to a few tens to hundreds of μg/m3) . This creates a much more challenging situation for data quality control and quality assurance and these data quality objectives must be considered in the selection of sampling protocols . Unfortunately, many practitioners are unaware of some of the sources of bias (e .g . equipment contamination) that are only significant at the most sensitive end of this spectrum . Adding to the avoidable sources of bias are natural spatial and temporal variability, which generally affect shallower samples more than deeper samples, although there is still debate regarding the depth below which temporal variability is negligible, and the degree to which that varies from site to site .
Why isn’t soil vapour sampling more universally accepted?
14 Section 4
At the present time, there is a lack of standards or regulatory guidance regarding best practice sampling and analytical methodologies that are necessary and sufficient to consistently meet the data quality objectives of vapour intrusion assessments . For example, the ASTM Standard (1992) for soil vapour sampling was originally written in 1992, which was before vapour intrusion was commonly considered to be a significant pathway . Several other guides have since been written (e .g . EPRI, 2005, API, 2005, Geoprobe, 2006, USEPA, 2006a,b); however, there are differences and ambiguities in some of the sampling protocols that can result in bias and variability . Furthermore, few papers address the challenges of soil vapour sampling from moderate to low permeability materials (McAlary, et al, 2009), which is a relatively common condition . New approaches are also under development, including methods to manage spatial variability by integrating concentrations over large volumes during high purge volume sampling (McAlary et al, 2010a) and new applications of passive samplers in flow through cells or with reduced uptake rates to avoid negative biases from the starvation effect (McAlary et al, 2010b) . For these reasons, an up-to-date protocol will be provided in the forthcoming second part of this guidance .
Why isn’t soil vapour sampling more universally accepted?

15Section 5
Section 5
Key considerations in designing a soil vapour sampling programme
Fundamentally, soil vapour sampling and analysis are not entirely different from groundwater sampling and analysis, except that extensive research was conducted in the 1980s and 1990s to establish groundwater sampling procedures that would reduce the potential for unacceptable bias and variability in the analytical data (e .g . Puls and Barcelona, 1996), and regulatory guidance documents describing groundwater sampling and analysis procedures are much more detailed than their corollaries for soil vapour . Soil vapour sampling can be more challenging because leaks are not readily noticeable, and the analytical reporting limits are much lower, which increases the potential for inadvertent sample contamination . There is a need for improvement in current standards of practice for soil vapour sampling and analysis . Some of the key considerations are summarised below, with particular emphasis on PHCs .
SCOPING CONSIDERATIONS
The number, location, depth and frequency of soil vapour sampling will vary from site to site according to the site-specific conditions affecting the nature and extent of vapours, the fate and transport properties and the location and design of nearby buildings; therefore, it is not practical to establish a single standard scope of work for soil vapour assessment that is universally applicable at all sites . Furthermore, scoping considerations can be substantially different for PHCs than Cl-VOCs, including biogenic gases, baseline respiration, oxygen transport and consumption, pressure gradients from methane production, and temporal variability . Nevertheless, there are some generalisations that will assist in selecting an appropriate scope of work . The forthcoming protocol document will discuss several common scenarios, and provide a rationale for scoping, as a guide that may be helpful for practitioners .
GEOLOGIC CHARACTERISATION
The soil texture, moisture and layering are important features that may significantly influence subsurface vapour transport, and can be readily and affordably obtained by visual inspection and laboratory analysis of soil cores . These activities should be incorporated in a soil vapour assessment programme . Visual inspection of soil cores can also help to identify residual NAPL in the unsaturated zone (oily sheens and staining), aerobic (brown) versus anaerobic (grey) regions, preferential pathways such as fractures, and other conditions that may be essential to the conceptualisation of the nature, extent, fate and transport of PHCs . It should also be recognised that a more detailed targeted site investigation of the vadose zone can better inform the physical situation by, for
A good conceptual site model (CSM) is critical in vapour intrusion assessments at petroleum hydrocarbon sites .
Source depth, source type (e .g . free/residual NAPL or dissolved-phase), water-table elevation, and the subsurface oxygen distribution (including factors that could affect oxygen availability, such as impermeable surface covers/building foundations; low-permeability, water-saturated, or organic-rich soils) are factors to consider in developing a good CSM at petroleum hydrocarbon sites .
Acute conditions, although rare, can be significant (e .g . explosive vapour conditions, residents complaining of odours, nausea) . Acute conditions are generally restricted to large-volume release (e .g . manufacturing and pipeline) sites or sites where NAPL is in close proximity to building foundations and biodegradation (oxygen availability, in particular) is limited .

16 Section 5
instance, delineating a fine-textured, high moisture content layer in a sandy soil which could impose a substantial barrier to vapour migration . Important aspects of the geologic structure and layering may not have been revealed by an initial, coarser, investigation targeted at screening a larger area .
EquIPMENT CONTAMINATION
Using equipment that is free from VOC contamination is especially challenging when using analytical methods with reporting limits less than 1 ppbv (which for most VOCs corresponds to concentrations in the low microgram per cubic metre (μg/m3) range) . For comparison, groundwater reporting limits are typically around 1 μg/L (i .e . 1 000 μg/m3); therefore, standard practices for groundwater sampling may not be sufficiently stringent to avoid equipment contamination issues during soil vapour sampling . All equipment contacting soil gas between collection and analysis must be sufficiently inert and clean to avoid contributing vapours to, or absorbing vapours from the sample . Soft tubings (low density polyethylene, neoprene, Tygon, or silicone) and even Tedlar bags can contribute VOC vapours at concentrations near or above health-based screening levels for soil vapour (Hayes et al, 2006, Hayes, 2008) . Equipment must be transported and stored in clean environments prior to use . A sample collected through the sampling equipment and a fully constructed soil gas probe prior to installation in the sub-surface can be analysed to assess the potential contribution of any vapours attributable to equipment contamination .
SORPTION LOSSES
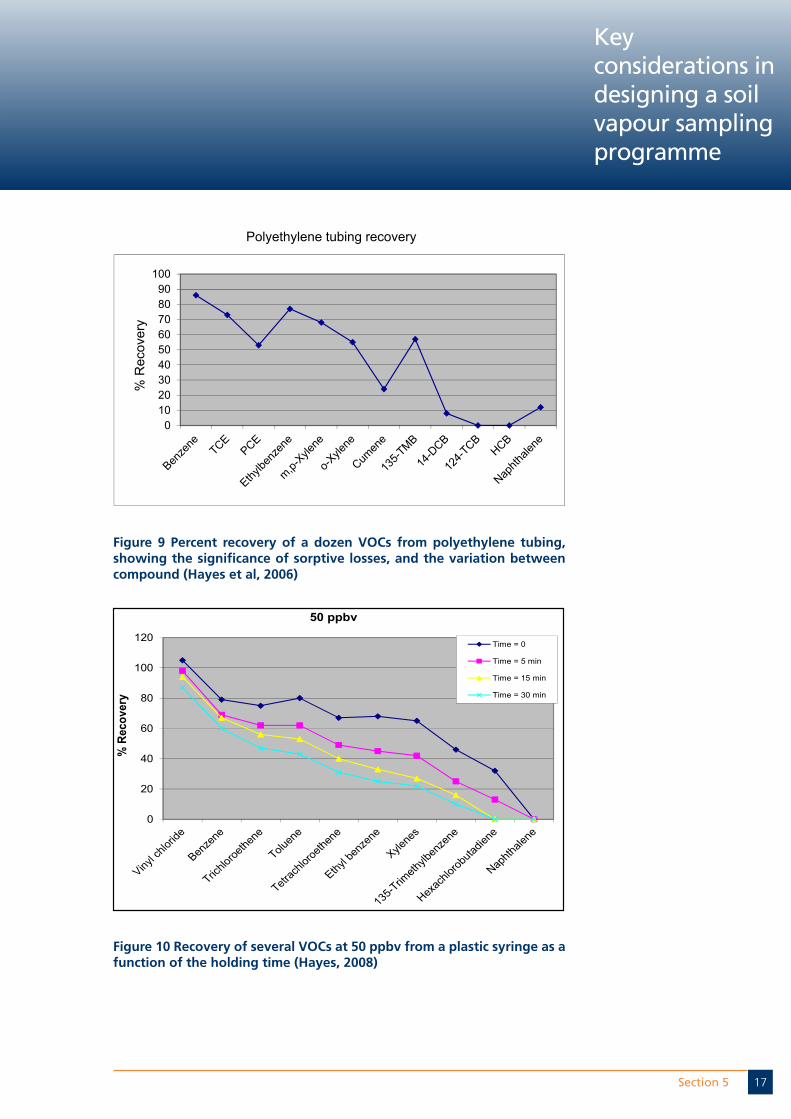
Interaction with sampling equipment can cause negative biases of potential significance . This is especially problematic for heavier compounds, which tend to have higher sorption coefficients, and therefore adsorb or absorb to surfaces easily . Figure 9 shows an example of losses that may occur when samples with 0,5 ppbv VOCs are collected at a flow rate of 80 mL/min through a 2-foot segment of low-density polyethylene tubing (Hayes et al, 2006) . A similar trend was observed with samples collected using plastic syringes (see Figure 10 and Hayes, 2008) . This can be avoided via proper material selection for the compounds of concern . Sorptive losses diminish over time as the surface sites available for adsorption become occupied, although this will vary from compound to compound .
Key considerations in designing a soil vapour sampling programme
17Section 5
0102030405060708090
100
% R
ecov
ery
Polyethylene tubing recovery
Figure 9 Percent recovery of a dozen VOCs from polyethylene tubing, showing the significance of sorptive losses, and the variation between compound (Hayes et al, 2006)
0
20
40
60
80
100
120
% R
ecov
ery
50 ppbv
Time = 0
Time = 5 min
Time = 15 min
Time = 30 min
Figure 10 Recovery of several VOCs at 50 ppbv from a plastic syringe as a function of the holding time (Hayes, 2008)
Key considerations in designing a soil vapour sampling programme

18 Section 5
LEAKS IN ANNuLAR SEALS AND AbOVE-GROuND FITTINGS
Soil vapour sample collection is most often performed by drawing a vacuum to extract a vapour sample . If there are leaks in the sampling system, the resulting sample may be comprised partially or wholly of atmospheric air, depending on the relative flows from the leak and the geologic material . The two most common leaks occur at fittings in the sample train and in the annulus between the geologic material and the probe . Leaks at fittings can be minimised or eliminated using fittings designed to withhold significant vacuum (e .g . Swagelok™ compression fittings) . Shut-in tests can be used to test the integrity of the fittings, and a tracer test can be used to test both potential leaks (see Figure 11) . A shut-in test consists of applying a vacuum to the sample train and closing valves at both ends . If the vacuum dissipates, a leak is indicated, and should be corrected before sampling . An example apparatus for collecting soil vapour samples using a gaseous tracer leak-check compound is shown in Figure 11 . The inverted transparent blue plastic bin contains an atmosphere of about 10 % helium, and a Tedlar bag is filled using a vacuum chamber during purging, which is screened prior to sample collection with a portable helium meter to verify the absence of helium, and thereby verify the integrity of the fittings and annular seal (McAlary et al, 2009) . Leaks along the annulus between a probe and the surrounding geologic materials can be minimised or eliminated by sealing the annulus with a thick and well-mixed slurry of bentonite and water .
Figure 11 Example soil vapour sampling apparatus showing helium shroud for leak-testing
PuRGING AND FIELD SCREENING
Active sampling generally involves some amount of purging prior to sample collection, but there is significant debate regarding the practices and merits of the purging process . Most practitioners agree that stagnant gas within the soil gas probe should be removed to draw soil gas from the surrounding geologic materials prior to sampling, although there are differences of opinion regarding
Key considerations in designing a soil vapour sampling programme

19Section 5
the flow rate, volume and applied vacuum levels that are acceptable . Some argue to minimise the volume of gas removed during purging and sampling (Schumacher et al, 2009), while others have shown that with proper probe construction larger purge or sample volumes are usually equally representative and sometimes more informative (Lewis et al, 2004, McAlary et al, 2010a) . Several guidance documents impose a limit on the flow rate during soil gas purging and sampling (typically 100 to 200 mL/min), which has been shown to be unnecessary as long as the permeability is sufficient to yield higher flows without excessive vacuum (Creamer and McAlary, 2006) . There is a possibility that excessive vacuum might result in disruption of the local phase partitioning between the soil gas and pore water, and possibly cause a bias in concentrations (API, 2005 recommends maintaining vacuum <100 inches of water column) . The application of field screening with portable instruments during purging has been used to gain real-time information during sample collection, but there are several precautions that should be followed to yield representative and reproducible results .
FLOW AND VACuuM LIMITATIONS IN LOW PERMEAbILITy SOILS
Soil vapour sampling is much easier in sand and gravel than silts and clays . As the permeability decreases the sustainable flow rate for a given applied vacuum decreases . There are practical limits to the amount of vacuum to be applied during sampling, so in some geologic materials, it may not be practical to collect a soil vapour sample of sufficient volume for analysis within a reasonable period of time, although there are alternatives that can provide representative samples (McAlary et al, 2009) . Other challenges can be posed if the geologic materials are difficult to drill through, or have a tendency to retain water at high saturation levels .
MONITORING SOIL GAS PERMEAbILITy
Monitoring of flow and vacuum during purging provides data that can be used to calculate the gas-permeability of soils surrounding a probe tip, and this can help to characterise the presence of low-permeability barriers to vapour transport . Static pressure monitoring can also be compared to atmospheric pressure fluctuations to assess whether there is a significant differential pressure and/or time-lag as a way of assessing the degree to which the vadose zone constitutes a continuous gas-phase pathway from the depth of the soil gas probe to the atmosphere .
SAMPLE SHIPPING, STORAGE AND HANDLING
Shipping by air generally results in gas samples being exposed to a low-pressure surrounding, which can result in leakage or rupture of some sample containers (e .g . Tedlar bags) . Different containers have different hold times before analyte recovery is compromised from as little as minutes for plastic syringes (Norm-Ject®, Air-Tite 60 mL capacity syringes manufactured by Henke Sass and Wolf)
There is a wide range of potential causes of bias and variability in soil vapour samples, some of which are natural, and some of which are caused by sampling protocol imperfections and inter-operator error . The level of effort required to obtain appropriate quality data depends on many factors, so the methods should allow some flexibility to be customised to site-specific conditions . At the same time, standardisation for meeting minimum data quality objectives is also valuable .
Key considerations in designing a soil vapour sampling programme

20 Section 5
to a month or more for Summa canisters or Automatic Thermal Desorption (ATD) tubes, although this varies for different compounds . Some compounds can photo-degrade, which affects their storage in transparent containers such as glass bulbs and Tedlar bags .
ADSORPTIVE MEDIA SAMPLES
Many sampling methods for VOCs, semi-volatile organic compounds (SVOCs), and other compounds with poor recoveries from whole-gas sample containers are collected by drawing a measured volume of gas through an adsorbent media-filled tube . Depending on the compounds to be analysed, there are several types of tubes and adsorbents that may be used for soil vapour sampling (Figure 12) . It can be challenging to select the appropriate adsorbent or mixture of adsorbents for sites with unknown or complex mixtures of chemical vapours present . When concentrations cannot be estimated prior to sampling (e .g . initial sampling event), there is a risk that the sorptive sites in the tube will become saturated and vapours may be lost; in consequence multiple tubes in series are recommended to check for vapour breakthrough . Water can interfere with some adsorbents, which is more of an issue with soil vapour sampling than indoor air sampling because soil gas is typically near 100 % relative humidity . If samples are collected on a cold day, water can condense in the tubes, which can cause problems during analysis . Furthermore, in low permeability materials, it can be difficult to collect sufficient sample volume to meet analytical requirements or to measure and sustain a steady flow rate over the sampling interval .
Figure 12 Various types of adsorbent-filled tubes used for sampling different classes of semi-volatile organic compounds
AVAILAbILITy OF LAbORATORIES WITH APPROPRIATE CAPAbILITIES
Soil vapour analysis requires some specialised equipment and training that are not available at all laboratories established for soil, sediment and water analysis . For very low-level reporting limits, it is challenging to prepare and store certified gas standards . Sample containers (canisters or tubes) prepared by the
Key considerations in designing a soil vapour sampling programme
21Section 5
laboratory must be properly cleaned and certified, which requires some effort for decontamination . This can be challenging considering the potential for samples with concentrations up to a million times higher than minimum reporting limits to be introduced into the laboratory . The indoor air quality in the laboratory must also be carefully controlled, as there are certain procedures in laboratories that involve the use of solvents, which could potentially pose a bias for very sensitive analytical instruments .
None of the challenges listed above is insurmountable, but they do require a level of care and consideration that is above current standards of practice in many cases . A systematic guideline for soil vapour sampling is the first step in overcoming the challenges in order to achieve consistently high quality data .
Key considerations in designing a soil vapour sampling programme

22 Section 6
Section 6
Summary and recommendations
Soil vapour sampling and analysis has a valuable place in the assessment of subsurface vapour intrusion to indoor air, particularly for petroleum hydrocarbons, where aerobic degradation is an important attenuation mechanism . Vertical profiles of PHCs and fixed gases contribute greatly to understanding the significance of biologically-mediated attenuation . The historic methods for soil vapour surveys that were acceptable for initial screening of potential releases are not well-suited to provide the quality of data needed to assess human health risks via the vapour intrusion pathway because the analytical reporting limits need to be much lower . Careful and detailed sampling protocols are needed to minimise sample bias and promote consistent sample collection and quality assurance between practitioners . Therefore, a soil vapour sampling guidance document is needed to provide practitioners with useful information to assure the soil vapour data are consistently of a quality appropriate for use in human health risk assessment . The Energy Institute has commissioned the production of such a document .

23Annex A
Abreu, L .D .V ., and P .C . Johnson . 2006 . Simulating the effect of aerobic biodegradation on soil vapor intrusion into buildings: Influence of degradation rate, source concentration, and depth . Environ . Sci . Technol . 40(7), p2304-2315 .
Abreu, L ., R . Ettinger and T . McAlary, 2009 . Simulated soil vapor intrusion attenuation factors including biodegradation for petroleum hydrocarbons, in Groundwater monitoring and remediation, Volume 29, p105-117 .
American Petroleum Institute (API), 2005 . Collecting and interpreting soil gas samples from the vadose zone: A practical strategy for assessing the subsurface vapor-to-indoor air migration pathway at petroleum hydrocarbon sites. Publication 4741 .
API, 2009 . Simulating the effect of aerobic biodegradation on soil vapor intrusion into buildings: Evaluation of low strength sources associated with dissolved gasoline plumes, API Technical Bulletin 4775 .
American Society for Testing and Materials (ASTM), 1992 . Standard guide for soil gas monitoring in the vadose zone, ASTM D 5314-92, Annual Book of ASTM Standards, v . 04:09 .
CIRIA, 2009 . The VOCs handbook: Investigating, assessing and managing risks from inhalation of VOCs at land affected by contamination.
Creamer, T ., and T . McAlary, 2006 . The effects of purge rate and volume on sub-slab soil gas samples, a platform presentation at the Battelle conference on remediation of chlorinated and recalcitrant compounds, May 2006 .
Dawson, H . and T . McAlary, 2009 . A compilation of order statistics for VOCs from post-1990 indoor air concentration studies in North American residences unaffected by subsurface vapor intrusion, Groundwater monitoring and remediation 29, no . 1/Winter 2009/pages 60–69 .
Davis, R ., 2006 . Vapor attenuation in the subsurface from petroleum hydrocarbon sources, an update and discussion on the ramifications of the vapor-intrusion risk pathway, LUSTLine Bulletin 52, May 2006, p22-25 .
DeVaull, G . E ., 2007 . Indoor vapor intrusion with oxygen-limited biodegradation for a subsurface gasoline source, Environmental science and technology 2007, 41 (9), p3241-3248 .
Electrical Power Research Institute (EPRI), 2005 . Reference handbook for site-specific assessment of subsurface vapor intrusion to indoor air, EPRI Document 1008492 .
Energy Institute, 2009 . Screening the potential for hydrocarbon vapour intrusion risks in Petroleum review, August 2009, p40-42 .
Environment Agency, 2009 . CLEA Software (version 1.05) handbook, Science report SC050021/SR4 .
Environment Agency, 1990 . Environmental Protection Act, Part 2A .
Annex A
References
24 Annex A
Gauthier, T .D ., 2005 . Deriving florida-specific attenuation factors using radon data . Proceedings of the Florida Air & Waste Management Association 2005 annual conference, 22 November 2005 .
Geoprobe®, 2006 . Direct-push installation of devices for active soil gas sampling and monitoring, Technical Bulletin 3099 .
Hayes, H ., D .J . Benton and N . Khan, 2006 . The impact of sampling media on soil gas measurements, a presentation at AWMA ‘Vapor intrusion - the next great environmental challenge - an update’, 13-15 September 2006 .
Hayes, H ., 2008 . Evaluation of disposable syringes on the collection of soil gas.
Lewis, R .G ., Folsom, S .D ., and B . Moore, 2004 . Modified active gas sampling manual . HSA Project Number 6005-1934-07 .
Little, J .C ., J .M . Daisey, and W .W . Nazaroff, 1992 . Transport of subsurface contaminants into buildings: an exposure pathway for volatile organics . Env . Sci . Technol ., 26(11):2058-2066 .
Luo, H ., P . Dahlen, P .C . Johnson, T . Peargin, and T . Creamer . 2009 . Spatial variability of soil gas concentrations near and beneath a building overlying shallow petroleum hydrocarbon-impacted soils, in Groundwater monitoring and remediation Volume 29: 81-91 .
Luo, H ., P . Dahlen, and P .Johnson, 2010 . Hydrocarbon and oxygen transport in the vicinity of a building overlying a NAPL source zone in the proceedings of AWMA Vapor Intrusion 2010, 29 September 2010 .
McAlary, T .A ., P . Nicholson, H . Groenevelt, and D . Bertrand, 2009 . A case-study of soil gas sampling in silt and clay-rich (low-permeability) materials, in Groundwater monitoring and remediation Volume 29, p144-152 .
McAlary, T .A ., Nicholson, P ., Yik, L .K ., Bertrand, D . and G . Thrupp, 2010a . High purge volume sampling-a new paradigm for sub-slab soil gas monitoring, in Groundwater monitoring and remediation Volume 30, p73-85 .
McAlary, T .A ., P . Nicholson, H . Groenevelt, D . Bertrand and R . Ettinger, in press . A case study on the influence of aerobic biodegradation on vapor intrusion at a former refinery property, in Vapor emission to outdoor air and enclosed spaces for human health risk assessment: site characterisation, monitoring and modeling. Nova Publishers .
McAlary, T .A ., McAlary, T ., H . Groenevelt, T . Gorecki, S . Seethapathy, P . Sacco, D . Crump, M . Tuday, B . Schumacher, H . Hayes and P . Johnson, 2010 . Quantitative passive diffusive-adsorptive sampling techniques for vapor intrusion assessment, in the proceedings of AWMA Vapor Intrusion 2010, 29 September 2010 .
McCarthy, K .A ., and R .L . Johnson . 1991 . The transport of volatile organic compounds across the capillary fringe . Draft . Water Resources Research, v29, no .6, p1675-1683 .
McHugh, T . E ., D .E . Hammond, T . Nickels and B . Hartman, 2008 . Use of radon measurements for evaluation of volatile organic compound (VOC) vapor intrusion . Environmental Forensics, v9, p107-114 .
References

25Annex A
Michaelski, P., S. Thompson, C. DeWolf, P. Nicholson and T. McAlary, 2010. Effects of alternate hydrocarbon sources in the vadose zone on the vapour intrusion pathway beneath a residential community, in the proceedings of AWMA Vapor Intrusion 2010, 29 September 2010.
New York State Department of Health (NYSDOH), 2006. Guidance for evaluating soil vapor intrusion in the state of New York.
Puls, R.W., and Barcelona M.J., 1996. EPA Ground water issue low-flow (minimal drawdown) ground-water sampling procedures, EPA/540/S-95/504.
Roggemans, S., C.L. Bruce, P.C. Johnson, and R. L. Johnson. December 2001. Vadose zone natural attenuation of hydrocarbon vapors: an empirical assessment of soil gas vertical profile data. API Soil and Groundwater Technical Task Force Bulletin No. 15. American Petroleum Institute.
Schumacher, B. A., J. H. Zimmerman, C. R. Sibert, K. E. Varner, and L. A. Riddick, 2009. Macro- and micro-purge soil gas sampling methods for the collection of contaminant vapors in Groundwater monitoring and remediation Volume 29, p138-143.
United States Environmental Protection Agency (US EPA), 1993. Behavior and determination of volatile organic compounds in soil: A literature review. Report EPA/600/SR-93/140.
United States Environmental Protection Agency (US EPA), 2002b. OSWER guidance for evaluating the vapor intrusion to indoor air pathway from groundwater and soils (subsurface vapor intrusion guidance).
United States Environmental Protection Agency (US EPA), 2006a. Assessment of vapor intrusion in homes near the Raymark Superfund Site using basement and sub-slab air samples, EPA/600/R-05/147.
United States Environmental Protection Agency (US EPA), 2006b. Comparison of Geoprobe® PRT and AMS GVP soil-gas sampling systems with dedicated vapor probes in sandy soils at the Raymark Superfund Site, EPA/600/R-06/111.
United States Environmental Protection Agency (US EPA), 2008. EPA’s Vapor intrusion database - analysis of attenuation factors (groundwater, subslab, soil gas and crawlspace) from multiple sites. http://iavi.rti.org/Resources.cfm?PageID=documentDetails&AttachID=394 (accessed on 28 March 2010).
References

ISBN 978 0 85293 611 5
61 New Cavendish StreetLondon W1G 7AR, UKt: +44 (0)20 7467 7100
This publication has been produced as a result of work carried out within the Technical Team of the Energy Institute (EI), funded by the EI’s Technical Partners. The EI’s Technical Work Programme provides industry with cost-effective, value-adding knowledge on key current and future issues affecting those operating in the energy sector, both in the UK and internationally.
For further information, please visit http://www.energyinst.org
Further copies can be obtained from:
EI Publications website www.energyinstpubs.org.uk
or Portland Customer Services, t: +44 (0) 1206 796 351 e: [email protected]