Introduction: WhatIs Economics? F ERNANDO Q UIJANO, Y VONN Q UIJANO, K YLE T HIEL & A PARNA S...
35
Introduction: What Is Economics? FERNANDO QUIJANO, YVONN QUIJANO, KYLE THIEL & APARNA SUBRAMANIAN PREPARED BY: © 2007 Pearson/Prentice Hall Economics: Principles, Applications, and Tools, 5e O’Sullivan • Sheffrin • Perez
-
date post
19-Dec-2015 -
Category
Documents
-
view
213 -
download
0
Transcript of Introduction: WhatIs Economics? F ERNANDO Q UIJANO, Y VONN Q UIJANO, K YLE T HIEL & A PARNA S...
Introduction: What Is Economics?
FERNANDO QUIJANO, YVONN QUIJANO,
KYLE THIEL & APARNA SUBRAMANIAN
PREPARED BY:
© 2007 Pearson/Prentice Hall Economics: Principles, Applications, and Tools, 5e O’Sullivan • Sheffrin • Perez

2 of 35
ch
ap
ter
© 2007 Pearson/Prentice Hall Economics: Principles, Applications, and Tools, 5e O’Sullivan • Sheffrin • Perez
1 Do people respond to incentives?
Pedaling for Television Time
2 What is the role of prices in allocating resources?
London Solves Its Congestion Problem

3 of 35
ch
ap
ter
© 2007 Pearson/Prentice Hall Economics: Principles, Applications, and Tools, 5e O’Sullivan • Sheffrin • Perez
WHAT IS ECONOMICS?1.1• scarcity
The resources we use to producegoods and services are limited.
• economicsThe study of choices when there isscarcity.
Here are some examples of scarcity and the trade-offs associated with making choices:
• You have a limited amount of time. If you take a part-time job, each hour on the job means one less hour for study or play.
• A city has a limited amount of land. If the city uses an acre of land for a park, it has one less acre for housing, retailers, or industry.
• You have limited income this year. If you spend $17 on a music CD, that’s $17 less you have to spend on other products or to save.
4 of 35
ch
ap
ter
© 2007 Pearson/Prentice Hall Economics: Principles, Applications, and Tools, 5e O’Sullivan • Sheffrin • Perez
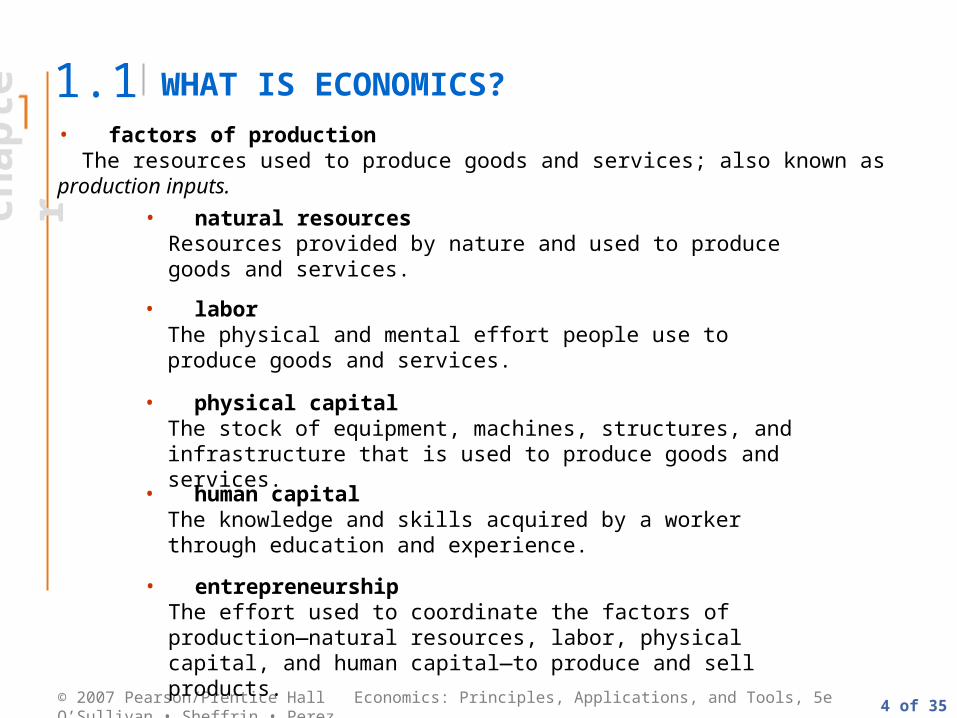
WHAT IS ECONOMICS?1.1• factors of production
The resources used to produce goods and services; also known as production inputs.
• natural resourcesResources provided by nature and used to produce goods and services.
• laborThe physical and mental effort people use to produce goods and services.
• physical capitalThe stock of equipment, machines, structures, and infrastructure that is used to produce goods and services.
• human capitalThe knowledge and skills acquired by a worker through education and experience.
• entrepreneurshipThe effort used to coordinate the factors of production—natural resources, labor, physical capital, and human capital—to produce and sell products.
5 of 35
ch
ap
ter
© 2007 Pearson/Prentice Hall Economics: Principles, Applications, and Tools, 5e O’Sullivan • Sheffrin • Perez
WHAT IS ECONOMICS?1.1
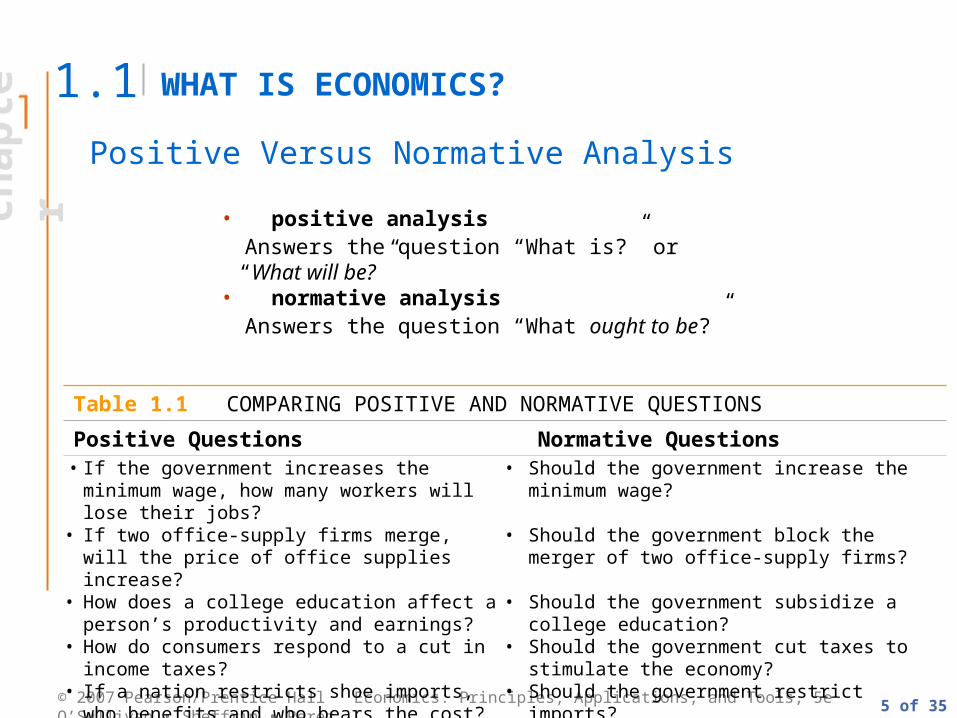
• positive analysisAnswers the question “What is?” or “What will be?”
Positive Versus Normative Analysis
• normative analysisAnswers the question “What ought to be?”
Table 1.1 COMPARING POSITIVE AND NORMATIVE QUESTIONS
Positive Questions Normative Questions• If the government increases the minimum wage,
how many workers will lose their jobs?• Should the government increase the minimum
wage?• If two office-supply firms merge, will the price of
office supplies increase?• Should the government block the merger of two
office-supply firms?• How does a college education affect a person’s
productivity and earnings?• Should the government subsidize a college
education?• How do consumers respond to a cut in income
taxes? • Should the government cut taxes to stimulate the
economy?• If a nation restricts shoe imports, who benefits and
who bears the cost?• Should the government restrict imports?

6 of 35
ch
ap
ter
© 2007 Pearson/Prentice Hall Economics: Principles, Applications, and Tools, 5e O’Sullivan • Sheffrin • Perez
WHAT IS ECONOMICS?1.1
The Three Key Economic Questions: What, How, and Who?
The choices made by individuals, firms, and governments answer three questions:
1 What products do we produce?
2 How do we produce the products?
3 Who consumes the products?
Economic Models
• economic modelA simplified representation of an economic environment, often employing a graph.

7 of 35
ch
ap
ter
© 2007 Pearson/Prentice Hall Economics: Principles, Applications, and Tools, 5e O’Sullivan • Sheffrin • Perez
ECONOMIC ANALYSIS AND MODERN PROBLEMS
Economic View of Traffic Congestion
1.2
To an economist, the diagnosis of the congestion problem is straightforward. When you drive onto a busy highway during rush hour, your car takes up space and decreases the distance between the vehicles on the highway. The normal reaction to a shorter distance between moving cars is to slow down. So when you enter the highway, you force other commuters to spend more time on the highway.
One possible solution to the congestion problem is to force people to pay for using the road, just as they pay for gasoline and tires.
The job for the economist is to compute the appropriate congestion tax and predict the consequences of imposing the tax.
8 of 35
ch
ap
ter
© 2007 Pearson/Prentice Hall Economics: Principles, Applications, and Tools, 5e O’Sullivan • Sheffrin • Perez
ECONOMIC ANALYSIS AND MODERN PROBLEMS
Economic View of Poverty in Africa
1.2
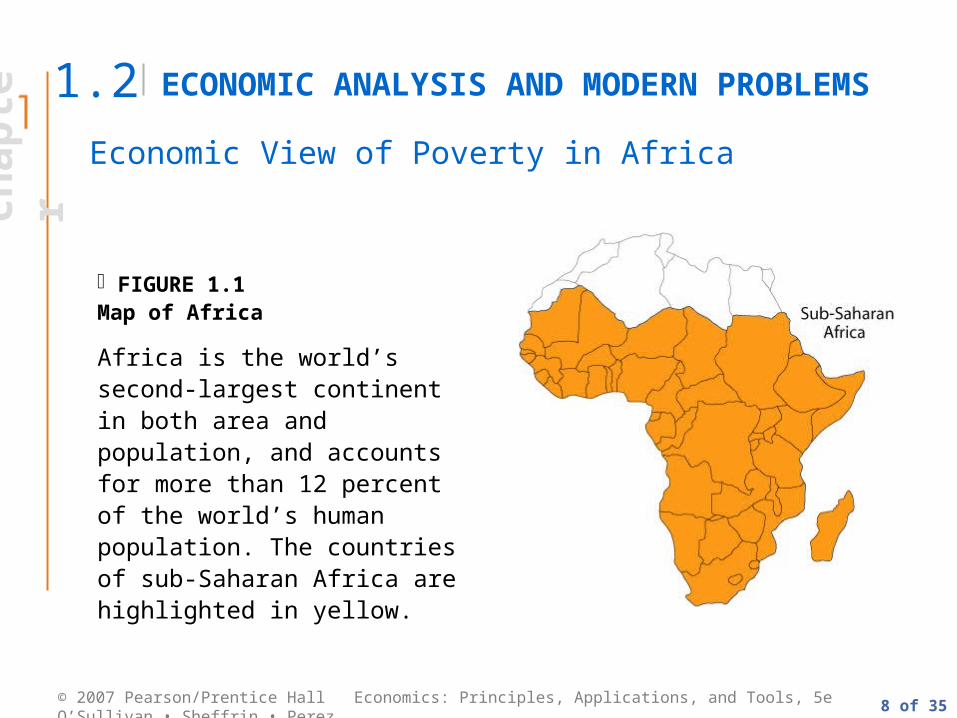
FIGURE 1.1Map of Africa
Africa is the world’s second-largest continent in both area and population, and accounts for more than 12 percent of the world’s human population. The countries of sub-Saharan Africa are highlighted in yellow.

9 of 35
ch
ap
ter
© 2007 Pearson/Prentice Hall Economics: Principles, Applications, and Tools, 5e O’Sullivan • Sheffrin • Perez
ECONOMIC ANALYSIS AND MODERN PROBLEMS
Economic View of Japan’s Economic Problems
1.2
Following World War II, Japan grew rapidly, with per capita income increasing by about 4 percent per year between 1950 and 1992. But in 1992, the economy came to a screeching halt. For the next 10 years, per capita income either decreased or increased slightly.
The challenge for economists was to develop a set of policies to get the Japanese economy moving again.
Economists responded by designing policies to stimulate spending by consumers and businesses and to make needed changes to the Japanese financial system.

10 of 35
ch
ap
ter
© 2007 Pearson/Prentice Hall Economics: Principles, Applications, and Tools, 5e O’Sullivan • Sheffrin • Perez
THE ECONOMIC WAY OF THINKING1.3Four elements of the economic way of thinking:
1 Use Assumptions to Simplify
Economists use assumptions to make things simpler and focus attention on what really matters.
2 Isolate Variables—Ceteris Paribus
Economic analysis often involves variables and how they affect one another.
• variableA measure of something that can take on different values.
• ceteris paribusThe Latin expression meaning othervariables being held fixed.

11 of 35
ch
ap
ter
© 2007 Pearson/Prentice Hall Economics: Principles, Applications, and Tools, 5e O’Sullivan • Sheffrin • Perez
THE ECONOMIC WAY OF THINKING1.3
3 Think at the Margin
Economists often consider how a small change in one variable affects another variable and what impact that has on people’s decision making.
• marginal changeA small, one-unit change in value.
4 Rational People Respond to Incentives
A key assumption of most economic analysis is that people act rationally, meaning that they act in their own self-interest.

12 of 35
ch
ap
ter
© 2007 Pearson/Prentice Hall Economics: Principles, Applications, and Tools, 5e O’Sullivan • Sheffrin • Perez
PEDALING FOR TELEVISION TIME
APPLYING THE CONCEPTS #1: Do people respond to incentives?
• Children were put into two groups:
•Control group: Obese children randomly assigned to a TV with a stationary bike in front of the TV – no pedaling required to watch TV.
•Treatment group: Obese children randomly assigned to a TV with astationary bike in front of it – pedaling is required to watch TV.
• Outcome: The control group watched TV 21 hours on average and the treatment group only 2 hours on average per week.
To illustrate the notion that people are rational and respond to incentives, consider an experiment conducted by researchers at St. Luke’s Roosevelt Hospital in New York City. The researchers addressed the following question: If a child must pedal a stationary bicycle to run a television set, will he watch less TV?

13 of 35
ch
ap
ter
© 2007 Pearson/Prentice Hall Economics: Principles, Applications, and Tools, 5e O’Sullivan • Sheffrin • Perez
FREAKONOMICS
• According to Levitt, it is in the best interest of the realtor to convince sellers to take an offer lower than they would receive if the property remained on the market.
• Since the percentage of the sales price that real estate salespersons receive from selling a house is a very small fraction, a $10,000 increase in sales price might net a real estate professional another $150 commission for a tremendous amount of additional work.
• It is in the real estate salesperson’s best interest to convince the seller to make the quick sale and take the first reasonable offer.
• Levitt points toward evidence that real estate professionals tend to leave their own properties on the market longer and receive 2-3% more in sales price.
Economics is truly a social science that can be used to explain quite a bit of human behavior.
Economist Steven Levitt, one of the authors of the best selling book “Freakonomics,” answers a host of questions typically not tackled by most economists. One of the questions is related to realtors and agency relationships. In other words, do realtors really work for real estate sellers? Does a real estate agent have an incentive to get you the highest price?
Extra Application 3

14 of 35
ch
ap
ter
© 2007 Pearson/Prentice Hall Economics: Principles, Applications, and Tools, 5e O’Sullivan • Sheffrin • Perez
LONDON SOLVES ITS CONGESTION PROBLEM
APPLYING THE CONCEPTS #2: What is the role of prices in allocating resources?
To illustrate the economic way of thinking, let’s consider again how an economist would approach the problem of traffic congestion.
•Use assumptions to simplify
•Isolate variables—ceteris paribus
•Think at the margin
If the government imposes a congestion tax to reduce congestion during rush hour, the question for the economist is: How high should the tax be? Determine the cost imposed by the marginal driver:
•Driver forces each of 900 commuters to spend 2 extra seconds on the highway
•Total travel time increases by 30 minutes
•Value of time is $16 per hour
•Appropriate congestion tax is $8.00

15 of 35
ch
ap
ter
© 2007 Pearson/Prentice Hall Economics: Principles, Applications, and Tools, 5e O’Sullivan • Sheffrin • Perez
PREVIEW OF COMING ATTRACTIONS:MACROECONOMICS1.4
• macroeconomicsThe study of the nation’s economy as a whole; focuses on the issues of inflation, unemployment, and economic growth.
To Understand Why Economies Grow
Macroeconomics explains why some resources increase over time and how an increase in resources translates into a higher standard of living.
Macroeconomics explains why economies grow and change and why economic growth is sometimes interrupted. Let’s look at three ways we can use macroeconomics.

16 of 35
ch
ap
ter
© 2007 Pearson/Prentice Hall Economics: Principles, Applications, and Tools, 5e O’Sullivan • Sheffrin • Perez
MEXICO’S DRUG PROBLEM
• Other provisions in the bill created broader powers designed to hit the drug trade from the supply side such as harsher penalties for dealers.
• Critics contend that the bill’s benefits do not outweigh the costs.
• Many fear that college students and other U.S. youth that already flock south of the border to party will now just add additional substances to abuse to the current legal list, which concerns law enforcement agents in Mexican border towns.
Mexico’s proposed drug decriminalization bill is temporarily derailed as Mexican President Fox requests changes. The move comes on the heels of U.S. criticism that the bill would encourage “drug tourism.” The bill called for eliminating criminal penalties for all “consumers” in possession of small amounts of many illegal drugs.
Extra Application 4
Decriminalization of these drugs will initially increase demand and push prices higher. The already lucrative drug trade will attract new entrants into the supply side and eventually push prices back down. The end result should be higher drug consumption. The new equilibrium price cannot be determined.

17 of 35
ch
ap
ter
© 2007 Pearson/Prentice Hall Economics: Principles, Applications, and Tools, 5e O’Sullivan • Sheffrin • Perez
PREVIEW OF COMING ATTRACTIONS:MACROECONOMICS1.4
To Understand Economic Fluctuations
All economies, including ones that experience a general trend of rising per capita income, are subject to economic fluctuations, including periods when the economy shrinks.
To Make Informed Business Decisions
A manager who studies macroeconomics will be better equipped to understand the complexities of interest rates and inflation and how they affect the firm.

18 of 35
ch
ap
ter
© 2007 Pearson/Prentice Hall Economics: Principles, Applications, and Tools, 5e O’Sullivan • Sheffrin • Perez
PREVIEW OF COMING ATTRACTIONS:MICROECONOMICS1.5
• microeconomicsThe study of the choices made byhouseholds, firms, and governmentand how these choices affect themarkets for goods and services.
To Understand Markets and Predict Changes
One reason for studying microeconomics is to better understand how markets work and to predict how various events affect the prices and quantities of products in markets.
Three ways we can use microeconomic analysis are:

19 of 35
ch
ap
ter
© 2007 Pearson/Prentice Hall Economics: Principles, Applications, and Tools, 5e O’Sullivan • Sheffrin • Perez
PREVIEW OF COMING ATTRACTIONS:MICROECONOMICS1.5
To Make Personal and Managerial Decisions
On the personal level, we use economic analysis to decide how to spend our time, what career to pursue, and how to spend and save the money we earn. As workers, we use economic analysis to decide how to produce goods and services, how much to produce, and how much to charge for them.
To Evaluate Public Policies
We can use economic analysis to determine how well the government performs its roles in the market economy.
20 of 35
ch
ap
ter
© 2007 Pearson/Prentice Hall Economics: Principles, Applications, and Tools, 5e O’Sullivan • Sheffrin • Perez
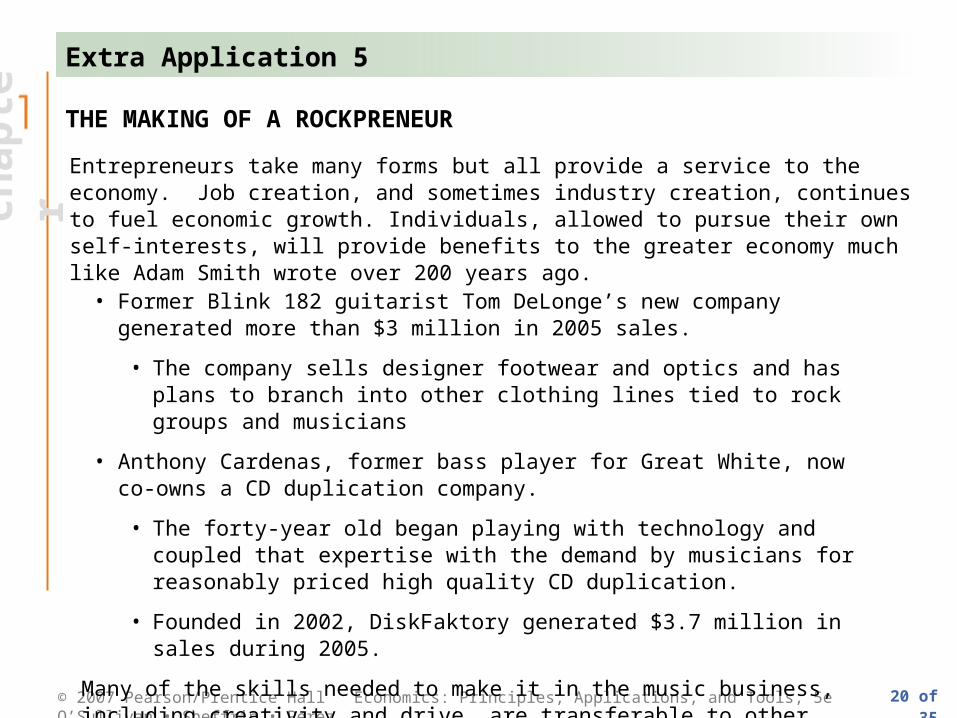
THE MAKING OF A ROCKPRENEUR
• Former Blink 182 guitarist Tom DeLonge’s new company generated more than $3 million in 2005 sales.
• The company sells designer footwear and optics and has plans to branch into other clothing lines tied to rock groups and musicians
• Anthony Cardenas, former bass player for Great White, now co-owns a CD duplication company.
• The forty-year old began playing with technology and coupled that expertise with the demand by musicians for reasonably priced high quality CD duplication.
• Founded in 2002, DiskFaktory generated $3.7 million in sales during 2005.
Many of the skills needed to make it in the music business, including creativity and drive, are transferable to other venues.
Entrepreneurs take many forms but all provide a service to the economy. Job creation, and sometimes industry creation, continues to fuel economic growth. Individuals, allowed to pursue their own self-interests, will provide benefits to the greater economy much like Adam Smith wrote over 200 years ago.
Extra Application 5
21 of 35
ch
ap
ter
© 2007 Pearson/Prentice Hall Economics: Principles, Applications, and Tools, 5e O’Sullivan • Sheffrin • Perez
ceteris paribus
economics
economic model
entrepreneurship
factors of production
human capital
labor
macroeconomics
marginal change
microeconomics
natural resources
normative analysis
physical capital
positive analysis
scarcity
variable

22 of 35
ch
ap
ter
© 2007 Pearson/Prentice Hall Economics: Principles, Applications, and Tools, 5e O’Sullivan • Sheffrin • Perez
USING GRAPHS AND PERCENTAGES
USING GRAPHS
Graphing Single Variables
▼ FIGURE 1A.1Graphs of Single Variables

23 of 35
ch
ap
ter
© 2007 Pearson/Prentice Hall Economics: Principles, Applications, and Tools, 5e O’Sullivan • Sheffrin • Perez
USING GRAPHS AND PERCENTAGES
USING GRAPHS
Graphing Single Variables
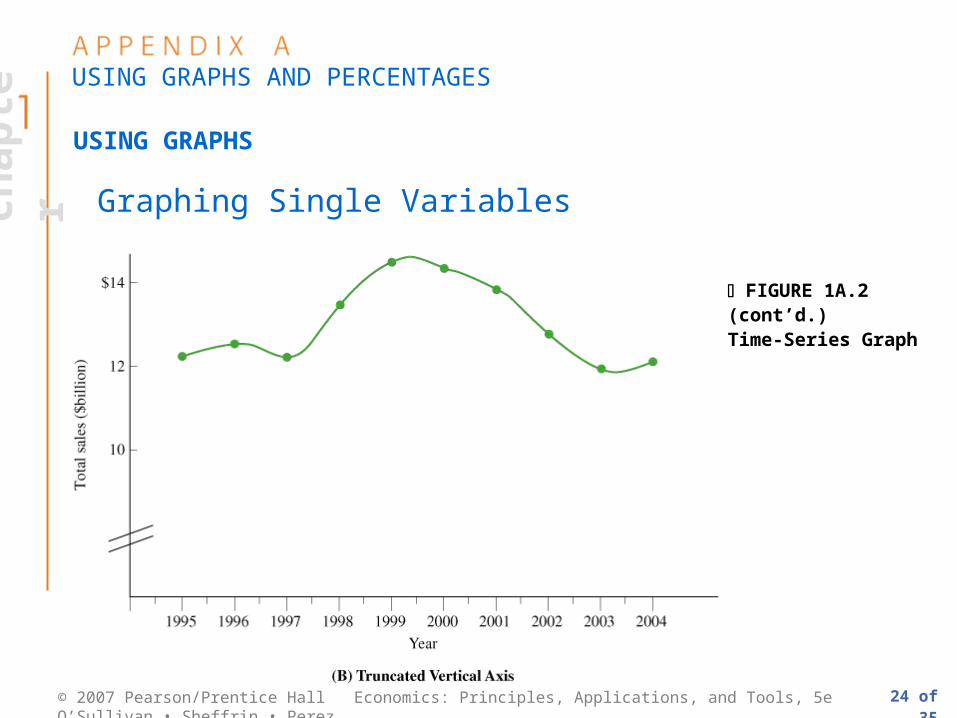
FIGURE 1A.2Time-Series Graph
24 of 35
ch
ap
ter
© 2007 Pearson/Prentice Hall Economics: Principles, Applications, and Tools, 5e O’Sullivan • Sheffrin • Perez
USING GRAPHS AND PERCENTAGES
USING GRAPHS
Graphing Single Variables
FIGURE 1A.2 (cont’d.)Time-Series Graph
25 of 35
ch
ap
ter
© 2007 Pearson/Prentice Hall Economics: Principles, Applications, and Tools, 5e O’Sullivan • Sheffrin • Perez
USING GRAPHS AND PERCENTAGES
USING GRAPHS
Graphing Two Variables
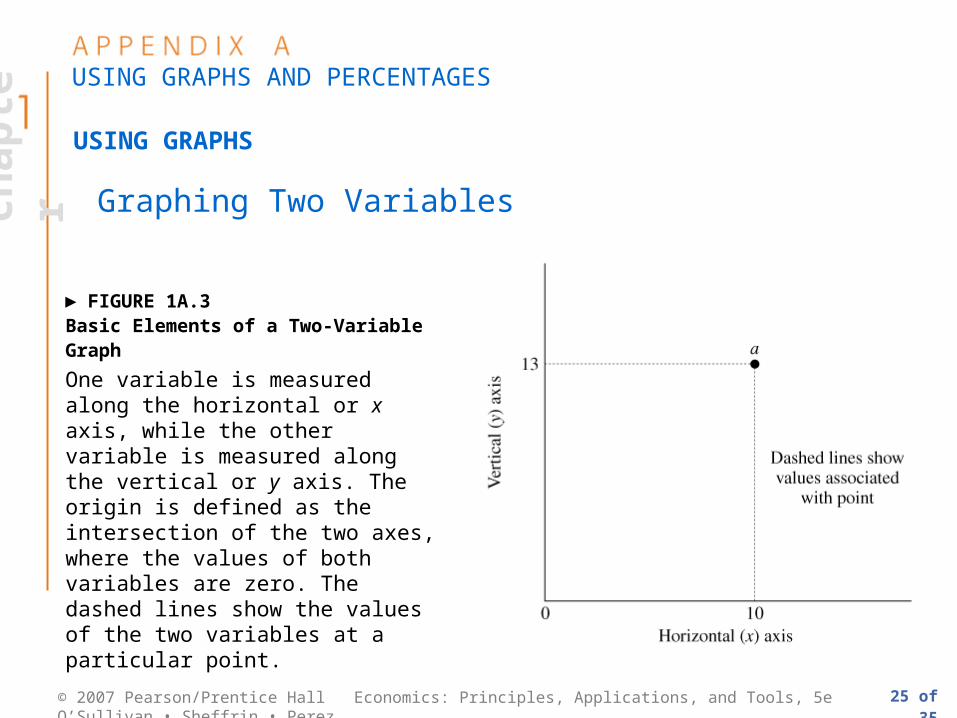
► FIGURE 1A.3Basic Elements of a Two-Variable Graph
One variable is measured along the horizontal or x axis, while the other variable is measured along the vertical or y axis. The origin is defined as the intersection of the two axes, where the values of both variables are zero. The dashed lines show the values of the two variables at a particular point.
26 of 35
ch
ap
ter
© 2007 Pearson/Prentice Hall Economics: Principles, Applications, and Tools, 5e O’Sullivan • Sheffrin • Perez
USING GRAPHS AND PERCENTAGES
USING GRAPHS
Graphing Two Variables
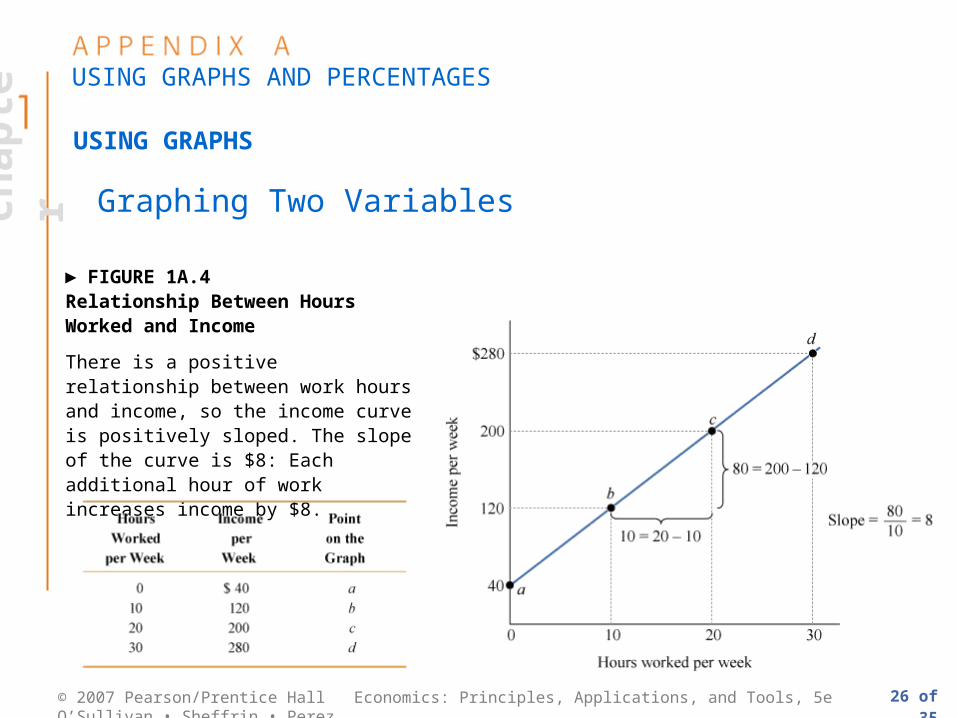
► FIGURE 1A.4Relationship Between Hours Worked and Income
There is a positive relationship between work hours and income, so the income curve is positively sloped. The slope of the curve is $8: Each additional hour of work increases income by $8.
27 of 35
ch
ap
ter
© 2007 Pearson/Prentice Hall Economics: Principles, Applications, and Tools, 5e O’Sullivan • Sheffrin • Perez
USING GRAPHS AND PERCENTAGES
USING GRAPHS
Graphing Two Variables
• positive relationshipA relationship in which two variablesmove in the same direction.
• negative relationshipA relationship in which two variablesmove in opposite directions.
28 of 35
ch
ap
ter
© 2007 Pearson/Prentice Hall Economics: Principles, Applications, and Tools, 5e O’Sullivan • Sheffrin • Perez
USING GRAPHS AND PERCENTAGES
USING GRAPHS
Computing the Slope
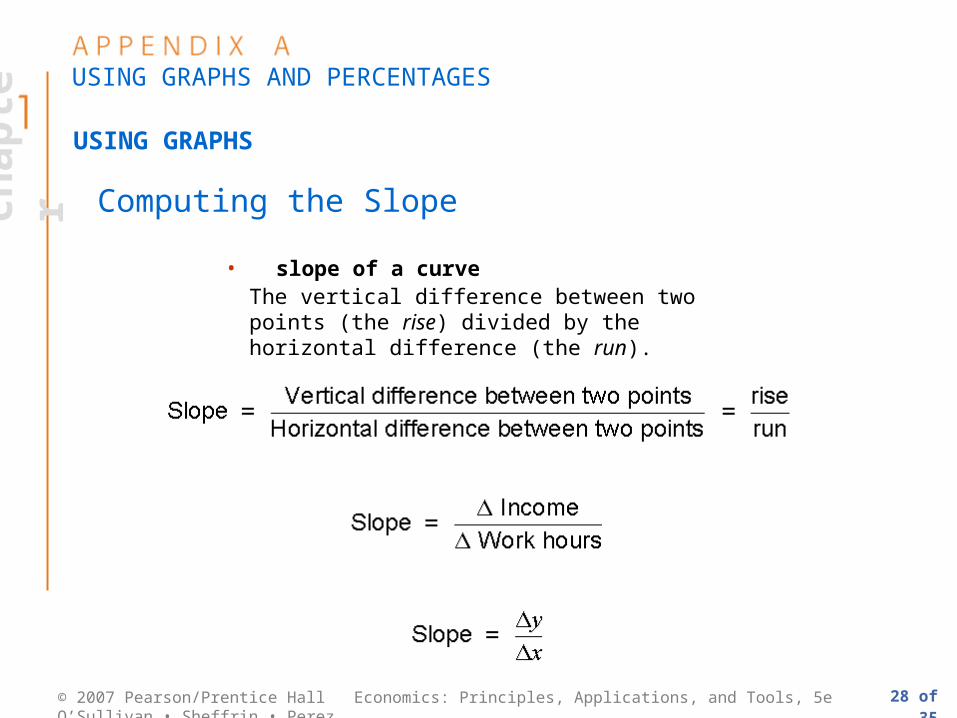
• slope of a curveThe vertical difference between two points (the rise) divided by the horizontal difference (the run).

29 of 35
ch
ap
ter
© 2007 Pearson/Prentice Hall Economics: Principles, Applications, and Tools, 5e O’Sullivan • Sheffrin • Perez
USING GRAPHS AND PERCENTAGES
USING GRAPHS
Moving Along the Curve Versus Shifting the Curve
► FIGURE 1A.5Movement Along a Curve Versus Shifting the Curve
To draw a curve showing the relationship between hours worked and income, we fix the weekly allowance ($40) and the wage ($8 per hour). A change in the hours worked causes movement along the curve, for example, from point b to point c. A change in any other variable shifts the entire curve. For example, a $50 increase in the allowance (to $90) shifts the entire curve upward by $50.
30 of 35
ch
ap
ter
© 2007 Pearson/Prentice Hall Economics: Principles, Applications, and Tools, 5e O’Sullivan • Sheffrin • Perez
USING GRAPHS AND PERCENTAGES
USING GRAPHS
Graphing Negative Relationships
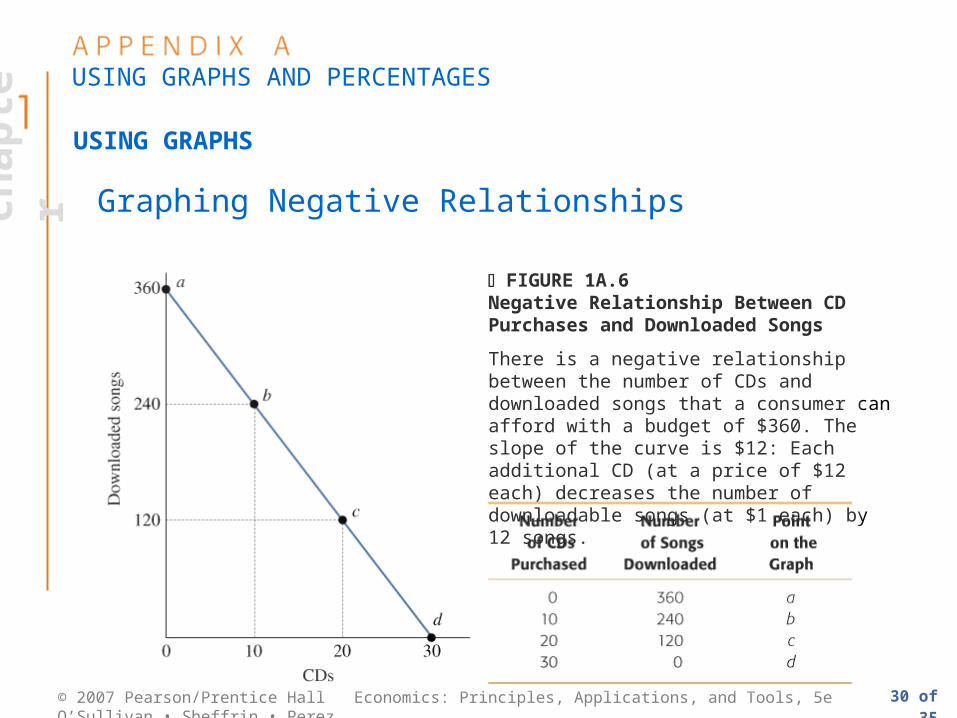
FIGURE 1A.6Negative Relationship Between CD Purchases and Downloaded Songs
There is a negative relationship between the number of CDs and downloaded songs that a consumer can afford with a budget of $360. The slope of the curve is $12: Each additional CD (at a price of $12 each) decreases the number of downloadable songs (at $1 each) by 12 songs.

31 of 35
ch
ap
ter
© 2007 Pearson/Prentice Hall Economics: Principles, Applications, and Tools, 5e O’Sullivan • Sheffrin • Perez
USING GRAPHS AND PERCENTAGES
USING GRAPHS
Graphing Nonlinear Relationships
► FIGURE 1A.7Nonlinear Relationships
(A) Study time There is a positive and nonlinear relationship between study time and the grade on an exam. As study time increases, the exam grade increases at a decreasing rate. For example, the second hour of study increased the grade by 4 points (from 6 points to 10 points), but the ninth hour of study increases the grade by only 1 point (from 24 points to 25 points).

32 of 35
ch
ap
ter
© 2007 Pearson/Prentice Hall Economics: Principles, Applications, and Tools, 5e O’Sullivan • Sheffrin • Perez
USING GRAPHS AND PERCENTAGES
USING GRAPHS
Graphing Nonlinear Relationships
► FIGURE 1A.7 (cont’d.)Nonlinear Relationships
(B) Production cost There is a positive and nonlinear relationship between the quantity of grain produced and total production cost. As the quantity increases, the total cost increases at an increasing rate. For example, to increase production from 1 ton to 2 tons, production cost increases by $5 (from $10 to $15) but to increase the production from 10 to 11 tons, total cost increases by $25 (from $100 to $125).

33 of 35
ch
ap
ter
© 2007 Pearson/Prentice Hall Economics: Principles, Applications, and Tools, 5e O’Sullivan • Sheffrin • Perez
USING GRAPHS AND PERCENTAGES
COMPUTING PERCENTAGE CHANGES AND USING
EQUATIONS
Computing Percentage Changes

34 of 35
ch
ap
ter
© 2007 Pearson/Prentice Hall Economics: Principles, Applications, and Tools, 5e O’Sullivan • Sheffrin • Perez
USING GRAPHS AND PERCENTAGES
COMPUTING PERCENTAGE CHANGES AND USING
EQUATIONS
Using Equations to Compute Missing Values
35 of 35
ch
ap
ter
© 2007 Pearson/Prentice Hall Economics: Principles, Applications, and Tools, 5e O’Sullivan • Sheffrin • Perez
negative relationship
positive relationship
slope of a curve