Introduction - Transport Accident Commission€¦ · Web viewDuring that time a number of...
179
TAC Road Safety Monitor Wave 12 Report February 2013 Prepared for: Transport Accident Commission Victoria PO Box 742 GEELONG VIC 3220 Prepared By: Health Outcomes Team The Social Research Centre Level 1, 262 Victoria St
Transcript of Introduction - Transport Accident Commission€¦ · Web viewDuring that time a number of...
TAC Road Safety MonitorWave 12 Report
February 2013
Prepared for:Transport Accident Commission Victoria PO Box 742GEELONG VIC 3220
Prepared By:Health Outcomes TeamThe Social Research CentreLevel 1, 262 Victoria StNORTH MELBOURNE VIC 3051

Road Safety Monitor 2011Transport Accident Commission Victoria
Contents
Executive Summary.........................................................................................................................11. Introduction.............................................................................................................................8
1.1 Background and Objectives.......................................................................................................8
1.2 Research Methodology..............................................................................................................9
2. Serious Road Accidents and Experiences.........................................................................122.1 Factors Leading to Serious Road Accidents............................................................................12
2.2 Involvement in Accident in Last 5 Years..................................................................................13
3. Speed.....................................................................................................................................143.1 Attitudes Toward Speeding......................................................................................................14
3.2 Speeding Definitions................................................................................................................18
3.3 Factors Influencing Driving Speed...........................................................................................21
3.4 Speeding Behaviour................................................................................................................. 22
4. Drink Drive Impairment........................................................................................................244.1 Drinking of Alcohol................................................................................................................... 24
4.2 Attitudes to Drink Driving..........................................................................................................25
4.3 Most Worrying Consequences of Drink Driving........................................................................27
4.4 Drink Drive Behaviour..............................................................................................................28
4.5 Passengers when Driver Over the Legal Limit in Last 12 Months............................................33
5. Fatigue...................................................................................................................................355.1 Attitudes to Fatigue and Incidence of Falling Asleep While Driving.........................................35
6. Restraint Wearing.................................................................................................................386.1 Attitudes to Restraint Wearing.................................................................................................38
7. Mobile Phones......................................................................................................................417.1 Use of Electronic Devices While Driving..................................................................................41
7.2 Phone use by demographics....................................................................................................41
7.3 Phone usage by driving behaviour...........................................................................................42
7.4 Attitudes to Mobile Phone Use.................................................................................................47
8. Vehicle Purchasing...............................................................................................................508.1 Intent........................................................................................................................................ 50
8.2 Factors Influencing Selection...................................................................................................51
8.3 Importance of Safety Features.................................................................................................53
8.4 Sources of Information.............................................................................................................55
9. Driver Characteristics and Demographics.........................................................................579.1 Licence Type............................................................................................................................ 57
9.2 Driving Profile........................................................................................................................... 58
9.3 Vehicle Ownership................................................................................................................... 61
9.4 Household Vehicles................................................................................................................. 62
9.5 Individual Demographics..........................................................................................................62
10. Perceptions of Driving Competence and Victoria’s Road Safety Performance.............6410.1 Relationship between perceived competence, demographics, attitudes and behaviour..........64
The Social Research Centre

Road Safety Monitor 2011Transport Accident Commission Victoria
10.2 Self-reported Driving Competency by Demographics..............................................................65
10.3 Perceived Competency and Attitudes Towards Vehicles & Safety..........................................67
10.4 Self-reported Driving Competency and Driving Behaviours.....................................................68
10.5 Breaking down level of driving competency.............................................................................69
10.6 Perceptions of Victoria’s Comparative Road Safety Performance...........................................71
11. Perceptions of the ‘Safe System’........................................................................................7411.1 Perceptions of the ‘Safe System’ of road safety.......................................................................74
12. Importance of Vehicle to Driver...........................................................................................7512.1 Relationship between the importance of vehicle to driver, demographics, attitudes and
behaviours............................................................................................................................... 75
13. Analysis of Young Adult Attitudinal questions.................................................................7713.1 Profiling the attitudes and behaviours of younger drivers.........................................................77
13.2 The relationship between risk profiles and demographics........................................................78
Appendix 1 – Questionnaires.......................................................................................................81Metro Questionnaire......................................................................................................................82Regional Questionnaire...............................................................................................................103Online Questionnaire...................................................................................................................124
The Social Research Centre

Road Safety Monitor 2011Transport Accident Commission Victoria
List of Tables
Table 1: Overview of the RSM schedule........................................................................................................10Table 2: Weighting parameters...................................................................................................................... 10Table 3: Road Accidents in Last Five Years and Personal Injury by Demographics......................................13Table 4: Attitudes Towards Speeding (Total agree) – Time Series................................................................14Table 5: Attitudes Towards Speeding (Total agree) by Demographics (2012)...............................................15Table 6: Attitudes Towards Speeding (Total agree) by Driving Behaviour (2012)..........................................16Table 7: Why is it easy to avoid being caught speeding.................................................................................17Table 8: Frequency of Speeding by Demographics (2012)............................................................................21Table 9: Speeding Behaviour by Demographics (2012).................................................................................23Table 10: Speeding Behaviour by Driving Behaviour (2012)..........................................................................23Table 11: Drink Alcohol by Demographics (2011 and 2012)..........................................................................24Table 12: Attitudes to Drink Driving (Total agree) – Time Series....................................................................25Table 13: Attitudes to Drink Driving (Total agree) by Demographics (2012)...................................................26Table 14: Attitudes to Drink Driving (Total agree) by Driving Behaviour (2012).............................................27Table 15: Drivers Who Had Been Tested in the Last 12 Months by Demographics (2011)............................31Table 16: Drivers Who Thought They Had Been Over the Legal Limit in Last 12 Months by Demographics (2012)............................................................................................................................................................. 33Table 17: Drivers Who Thought They Had Been Over the Legal Limit in Last 12 Months by Driving Behaviour (2012)............................................................................................................................................................. 33Table 18: Proportion of Licence Holders Who Have Fallen Asleep in the Last 12 Months While Driving by Demographics (2012)..................................................................................................................................... 35Table 19: Proportion of Licence Holders Who Have Fallen Asleep in the Last 12 Months While Driving by Driving Behaviour (2012)................................................................................................................................ 37Table 20: Attitudes to Restraint Wearing (Total agree) - Time Series............................................................38Table 21: Attitudes to Restraint Wearing (Total agree) by Demographics (2012)..........................................39Table 22: Attitudes to Restraint Wearing (Total agree) by Driving Behaviour (2012).....................................40Table 23: Have a Mobile Phone by Demographics (2012).............................................................................41Table 24: Normal Phone Use in Car by Demographics..................................................................................42Table 25: Normal Phone Use in Car by Driving Behaviour (2012).................................................................43Table 26: Use of Handheld Mobile for Calls in Car by Demographics............................................................43Table 27: Use of Handheld Mobile for Texting in Car by Demographics (2012).............................................44Table 28: Use of GPS device by type of GPS device.....................................................................................46Table 29: Use of GPS or Electronic Navigation in Car by Demographics (2012)...........................................47Table 30: New versus Used Car Purchase by Demographics (2012)............................................................51Table 31: Factors Influencing Vehicle Selection – Rating of Importance by Demographics...........................52Table 32: Budget vs vehicle feature desirability (mean).................................................................................54Table 33: Would Consider Crash Test Results When Purchasing a Car by Demographics (2012)................55Table 34: Make of Car by Age within Gender (2012).....................................................................................61Table 35: Mean Number of Vehicles in Household (2012).............................................................................62Table 36: Total Self-Reported Driving Competency by Gender, Licence type, Age & Region........................65Table 37: Total Self-Reported Driving Competency by Occupation...............................................................66Table 38: Total Self-Reported Driving Competency by Attitude Towards Vehicle..........................................67Table 39: Mobile Phone Usage while Driving.................................................................................................68Table 40: Forms of Transport Used at Least Fortnightly in Addition to Car....................................................69Table 41: Self-Reported Driving Competency by Demographic, Behavioural & Attitudes..............................71Table 42: Perception of Importance of Car, Demographics, Attitudes and Behaviours..................................76Table 43: Relationship between risk profile and driving behaviours and attitudes..........................................79
The Social Research Centre

Road Safety Monitor 2011Transport Accident Commission Victoria
List of Figures
Figure 1: Reported factors that lead to serious road accidents......................................................................12Figure 2: The Extent to Which Drivers Agree with Statements Relating to Speeding.....................................15Figure 3: Definition of Speeding in a 60km/h Zone – Time Series..................................................................18Figure 4: Definition of Speeding in a 100km/h Zone – Time Series................................................................19Figure 5 Frequency of Self-Defined Speeding (2012)....................................................................................20Figure 6: Influences on Speed........................................................................................................................22Figure 7: Incidence of Being Caught Speeding in Last 12 Months – Time Series..........................................23Figure 8: Drink Alcohol – Time Series............................................................................................................24Figure 9: Most Worrying Consequences of Drink Driving (2012)....................................................................28Figure 10: Most Worrying Consequences of Drink Driving – Time Series......................................................28Figure 11: Plan for Getting Home the Last Time Drinking..............................................................................29Figure 12: Method of Getting Home After Drinking.........................................................................................29Figure 13: Drivers Who Had Been Tested in the Last 12 Months – Time Series............................................31Figure 14: Drivers Who Thought They Had Been Over the Legal Limit, or Had Been a Passenger in a Vehicle in Which the Driver was Over the Limit in Last 12 Months – Time Series..........................................32Figure 15: Reasons for being a Passenger when Driver Over the Legal Limit...............................................34Figure 16: Reasons for Driving when Over the Legal Limit............................................................................34Figure 17: Use of Handheld Mobile While Driving – Time Series...................................................................45Figure 18: Use of Electronic Devices While Driving.......................................................................................46Figure 19: Level of Danger in Using Handheld Mobile While Driving.............................................................47Figure 20: Perception of danger of mobile phone use by self-reported mobile phone use while driving........48Figure 21: Level of Danger in Using Hands Free Mobile While Driving..........................................................49Figure 22: Future Car Purchase Intent – Time Series....................................................................................50Figure 23: New Versus Used Car Purchase Intent – Time Series..................................................................50Figure 24: Factors Influencing Vehicle Selection – Rating of Importance.......................................................52Figure 25: Safety Factors Influencing Vehicle Selection – Rating of Importance...........................................53Figure 26: Sources of Information on Vehicle Safety – 2010-2012................................................................55Figure 27: Awareness of ‘How Safe is Your Car’ Website..............................................................................56Figure 28: Incidence of Full Licence...............................................................................................................57Figure 29: Licence Type by Demographics (2012).........................................................................................57Figure 30: Car Ownership (2012)...................................................................................................................58Figure 31: Kilometres Driven per Year by Age and Gender (2012)................................................................59Figure 32: Frequency of Driving for Work Related Purposes (2012)..............................................................60Figure 33: Year of Car Manufacture by Licence Holder Age (2012)...............................................................61Figure 34: Work status................................................................................................................................... 62Figure 35: Occupation.................................................................................................................................... 63Figure 36: Occupation by demographics........................................................................................................63Figure 37: Rating of Driving Competence in Comparison to Rest of Victorian Drivers...................................64Figure 38: Road Fatalities per head 100,000 people by State / Territory, Jan-Dec, 2012..............................72Figure 39: Perceptions of Victoria’s Road toll performance against the rest of Australia................................72Figure 40: Importance of Car to Licence Holder.............................................................................................76
The Social Research Centre

2012 Road Safety Monitor Page 1Transport Accident Commission
Executive Summary
Overview
This report presents the findings from the 12 th wave of the Transport Accident Commission’s (TAC) Victorian
Road Safety Monitor (RSM). The 2012 research is based on a sample of 1,367 licence holders from across
Victoria.
In total, 2,907 licence holders were invited to participate in the survey. These licence holders were randomly
selected from the VicRoads database of Victorians who hold a drivers licence or vehicle registration, within a
number of sampling categories (including age, gender, location and one of five socioeconomic quintiles as
flagged on the sample list by the TAC) to ensure representativeness when compared with the Victorian
population of licence holders. The 2012 iteration of the survey differed from previous years in that contrary
to the 2011 RSM, licence holders over the age of 60 were again included in the sample as they had been in
previous years.
All 2,907 respondents were mailed a paper version of the questionnaire and a return envelope on 28
September 2012. The letter also contained a unique log-in sequence to enable the respondent to complete
the survey online or to call the Social Research Centre on an 1800 number and complete the survey over the
telephone.
In 2010 and 2011 an additional parallel CATI survey was conducted with 250 licence holders. The primary
objective of this survey was to identify where any changes were a result of methodology differences. This
component was discontinued after the previous wave of the research.
Serious Road Accidents and Experiences
Consistent with previous years, Victorian Licence holders in 2012 mentioned alcohol (31%) and speed
(21%), as the two main contributing factors leading to serious road accidents. Overall, these figures were
comparable to 2011, which were 30% and 20% respectively. All other factors were also mentioned at a
comparable rate in 2012 compared to 2011 except for mention of distraction due to using mobile phones as
the top factor causing serious accidents in 2012 (10%), an increase from 2011 (5%).
There has been a significant reduction in the reporting of prior accidents since 2011 (20%). Even when
drivers older than 60 years of age are excluded, the proportion of drivers who report having had an accident
in the last 5 years climbs slightly higher to 15%, but this figure is still below the levels seen in 2011.
Involvement in a road accident showed a steady decline with increasing driver age, from 22% among drivers
aged 18 to 25 years, compared with 16% among drivers aged 26 to 39 years, 12% among drivers aged 40 to
60 years and 6% among drivers aged over 60 years.
The Social Research Centre

2012 Road Safety Monitor Page 2Transport Accident Commission
Speed
As with previous years, most licence holders consider speeding to significantly increase their chances of
crashing, however 2012 responses showed a moderate increase from previous years’ surveys. Overall, 82%
of licence holders aged 18 to 60 years agreed that speeding significantly increases their chance of crashing,
80% agreed that penalties for speeding act as a deterrent to speeding and 75% agreed that enforcing the
speed limit helps lower the road toll.
There appears to be increasing recognition of speed enforcement’s contribution to lowering the road toll. It is
worth noting that three out of five speeding statements recorded their most positive results for the previous
ten years, or since the RSM began. These increases indicate that the TAC’s recent focus on speed
campaigns may be influencing driver perception regarding the risks and consequences of speeding.
Despite these positive signs, responses in 2012 still indicate that male drivers are less likely than female
drivers to attribute their chance of crashing to speeding, or to consider the penalties a deterrent or to
consider that enforcing the speed limit helps lower the road toll.
Similarly, drivers aged 18 to 25 years were less likely than older drivers to believe that they have a high
chance of being caught if they were speeding or to believe that enforcing the speed limit helps lower the road
toll.
As identified in previous monitors, there appeared to be a strong connection between risky driving
behaviours, including alcohol and speeding. Respondents who reported having driven while possibly over
the legal alcohol limit in the previous 12 months were less likely to believe that speeding increased their
chances of crashing, that enforcing the speed limit helped to reduce the road toll or that penalties acted as a
deterrent or that they would have a high chance of being caught speeding.
More metropolitan drivers and young drivers aged 18 to 25 years felt that speed cameras are easier to spot
than both regional and older drivers. Drivers aged 18 to 25 years are also more likely to pick routes to avoid
police and substantially fewer felt there was a lack of police enforcement compared with older drivers.
The overwhelming majority of respondents (90%) believed they should be booked for speeding up to 6km
over the speed limit in a 60km/h zone. Fewer respondents believed they should be booked for driving more
than 105km/h in a 100km/h zone (74%), however this is a significant increase from 2011 (69%). Overall,
these figures indicated a continuation of the positive trend observed since the RSM began in 2001.
As in previous years, respondents were asked to nominate speeds at which they should felt they should be
allowed to travel without being booked for speeding in both 60km/h and 100km/h zones. The proportion of
drivers who then indicated they travel at over this self-defined “speeding limit” at least half the time remained
comparable to 2011 figures and drivers aged 40 years and older were less likely than younger drivers to
report speeding over their self-defined limits at any time.
Responses showed that on average speeding motorists had been caught 1.2 times in the last 12 months.
This is comparable to 2011 figures (1.24 times) and consistent with results since 2006.
Males were significantly more likely to report being caught speeding than females, younger drivers (aged 26
to 39 years) were significantly more likely to report being caught speeding than older drivers, and drivers
who travel long distances were more likely to have been caught speeding than those who drove shorter
distances.
The Social Research Centre

2012 Road Safety Monitor Page 3Transport Accident Commission
Drink Drive Impairment
Continuing the positive trends seen in 2011, over 90% of respondents in 2012 agreed that they:
have no problem with telling a close friend not to drive if they thought they were over the legal blood
alcohol limit; and
would not get into a car driven by a friend if they thought they were over the legal limit.
Although there has been some fluctuation over time, just over half of respondents (51%) thought that
penalties for drink driving were too lenient while 70% of respondents agreed that if they were driving while
over the legal limit then they were very likely to be caught.
There were notable variations in attitudes to drink driving by age and gender. Males were less likely than
females to agree that they would not get in a car driven by a friend who they suspected of being over the
legal limit and to get into a car driven by a friend if they were over the legal limit. Males were also less likely
to agree that the penalties for drink driving were too lenient.
In general, respondents in younger age groups tended to agree less that they were likely to be caught if they
drove over the limit or that the penalties for drink driving were too lenient. These patterns again highlight the
general trend of younger males holding riskier attitudes to driving and associated behaviours.
The majority of respondents indicated that the last time they went out they planned how they would get home
prior to commencing drinking, however, most people got home by using a private vehicle where at least one
person was likely to be over the legal blood alcohol limit. Drivers over the age of 40 were more likely than
younger drivers to drive but limit their alcohol consumption to be under the limit and drivers aged 18 to 39
years were more likely than older drivers to catch a taxi. Younger drivers were more likely to catch public
transport or get a lift.
In 2012, 65% of licence holders indicated that they had been breath tested or they had been in the car when
someone else had been breath tested during the last 12 months. Licence holders recalled having been
tested an average of 2.4 times in the last 12 months. Drug testing was far less commonly reported than
breath testing (4%).
Over recent years, there has been a considerable decline in the proportion of licence holders who knew or
thought that they had driven a car in the last 12 months when they were over the legal blood alcohol limit. In
2012, 5% indicated that they had driven over the legal limit compared to 6% in 2011, 8% in 2010, and 11% in
2009. This is a very positive trend.
A similar, positive reduction has been observed among respondents with regard to whether they had been a
passenger in a car when they knew or suspected that the driver was over the legal limit (5%). This marks a
drop of around 3 percentage points from 2011 levels and a halving of levels reported in 2010 (which
represented a spike up from around 6% in 2008).
Risk-taking behaviours involving drink driving were more likely among males, younger than older licence
holders, and those who report speeding over their self-defined speed limit at 60km/h at least half of the time.
The Social Research Centre

2012 Road Safety Monitor Page 4Transport Accident Commission
Fatigue
The vast majority of licence holders agreed that the only remedy for fatigue while driving a car is stopping
and resting (95%), and that driving while tired can be as dangerous as drink driving (95%). These figures
are virtually identical to those obtained in 2011.
Licence holders who reported that they drank and drove, drove long distances and/or sped at least half the
time were more likely to have fallen asleep while driving in the last 12 months than drivers who didn’t report
these behaviours. Overall these results demonstrate that risky driving behaviour is also associated with the
likelihood of falling asleep while driving.
Restraint Wearing
Consistent with 2011 results, 98% of licence holders agreed that wearing a seatbelt would reduce the
chance of serious injury in a crash. There was a considerable increase in the number of licence holders who
agreed that it was important for others in the car to wear a seatbelt to minimise personal injury (90% in 2012
compared to 82% in 2011). The perceived likelihood of being pulled over by police for not wearing a seatbelt
also increased to 61% in 2012, reflecting a return to levels seen in years previous to 2011.
The difference in attitudes to wearing a seatbelt, by age, is again evident in 2012; licence holders aged 18 to
25 were less likely than older drivers to agree that seatbelts reduce the chance of a serious injury, and think
that they will be pulled over by the police if they are not wearing a seatbelt. Older licence holders (60 to 90
years) were significantly more likely to agree that they only wear a seatbelt because they are required to by
law. Despite this, 100% of licence holders aged 61 years and older report wearing a seatbelt all or most of
the time.
Once again, there was a strong association between risky driving behaviour and negative perceptions of
restraint wearing. Licence holders who reported that they drank and drove within the last 12 months were
less likely to agree that seatbelts reduce the chance of serious injury in a crash or that they would be pulled
over by police and more likely to agree that they only wore seatbelts because they were required to by law.
Mobile Phones
In 2012, 45% of licence holders reported never making or answering a phone call while driving. This is a
considerable improvement on 2011 figures despite an increasing saturation of mobile phones across all
demographic groups. Licence holders aged 26 to 39 years were the least likely age group to report not using
their mobile phone while driving. Significantly more females than males and drivers over 61 years than all
other age groups reported never making or answering a call while driving. Metro drivers were less likely to
hold their phone to their ear and more likely to use a hands-free kit such as Bluetooth than regional drivers.
Licence holders who speed most of the time and who report having driven while possibly over the legal
alcohol limit in the last 12 months reported a higher likelihood of holding their phone to their ear. This again
demonstrates that risky behaviours tend to cluster together. Licence holders who travel longer distances
generally demonstrated riskier behaviours in relation to phone use but were also more likely to use a hands
free kit than drivers who travel short distances. This may be a consequence of those who travel long
distances using their phone for work purposes, or a preparedness to answer or use their phone.
The Social Research Centre

2012 Road Safety Monitor Page 5Transport Accident Commission
In 2012, between 15% and 28% of Victorian licence holders reported making or answering a call on their
handheld mobile phone in the last month while driving. These are similar to 2011 figures with the exception
of the proportion of licence holders who reported answering a call while stopped at the lights, which
decreased by 9 percentage points. Younger licence holders were significantly more likely than older licence
holders to use their handheld mobile to make or answer calls under any circumstance and males were
significantly more likely than females to make or answer calls while actively driving.
Reading and writing text messages was more common at traffic lights than while actively driving, particularly
for metropolitan, female, and younger licence holders. 60% of Victorian licence holders used a handheld
mobile phone while driving in the month before the survey, indicating a significant decrease from 2011
(64%). After increasing significantly between 2009 and 2011 (use of handheld mobiles in that period rising
28 percentage points), it appears that the growth in use of mobile phones and other electronic devices while
driving has stabilised.
In 2012, 51% of licence holders, excluding those aged 61+ years, used a GPS or electronic navigation
device in their car. The majority of these described it as a portable device and use their device while looking
at the screen. Licence holders with factory fitted or portable GPS devices were significantly more likely to
rely on voice prompts than touching the GPS to make adjustments than users of GPS units contained within
mobile phones.
Metropolitan drivers were more likely to use the GPS feature of their mobile phone than regional drivers, who
were more likely to use a portable GPS or electronic navigation device. Consistent with trends since 2004,
there were some improvements regarding the perception of danger associated with using handheld mobile
phones while driving. In 2012, almost 84% considered driving while on a handheld mobile phone as
moderately, highly or extremely dangerous. Despite these figures, many licence holders continue to use their
mobile phone while driving, for example, while 26% reported using their mobile phone to answer calls while
actively driving, 71% of these people reported that to do so was either moderately or extremely dangerous.
In this respect, additional messaging may not curb behaviour among such drivers.
The Social Research Centre

2012 Road Safety Monitor Page 6Transport Accident Commission
Vehicle Purchasing
Due perhaps in part to 2012 being a record year for car sales in Australia, intention to purchase another
vehicle in the future was low. Furthermore, among those Victorian licence holders planning to purchase a car
in the future, more intended to buy a used car than a new car. These proportions have remained relatively
steady since 2010.
Younger people were more likely than older people to consider purchasing used cars, however 18% of 18 to
25 year olds overall had not decided whether they would purchase a new car or a used car. This leaves a
potentially large proportion of the population open to messaging (e.g., How Safe Is Your Car website) around
the importance of safety in their purchasing decisions. It is important to note that 2012 figures also show that
18 to 25 year olds and 46 to 60 year olds were significantly more likely to not consider crash test results prior
to purchasing their next vehicle and females in general were more likely to report that they didn’t know.
The vast majority (75%) of drivers looking for information about the vehicle safety features available on a car
reported that they would access the internet to source it. The internet was used significantly more by young
people (88% of 18 to 25 year olds) than older drivers (45% for 61+ year olds) and males were more likely to
use magazines and newspapers than females to source information.
When compared to previous years, awareness of the ‘How Safe is Your Car’ website remained consistent
with 2011. Males were significantly more likely to be aware of this website than females, as were those aged
18 to 39 years compared with the older groups.
Overall, respondents indicated the condition of the vehicle (roadworthiness, mileage, etc.) as rated as the
most important factor in purchase decisions. This was followed by safety features of the vehicle, fuel
economy, and type of vehicle (e.g., ute, sedan, etc.) and features.
Female purchasers were more likely to rate safety features highly than male purchasers. The safety features
considered most important when buying a car were driver and passenger frontal airbags, ABS brakes, side
curtain airbags, side airbags, and stability control. Least important were Lane departure warnings, rear
parking aids, and adaptive cruise control.
Unsurprisingly respondents with lower purchasing budgets (under $15,000) rated the importance of all
general vehicular features and also vehicle safety features lower than most groups with a larger budget, with
the exception of fuel economy.
Driver Characteristics and Demographics
In 2012, 89% of survey respondents held a full drivers licence. Less than half of the 18 to 25 year olds held a
full licence and the remaining half held either a probationary or learners licence.
In total, 80% of licence holders indicated that they personally own the car that they drive, with a further 11%
indicating that the car they drive belongs to someone else in their household. There were notable differences
in terms of age. Substantially fewer 18 to 25 year olds personally own the car they usually drive compared to
all older drivers and substantially more 18 to 25 year olds usually drive a car owned by someone else in their
household.
The Social Research Centre
2012 Road Safety Monitor Page 7Transport Accident Commission
Of the 69% of licence holders who reported being employed, 74% said that they do some driving as part of
their work, with 38% indicating that they drive daily as part of their work. The majority of work-related driving
was done in a car.
The most common three makes of car driven by licence holders in the 2012 RSM were Holden, Ford, and
Toyota. Males aged 18 to 25 years and 61+ were more likely than their female counterparts to drive a
Holden, whereas younger females showed a preference for Hondas, Mazdas, Suzukis and Volkswagens. In
general, younger people drove older cars.
These figures demonstrate that the age groups that are most likely to be involved in road accidents per
kilometre driven (18 to 25 year olds and 61 years and over) tend to drive the oldest cars. In particular, young
males aged 18 to 25 years drive vehicles that are close to two years older than the next nearest group.
Perceptions of Driving Competence and Victoria’s Road Safety Performance
Victorian licence holders demonstrated an over-estimate in their competence in relation to other drivers, with
99% rating themselves as ‘about average’ drivers or better. Only 17 licensed respondents from 1329
(unweighted) rated themselves as ‘worse’ than average. In all, 12% of respondents considered themselves
‘much better’ than average Victorian drivers.
Licence holders who considered themselves to be ‘better than average’ were significantly more likely to be
males and/or metropolitan drivers, were significantly more likely to report that they sped in 100km/h zones at
least half the time, were significantly less likely to agree that speeding increased their chances of crashing,
were significantly less likely to agree that penalties for speeding acted as a deterrent to speeding, and were
more likely to report that they had driven while over the limit in the previous 12 months. These figures
suggest that the better a licence holder believes their skills to be in comparison to other drivers on the road,
the more likely it is that they engage in risky behaviours across a range of domains.
Perceptions of the Safe System
Overall, Victorian licence holders were not familiar with the ‘Safe System’, which suggests that when
elements of safe vehicles, speeds, roads and drivers combine there is no need for anyone to be killed or
severely injured on roads. Once the system was explained however, 43% of licence holders believed it was
achievable. Metropolitan and younger drivers were more likely to believe this. Overwhelmingly, the greatest
barrier to achievement of the Safe System was the perception that safe ‘road users’ (i.e., other drivers) was
not an achievable goal.
Importance of Vehicle to Driver
In 2012, respondents to the on-line survey were asked to rate how important they believed their car was to
them. Differences in attitudes and behaviours were observed across groups, notably that drivers who place
higher importance on their vehicles were more likely to be male, have a vehicle less than 10 years old and
report risky attitudes towards speeding. Drivers who placed high levels of importance on their cars were
significantly more likely than other drivers to believe that they were ‘better than average’ drivers.
The Social Research Centre
2012 Road Safety Monitor Page 8Transport Accident Commission
1. Introduction
1.1 Background and Objectives
BackgroundThe Transport Accident Commission (TAC) was formed in 1986 by the Victorian Government. The role of
the TAC is to provide personal injury insurance to transport accident victims, as well as promote road safety
in Victoria.
The TAC Road Safety Monitor (RSM) has been conducted annually since the benchmark survey in 2001.
During that time a number of different research agencies have undertaken the fieldwork and reporting for this
research. In 2010, the Social Research Centre was commissioned to undertake the research, implementing
a number of changes to improve the research tool and reporting. This document reports on the findings of
the 2012 research specifically but also highlights the key changes over time (particularly 2011 compared to
2012) and discusses how different groups of Victorian drivers think and behave with respect to road safety
issues.
Research Objectives The overarching objectives of the RSM are to:
Track changes in driver attitudes and self-reported behaviour in regards to road safety issues;
Identify potential areas of concern in the community;
Provide information that assists in the development of programs that address these community
concerns; and
Evaluate the effectiveness of current and future campaigns and programs.
The primary objectives of the RSM are to:
Monitor the change in attitudes and behaviours of drivers regarding a range of road safety issues, including:
Speed;
Restraint Wearing;
Fatigue;
Drink Driving / Impairment;
Mobile Phones; and
Vehicle Purchasing.
Identify groups of Victorian drivers who have different attitudes, behaviours and histories.
The Social Research Centre

2012 Road Safety Monitor Page 9Transport Accident Commission
1.2 Research Methodology
The RSM has evolved over time and changes in methodology may have impacted on the results contained
within this report:
Up until 2007 the RSM was conducted exclusively via telephone interviewing. An internet pilot was
conducted in 2007.
In 2008 and 2009 the research simultaneously used both telephone and online methodologies for data
collection.
Since 2010 the methodology had been altered, due to recognition of the limitations of reaching a
representative sample through either CATI or online surveying – paper copy, online and CATI are all
employed.
Since 2010, TAC arranged access to the VicRoads database of all individuals in Victoria who hold a drivers
licence or vehicle registration. This database was used to randomly select 2,909 individuals to represent the
State, and post them an invitation to participate in the survey, along with a paper copy of the questionnaire.
Two respondents had to be removed from the sample due to insufficient details, bringing the final sample
size to 2,907.
All were also provided with the option of completing the survey online or over the telephone (by using a
dedicated free call 1800 number). After approximately two weeks in field, a reminder letter was sent to
respondents yet to complete the survey, with another following approximately two weeks after that.
Reminder calls targeted to low-response groups were administered to those who had not yet responded but
who had an active and identifiable phone number.
As part of this methodology, an incentive of entry into a prize draw for 6 x $250 was offered to all of those
who completed the survey (two were offered to those responding within the first weeks of the survey), with
an additional $500 prize draw for those who responded online. This additional incentive for online completion
was offered to encourage respondents to choose this option as it is a cheaper to process and a more
complete method of data collection.
Due to the significant change in methodology between 2009 and 2010, a parallel CATI survey was also run
(without any incentive), using the same questions with minor adjustments for telephone interviewing to
enable a comparison of methodologies to be conducted. A CATI parallel survey was also conducted in 2011
and the findings reported separately. While the 2012 questionnaire has undergone significant revision, the
methodology remains the same and so the CATI parallel component was discontinued.
Further detail can be found in the associated technical report.
The Social Research Centre

2012 Road Safety Monitor Page 10Transport Accident Commission
Table 1: Overview of the RSM schedule
Phase / task Date
Finalisation of questionnaire September 14th
Finalisation of sample September 17th
Initial mail out September 28th
1800 number operational September 28th
Online survey launch September 29th
Reminder letter mailing October 18th
Second reminder letter mailing November 5th
Commence telephone response maximisation activity November 7th
Complete telephone response maximisation activity November 26th
Cut off for data processing (all modes) November 26th
WeightingTo correct biases in the sample, the data has been weighted to reflect the general Victorian driver and
registered vehicle owner population with respect to gender and age characteristics and hence the results can
be generalised as representing all Victorian drivers/vehicle owners. Demographic parameters of the
Victorian driver population were obtained in 2012. Prior to 2008, licence count data was used, as driver
figures were not available at the time. In 2008, previous waves of data were re-weighted to ensure time
series information can be generalised with as much accuracy as possible. The weighting parameters used
in 2011 are shown below.
The base “n” figure in charts and tables (number in brackets) represents the unweighted number of people
who responded to the survey.
Table 2: Weighting parameters
The Social Research Centre

2012 Road Safety Monitor Page 11Transport Accident Commission
Statistical SignificanceA number of methods have been used within this report to highlight statistically significant differences (at 95% confidence), as follows:
Shows a significant increase or decrease at 95% confidence level in 2012 when compared to 2011
Different coloured cells within tables indicate the presence of significant column proportions or mean scores between groups (at 95% level of confidence between two groups (e.g. males compared to females). Where more than two columns are compared, differences are indicated by letters next to figures showing which columns they differ from. For example, in the columns on the right, Column ‘a’ varies significantly from Columns ‘b’ and ‘c’, while Column B differs from Column ‘a’, only. Where time series data are shown, statistical significance is calculated against the 2011 data.
Column ‘a’ Column ‘b’ Column ‘c’
XX%b,c XX%a XX%
The results presented in this document show weighted data, unless otherwise specified.
Information is included below each chart to report the sample base, question filtering, question format (prompted or unprompted, single or multiple response) and question text.
Findings where the overall sample size is less than 30 have been marked with a # and should be considered as indicative only.
In some instances, totals may not add up to 100%. This may be due to either rounding and/or multiple responses being permitted.
In some instances, the text (for responses categories that may be netted) may not match the chart due to rounding.
The Social Research Centre
Proportional Weights
Gender Age Actual population Achieved Survey Sample Target Sample Weight
Male 18-25 307303 156 83.09424423 0.532655412
Male 26-39 690271 200 186.6481846 0.933240923
Male 40+ 1649864 352 446.1206111 1.2673881
Female 18-25 283395 125 76.62955892 0.613036471
Female 26-39 641886 188 173.5649572 0.923217858
Female 40+ 1482784 346 400.9424439 1.15879319

2012 Road Safety Monitor Page 12Transport Accident Commission
The Social Research Centre
2012 Road Safety Monitor Page 13Transport Accident Commission
2. Serious Road Accidents and Experiences
2.1 Factors Leading to Serious Road Accidents
In 2012, respondents were asked to choose three factors (from a list of 14) that they considered to be the
main cause of serious road accidents. In 2011, 13 factors were presented as options.
Alcohol was mentioned as the main factor that leads to serious road accidents by 31% of mentions, followed
by speed at 21%. When the average of the top three factors is considered, alcohol (21%), speed (17%) and
a disregard for the road rules/reckless driving (12%) topped the perceived causes of serious road accidents,
closely followed by distraction from mobile phones (10%) and fatigue/tiredness (10%).
In terms of differences by demographics in 2012:
Alcohol was the first main contributing factor leading to serious road accidents mentioned by 40% of 18 to
25 year olds, significantly more than older respondents (26 to 39 years, 29%; 40 to 60 years, 29%). It should
be noted that once an average of all three main factors was calculated, there was little to no difference in the
mention of alcohol as a factor contributing to serious road accidents between age groups, suggesting that
while overall attitudes are similar, alcohol is top of mind for younger groups. Bearing this out, alcohol was
the first main factor mentioned by 18 to 25 year olds by a margin of 26 percentage points over the next most
commonly recorded factor, which was ‘Speed’ at 14%.
More 26 to 39 year olds considered speed to be the primary cause of serious accidents (26%) than the age
groups immediately younger (18 to 25: 14%) and older (40 to 60: 19%).
Figure 1: Reported factors that lead to serious road accidents
Base: All licence holders (n=1329)Q6 What do you think are the three main factors that most often lead to serious road accidents? [3 mentions]Note: % based on average of top 3 reasons identifiedNote: Refer to Concordance with 2011 RSM in the technical report
The Social Research Centre

2012 Road Safety Monitor Page 14Transport Accident Commission
Alcohol was identified as the top factor causing serious road accidents at a comparable rate in 2012 (31%) to
2011 (30%). Similarly, speed was mentioned as the top factor causing serious road accidents by one fifth of
respondents in 2012 (21%) and 2011 (20%). All other factors were mentioned at a comparable rate in 2012
compared to 2011, with the exception of an increase in mention of distraction from using mobile phones as
the top factor causing serious accidents in 2012 (10%) from 2011 (5%), which marks a return to 2010 levels
(8%).
2.2 Involvement in Accident in Last 5 Years
In 2012, 13% of respondents indicated that they had been involved in a road accident as a driver over the
last five years (excluding those in car parks and in driveways) and of these respondents, 12% noted that
someone in the vehicle had sustained a personal injury.
There has been a significant reduction in the reporting of prior accidents since 2011 (20%). In part, this
change may be driven by the fact that the population of drivers surveyed in 2012 includes drivers who were
over 60 years of age and who were therefore less likely to have been involved in an accident in the last five
years (6%). When drivers older than 60 years of age are excluded, the proportion of drivers who report
having had an accident in the last 5 years climbs slightly higher to 15% but still below the levels seen in
2011.
Involvement in a road accident showed a steady decline with increasing driver age, from 22% among drivers
aged 18 to 25 years, compared with 16% among drivers aged 26 to 39 years, 12% among drivers aged 40 to
60 years and 6% among drivers aged over 60 years.
Table 3: Road Accidents in Last Five Years and Personal Injury by Demographics
2012 (1329)
Metro (459)
Regional (870)
Males(683)
Females (646)
18-25yo’s (272)
26-39yo’s
(373)
40-60yo’s(495)
61+yo’s(189)
a b c d e f g hInvolved in road accident – 2012
13% 18% 11% 15% 12% 22% h 16% h 12% h 6%
Personal injury- 2012
12% 12% 12% 9% 17% 18% 11% 10% 9%
2011 (809)
Metro (492)
Regional (317)
Males(457)
Females (352)
18-25yo’s (220)
26-39yo’s
(259)
40-60yo’s(330) 61yo’s+
a b c d e f g hInvolved in road accident – 2011
20% 22% 17% 21% 20% 28% 21% 17% N/A
Personal injury- 2011
11% 9% 15% 12% 10% 10% 8% 14% N/A
Base: All licence holdersQ45 In the past five years, have you been involved in any road accidents as a driver regardless of who was at fault? (This does not
include accidents in car parks and driveways) [single response]Q46 Did anyone in the accident(s) sustain personal injury? [single response]
The Social Research Centre

2012 Road Safety Monitor Page 15Transport Accident Commission
3. Speed
3.1 Attitudes Toward Speeding
All respondents were presented with a series of statements about speeding and asked to indicate the level to
which they agreed or disagreed with each statement. In 2012, the proportion of licence holders who either
strongly agreed or agreed with each statement (total agree) indicates that:
82% of respondents aged 18 to 60 years agreed that speeding significantly increases their chance of
crashing (55% strongly agree).
70% agreed that if they sped the next time they drove they would have a high chance of being caught
(28% strongly agree). This was a significant increase in agreement from 2011 (65%).
80% agreed that penalties for speeding act as a deterrent to speeding (48% strongly agree).
75% agreed that enforcing the speed limit helps lower the road toll (41% strongly agree).
Only 21% agreed that it was ‘easy to avoid being caught’ speeding, a significant drop from 2011
(25%).
Overall, these figures indicate a moderate positive increase from previous surveys in the proportion of
respondents who agree that speed contributes to their risk of having an accident and being caught and/or
penalised. Importantly, there appears to be increasing recognition of speed enforcement’s contribution to
lowering the road toll. The biggest increases were in respondents’ perceptions of being caught if they sped
the next time they drove, and that enforcing the speed limit helps lower the road toll. It is worth noting that
three out of five speeding statements recorded their most positive results for the previous ten years, or since
the RSM began. These increases indicate that the TAC’s recent focus on speed campaigns may be
influencing driver perception regarding the risks and consequences of speeding.
Table 4: Attitudes Towards Speeding (Total agree) – Time Series
2001(511)
2002(499)
2003(509)
2004(510)
2005(500)
2006(499)
2007(499)
2008(500)
2009(500)
2010(702)
2011(809)
2012(1140)
Speeding increases chances of crashing
86% 86% 85% 87% 87% 87% 88% 85% 88% 81% 83% 82%
If I sped - high chance of being caught
38% 39% 41% 33% 39% 44% 39% 46% 42% 60% 65% 70%
Penalties act as a deterrent
70% 70% 71% 69% 73% 64% 69% 74% 77% 74% 79% 80%
Enforcing the speed limit lowers the road toll
79% 71% 71% 75% 76% 75% 74% 78% 74% 66% 73% 75%
It’s easy to avoid being caught
26% 22% 29% 34% 30% 29% 30% 31% 33% 27% 25% 21%
Base: All licence holders aged 18-60Q14: On a scale of 1 to 5, where 1 is “Strongly disagree” and 5 is “Strongly agree”, to what extent do you agree or disagree with the
following statements? [single response]
The Social Research Centre

2012 Road Safety Monitor Page 16Transport Accident Commission
Figure 2: The Extent to Which Drivers Agree with Statements Relating to Speeding
Base: All licence holders (n=1329)Q13: On a scale of 1 to 5, where 1 is “Strongly disagree” and 5 is “Strongly agree”, to what extent do you agree or disagree with the
following statements? [single response]
In 2012, there were significant differences in attitudes to speeding by the key demographic groups:
Males were less likely to attribute their chance of crashing to speeding (77%) compared to females
(90%); to consider the penalties a deterrent (78% for males and 83% for females) and to consider that
enforcing the speed limit helps lower the road toll (72% for males and 82% for females).
Younger drivers (18 to 25 years) were less likely to believe that they have a high chance of being
caught if they were speeding (61%) compared to older drivers; 66% for those aged 26 to 39 years;
74% for those aged 40 to 60 years, and 71% for those aged over 60 years. Younger drivers (68%)
were also less likely to believe enforcing the speed limit helps lower the road toll compared with older
drivers (26 to 39, 75%; 40 to 60, 77%; 61+, 84%).
Metropolitan drivers (76%) were less likely than regional drivers (83%) to consider penalties for
speeding acted as a deterrent when they were driving.
Table 5: Attitudes Towards Speeding (Total agree) by Demographics (2012)
2012 (1329)
Metro (459)
Regional (870)
Males(683)
Females (646)
18-25yo’s (272)
26-39yo’s (373)
40-60yo’s(495)
61+yo’s(189)
a b c d e f g h
Speeding significantly increases my chances of crashing
83% 82% 84% 77% 90% 82% h 85% h 80% h 92%
If I was to speed the next time I drive, I would have a high chance of being caught
70% 71% 69% 68% 72% 61% g,h 66% g,h 74% 71%
Penalties for speeding act as a deterrent when I’m driving
81% 76% 83% 78% 83% 78% 81% 79% h 85%
Enforcing the speed limit helps lower the road toll
77% 74% 78% 72% 82% 68% f,g,h 75% h 77% h 84%
It’s easy to avoid being caught speeding 22% 23% 21% 23% 20% 21% 23% 20% 24%
Base: All licence holders providing a valid response
The Social Research Centre

2012 Road Safety Monitor Page 17Transport Accident Commission
Table 6: Attitudes Towards Speeding (Total agree) by Driving Behaviour (2012)
2012 (1329)
Speedat least most of the time
(138)
Speed none to half of
the time (1229)
Drink and
drive(68)
Don’t drink &
drive(1242)
Road accident
(192)
No roadaccident(1133)
Short distance
driver(630)
Long distance
driver(688)
a b c d e f g hSpeeding significantly increases my chances of crashing
83% 74% 85% 72% 84% 83% 84% 87% 78%
If I was to speed the next time I drive, I would have a high chance of being caught
70% 65% 71% 47% 71% 74% 69% 73% 67%
Penalties for speeding act as a deterrent when I’m driving
81% 77% 81% 68% 81% 79% 81% 81% 80%
Enforcing the speed limit helps lower the road toll
77% 71% 77% 57% 78% 73% 77% 78% 75%
It’s easy to avoid being caught speeding
22% 22% 22% 32% 21% 22% 22% 23% 20%
Base: All licence holders
Attitudes toward speeding behaviour by driving behaviour indicated that respondents who reported having
driven while possibly over the legal alcohol limit in the previous 12 months, were less likely to believe that
speeding increased their chances of crashing or that enforcing the speed limit helped to reduce the road toll.
Respondents who reported having driven while possibly over the legal alcohol limit were also less likely to
believe that penalties acted as a deterrent or that they would have a high chance of being caught speeding,
as well as more likely to think it’s easy to avoid being caught speeding.
Respondents who travel at or above 60km/h or at or above 100km/h at least most of the time were
significantly less likely to agree that speeding increased their chance of crashing (85% compared with 74%
of non-speeders).
Respondents who either agreed or strongly agreed with the statement, “It’s easy to avoid being caught
speeding” were asked to give an explanation why they felt that way. Table 7 below shows frequencies of
coded responses from respondents. Care should be taken with the age group differences as they are all
relatively small bases. In terms of demographic differences, more metro (38%) than regional (23%)
respondents felt that speed cameras are easy to spot, whereas more females (15%) compared with males
(7%) felt that many people speed but few get caught.
For age groups, more young drivers aged 18 to 25 (43%) felt that speed cameras are easy to spot compared
with 40 to 60 year olds (26%) and 61 to 90 year olds (12%). They are also more likely to pick routes to avoid
police (16% compared with 3% of 61to 90 year olds). By contrast, only 22% of 18 to 25 year old drivers felt
there was a lack of police enforcement compared with 40 to 60 year olds (41%) and 61to 90 year olds (47%).
The Social Research Centre

2012 Road Safety Monitor Page 18Transport Accident Commission
Table 7: Why is it easy to avoid being caught speeding
2012 (254)
Metro (97)
Regional (157)
Males(137)
Females
(117)
18-25yo’s
(52)
26-39yo’s
(81)
40-60yo’s
(87)
61yo’s+(34)
a b c d e f g hDon't speed and you won't get caught 18% 15% 19% 20% 15% 9% 14% 20% 26%
Speed cameras are easy to spot 28% 38% 23% 25% 32% 43% g,h 35% h 26% 12%
Lack of police enforcement 38% 33% 40% 34% 42% 22% 33% 41% 47%
Pick and choose routes to avoid police 10% 12% 10% 11% 10% 16% 11% 12% 3%
Many people speed but few get caught 10% 10% 11% 7% 15% 10% 14% 9% 9%
Base: Agree or strongly agree with Q14e: ‘It’s easy to avoid being caught speeding’
The Social Research Centre

2012 Road Safety Monitor Page 19Transport Accident Commission
3.2 Speeding Definitions
Definition of Speeding
To gain an understanding of how people define speeding, licence holders were asked to indicate how fast
they thought people should be allowed to drive in a 60km/h and 100km/h zone without being booked for
speeding. Prior to 2011, licence holders were asked how many km/h over the defined speed limit they
considered to be speeding (i.e. 0 km/h or more) regardless of what the law states. This methodological
change impacts on the series and should be considered when interpreting the results.
Figure 3 below groups respondents into those who thought that drivers should not be booked for driving at a
speed that was in excess of 65km/h in a 60km/h zone, and those who said that drivers should be booked for
travelling at a speed that was 65km/h or less in a 60km/h zone. As the time series data shows, only 10% of
respondents thought that people should be able to drive in excess of 65km/h in a 60km/h zone without being
booked. This continues the positive trend observed since the RSM began in 2001 when a much greater
proportion (30%) of licence holders believed they should be only booked if travelling at more than 65km/h
over the speed limit.
There was a considerable difference by gender where 96% of females considered that they should be
booked at 66km/h or over in a 60km/h zone compared to 85% of males.
Figure 3: Definition of Speeding in a 60km/h Zone – Time Series
Base: Respondents who could specify a number and not below 60km/hQ10 How fast should people be allowed to drive in a 60km/h zone without being booked for speeding? [single response]
The Social Research Centre

2012 Road Safety Monitor Page 20Transport Accident Commission
In terms of the speed driven in a 100km/h zone,, 26% believed that people should be allowed to drive in
excess of 105km/h without being booked, while a significantly higher proportion (74%) believed drivers
should be booked for travelling at a speed between 101 and 105km/h than in 2011 (69%). These figures
show similar time-series trends to those observed regarding perceptions of speeding in 60km/h zones and
suggest a decreasing community tolerance for speeding, particularly in the past 2 years.
In 2012 there were notable differences by gender and location:
16% of females considered that they should only be booked if they drive at 106km/h or more,
compared to 35% of males. This again shows an improvement from 2011 figures, which were 22%
and 38% respectively.
22% of regional respondents considered that they should only be booked if they exceed the speed
limit by 6km/h or more, compared to 35% of metro respondents.
32% of drivers in the 26 to 39 age range considered that they should only be booked if they exceed
the speed limit by 6km/h or more. This was higher than figures for the 18 to 25 (25%) and 40 to 60
(24%) age-groups.
Figure 4: Definition of Speeding in a 100km/h Zone – Time Series
Base: Respondents who could specify a number and not below 100km/hQ12 How fast should people be allowed to drive in a 100km/h without being booked for speeding? [single response]
The Social Research Centre

2012 Road Safety Monitor Page 21Transport Accident Commission
Frequency of Speeding
Licence holders who identified a speed of 60km/h or greater (or 100km/h or greater) at which they thought
they should be able to drive without being booked for speeding were asked: when they had the opportunity,
how often did they travel at or above their defined “speeding limit”.
Overall, 46% indicated that they never drive above their self-defined “speeding limit” in a 60km/h zone and
39% in a 100km/h zone. 44% of drivers indicated they travel some of the time over their self-defined
“speeding limit” in a 60km/h zone. In all, the proportion of drivers indicated they travel at least half the time
over their self-defined “speeding limit” in both a 60km/h (10%) and 100km/h (14%) remains just below 2011
figures, which were 11% in a 60km/h zone and 16% in a 100km/h zone.
Figure 5 Frequency of Self-Defined Speeding (2012)
Base: Valid licence holders who specified a speed of 60km/h (n=1246) or 100km/h (n=1245) – defined as speedingQ10 When you have the opportunity, how often do you travel at or above that speed in a 60km/h zone? [single response]Q12 When you have the opportunity, how often do you travel at or above that speed in a 100km/h zone? [single response]
There was a general trend indicating that older drivers (aged 40 years and older) were less likely than
younger drivers to report speeding over their self-defined limits at any time. Differences observed across
other demographic groups were minimal.
The Social Research Centre

2012 Road Safety Monitor Page 22Transport Accident Commission
Table 8: Frequency of Speeding by Demographics (2012)
2012 (1246)
Metro (421)
Regional (824)
Males(632)
Females (611)
18-25yo’s (255)
26-39yo’s (350)
40-60yo’s(457)
61+yo’s(183)
a b c d e f g hNever speed above defined speeding level in 60kmph zone
46% 41% 49% 44% 48% 42% 37% 46% 61% e,f,g
2012 (1245)
Metro (422)
Regional (824)
Males(639)
Females (605)
18-25yo’s (257)
26-39yo’s (351)
40-60yo’s(460)
61+yo’s(178)
a b c d e f g hNever speed above defined speeding level in 100kmph zone
39% 42% 38% 37% 42% 38% 32% 38% 55% e,f,g
Base: Respondents who specified a speed above 60kmph (n=1269) or 100kmph (n=1268) – defined as speeding
3.3 Factors Influencing Driving Speed
Respondents were presented with eight factors relating to the speed at which they choose to drive and were
asked to identify how important each of these were in influencing how fast or slow they drive on a scale of 1
(not important at all) to 5 (very important). This was a variation on questions asked in 2011, where
respondents were asked to name the top three factors that influenced their driving speed. The eight factors
were:
Speed limit
The road conditions
The weather conditions
The chances of being caught speeding
The speed of other traffic
The volume of traffic on the road
Whether or not they had passengers in their car, and
If late or in a hurry.
The speed limit (70%), road conditions (66%) and weather conditions (66%) were more likely to be rated as
very important factors that influence driving speed. These were also among the top factors identified in
2011, although changes to questionnaire design mean that direct comparison is not possible. The figure
below shows the relative importance of each factor as judged by respondents. The least important influence
on speeding behaviour reported by respondents was being late or in a hurry.
The Social Research Centre

2012 Road Safety Monitor Page 23Transport Accident Commission
Figure 6: Influences on Speed
Base: Licence holdersQ16.1-8 How important are each of the following factors in influencing the speed that you drive?
Analysis of demographic differences across factors that influence speed revealed that:
Regional drivers were significantly more likely than metro divers to report that the speed limit, road
conditions, weather conditions, traffic volume and presence of passengers influenced the speed they
drove, whereas metro drivers were more likely to report the influence of the speed of other traffic.
Females were more likely than males to consider the speed limit, weather conditions and presence of
passengers to be influential to the speed they drove.
Younger drivers (in 18 to 39 year age groups) tended to be more likely than older drivers (aged 40+
years) to report that being late or in a hurry influenced their speed.
Road conditions and the weather were more important for older drivers (aged 40+ years).
The speed and volume of other traffic was more important for older drivers (aged 61+ years) than for
some younger groups.
3.4 Speeding Behaviour
In the last 12 months, 16% of licence holders indicated that they had been caught speeding. It should be
noted that, for the time-series comparison in Figure 7: Incidence of Being Caught Speeding in Last 12
Months – Time Series below, licence holders over 60 years of age are omitted, hence the incidence is one
percentage point higher than the overall 2012 figure.
On average speeding motorists had been caught 1.2 times in the last 12 months. There were no significant
differences among those who had been caught speeding in the last 12 months by location, however males
(20%) were significantly more likely to report being caught speeding than females (12%), and older drivers
(61+) were significantly less likely to report being caught speeding than 26 to 39 year olds.
The Social Research Centre

2012 Road Safety Monitor Page 24Transport Accident Commission
Figure 7: Incidence of Being Caught Speeding in Last 12 Months – Time Series
Base: All licence holders Q7 Have you been caught speeding in the last 12 months (either by police or a fixed/mobile camera)? [single response]
Table 9: Speeding Behaviour by Demographics (2012)
2012 (1329)
Metro (459)
Regional (870)
Males(683)
Females (646)
18-25yo’s
(272)
26-39yo’s (373)
40-60yo’s(495)
61+yo’s(189)
a b c d e f g hCaught speeding - 2012
16% 17% 16% 20% 12% 17% 18% h 17% 11%
Average number of times caught- 2012
1.20 1.28 1.15 1.21 1.17 1.28 1.23 1.18 1.10
Base: All respondents: Average times based on those who were caught speeding: Q7 Have you been caught speeding in the last 12 months (either by police or a fixed/mobile camera)? [single response]Q8 How many times have you been caught speeding in the last 12 months?
Respondents who travel long distances (more than 300km a week / 15,000km a year) were more likely to
have been caught (20%) than those who drove shorter distances (12%).
Table 10: Speeding Behaviour by Driving Behaviour (2012)
2012 (1329)
Speedat least most of the time
(138)
Speed none to half of the
time (1229)
Drink and
drive(68)
Don’t drink &
drive(1242)
Road accident
(192)
No roadaccident(1133)
Short distance
driver(630)
Long distance
driver(688)
a b c d e f g hCaught speeding - 2012
16% 18% 16% 19% 16% 16% 16% 12% 20%
Base: All licence holdersQ7 Have you been caught speeding in the last 12 months (either by police or a fixed/mobile camera)? [single response]
The Social Research Centre

2012 Road Safety Monitor Page 25Transport Accident Commission
4. Drink Drive Impairment
4.1 Drinking of Alcohol
In order to provide a context to drink driving attitudes and behaviours, it is helpful to understand the
incidence of those who actually drink alcohol. 81% of licence holders aged 18 to 60 years indicated that they
drink alcohol (similar to previous years). With the 61 to 90 cohort included, that number drops to 78%. There
was a higher incidence of alcohol consumption in regional areas (81%) and among males (83%). Similar
demographic patterns were observed in 2011. The older cohort reported a lower prevalence of ever drinking
alcohol (65%)
Figure 8: Drink Alcohol – Time Series
Base: Licence holders aged 18-60Q25 Do you drink alcohol? [single response]
Table 11: Drink Alcohol by Demographics (2011 and 2012)
2012 (1329)
Metro (459)
Regional (870)
Males(683)
Females (646)
18-25yo’s (272)
26-39yo’s (373)
40-60yo’s(495)
61+yo’s(189)
a b c d e f g h
Drink alcohol 79% 74% 82% 83% 75% 84% h 84% h 80% h 65%
Base: All licence holdersQ25 Do you drink alcohol? [single response]
The Social Research Centre

2012 Road Safety Monitor Page 26Transport Accident Commission
4.2 Attitudes to Drink Driving
Similar to 2011 figures, over 90% of respondents in 2012 agreed (strongly or somewhat) that they:
Have no problem with telling a close friend not to drive if they thought they were over the legal blood
alcohol limit (94%)
Would not get into a car driven by a friend if they thought they were over the legal limit (91%).
While there has been some fluctuation over time, over half (51%) of respondents thought that penalties for
drink driving were too lenient (22% disagreed). Similar to 2011 figures, 70% of respondents agreed that if
they were driving while over the legal limit then they were very likely to be caught (13% disagreed and 14%
neither agreed nor disagreed).
Table 12: Attitudes to Drink Driving (Total agree) – Time Series
2001(511)
2002(499)
2003(509)
2004(510)
2005(500)
2006(499)
2007(499)
2008(500)
2009(500)
2010(702)
2011(809)
2012(1140)
No problem telling a friend not to drive if thought they were over the limit
95% 97% 98% 97% 98% 97% 98% 99% 97% 93% 96% 94%
Wouldn’t get into a car driven by a friend they were over the limit
88% 90% 90% 92% 93% 92% 93% 90% 91% 87% 91% 91%
If I was driving and over the legal limit, I am very likely to be caught
- - - - - - - - - 69% 70% 70%
The penalties for drink driving are too lenient 52% 50% 48% 52% 58% 58% 57% 60% 57% 55% 49% 51%
Base: Licence holders aged 18-60Q29 To what extent do you agree or disagree with the following statements, using a scale of 1 to 5, where 1 is “Strongly disagree”
and 5 is “Strongly agree”? [single response]
There were notable variations in attitudes to drink driving by age and gender. Males (93%) were less likely
than females (97%) to agree that they would not get in a car driven by a friend who they suspected of being
over the legal limit and to get into a car driven by a friend if they were over the legal limit (89% for males and
94% for females). Males were also less likely to agree that the penalties for drink driving were too lenient
(48% compared with 61%).
In general, respondents in younger age groups tended to agree less that they were likely to be caught if they
drove over the limit or that the penalties for drink driving were too lenient. These patterns again highlight the
general trend of younger males holding riskier attitudes to driving and associated behaviours.
The Social Research Centre

2012 Road Safety Monitor Page 27Transport Accident Commission
Table 13: Attitudes to Drink Driving (Total agree) by Demographics (2012)
2012 (1329)
Metro (459)
Regional (870)
Males(683)
Females (646)
18-25yo’s (272)
26-39yo’s (373)
40-60yo’s(495)
61+yo’s(189)
a b c d e f g hI have no problem with telling a close friend not to drive if I thought they were over the limit
95% 95% 95% 93% 97% 95% 94% 94% 98%
I would not get into a car driven by a friend if I thought they were over the limit
91% 92% 91% 89% 94% 89% 91% 91% 93%
If I was driving and over the limit, I am very likely to be caught
71% 68% 72% 68% 73% 62% g,h 67% h 73% 74%
The penalties for drink driving are too lenient
54% 50% 56% 48% 61% 44% g,h 49% h 53% h 69%
Base: Licence holdersQ29 To what extent do you agree or disagree with the following statements, using a scale of 1 to 5, where 1 is “Strongly disagree”
and 5 is “Strongly agree”? [single response]
There were also notable variations in attitudes by driving behaviour. Those who indicated that they had
driven a car in the last 12 months when they knew or thought they were over the legal limit were less likely to
agree that they would not get in a car driven by a friend who they suspected of being over the legal limit
(62%), think that they would be very likely to be caught if they were driving over the legal limit (51%) and to
think that the penalties for drink driving were too low (39%) than drivers who haven’t driven over the legal
limit in the last 12 months.
A similar pattern of responses was found among those who speed all or most of the time above their defined
“speeding limit” compared to those who don’t speed, being less likely to get into a car with a friend they
thought was over the legal limit (86%).
The Social Research Centre

2012 Road Safety Monitor Page 28Transport Accident Commission
Table 14: Attitudes to Drink Driving (Total agree) by Driving Behaviour (2012)
2012 (1329)
Speedmost or
all of the time (138)
Speed none to half of
the time (1229)
Drink and drive
(68)
Don’t drink &
drive(1242)
Road accident
(192)
No roadaccident(1133)
Short distance
driver(630)
Long distance
driver(688)
a b c d e f g hI have no problem with telling a close friend not to drive if I thought they were over the legal blood alcohol limit
95% 92% 95% 97% 95% 95% 94% 95% 96%
I would not get into a car driven by a friend if I thought they were over the legal blood alcohol limit
91% 86% 92% 62% 92% 93% 93% 91% 93%
If I was driving and over the legal limit, I am very likely to be caught
71% 67% 71% 51% 71% 72% 63% 72% 74%
The penalties for drink driving are too lenient
54% 53% 54% 39% 54% 55% 53% 54% 55%
Base: Licence holdersQ29 To what extent do you agree or disagree with the following statements, using a scale of 1 to 5, where 1 is “Strongly disagree”
and 5 is “Strongly agree”? [single response]
4.3 Most Worrying Consequences of Drink Driving
In the 2011 iteration of the RSM licence holders were asked to select the top three things that would worry
them the most about driving over the legal blood alcohol limit from a provided list. This was modified in 2012
to ask licence holders who drink alcohol to identify the single consequence that would worry them the most,
reverting to the methodology undertaken in 2010.
In 2012, 58% identified that the most worrying consequence of drink driving was hurting or killing someone
else, followed by getting stopped by the police (14%), being fined or losing their licence (12%), and having a
crash (11%). Respondents were least concerned about hurting or killing themselves (3%), or going to jail
(1%).
The Social Research Centre

2012 Road Safety Monitor Page 29Transport Accident Commission
Figure 9: Most Worrying Consequences of Drink Driving (2012)
Base: Licence holders who drink alcohol (n=1052)Q26 Now if for some reason you were to drive while over the legal blood alcohol limit, what three things would worry you the most?Note: % based on average of top 3 reasons identified
Figure 10: Most Worrying Consequences of Drink Driving – Time Series
Base: Licence holders who drink alcohol Q26 If for some reason you were to drive while over the legal blood alcohol limit, what three things would worry you the most? [top
mention]
4.4 Drink Drive Behaviour
Planning on getting home after drinking
Similar to 2011, the proportion of respondents who indicated that the last time they went out they planned
how they would get home before they started drinking was 94%. Those who planned how they would get
home after they started drinking were more likely to belong to younger age groups.
The Social Research Centre

2012 Road Safety Monitor Page 30Transport Accident Commission
Figure 11: Plan for Getting Home the Last Time Drinking
Base: Licence holders who drink alcoholQ27 Please think about the last time you went out (not at home) and drank alcohol. Did you decide how you would get home…?
[single response]
Respondents who drink alcohol were asked to recall the last time they went out drinking and how they got
home on that occasion. Most commonly someone else drove them home (32%), they drove themselves but
limited their alcohol consumption to be under the limit (26%), they got a taxi (18%), they got a lift (9%),
walked (6%) or used public transport (3%). When all forms of transport are taken into account, 71% of
people got home after drinking by using a private vehicle in which at least one person was likely to have
been over the legal blood alcohol limit.
Figure 12: Method of Getting Home After Drinking
Base: Respondents who drink alcohol and do not always drink at homeQ28: Which one of the following best describes your journey home after drinking on that occasion? [single response]
There were notable variations by age:
The Social Research Centre

2012 Road Safety Monitor Page 31Transport Accident Commission
Driving but limiting alcohol consumption to be under the limit was significantly more common for those
older age groups: 61+ years (38%), 40 to 60 years (30%), than for younger drivers: 26 to 39 years
(22%) 18 to 25 years (7%).
Catching a taxi was often the choice of 18 to 25 years olds (28%) and 26 to 39 year olds (26%)
compared to 40 to 60 year olds (14%) and 61+ year olds (7%).
Public transport was used by only a few (3%), but was more likely to be used by younger drivers (7%
of 18 to 25 year olds) than older drivers (3% of 40 to 60 year olds).
Younger drivers were also more likely to report getting a lift (18% of 18 to 25 year olds; 12% of 26 to
39 year olds) than older drivers (6% of 40 to 60 year olds; 5% of 61+ year olds).
Older drivers were significantly more likely to report that someone else was driving them home (37%
of both 40 to 60 year olds and those 60 years and over) than 18 to 25 year olds, and 26 to 39 year
olds (both 25%).
Drivers Who Had Been Tested in the Last 12 Months
In 2012, 65% of licence holders indicated that, in the last 12 months, they had been breath tested or they
had been in the car when someone else had been breath tested. The proportion who indicated being breath
tested has remained within a consistent range of 65 +/-5% since 2001.
Excluding outliers who reported being breath tested 10 or more times (2.3% - maximum of 37), licence
holders recalled having been tested an average of 2.4 times in the last 12 months. Unlike figures from
previous monitors, there were no significant differences between rates of breath testing at least once among
regional (66%) or metropolitan groups (63%), or between males (67%) and females (64%). There were,
however, significant differences between in age groups, with only 55% of the 60 to 90 year old cohort
reporting being in a car where the driver was breath tested, which is significantly lower than 18 to 25s (70%),
26 to 39s (68%) and 40 to 60s (66%). There were more differences in the demographic groups in relation to
frequency of breath testing. Regional respondents reported a higher average number of breath tests (2.6
times) than metro respondents (2.2 times). Similarly, males (2.6 times) reported a higher average number of
breath tests than females (2.2 times). Younger drivers (18 to 25 years) reported more frequent testing (2.7)
than respondents in the 40 to 60 (2.4) and 61+ (2.2) age groups, or having been in a car with someone who
was breath tested.
Drug testing was far less commonly reported than breath testing with 4% of respondents indicating that
either they, or the driver a car they were a passenger in, had been drug tested in the last 12 months. Close
to half (47%) noted that the drug test had been a saliva test, 17% cited a breath test and 30% some other
form of testing or were unsure.
The Social Research Centre

2012 Road Safety Monitor Page 32Transport Accident Commission
Figure 13: Drivers Who Had Been Tested in the Last 12 Months – Time Series
Base: Licence holdersQ17 Over the past 12 months have you been breath tested or been in a car when the driver was breath tested?Q19 Over the past 12 months have you been drug tested or been in a car when the driver was drug tested?
Table 15: Drivers Who Had Been Tested in the Last 12 Months by Demographics (2011)
2012 (1329)
Metro (459)
Regional (870)
Males(683)
Females (646)
18-25yo’s (272)
26-39yo’s (373)
40-60yo’s(495)
61+yo’s(189)
a b c d e f g hBreath tested in last 12 months 65% 63% 66% 67% 64% 70% 68% 66% 55%
Average number of times breath tested
2.4 2.2 2.6 2.6 2.2 2.7 2.5 2.4 2.2
Been drug tested in last 12 months 4% 5% 4% 5% 4% 8% 6% 4% 2%
Base: Licence holders: Average number of times based on those who had been breath testedQ17 Over the past 12 months have you been breath tested or been in a car when the driver was breath tested?Q18 Approximately on how many occasions in the past 12 months have you been breath tested or been in a car when the driver
was breath tested?Q19 Over the past 12 months have you been drug tested or been in a car when the driver was drug tested?
Drivers Who Thought They Had Been Over the Legal Limit in Last 12 Months
Over recent years, there has been a considerable decline in the proportion of licence holders who knew or
thought that they had driven a car in the last 12 months when they were over the legal blood alcohol limit. In
2012, 5% indicated that they had driven over the legal limit compared to 6% in 2011, 8% in 2010, and 11% in
2009.
A similar, positive reduction has been observed among respondents with regard to whether they had been a
passenger in a car when they knew or suspected that the driver was over the legal limit (5%). This marks a
drop of around 3% from 2011 levels and a halving of levels reported in 2010 (which represented a spike up
from around 6% in 2008).
The Social Research Centre

2012 Road Safety Monitor Page 33Transport Accident Commission
Figure 14: Drivers Who Thought They Had Been Over the Legal Limit, or Had Been a Passenger in a Vehicle in Which the Driver was Over the Limit in Last 12 Months – Time Series
Base: Licence holders
Q21 Have you been in a car over the last 12 months when you knew or thought the driver was over the legal blood alcohol limit?Q23 During the last 12 months, have you driven a car when you knew or thought you were over the legal blood alcohol limit?
As Table 16 shows, risk-taking behaviours involving drink driving were more likely among males compared
with females, and younger licence holders compared to older licence holders, as well as those who report
speeding over their self-defined speed limit at least half of the time (see Table 17):
18 to 25 years olds (10%) and 26 to 36 year old (7%) were significantly more likely to have driven over
the legal limit (10%) than 40 to 60 (3%) or 61+ (2%) cohorts. They were also more likely to have been
a passenger when they suspected that the driver was over the legal limit (13%) than all other age
groups. In part, this result may be due to the stricter restrictions (.00 BAC) placed on younger drivers.
Males (6%) were almost twice as likely as females (3%) to report having driven over the legal blood
alcohol limit.
Those who reported speeding at least half the time above their defined “speeding limit” at 60km/h or
100km/h were more likely to have been a drink driver (8%) compared to those who don’t speed (4%)
36% of those who reported having driven over the legal blood alcohol limit in the last 12 months also
indicated that they had also been a passenger in a car when they suspected that the driver was over
the legal limit compared with 3% of those who have driven over the limit.
Unlike figures from 2011, there were no significant differences reported in drink-driving behaviour
between metro and regional respondents.
The Social Research Centre

2012 Road Safety Monitor Page 34Transport Accident Commission
Table 16: Drivers Who Thought They Had Been Over the Legal Limit in Last 12 Months by Demographics (2012)
2012 (1329)
Metro (459)
Regional (870)
Males(683)
Females (646)
18-25yo’s (272)
26-39yo’s (373)
40-60yo’s(495)
61+yo’s(189)
a b c d e f g hBeen in car when driver over the limit
5% 5% 4% 5% 4% 13% f,g,h 5% 3% 2%
Driven when over the limit 5% 5% 5% 6% 3% 10% 7% 3% 2%
Base: All licence holdersQ21 Have you been in a car over the last 12 months when you knew or thought the driver was over the legal blood alcohol limit?Q23 During the last 12 months, have you driven a car when you knew or thought you were over the legal blood alcohol limit?
Table 17: Drivers Who Thought They Had Been Over the Legal Limit in Last 12 Months by Driving Behaviour (2012)
2012
(1329)
Speedmost or all
of the time(133)
Speed half the time or
less(1196)
Drink and
drive(68)
Don’t drink and
drive(1242)
Road accident
(192)
No roadaccident(1133)
Short distance
(637)
Long distance
(692)
a b c d e f g hBeen in car when driver over the limit
5% 8% 4% 36% 3% 5% 4% 4% 5%
Driven when over the limit 5% 8% 4% 100% - 6% 4% 4% 5%
Base: All licence holdersQ21 Have you been in a car over the last 12 months when you knew or thought the driver was over the legal blood alcohol limit?Q23 During the last 12 months, have you driven a car when you knew or thought you were over the legal blood alcohol limit?
4.5 Passengers when Driver Over the Legal Limit in Last 12 Months
The main reasons the 8% of licence holders got into a car when they thought that the driver was over the
legal limit were: that they thought the driver was capable (30%); they just wanted to get home (22%); there
were no other transport alternatives (14%); and it was a short trip (11%), and they were drunk / not thinking
(11% and 8%, respectively). Intriguingly, when ‘don’t know’ is included as a valid response, it ranks as the 3 rd
highest ‘reason’ for behaviour.
The Social Research Centre

2012 Road Safety Monitor Page 35Transport Accident Commission
Figure 15: Reasons for being a Passenger when Driver Over the Legal Limit
Base: Licence holders who had been a passenger when they thought the driver was over the legal limitQ22 What was the main reason you got into a car when you knew or thought the driver was over the over the legal blood alcohol
limit? (multiple response)
For those who suspected that they had driven when over the legal blood alcohol content (BAC) limit (5%),
the primary reasons provided were just wanting to get home (21%), that no other transport options were
available (20%), that it was a short trip (16%), or that they either thought they were capable, or were unsure
of their BAC, or whether they were on the limit (12%, 11% and 11%, respectively).
Figure 16: Reasons for Driving when Over the Legal Limit
Base: Licence holders who had driven when they thought they were over the legal limitQ24 What was the main reason for you driving a car when you knew or thought you were over the legal limit? (Multiple response)
The Social Research Centre

2012 Road Safety Monitor Page 36Transport Accident Commission
5. Fatigue
5.1 Attitudes to Fatigue and Incidence of Falling Asleep While Driving
The vast majority of licence holders agreed that the only remedy for fatigue while driving a car is stopping
and resting (95%), and that driving while tired can be as dangerous as drink driving (95%). These figures
are virtually identical to those obtained in 2011.
In 2012, licence holders were asked a new set of questions around what strategies they use to reduce
fatigue while driving. Responses showed that:
40% of licence holders stopped to take a break
21% reported stopping for a power nap or sleep
21% stopped to get a drink/coffee, water or food
21% swapped driving duties with a passenger
11% reported winding the window down, turning down the air conditioning or lowering the
temperature.
In 2012 licence holders were asked whether they had ever fallen asleep while driving in the last 12 months;
3% indicated that they had. Analysis by demographic indicate that males (4%) were twice as likely as
females (2%) to fall asleep in the last 12 months and that young licence holders (18 to 25 year olds) were
significantly more likely to have fallen asleep (8%) than all other age groups. The over 60 age group were
significantly less likely to have fallen asleep than all other age groups.
Table 18: Proportion of Licence Holders Who Have Fallen Asleep in the Last 12 Months While Driving by Demographics (2012)
2012 (1329)
Metro (459)
Regional (870)
Males(683)
Females (646)
18-25yo’s (272)
26-39yo’s (373)
40-60yo’s(495)
61+yo’s(189)
a b c d e f g hIn the last 12 months have you fallen asleep while driving
3% 3% 3% 4% 2% 8% 3% h 3% h 0%
Base: All licence holdersQ32 In the last 12 months have you ever fallen asleep while driving?
The Social Research Centre

2012 Road Safety Monitor Page 37Transport Accident Commission
Licence holders who reported falling asleep while driving were asked to describe the circumstances
surrounding the event. A sample of their responses is included below:
While I was driving in the early hours I nodded off for a millisecond and it frightened me, so I pulled
over and had a sleep about a kilometre up the road.
When I was driving home I realised that I had fallen asleep for about 5 seconds so I pulled over and
had a nap.
Veered off road, woke up before crashing. Travelling from work in Melbourne to home in Ballarat.
Nodded off while driving after a long day at work (during daylight hours).
Long distance, late at night.
Just doze off, not asleep. I got a fright. I work long hours so I had a rest.
It was 6 o'clock in the morning and there was no one on road. I stopped the car.
It scared me. I then pulled in to a motel.
I woke up in the opposite lane, nothing bad happened.
I was really tired and as I was changing lanes, I checked my blind spot for cars but my mind didn't
register that there was a car, so I continued to change lanes.
I was on a 3 hour trip. I was yawning so I opened the window and put on the air conditioner. I had a
short sleep and drove onto the rumble strip, which woke me up.
I was ill on an interstate trip (in Tasmania) and although I knew I was tired I kept driving, hoping to find
a rest stop but I fell asleep before I found one.
I was driving to my family's house and they live very far away. It was late at night and no one was on
the road. I fell asleep for about 2 seconds
I was driving home after night shift and had a micro sleep at the wheel. I woke when my tyres vibrated
on the side of the road.
I realised that I was nodding off and very tired. I felt that I was falling asleep a few times in a minute.
I micro-slept at a red light after not getting enough sleep at night. I woke up and continued driving.
I had worked too many hours and had not had enough sleep.
I wrote my car off; luckily I came out with no injuries.
I drove into the other lane (it was a dual lane freeway) and woke up. I was driving home from a
breakdown at 0330 hours after working for 10 hours the day before.
I decided to come home the same day when I should have stayed over.
I closed my eyes for a few brief seconds and realised how dangerous it was, so I stopped by the side
of the road. I was lucky that there were no other cars around at the time.
I believe I have experienced what you call microscopic sleep, I need to be careful because I have
been on antidepressant type medication.
I am always tired; I work long hours and have to drive a lot. It would have been a country road that I
was driving on; I was really quickly falling sleep. After that I stopped.
During a night shift I hit a rumble strip and woke up.
Driving home in morning after a night duty, I drove into the paddock on side of road.
The Social Research Centre

2012 Road Safety Monitor Page 38Transport Accident Commission
Licence holders who reported that they drank and drove were significantly more likely (8%) to have fallen
asleep while driving in the last 12 months than those who reported that they didn’t drink and drive (3%).
Similarly, licence holders who reported driving long distances were twice as likely (4%) to have fallen asleep
while driving than those who reported driving short distances (2%), although this was not a statistically
significant difference. A similar trend was observed for those who reported speeding at least half of the time
(6%), compared to those who reported speeding less than half the time (3%). Overall these results
demonstrate that risky driving behaviour is also associated with likelihood of falling asleep while driving.
Table 19: Proportion of Licence Holders Who Have Fallen Asleep in the Last 12 Months While Driving by Driving Behaviour (2012)
2012 (1329)
Speedat least most of the time
(138)
Speed none to half of
the time (1229)
Drink and
drive(68)
Don’t drink &
drive(1242)
Road accident
(192)
No roadaccident(1133)
Short distance
driver(630)
Long distance
driver(688)
a b c d e f g hIn the last 12 months have you fallen asleep while driving
3% 6% 3% 8% 3% 4% 3% 2% 4%
Base: All licence holdersQ32 In the last 12 months have you ever fallen asleep while driving?
The Social Research Centre

2012 Road Safety Monitor Page 39Transport Accident Commission
The Social Research Centre

2012 Road Safety Monitor Page 40Transport Accident Commission
6. Restraint Wearing
6.1 Attitudes to Restraint Wearing
All licence holders were asked a series of questions regarding seatbelt use and attitudes towards seatbelt
use. Results indicated that 99% of licence holders reported that they wear a seatbelt either most (3%) or all
of the time (96%). Other results showed that:
Consistent with 2011 results, 98% of licence holders agreed that wearing a seatbelt will reduce the
chance of serious injury in a crash.
There was a negligible increase in the number of licence holders who reported that they only wear a
seatbelt because they are required to do so by law (19% in 2012 compared to 18% in 2011).
There was an increase in the number of licence holders who considered that if they were not wearing
a seatbelt, they were very likely to be pulled over by the police (61% in 2012 compared to 56% in
2011). However this was a return to similar levels seen in years previous to 2011.
There was a considerable increase in the number of licence holders who agreed that it was important
for others in the car to wear a seatbelt to minimise personal injury (90% in 2012 compared to 82% in
2011).
Table 20: Attitudes to Restraint Wearing (Total agree) - Time Series
2001(511)
2002(499)
2003(509)
2004(510)
2005(500)
2006(499)
2007(499)
2008(500)
2009(500)
2010(702)
2011(809)
2012(1140)
Drivers who report wearing their seatbelt all the time
93% 92% 94% 94% 95% 97% 95% 96% 95% 95% 95% 96%
Wearing a seatbelt will significantly reduce my chances of serious injury in the event of a crash
96% 96% 92% 94% 97% 96% 97% 98% 97% 97% 99% 98%
I only wear a seatbelt because I am required to do so by law
13% 14% 15% 16% 16% 20% 17% 17% 16% 21% 18% 22%
If I am not wearing a seatbelt it is very likely that I will be pulled over by the police
57% 60% 57% 57% 61% 60% 59% 61% 60% 65% 56% 61%
If in a crash, it is important that others in the car are wearing a seatbelt to minimise my personal injury
- - - - - - - - - 84% 82% 90%
Base: All licence holdersQ35 On a scale of 1 to 5, where 1 is “Strongly disagree” and 5 is “Strongly agree”, to what extent do you agree or disagree with the
following statements? [single response]
The Social Research Centre

2012 Road Safety Monitor Page 41Transport Accident Commission
There were some notable differences between different demographic groups regarding attitudes to wearing
seatbelts:
Metro licence holders were significantly less likely to agree that they would be pulled over if they were
not wearing a seatbelt and were also less likely to agree that it was important for passengers to be
wearing a seatbelt in order to reduce risk of injury to the driver.
Younger drivers (18 to 25 year olds, 43%; 26 to 39 year olds, 51%) were also less likely than older
licence holders to agree that they would be pulled over if not wearing a seatbelt (40 to 60; 71%; 61+,
35%).
A significantly smaller proportion of young (18 to 25 year old) drivers were likely to agree that it is
important that others are wearing a seatbelt to reduce their risk of injury in a crash (86% compared
with 94% of 60 to 90 year olds).
Older licence holders (60 to 90 years) were significantly more likely to agree that they only wear a
seatbelt because they are required to by law (35%) than younger licence holders. Despite this, 100%
of 61+ year olds report wearing a seatbelt all or most of the time.
Table 21: Attitudes to Restraint Wearing (Total agree) by Demographics (2012)
2012 (1329)
Metro (459)
Regional (870)
Males(683)
Females
(646)
18-25yo’s (272)
26-39yo’s (373)
40-60yo’s(495)
61+yo’s(189)
a b c d e f g hRespondents who wear seatbelt all the time 96% 97% 96% 95% 98% 93% 96% 98% 96%
Seatbelts reduce chances of serious injury in a crash 98% 98% 98% 97% 98% 96% 98% 98% 97%
Only wear a seatbelt because required by law 22% 22% 21% 23% 20% 17% 17% 21% h 35%
e,f,gIf not wearing seatbelt likely I will be pulled over 63% 58% 66% 62% 65% 43% g,h 51%
e,g,h 71% 76%
In a crash, important that others wearing a seatbelt to minimise my personal injury
90% 87% 92% 91% 89% 86% 91% 90% 94%
Base: All licence holdersQ35a-d: On a scale of 1 to 5, where 1 is “Strongly disagree” and 5 is “Strongly agree”, to what extent do you agree or disagree with the
following statements? [single response]
The Social Research Centre

2012 Road Safety Monitor Page 42Transport Accident Commission
There were also some significant differences in attitudes to restraint wearing by driving behaviour. Licence
holders who reported that they drank and drove within the last 12 months were:
less likely to agree that seatbelts reduce the chances of serious injury in a crash (94%) than those
who reported that they don’t drink and drive (98%),
more likely to agree that they only wore seatbelts because they were required to by law (34% versus
21%),
less likely to believe that they would be pulled over if not wearing a seatbelt (46% versus 64%).
Table 22: Attitudes to Restraint Wearing (Total agree) by Driving Behaviour (2012)
2012 (1329)
Speedat least most of the time
(138)
Speed none to half of
the time (1229)
Drink and
drive(68)
Don’t drink &
drive(1242)
Road accident
(192)
No roadaccident(1133)
Short distance
driver(630)
Long distance
driver(688)
a b c d e f g hRespondents who wear seatbelt all of the time 96% 96% 96% 83% 97% 97% 96% 97% 96%
Seatbelts reduce chances of serious injury in a crash
98% 97% 98% 94% 98% 99% 98% 97% 98%
Only wear a seatbelt because required by law 22% 26% 21% 34% 21% 17% 22% 24% 19%
If not wearing seatbelt likely I will be pulled over
63% 58% 64% 46% 64% 58% 64% 65% 61%
In a crash, important that others wearing a seatbelt to minimise my personal injury
90% 89% 90% 89% 90% 89% 91% 89% 92%
Base: All licence holdersQ35a-d: On a scale of 1 to 5, where 1 is “Strongly disagree” and 5 is “Strongly agree”, to what extent do you agree or disagree with the
following statements? [single response]
The Social Research Centre

2012 Road Safety Monitor Page 43Transport Accident Commission
The Social Research Centre

2012 Road Safety Monitor Page 44Transport Accident Commission
7. Mobile Phones
7.1 Use of Electronic Devices While Driving
Similar to 2012 figures, virtually all licence holders reported having a mobile phone (95%). There were very
few differences among demographics, with the exception of a slightly higher penetration for younger age
groups.
Table 23: Have a Mobile Phone by Demographics (2012)
2012 (1299)
Metro (445)
Regional (854)
Males(666)
Females (633)
18-25yo’s (268)
26-39yo’s (364)
40-60yo’s(486)
61+yo’s (181)
a b c d e f g h
Have a mobile phone 95% 96% 95% 95% 95% 99% 99% 95% h 86%
Base: All licence holders providing a yes or no responseQ78 Do you have a mobile phone?
7.2 Phone use by demographics
In 2012, 45% of licence holders reported never making or answering a phone call while driving. This is a
considerable improvement to 2011 figures (36%), despite an increasing saturation of mobile phones across
all demographic groups. Methodological changes between 2011 and 2012 mean that direct comparison
between years is not practical.
Licence holders were asked how they normally use their phone to make or answer calls while driving:
45% reported never making or answering a call while driving,
significantly more females (53%) reported never making or answering a call than males (38%),
significantly more older licence holders (61+ years, 79%) reported never making or answering a call
than all younger drivers (18 to 25 year olds, 38%; 26 to 39 year olds, 28%; 40 to 60 year olds, 46%),
licence holders aged 26 to 39 years were least likely to report not using their mobile phone while
driving (28%), significantly less than all other age groups.
Regional licence holders were less likely than metro licence holders to only use a hands free kit like
Bluetooth (26% compared with 33%) and more likely to report holding the phone to their ear while driving
(10% versus 5%).
Compared with males, females were less likely to use a Bluetooth kit (22% versus 34%) and less likely to
report holding the phone to their ear (6% versus 11%).
The Social Research Centre
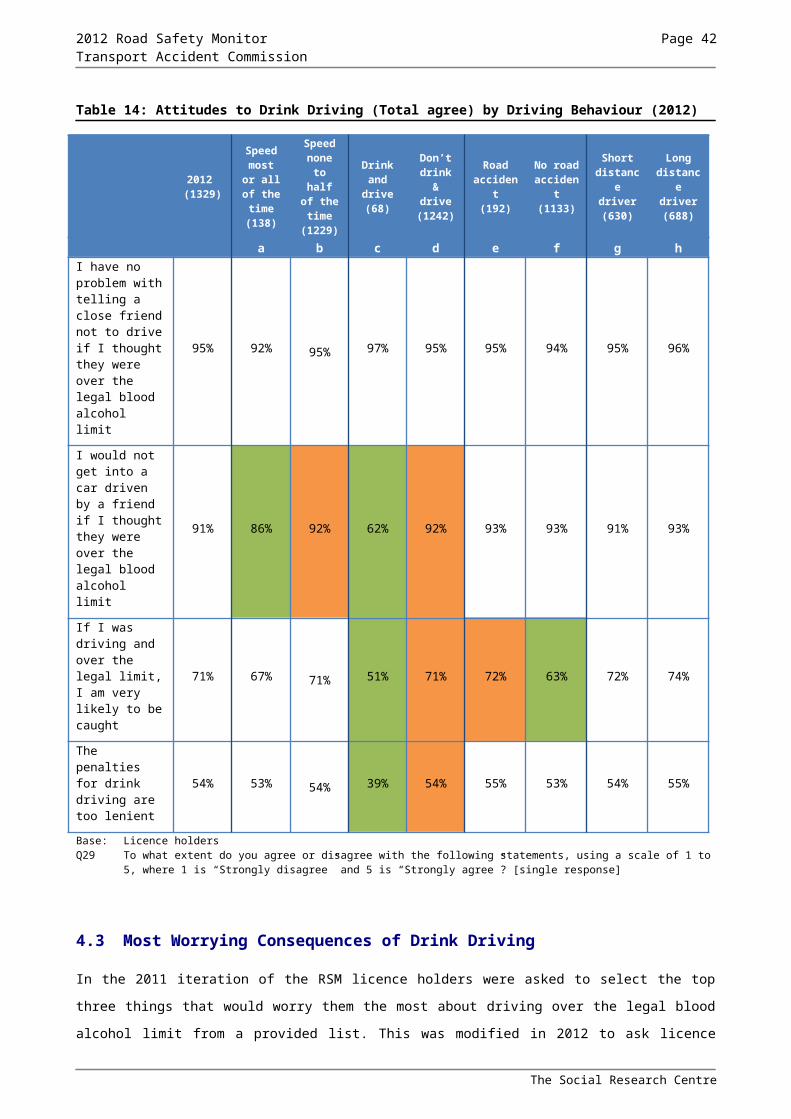
2012 Road Safety Monitor Page 45Transport Accident Commission
Table 24: Normal Phone Use in Car by Demographics
2012 (1329)
Metro (459)
Regional (870)
Males(683)
Females
(646)
18-25yo’s (272)
26-39yo’s (373)
40-60yo’s(495)
61+yo’s
(189)a b c d e f g h
Hold phone to ear 8% 5% 10% 11% 6% 11% 7% 9% 7%Hold phone away from
ear 2% 3% 1% 2% 2% 5% g 3% 1% 0%
Put phone in lap or on console 16% 18% 16% 15% 17% 27% g,h 27% g,h 13% h 1%
Only use hands free kit such as Bluetooth 28% 33% 26% 34% 22% 20% 35% e,h 32% e,h 13%
I never make or answer call while driving 45% 42% 47% 38% 53% 38% f 28% 46% f 79%
e,f,gBase: All licence holdersQ37 When you use your phone to make or answer calls while driving, do you normally …
7.3 Phone usage by driving behaviour
In terms of difference in phone use by driving behaviour, a higher proportion of those who reported that they
speed less than half the time (46%), don’t drink and drive (47%), haven’t been involved in a road accident
(47%) and drive short distances (59%) reported never making or answering a call while driving. This again
demonstrates that risky behaviours tend to occur together.
Twice the proportion of licence holders who speed at least most of the time reported holding their phone to
their ear (16%) than people who speed half the time or less (8%).
Licence holders who report having driven while possibly over the legal alcohol limit in the last 12 months
demonstrated consistently riskier behaviour, reporting a higher likelihood of usually holding their mobile
phone to their ear while driving (30%), placing their phone in their lap or on the console (26%) and a trend
toward using Bluetooth less (19%).
Licence holders who travel longer distances generally demonstrated riskier behaviours in relation to phone
use but were also more likely to use a hands free kit than drivers who travel short distances. This may be a
consequence of those who travel long distances using their phone for work purposes. Licence holders who
used their car for work on a daily basis drove significantly more kms per week (757km) and were significantly
more likely to use a Bluetooth kit than other drivers (47%) and less likely to report never making or
answering calls while driving (26%).
The Social Research Centre

2012 Road Safety Monitor Page 46Transport Accident Commission
Table 25: Normal Phone Use in Car by Driving Behaviour (2012)
2012 (1329)
Speedat least most of the time
(138)
Speed none to half of
the time(1229)
Drink and
drive(68)
Don’t drink &
drive(1242)
Road accident
(192)
No roadaccident(1133)
Short distance
driver(630)
Long distance
driver(688)
a b c d e f g hHold phone to ear 8% 16% 8% 30% 7% 7% 9% 5% 11%
Hold phone away from ear 2% 2% 2% 4% 2% 2% 2% 2% 2%
Put phone in lap or on console 16% 17% 16% 26% 16% 21% 16% 15% 18%
Only use hands free kit such as Bluetooth 28% 29% 28% 19% 29% 34% 27% 19% 36%
I never make or answer call while driving 45% 36% 46% 22% 46% 36% 47% 59% 33%
Base: All licence holdersQ37 When you use your phone to make or answer calls while driving, do you normally …
In 2012, between 15% and 28% of Victorian licence holders reported making or answering a call on their
handheld mobile phone in the last month while driving. These are similar to 2011 figures with the exception
of the proportion of licence holders who reported answering a call while stopped at the lights, which
decreased by 9 percentage points. It is clear that licence holders remain more likely to answer calls on their
mobile than make them. Drivers were more likely to answer the phone and hold it on their lap while driving
(28%) than to use the inbuilt speaker to make calls (17%).
Younger licence holders were significantly more likely than older licence holders to use their handheld
mobile to make or answer calls under any circumstance. While older people are less likely to own a mobile
phone in the first place, the differences in ownership do not explain the variation in use while driving.
Metropolitan licence holders were significantly more likely than regional drivers to make or answer calls while
stopped at traffic lights using an in-built speaker or otherwise. Males were significantly more likely than
females to make or answer calls while actively driving.
Table 26: Use of Handheld Mobile for Calls in Car by Demographics
2012 (1329)
Metro (459)
Regional (870)
Males(683)
Females
(646)
18-25yo’s (272)
26-39yo’s (373)
40-60yo’s(495)
61+yo’s
(189)a b c d e f g h
To make a call while stopped at the lights 17% 23% 13% 18% 15% 27% g,h 26% g,h 14%h 2%
To answer a call while stopped at the lights 25% 33% 21% 28% 23% 35% g,h 36% g,h 24%h 6%
To make a call while actively driving 15% 14% 15% 17% 12% 26% g,h 23% g,h 13%h 1%
To answer a call while actively driving 25% 23% 26% 29% 21% 36% g,h 34% g,h 24%h 8%
To make a call while driving but phone on lap and used in-built speaker
18% 22% 16% 19% 18% 33% g,h 33% g,h 13%h 2%
To answer a call while driving but phone on lap and used in-built speaker
28% 32% 25% 28% 27% 41% g,h 46% g,h 22%h 6%
Base: All licence holdersQ36a,c,j,I,f,e During the last month, have you used a HANDHELD mobile phone
The Social Research Centre
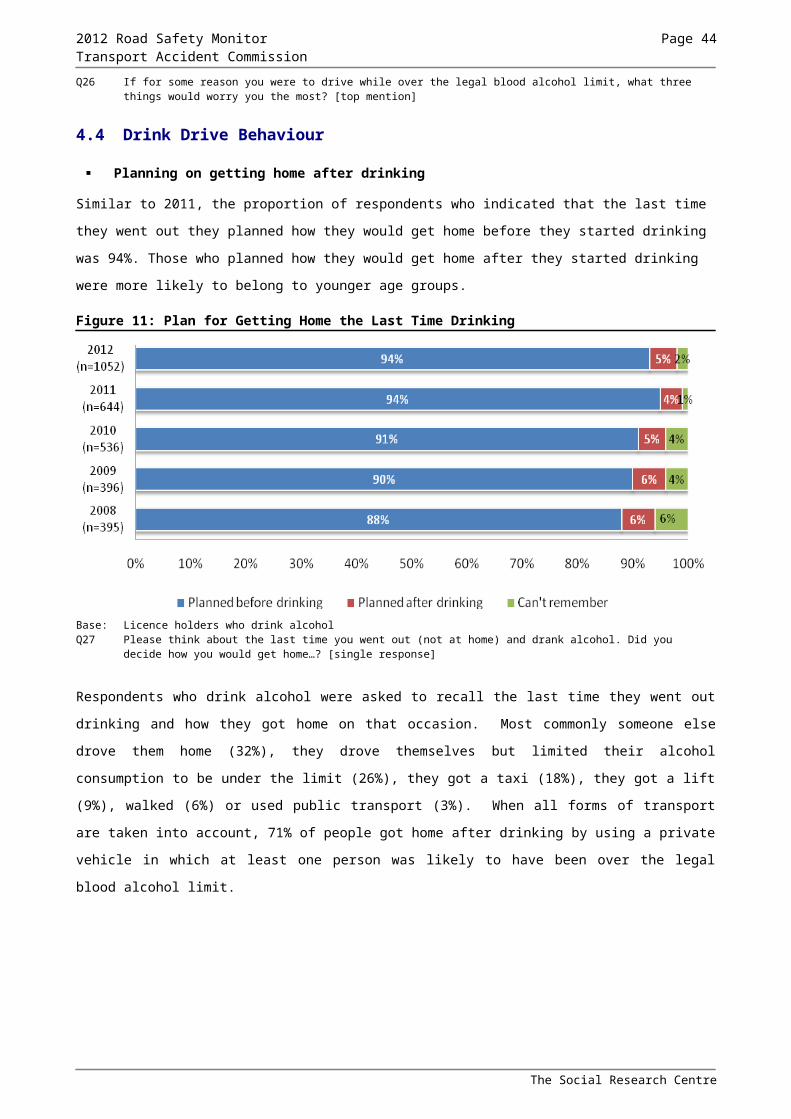
2012 Road Safety Monitor Page 47Transport Accident Commission
In 2012, 39% of all licence holders used their mobile phone to read a text message while stopped at the
lights. Reading and writing text messages was more common at traffic lights than while actively driving,
particularly for metropolitan (45% reading), female (43% reading) and younger licence holders, where nearly
60% of all licence holders aged 18 to 39 years reported reading text messages while stopped at the lights in
the last month.
Again, despite the fact that older licence holders report proportionately less mobile phone ownership, these
differences relating to ownership alone do not account for the significantly lower usage of mobile phones
while driving among older licence holders.
Table 27: Use of Handheld Mobile for Texting in Car by Demographics (2012)
2012 (1329)
Metro (459)
Regional (870)
Males(683)
Females
(646)
18-25yo’s (272)
26-39yo’s (373)
40-60yo’s(495)
61+yo’s
(189)a b c d e f g h
To write and send a text message while actively driving
9% 9% 9% 10% 7% 21% g,h 16% g,h 5% h 1%
To read a text message while actively driving 16% 14% 17% 16% 15% 29% g,h 25% g,h 12% h 2%
To write and send a text message while stopped at the lights
20% 25% 17% 20% 19% 37% g,h 34% g,h 15% h 1%
To read a text message while stopped at the lights 39% 45% 37% 36% 43% 55% g,h 58% g,h 36% h 10%
Base: All licence holdersQ36h,g,d,b During the last month, have you used a HANDHELD mobile phone
In contrast to 2011 trends, the use of handheld mobile phones while driving decreased in 2012. It should be
noted that respondents in 2012 contained a higher proportion of older licence holders (aged 61+ years) who
reported considerably lower rates of mobile phone use than the remaining age groups. Regardless, when
older licence holders (61+ years) are removed from the results, the use of mobile phones while driving has
still reduced slightly from 2011 to 2012 – with 42% of Victorian licence holders aged 18 to 60 years reporting
they used a handheld mobile phone to read a text while driving in the previous month and 41% reporting
taking a phone call while driving in 2012.
The Social Research Centre
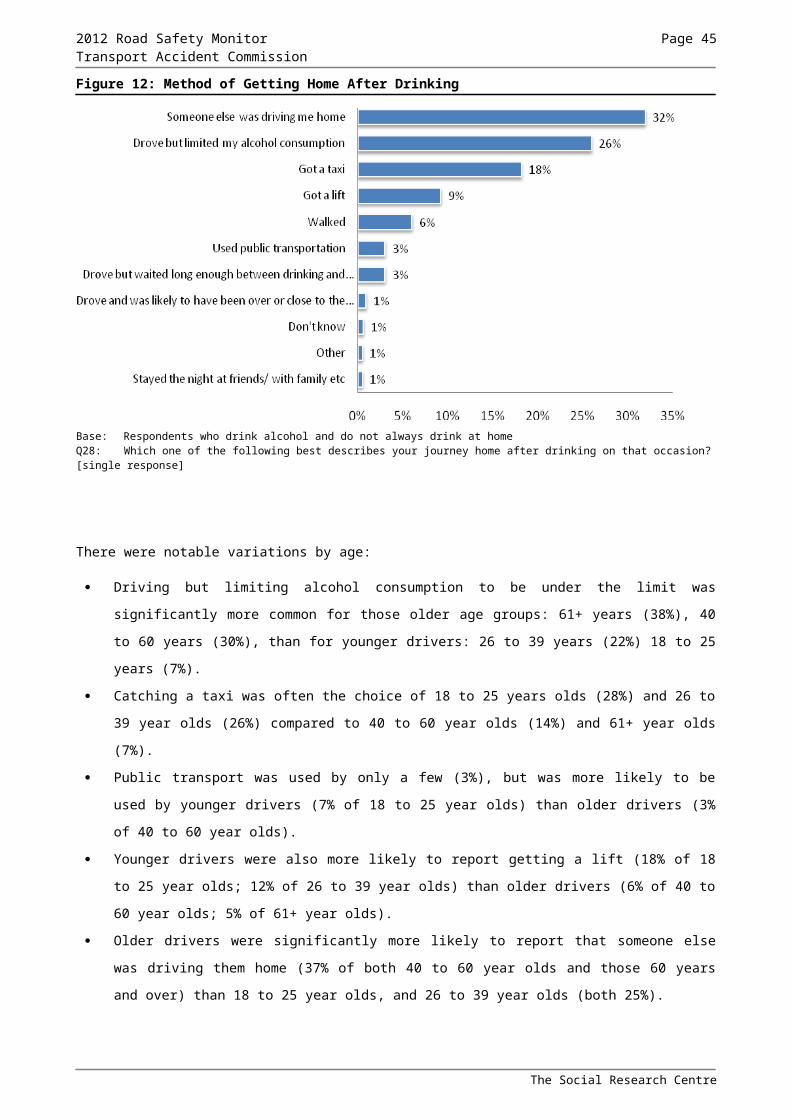
2012 Road Safety Monitor Page 48Transport Accident Commission
Figure 17: Use of Handheld Mobile While Driving – Time Series
Base: All licence holdersQ36 During the last month, have you used a HANDHELD mobile phone combined items
Based on 2012 findings, it has been estimated that 60% of Victorian licence holders used a handheld mobile
phone while driving in the month before the survey. This is a significant change from 2011 (64%), however
the figure drops further to 53% when licence holders aged 61 years and over are included.
Excluding older drivers (61 years and over), more than half (56%) of licence holders reported using a GPS or
electronic navigation device in their car in 2012, which reflects a slight increase from 2011 figures (52%).
These devices could be factory fitted, built-in or portable. Again excluding older drivers, 40% of licence
holders reported using a hands free mobile phone whilst driving in the last month. This figure is virtually
unchanged from 2011 (42%).
After increasing significantly between 2009 and 2011, it appears that the growth in use of mobile phones and
other electronic devices while driving has stabilised.
The Social Research Centre

2012 Road Safety Monitor Page 49Transport Accident Commission
Figure 18: Use of Electronic Devices While Driving
Base: Licence holders aged 18-60 yearsQ36 During the last month, have you used a HANDHELD mobile phone Q40 During the last month, have you used a HANDS FREE mobile phone whilst driving? That is, been able to talk on your mobile
through some secondary device (like a headset, separate speaker system or the radio), so that you don’t have the phone in your hand.
Q42 Do you ever use a GPS or Electronic Navigation device in your car? This is including either factory fit, built in or portable devices.
56% of Victorian drivers use a GPS or electronic navigation device in their car (this reduces to 51% of
Victorian licence holders when the 61+ age group is included). Drivers were asked to describe the type of
device used in their car and how they use the device. The majority (66%) use a portable device; 24% use a
feature of their mobile phone and the remaining 11% used a factory installed device. The majority of drivers
use their GPS by looking at the screen while driving (77%), however 58% report relying on the voice prompts
only without looking at the screen, and 33% touch the GPS to make adjustments while driving. There were
significant differences in the way licence holders with different types of GPS devices used the device.
Licence holders with factory fitted or portable GPS devices were significantly more likely to rely on voice
prompts only and were less likely to touch the GPS to make adjustments than users of GPS units contained
within mobile phones.
Table 28: Use of GPS device by type of GPS device
2012(700)
Factory Installed(67)
Portable Device(443)
Feature of the Phone(183)
Rely on voice prompts only 58% 73% 63% 38%Look at the screen 77% 78% 77% 78%
Touch the GPS to make adjustments 33% 30% 27% 49%
Base: Licence holders who ever use a GPS or Electronic Navigation device in car (n=700)Q43 Is GPS or Electronic Navigation device you use in your car...Q44a,b,c How do you use the GPS or Electronic Navigation device? Do you...
Regional Victorian licence holders were significantly more likely to use a portable GPS or electronic
navigation device (72%) than metropolitan drivers (54%), while the latter were more likely to use the GPS
feature of their mobile phone (32% compared with 18% for regional drivers). These trends are unchanged
from 2011. Older drivers (61 years and over) who use a GPS or Electronic Navigation device were
significantly more likely to have a portable device (84%) than those aged 18 to 25 years (59%), while the
The Social Research Centre

2012 Road Safety Monitor Page 50Transport Accident Commission
latter were more likely to use the GPS feature of their mobile phone (37% compared to 1% for the older
group).
Table 29: Use of GPS or Electronic Navigation in Car by Demographics (2012)
2012 (662)
Metro (262)
Regional (438)
Males(408)
Females
(290)
18-25yo’s (174)
26-39yo’s (217)
40-60yo’s(251)
61+yo’s
(58)a b c d e f g h
Type of GPS used in carFactory installed 11% 14% 9% 12% 9% 5% 7% 14% e,f 16% ePortable device 66% 54% 72% 65% 66% 59% 54% 72% e,f 84%
e,f,gFeature of mobile phone 24% 33% 18% 22% 25% 37% g,h 39% g,h 14%h 1%How use GPSRely on voice prompts only; not look at screen 55% 51% 58% 53% 59% 43% 48% 59% e,f 72%
e,f,gLook at screen while driving 69% 71% 67% 71% 66% 83% g,h 78% g,h 62% 51%
Touch the GPS to make adjustments 28% 32% 25% 29% 25% 42% g,h 36% g,h 22% 12%
Base: Licence holders who ever use a GPS or Electronic Navigation device in carQ43 Is GPS or Electronic Navigation device you use in your car...Q44 How do you use the GPS or Electronic Navigation device? Do you...
7.4 Attitudes to Mobile Phone Use
Level of Danger in Using Handheld Mobile While Driving
Licence holders were asked how dangerous they thought it was to drive while using a handheld mobile
phone (not a hands free unit), using a rating scale from zero (not at all dangerous) to 10 (extremely
dangerous). In 2012, almost 84% considered driving while on a handheld mobile phone as moderately,
highly or extremely dangerous (80% in 2011). When older age licence holders (61 years and over) are
included, the proportion of licence holders who rate using a handheld mobile phone while driving as
moderately or extremely dangerous rises to 86%. While demonstrating some volatility over time, these
figures are consistent with those found since 2004 (see Figure 19).
Figure 19: Level of Danger in Using Handheld Mobile While Driving
The Social Research Centre

2012 Road Safety Monitor Page 51Transport Accident Commission
Base: Licence holders who could give a rating out of 10Q39 Using a scale where 0 is not at all dangerous and 10 is extremely dangerous, how dangerous do you think it is to drive while
using a handheld mobile phone?Analysis of perceptions of danger by self-reported mobile phone use indicate that licence holders who report
using their hand-held or hands-free mobile phone while driving in the past month to either make or answer
calls while driving, are significantly less likely to consider that this behaviour is dangerous. This suggests that
attitudes directly link to behaviour or vice-versa. Despite licence holders’ acknowledgement of the dangers of
mobile phone use while driving however, many continue to use their mobile phone while driving, for example,
while 26% of licence holders reported using their mobile phone to answer calls while actively driving, 71% of
these people reported that to do so was either moderately or extremely dangerous. In this respect, additional
messaging may not curb behaviour among such drivers.
Figure 20: Perception of danger of mobile phone use by self-reported mobile phone use while driving
Base: Licence holders who could give a rating out of 10Q39 Using a scale where 0 is not at all dangerous and 10 is extremely dangerous, how dangerous do you think it is to drive while
using a handheld mobile phone?Q41 Using a scale where 0 is not at all dangerous and 10 is extremely dangerous, how dangerous do you think it is to drive while
using a hands free mobile phone?
Level of Danger in Using a Hands Free Mobile While Driving
Perceptions of the level of danger associated with using a hands free mobile phone while driving are
considerably lower (30% moderately to extremely dangerous) compared with driving while using a handheld
mobile (84% moderately to extremely dangerous). As with handheld mobiles, the proportion of licence
holders who thought that driving with a hands-free mobile is extremely dangerous has remained fairly stable
since 2010. The vast majority of Victorian licence holders (70%) considered driving with a hands free mobile
phone to be not at all dangerous (33%) or of low to moderate danger (37%).
The Social Research Centre

2012 Road Safety Monitor Page 52Transport Accident Commission
Figure 21: Level of Danger in Using Hands Free Mobile While Driving
Base: Licence holders who could give a rating out of 10Q41 Using a scale where 0 is not at all dangerous and 10 is extremely dangerous, how dangerous do you think it is to drive while
using a hands free mobile phone?
The Social Research Centre

2012 Road Safety Monitor Page 53Transport Accident Commission
8. Vehicle Purchasing
8.1 Intent
Vehicle purchasing intentions appear to be at continued lows post the 2008 global financial crisis, dropping
to 39% in 2012. Prior to 2009, between 60% and 70% of Victorian licence holders reported that they were
planning to buy a new or used car in the future; in 2009 this dipped to 44% and has not recovered since.
Similarly, the proportion or respondents planning to buy a car in the next 12 months halved between 2009
and 2010, with only a modest recovery since that time.
Figure 22: Future Car Purchase Intent – Time Series
Base: Licence holders Q57 Are you planning to purchase a new or used car in future…? IF YES: Will that be in less or more than 12 months from now?
Among those Victorian licence holders planning to purchase a car in the future (39%), more intended to buy
a used car (46%) than a new car (36%). Around 18% have not decided yet whether they will buy a new or
used car in the future. These proportions have remained relatively steady since 2010.
Figure 23: New Versus Used Car Purchase Intent – Time Series
Base: Licence holders who plan to purchase a carQ58 Do you intend to buy a new or a used car?Note: Base for 2005 to 2009 shows total sample although response is of those who plan to purchase a car
The Social Research Centre

2012 Road Safety Monitor Page 54Transport Accident Commission
New car purchases were significantly more likely to be planned by older age groups than younger age
groups, while younger people were more likely to be considering used cars. Importantly, 24% of people aged
18 to 25 years (and 18% overall) had not decided whether they would purchase a new car or a used car.
This leaves a potentially large proportion of the population open to messaging (e.g., How Safe Is Your Car
website) around the importance of safety in their purchasing decisions.
Table 30: New versus Used Car Purchase by Demographics (2012)
2012(518)
Metro (187)
Regional (352)
Males(316)
Females (222)
18-25yo’s (145)
26-39yo’s (156)
40-60yo’s(204)
61+ yo’s (34)
a b c d e f g h
New car 35% 40% 33% 32% 41% 24% 29% 39%a 59% e,f
Used car 46% 42% 48% 50% 41% 51% 49% 45% 34%
Undecided 18% 18% 19% 18% 18% 25% 22% 16% 6%
Base: Licence holders who plan to purchase a carQ58 Do you intend to buy a new or a used car?
It should be noted that despite the continued reduction in intention to purchase vehicles of any kind by
licence holders, ABS data indicates that vehicle sales in Australia during 2012 were the highest on record.
The disparity between intention to purchase and actual purchasing behaviour is not explained by this data
but may reflect a general reduction in consumer confidence since the global financial crisis.
8.2 Factors Influencing Selection
Respondents were asked to rate how important each of 10 factors were to their decisions around vehicle
purchasing on a scale from 1 (not at all important) to 5 (very important). This was a diversion from previous
years’ methodologies where respondents were asked to either rank importance of characteristics or
nominate their top 3 characteristics.
Overall, Figure 24 shows, the condition of the vehicle (roadworthiness, mileage, etc.) was rated as the most
important factor in purchase decisions. This was followed by safety features of the vehicle, fuel economy,
and type of vehicle (e.g., ute, sedan, etc.) and other vehicle features, as well as transmission type and size
of vehicle.
The Social Research Centre

2012 Road Safety Monitor Page 55Transport Accident Commission
Figure 24: Factors Influencing Vehicle Selection – Rating of Importance
Base: Licence holders who plan to purchase a carQ60a-j Once you have decided your budget, please give each of the following factors a score out of five
Significant differences in importance of factors appeared by demographic groups. Regional purchasers (3.3)
were less likely than metropolitan (3.7) to rate style as important. Similarly, females (4.6) were more likely to
rate safety features more highly than males (4.3). Males (4.1) rated ‘type of vehicle’ as more important than
females (3.9). Younger drivers were somewhat less concerned with condition, features and fuel economy
than other age groups. Other age group variations showed that younger drivers (18 to 25 years) rated power
and performance and size of vehicle as less important than older drivers. Analysis of differences between
age groups in this monitor may not be wholly appropriate, however, as older participants tended to provide
higher ratings of importance for all factors across the board. Further analysis is therefore best to occur by
considering relative importance of factors (i.e., rankings) within each age group.
Table 31: Factors Influencing Vehicle Selection – Rating of Importance by Demographics
Metro(478)
Regional(878)
Male(699)
Female(655)
18-25(280)
26-39(381)
40-60(495)
61+(200)
a b c d e f g hCondition of the vehicle 4.7 4.8 4.7 4.8 4.7 h 4.8 4.8 4.9
Features of vehicle 4.1 4.0 4.0 4.0 3.8 4.1 e 4.0 4.2
Fuel economy / fuel cost 4.1 4.2 4.1 4.3 4.0d 4.2 4.2 4.4
Manufacturer 3.1 3.1 3.1 3.1 3.1 3.2 3.0 3.4
Power / performance 3.2 3.2 3.3 3.1 2.9 3.3 e 3.3 e 3.2
Safety features of the vehicle 4.4 4.4 4.3 4.6 4.3 4.3 4.4 4.5
Size of vehicle 3.9 3.9 3.9 3.9 3.6 f,g 4.0 3.9 4.3 e,g
Style / appearance / image 3.7 3.3 3.4 3.5 3.5 3.4 3.4 4.0 e,f,g
Transmission type 4.0 3.9 3.9 4.0 4.0 f 3.7 4.0 f 4.2 f
Type of vehicle 3.9 4.1 4.1 3.9 3.6 4.1 e 4.1 e 4.3 eBase: Licence holders who plan to purchase a carQ60a-j Once you have decided your budget, please give each of the following factors a score out of five
The Social Research Centre
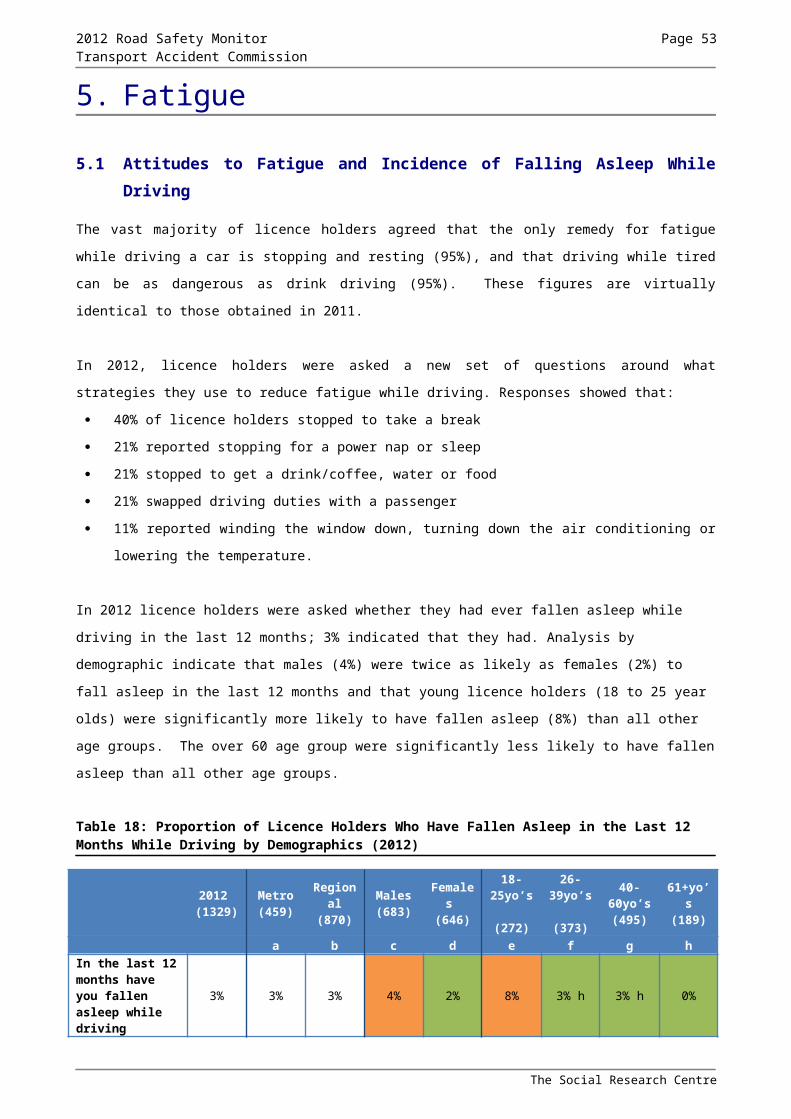
2012 Road Safety Monitor Page 56Transport Accident Commission
8.3 Importance of Safety Features
Respondents were asked to rate how important each of ten safety features were when considering
purchasing a vehicle. Again, this was a change in methodology from earlier monitors where respondents
were asked to rate their top 3 priorities or asked to rank features from most important to least important.
Absolute comparison between years is therefore not possible. An additional change was the inclusion of two
new safety features to the list, reflecting emerging technology developed by the automotive industry:
autonomous emergency braking, and lane departure warning systems.
The safety features considered most important when buying a car were driver and passenger frontal airbags,
ABS brakes, side curtain airbags, side airbags, and stability control. Least important were Lane departure
warnings, rear parking aids, and adaptive cruise control. In general, females and older drivers (61+yo’s)
rated each of the features as more important than males or younger age groups, respectively.
Figure 25: Safety Factors Influencing Vehicle Selection – Rating of Importance
Base: Respondents who plan to purchase a carQ61a-j Below is a list of safety features that could be considered when buying a car. From this list please give each of the features a
score out of five
Respondents who were planning to buy a vehicle in the future were asked to specify a budget from a range.
Eleven options were given in total, ranging from under $2500 to over $60,000. For the purposes of obtaining
subgroups sizes that would allow comparison of the importance of vehicle features across budgets, these
ranges were collapsed to: Under $15k, $15-25k, $25-40k, and Over $40k.
Perhaps unsurprisingly, as Table 32 shows, respondents with budgets under $15,000 rated the importance
of all general vehicular features and also vehicle safety features lower than most groups with a larger
budget, with the exception of fuel economy.
The Social Research Centre

2012 Road Safety Monitor Page 57Transport Accident Commission
Table 32: Budget vs vehicle feature desirability (mean)
Under $15K(n=138)
$15-25k(n=137)
$25-40k(n=147)
Over $40k(n=76)
a b c d
General vehicle features
Condition of vehicle 4.7 4.8 4.9 4.8
Features of vehicle 3.6 4.1a 4.3 4.3
Fuel economy 4.2 4.1 4.3 4.0
Manufacturer 2.8 3.0 3.2 3.5
Performance 2.9 3.1 3.4 3.7
Safety features of the vehicle 4.0 b,c,d 4.5 4.7 a,b,d 4.5
Size of vehicle 3.8 3.9 4.0 4.0
Style & appearance 3.1 3.4 3.6 3.9 a,b,c
Transmission type 3.7 3.8 4.1 4.1a
Type of vehicle 3.7 4.0 4.3 a,b 4.1
Vehicle safety features
ABS brakes 4.1 4.6 4.7 4.7
Adaptive cruise control 2.8 3.3 a 3.7 3.9
Autonomous Emergency Braking 3.3 3.9 4.0 3.8
Driver and passenger frontal airbags 4.2 4.7 4.8 4.8
Lane departure warning systems 2.8 3.1 3.3 3.1
Rear parking aids 2.7 3.0a 3.5 3.5
Side airbags 3.7 4.2 4.5 a,b 4.5
Side curtain airbags 3.8 4.3 a 4.7 a,b 4.5 a
Electronic Stability Control 3.6 4.1 4.3 4.2
Traction control 3.5 4.1 4.2 4.0Base: Licence holders who plan to purchase a carQ60a-j Once you have decided your budget, please give each of the following factors a score out of fiveQ61a-j Below is a list of safety features that could be considered when buying a car. From this list please give each of the features a
score out of five
Respondents who were planning to buy a car in the future were asked whether they will consider crash test
results or safety ratings before they purchase their next car (including ANCAP Used Car Safety Ratings and
5 star ratings). Consistent with previous years, 68% of respondents indicated that they would consider crash
test results or safety ratings when buying their next car, 21% would not consider these results and around
11% did not know.
Older aged drivers (61+ years) were significantly more likely than other age groups to report that they would
consider crash test results prior to purchasing their next vehicle, whereas drivers aged 18 to 25 years and 46
to 60 years were significantly less likely to consider results than 26 to 39 years. Males were more likely than
females to report that they would not look at results (25% vs. 14%) but were less likely to report that they
didn’t know (8% vs. 15%).
The Social Research Centre

2012 Road Safety Monitor Page 58Transport Accident Commission
Table 33: Would Consider Crash Test Results When Purchasing a Car by Demographics (2012)
2012(553)
Metro (193)
Regional(360)
Males(327)
Females (226)
18-25yo’s (145)
26-39yo’s (160)
40-60yo’s(209)
61+yo’s (38)
a b c d e f g h
Consider results 68% 72% 66% 66% 71% 67% 71% 64% 87%
Do not consider results 21% 19% 22% 25% 14% 23% 18% 25% 5%
Don’t know 11% 9% 12% 8% 15% 11% 11% 11% 8%Base: Licence holders who plan to purchase a carQ62 Do you consider crash test results or safety ratings before you purchase your next car? This includes ANCAP Used Car
Safety Ratings and 5 star ratings.
8.4 Sources of Information
If Victorian drivers (including those over 60) were looking for information about the vehicle safety features
available on a car, 75% reported that they would access the internet, 48% would consult the RACV, 28%
would ask a family member or friend, 28% would consult a car dealer, 17% magazines, and 14%
newspapers. These figures are essentially unchanged since 2011.
In terms of differences by demographics:
The internet was more often a source of information for younger groups than older, with a steady
decline in usage with increasing age (88% for 18 to 25’s and 45% for 61+yo’s)
Males and females showed differences across all sources of information with exception of the internet.
Males were more likely to use magazines (20% vs. 14%), newspapers (16% vs. 12%), and were less
likely to rely on external sources such as family members or friends (21% vs. 36% of females), the
RACV (42% vs. 54%), or car dealers (24% vs. 31%).
Figure 26 below includes respondents up to the age of 60 for comparability with previous time series.
Figure 26: Sources of Information on Vehicle Safety – 2010-2012
Base: Licence holders aged 18-60Q63 If you were looking for information about the vehicle safety features that are available on a car, where would you look?
[multiple response]
The Social Research Centre

2012 Road Safety Monitor Page 59Transport Accident Commission
When compared to previous years, awareness of the ‘How Safe is Your Car’ website remained at just over
half (53%) of all respondents, consistent with last year (see Figure 27).
When the 60 to 90 cohort is included, awareness falls to 50%. In terms of other demographic characteristics
(still including the older group), males were significantly more likely to be aware of this website (56%) than
females (43%), as were those aged 18 to 25 years (62%) and 26 to 39 (59%) compared with the older
groups (48% and 31%, respectively).
Figure 27: Awareness of ‘How Safe is Your Car’ Website
Base: Licence holders aged 18-60Q64 Are you aware of the ‘How Safe is Your Car’ website?
The Social Research Centre

2012 Road Safety Monitor Page 60Transport Accident Commission
The Social Research Centre

2012 Road Safety Monitor Page 61Transport Accident Commission
9. Driver Characteristics and Demographics
9.1 Licence Type
All people who were sent an invite to participate in the TAC RSM were selected from the VicRoads database
of Victorians who held a drivers licence or vehicle registration. In 2012, 89% of survey respondents held a
full drivers licence which was similar to the 2011 incidence (88%). Another 2% were Red Probationary
licence holders; 5% were Green Probationary licence holders; 3% were on their learners permit; and 2%
described some other type of licence. No respondent indicated that they did not hold a licence. Less than
half (40%) of the 18 to 25 year olds held a full licence with the remainder holding either a probationary or
learners licence. For comparability, the time series data in Figure 28 below does not include respondents 61
and older.
Figure 28: Incidence of Full Licence
Base: Licence holders aged 18-60Q1 What type of care licence do you hold?
Figure 29: Licence Type by Demographics (2012)
2012 (1329)
Metro (459)
Regional (870)
Males(683)
Females (646)
18-25yo’s (272)
26-39yo’s (373)
40-60yo’s(495)
61+yo’s(189)
a b c d e f g h
Full licence 89% 87% 90% 89% 89% 40% 93% 97% 95%
Red Probationary 2% 1% 2% 2% 1% 12% 0% 0% 0%
Green Probationary 5% 6% 4% 4% 5% 32% 3% 1% 0%
Learner Permit 3% 4% 2% 2% 4% 15% 3% 1% 0%
Other 2% 2% 2% 4% 1% 0% 1% 2% 4%
Base: All licence holders Q1 What type of care licence do you hold?
The Social Research Centre

2012 Road Safety Monitor Page 62Transport Accident Commission
9.2 Driving Profile
Car Ownership and Typical Driving Distance
In total, 80% of licence holders indicated that they personally own the car that they drive, with a further 11%
indicating that the car they drive belongs to someone else in their household. 5% indicated that they own a
car but usually drive a company car. A further 5% indicated that they do not own a car and either drive only
a company car, hire or borrow a car as needed, or do not ever drive.
There were notable differences in terms of vehicle ownership by the age of the licence holder:
62% of 18 to 25 year olds personally own the car that they usually drive (compared to 79% of 26 to 39
year olds and 82% of those 40 to 60 years and 88% of those aged 61 years and over).
30% of 18 to 25 year olds usually drive a car owned by someone else in their household (compared to
10% of 26 to 39 year olds and 7% of those 40 to 60 years and 9% of those aged 61 years and over).
Figure 30: Car Ownership (2012)
Base: All licence holders (n=1329)Q69 Which of the following statements best describes the car (not motorcycle or truck) you usually drive?
Personally owned includes cars that are under finance or leased. [single response]
The Social Research Centre

2012 Road Safety Monitor Page 63Transport Accident Commission
The amount of driving in a typical year provides a framework as to the experience on the road, and also
exposure to possible risky behaviours on the road. There was no significant difference between the average
numbers of kilometres estimated to have been driven per year by any age group. When split into categories
(see Figure 31 below) some notable observations were that:
47% of older females (61 years and over) drove fewer than 10,000km per year,
just 7% of 40 to 60 year old males and 19% of 40 to 60 year old females drove 10,000km or fewer in a
year,
39% of 40 to 60 year old males and 34% of 18 to 25 year old males drove at least 30,000km per year.
On average, across all age groups, males drove further per year than females (26,000km versus 18,000km).
Figure 31: Kilometres Driven per Year by Age and Gender (2012)
Base: All licence holders who drive a car and who are able to estimate a km per year figureQ71 In a typical year, how many kilometres would you drive for any reason?
The Social Research Centre
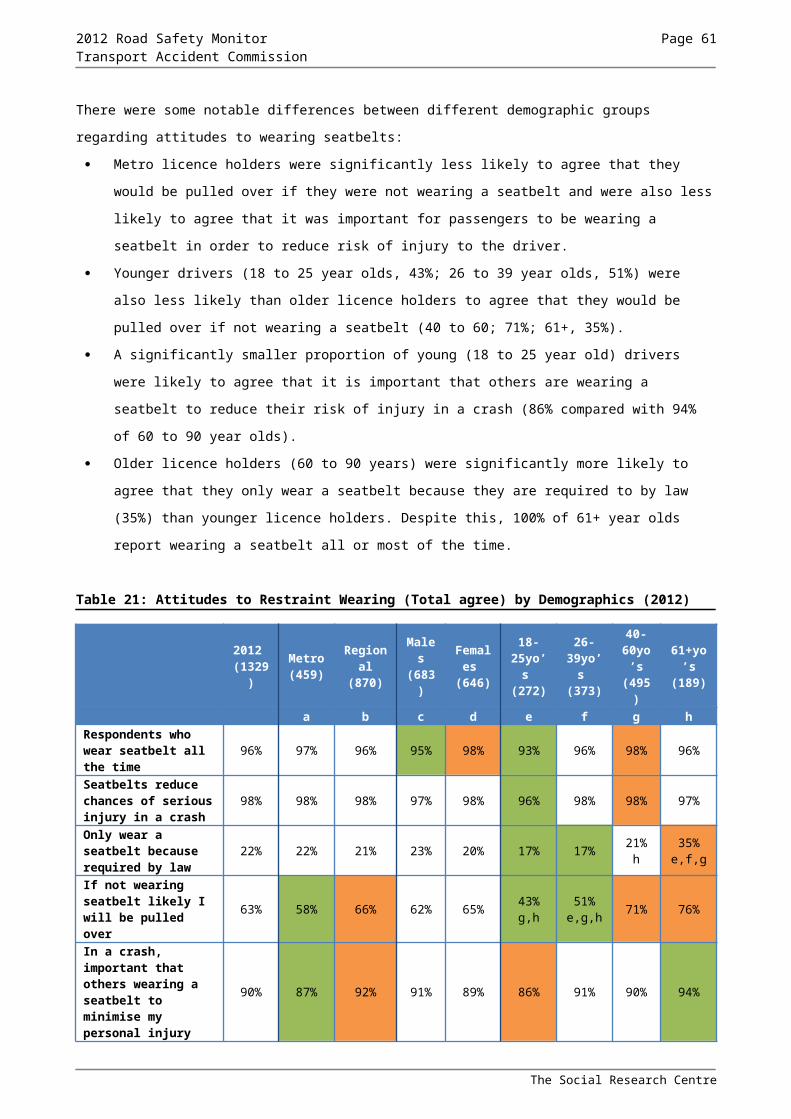
2012 Road Safety Monitor Page 64Transport Accident Commission
Work Related Driving
Licence holders who were in paid employment were asked about the amount of driving they do for work
related purposes. They were specifically asked not to include driving to and from work (a subsequent
question determined that some only commute to and from work and as such their response to the frequency
of driving for work related purposes was adjusted to never). Overall, of the 69% of licence holders who were
employed, 74% said that they do some driving as part of their work, with 38% indicating that they drive daily
as part of their work. Slightly lower results were reported in 2011 (62% and 31% respectively).
Of those licence holders who noted some amount of driving for work purposes: 83% drove a car; 7% a truck;
1% a bus; 1% a motorcycle; and 8% mentioned another type of vehicle.
Figure 32: Frequency of Driving for Work Related Purposes (2012)
Base: Licence holders who were in paid employment and (n=929) Q73 How often do you drive for work related purposes, not including driving to and from work?
The Social Research Centre

2012 Road Safety Monitor Page 65Transport Accident Commission
9.3 Vehicle Ownership
The type of car usually driven, including the make, model and year was collected from those who indicated
that they do drive a car. The most common make of cars driven by licence holders in the 2012 RSM were:
Holden (23%); Ford (22%); Toyota (21%); Mazda (7%); Mitsubishi (6%); Nissan (7%) and Honda (5%).
There were notable differences by age within gender. Younger males (18 to 25 years) and older males (61
years and over) were more likely to drive a Holden than their female counterparts (19% and 12%
respectively). Hondas, Mazdas, Suzukis and Volkswagens were more popular among younger females
(aged 18 to 25) than their male counterparts.
Table 34: Make of Car by Age within Gender (2012)
Total Male Female
(n=1329)18-25
(n=148)26-39
(n=190)40-60
(n=240)61+
(n=103)18-25
(n=122)26-39
(n=180)40-60
(n=249)61+
(n=95)
Ford 22% 20% 28% 27% 22% 13% 24% 17% 14%Holden 23% 28% 22% 24% 23% 19% 22% 24% 12%Honda 5% 2% 5% 3% 4% 8% 6% 7% 5%Mazda 7% 6% 2% 4% 7% 12% 6% 11% 12%Mitsubishi 7% 12% 7% 7% 3% 8% 9% 7% 3%Nissan 7% 8% 6% 7% 14% 8% 4% 4% 17%Subaru 3% 3% 5% 2% 5% 0% 4% 3% 3%Suzuki 1% 0% 1% 1% 1% 5% 0% 2% 3%Toyota 21% 19% 19% 21% 21% 21% 21% 22% 26%Volkswagen 3% 2% 5% 3% 0% 6% 2% 2% 5%
Base: Licence holders who do drive a carQ70 What type of car do you usually drive?
As would be expected, younger people drove older cars. The average age of cars driven by 18 to 25 year
old males was 11.2 years, compared with 9.3 years for 18 to 25 year old females. The figures demonstrate
that the age groups that are most likely to be involved in road accidents per kilometre driven (18 to 25 year
olds and 61 years and over) tend to drive the oldest cars. In particular, young males aged 18 to 25 years, on
average, drive vehicles that are close to two years older than the next nearest age group.
Figure 33: Year of Car Manufacture by Licence Holder Age (2012)
Base: Licence holders who drive a car (n=1329)Q57 What type of care do you usually drive?
The Social Research Centre

2012 Road Safety Monitor Page 66Transport Accident Commission
9.4 Household Vehicles
A household audit of motor vehicles revealed that, on average, households in Victoria had 2.17 cars
registered at their home address, 0.22 motorbikes and 0.10 trucks or buses. Regional households had
significantly higher numbers of cars, trucks or buses, or motorbikes than metropolitan households. Younger
licence holders (18 to 25 year olds) had significantly higher numbers of cars per household than older
groups.
Table 35: Mean Number of Vehicles in Household (2012)
2012 (1329)
Metro (459)
Regional (870)
Males(683)
Females (646)
18-25yo’s (272)
26-39yo’s (373)
40-60yo’s(495)
61+yo’s(189)
a b c d e f g h
Cars 2.17 2.04 2.23 2.21 2.12 3.01 1.94 2.20 1.87
Trucks or buses 0.10 0.04 0.13 0.10 0.10 0.10 0.06 0.12 0.13
Motorbikes 0.22 0.14 0.27 0.24 0.21 0.22 0.15 0.30 0.14
Base: All Licence holders Q68 How many of each of the following types of registered vehicles are there at your home address?
9.5 Individual Demographics
Three quarters (79%) of licence holders were born in Australia, 5% in the United Kingdom, and 16% in
another country (including New Zealand, Vietnam, China and India).
Work Status
Excluding licence holders over the age of 61, in 2012, 81% of licence holders worked in paid employment.
This is consistent with recent previous years. When licence holders over the age of 61 are included, the
proportion of those in paid employment drops to 71%.
Figure 34: Work status
Base: Licence holdersQ4 What is your current employment status?
The Social Research Centre

2012 Road Safety Monitor Page 67Transport Accident Commission
In 2012 the majority of licence holders who were employed worked as professional and associate
professionals (27%), managers and administrators (15%), technicians and trade workers (15%) and clerical
and administrative workers (12%). This breakdown was consistent with 2011 figures.
Figure 35: Occupation
Base: Licence holders who were employedQ5 How would you describe your main paid employment?
Consistent with previous years, there is a greater proportion of professionals and associate professionals in
metropolitan areas and a greater proportion of technicians/trade workers and machinery operators/drivers in
regional areas. As might be expected, males tended to dominate technical and trade professions, whereas
females showed higher proportions in professional, clerical and community professions.
Figure 36: Occupation by demographics
2012 (921)
Metro (304)
Regional (617)
Males(515)
Females
(405)
18-25yo’s (175)
26-39yo’s (293)
40-60yo’s(403)
61+yo’s(50)
Managers and administrators 15% 15% 14% 16% 12% 6% 16% 15% 17%
Professionals and associate professionals 27% 32% 24% 24% 31% 18% 32% 26% 25%
Technicians and trade workers 15% 11% 17% 24% 3% 23% 16% 13% 14%
Clerical and administrative workers 12% 12% 12% 3% 24% 14% 12% 12% 11%
Community and personal service workers
7% 8% 7% 4% 11% 9% 5% 8% 11%
Sales workers 7% 9% 6% 6% 8% 17% 4% 7% 2%
Machinery operators and drivers 7% 4% 8% 12% 1% 2% 5% 8% 14%
Labourers and related workers 9% 7% 10% 11% 7% 11% 9% 10% 5%
Base: Licence holders who were employedQ5 How would you describe you main paid employment?
The Social Research Centre

2012 Road Safety Monitor Page 68Transport Accident Commission
The Social Research Centre

2012 Road Safety Monitor Page 69Transport Accident Commission
10. Perceptions of Driving Competence and Victoria’s Road Safety Performance
10.1 Relationship between perceived competence, demographics, attitudes and behaviour
Previous studies have consistently demonstrated that drivers tend to over-estimate their competence in
relation to other drivers. That is, the overwhelming majority of respondents believe that they are better
drivers than the average Victorian driver on the road, despite this being a statistical impossibility. How such
over-estimation of competence translates into driver behaviour is less well-known. The results of the 2012
iteration of the RSM indicate that there is some relationship between drivers who regard themselves as
‘better than average’ and risky driving behaviours.
When asked how they rate in comparison to other drivers, 99% of Victorian licence holders rated
themselves as ‘about average’ or better. Breaking this down in more detail, two-thirds (65%) considered
themselves ‘better than average’ (aggregate of ‘slightly better’, ‘better’, and ‘much better’) and more than one
in ten respondents (12%) thought themselves a ‘much better’ driver. Strikingly, only 17 licensed respondents
from 1329 (unweighted) rated themselves as ‘worse’ than average.
Figure 37: Rating of Driving Competence in Comparison to Rest of Victorian Drivers
Base: All licence holders (n=1329)Q65 Thinking about how you compare to the average driver on Victorian roads, would you say that you were a…
In order to compare demographic, attitudinal and behavioural differences between drivers with different
levels of confidence in their driving confidence, groups were collapsed into ‘better than average’ drivers,
‘about average’ drivers, and ‘worse than average’ drivers. Because of small cell counts, it was not possible to
compare ‘worse than average’ drivers on many items.
However, a number of significant differences were noted when comparing licence holders whose self-
reported driving competency was ‘better than average’ across a range of demographic, attitudinal and
behavioural measures.
The Social Research Centre

2012 Road Safety Monitor Page 70Transport Accident Commission
10.2 Self-reported Driving Competency by Demographics
As Table 36 compares self-reported driving competency by demographics. Of those who rated themselves ‘better than average’, a higher proportion were:
Males (72%) compared with females (58%).
Full (66%) or probationary (red: 53%, green 59%) licence holders compared with holders of a learner permit (25%).
Aged 26 to 39 years (73%) compared with those over 61 years of age (58%).
Metropolitan residents (72%) compared with regional residents (62%)
Table 36: Total Self-Reported Driving Competency by Gender, Licence type, Age & Region
Male(664)
Female(445)
Full licence(1,084)
Red Probationary
(33)
Green Probationary
(96)
Learner permit
(45)
18-25yo’s(261)
26-39 yo’s
(360)
40-60 yo’s
(485)
61+ yo’s
(177)
Metro(445)
Regional(838)
a b c d e f g h i j k lTotal 'better than average' drivers 72% 58% 66% 53% 59% 25% 57% 73% 65% g 58% 72% 62%
‘About average’ drivers 27% 41% 33% 40% 39% 67% 39% 26% 34% 42% 27% 37%
Total 'worse than average' drivers 1% 1% 1% 6% 2% 4% 3% 1% 1% 1% 1% 1%
Base: All licence holders (n=1329)Q65: Thinking about how you compare to the average driver on Victorian roads, would you say that you were a…
The Social Research Centre

2012 Road Safety Monitor Page 71Transport Accident Commission
Table 37 shows that, as could be expected given that driving skills are a core function of the occupational category, a significantly higher proportion of machinery
operators and drivers (83%) rate themselves ‘better than average’, compared with most other occupational group: professionals (66%), clerical workers (64%),
community and personal service workers (66%), sales workers (65%), and labourers (59%). Less expected, as there is no obvious relationship between the
occupational category and function performed, was the result that a significantly higher proportion of managers and administrators (77%) thought they were ‘better
than average’ drivers than professionals, clerical and administrative workers, and labourers.
Table 37: Total Self-Reported Driving Competency by Occupation
Managers and administrators
(121)
Professionals & Associate
professionals(238)
Technicians and trade workers
(140)
Clerical and administrative
workers(113)
Community and personal
service workers(67)
Sales workers
(67)
Machinery operators
and drivers(56)
Labourers and related
workers(85)
a b c d e f g hTotal 'better than average' drivers 77% b,d,h 66% 71% 64% 66% 65% 83% 59%
‘About average’ drivers 23% 32% 29% 36% 33% 32% 17% 40%Total 'worse than average' drivers - 2% - - 1% 2% - 2%
Base: All licence holders (n=1329)Q65: Thinking about how you compare to the average driver on Victorian roads, would you say that you were a…
The Social Research Centre

2012 Road Safety Monitor Page 72Transport Accident Commission
10.3 Perceived Competency and Attitudes Towards Vehicles & Safety
A relationship was also found between the level of importance respondents placed on their vehicle and self-
reported driving competency. Respondents who completed the survey online were asked to rate how
important the type of car they drive is to them.
. shows that a significantly higher proportion of respondents who said either that “the type of car I drive is
everything to me” (79%) or “the type of car I drive is important to me, but not everything” (75%) felt they were
‘better than average’ drivers, compared with those who said either “I don’t mind what type of car I drive” or “I
don’t care about the type of car I drive at all” (both 58%).
Table 38: Total Self-Reported Driving Competency by Attitude Towards Vehicle
The type of car I drive is everything
to me(42)
The type of car I drive is important to me, but
not everything(224)
I care about the type of car I drive a little,
but not too much(179)
I don't mind what type of
car I drive(133)
I don't care about the type of car I drive at
all(54)
a b c d eTotal ‘better than average’ drivers
79% 75% 67% 58% 58%
‘About average’ drivers
21% 22% 32% b 41% a,b 35% b
Total ‘worse than average’ drivers
- 3% 1% 1% 5%
Base: Online licence holdersQ94: Which of the following statements best describes how important the type of car you drive is to you?
As well as placing greater importance on the type of vehicle they drove, ‘better than average’ drivers
also differed in which features they considered desirable when considering a vehicle
purchase. Respondents were asked to rate how important a number of vehicle features were
when thinking about buying a car, on a five point scale where five was very important and one
was not at all important. A comparison between the importance ratings given by ‘better than
average drivers’ and ‘about average’ drivers was conducted, finding that ‘better than average’
drivers were:
Significantly more likely to rate power and performance highly, giving it a mean score of 3.3 compared
with ‘about average’ drivers who rated it a mean score of 3.0.
Significantly more likely to rate style, appearance and image highly (rating it a mean score of 3.5
compared with 3.3 for ‘about average’ drivers).
Significantly less concerned with fuel economy, assigning it a mean importance rating of 4.1
compared with 4.4 for ‘about average’ drivers.
Attitudinal questions also revealed that this group of ‘better than average’ drivers were marginally more (but
non-significantly) permissive in some regards than ‘about average’ drivers towards speeding. ‘Better than
average’ drivers:
The Social Research Centre
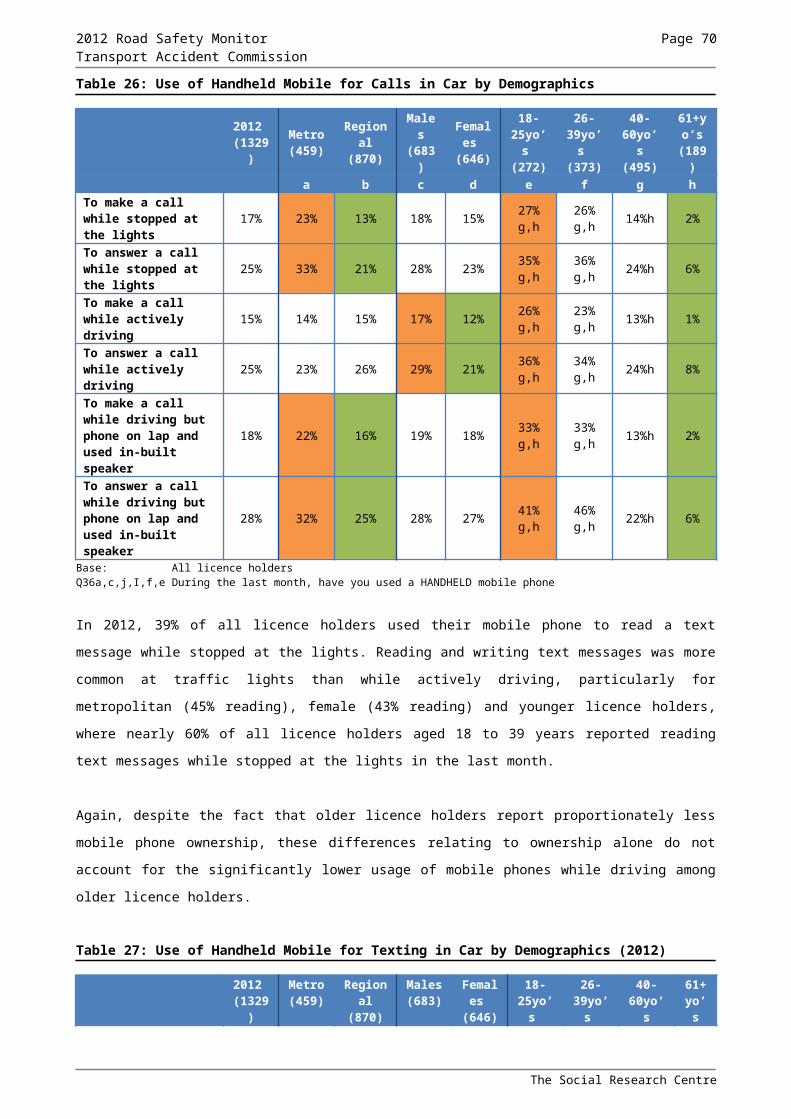
2012 Road Safety Monitor Page 73Transport Accident Commission
Rated the speed at which people should be able to drive in a 60km/h zone without being caught at
around 1km/h over the speed limit higher (63km/h) than ‘about average’ drivers (62km/h). Similarly,
they rated the speed in a 100km/h zone statistically significantly higher as well (104.6 compared with
103.9 by ‘about average’ drivers)
While the most respondents agreed that “speeding significantly increases my chance of crashing”,
total agreement from self-described ‘better than average’ drivers (82%) was significantly lower than
total agreement from ‘about average’ drivers (87%).
‘Better than average’ drivers were also significantly less likely to agree that penalties for speeding
acted as a deterrent to speeding than ‘about average’ drivers (82% vs. 87%).
In addition, respondents were asked to rate how dangerous using a hand-held mobile phone was, on a scale
where zero was not at all dangerous and 10 was extremely dangerous. Respondents who considered
themselves ‘better than average’ drivers rated the danger of using both a hand-held mobile phone
significantly lower than ‘about average’ drivers (8.3/10 vs. 8.5/10) as well as a handsfree mobile phone
(5.1/10 vs. 5.7/10).
These attitudes to the danger of using a mobile while driving translate to the behaviour of respondents while
driving. As Table 39 shows, ‘better than average’ drivers were significantly more likely to use a Bluetooth kit
(75%) than to hold the phone to their ear (64%) or never make or answer calls while driving (58%). By
contrast, drivers rating themselves ‘about average’ were more likely to never make calls while driving (41%)
than put the phone on their lap or on the console (28%) or use Bluetooth (25%).
It should be noted that there was no significant difference between self-reported driving competency groups
in the proportion of respondents who held the phone to their ear while driving. However, the proportion of
‘about average’ drivers who never make or answer calls while driving was significantly lower (54%) than
‘better than average’ drivers (33%).
Table 39: Mobile Phone Usage while Driving
I hold the phone to my ear
(113)
I hold the phone away from my
ear (27)
I put the phone in my lap or on
the console(243)
I only use a hands free kit
such as Bluetooth
(361)
I never make or answer calls while driving
(555)
a b c d eTotal ‘better than average’ drivers 64% 64% 70% e 75% 58%
‘About average’ drivers 35% d 28% 28% 25% 41%
Total ‘worse than average’ drivers 1% 8% 2% * 2%
Base: All licence holdersQ37: When you use your phone to make or answer calls while driving, what do you norammly do?
10.4 Self-reported Driving Competency and Driving Behaviours
Relationships were also found between perceived competency and driving behaviours. As Table 40 shows,
a significantly greater proportion of respondents who ride motorcycles (79%) believe themselves to be better
drivers than average compared with those who ride a bus (55%), train (62%), or walk (62%) as a form of
The Social Research Centre

2012 Road Safety Monitor Page 74Transport Accident Commission
transport at least fortnightly. Respondents who also ride a bicycle (71%) or only drive a car (67%) were also
significantly more likely to consider themselves ‘better than average’ than those who caught a bus.
Table 40: Forms of Transport Used at Least Fortnightly in Addition to Car
Bus(51)
Train(227)
Tram(109)
Walk(617)
Motorcycle
(51)
Bicycle(121)
None(442)
a b c d e f g
Total ‘better than average’ drivers 55% 62% 65% 62% 79% a,b,d 71% a 67% a
‘About average’ drivers 44% e,f,g 36% f 33% 37% e,f 21% 26% 32%
Total ‘worse than average’ drivers 1% 2% 2% 1% - 3% 1%
Base: All licence holdersQ75: What other forms of transport do you regularly (at least once a fortnight) use?
Continuing the trend, ‘better than average’ drivers:
Were significantly more likely to report that they speed in 100km/h zones at least half the time (16% vs
11%).
While not statistically significant, 6% of ‘better than average’ drivers reported having driven while over
the legal blood alcohol limit in the past 12 months, compared to 3% of ‘average’ drivers.
A case could be made that greater engagement and interest in motor vehicles, along with age,
motorcycle ownership, and occupation, relates with the opinion that the individual is a ‘better’
driver. While the mean age of respondents classifying themselves as ‘better than average’
was 44.8, the greatest and most significant differences between age groups was between the
26 to 39 year old age group and everyone else, with 73% of 26 to 39 year olds rating
themselves ‘better than average’. This was significantly higher than 18 to 25 year olds (57%),
40 to 60 year olds (65%), and 60 to 90 year olds (58%). ‘Better than average’ drivers were
also less likely to say they were not planning to purchase a car in the future (42% compared
with 51% of ‘average’ drivers).
While the age of the respondent’s vehicle is not a sufficient condition in itself for making assumptions
about attitudes to cars and driving ability, those respondents who considered themselves
better than average drivers were more likely to own a car built between 2010 – 2012 (20%)
than those who considered themselves average drivers (15%).
10.5 Breaking down level of driving competency
In order to further profile respondents who felt they were ‘better than average’ drivers, all respondents who identified themselves as either a ‘slightly better driver’, ‘better driver’, or ‘much better driver’, were compared across a range of demographic, attitudinal, and behavioural questions.
The Social Research Centre

2012 Road Safety Monitor Page 75Transport Accident Commission
(see p.76) shows totals for these questions compared with self-reported driving competency across the
spectrum of driving confidence. A significantly greater proportion of the following groups rated themselves
‘much better’ drivers compared with those who rated themselves ‘better’ or ‘slightly better’:
Nearly three quarters (73%) of the ‘much better’ driver cohort were males. By comparison, only 27%
of females rated themselves ‘much better’. Females who considered themselves better drivers were
significantly more likely to say they were simply ‘better’ (42%) or ‘slightly better’ (50%).
Machinery operators (16%) or labourers (13%)
Respondents who said the type of car they drove was “everything to me” (15%)
Respondents who disagreed that they would “not get into a car driven by a friend if I thought they
were over the legal blood alcohol limit” (8%). By comparison, 95% of respondents who said they
were ‘slightly better drivers’ would not get in a car driven by friend who they thought was over the
limit.
Those who disagreed that enforcing the speed limit helps lower the road toll (23%). Only 13% of
respondents who consider themselves ‘slightly better’ drivers disagreed with the statement.
A significantly higher proportion of those who agreed it was easy to avoid being caught speeding
(29% ‘much better’ drivers, 24% ‘better’ drivers).
Those who ride motorcycles at least fortnightly (9%), whereas only 5% considered themselves
‘better’ drivers and 3% ‘slightly better’ drivers.
The Social Research Centre

2012 Road Safety Monitor Page 76Transport Accident Commission
Table 41: Self-Reported Driving Competency by Demographic, Behavioural & Attitudes
Much better driver (147)
Better driver (409)
Slightly better driver (275)
a b cGender
Male 73% b,c 58% 50%Female 27% 42% a 50% a
OccupationManagers and administrators 15% 17% 15%Professionals & Associate professionals 19% 31% a,c 22%Technicians and trade workers 16% 15% 16%Clerical and administrative workers 8% 12% 14%Community and personal service workers 3% 8% 9% aSales workers 10% 5% 8%Machinery operators and drivers 16% b,c 7% 8%Labourers and related workers 13% b 6% 9%
Which of the following statements best describes how important the type of car you drive is to you?
The type of car I drive is everything to me 15% b,c 6% 4%The type of car I drive is important to me, but not
everything 49% 41% 35%
I care about the type of car I drive a little, but not too much 15% b,c 28% 34%
I don't mind what type of car I drive 11% 19% 22%I don't care about the type of car I drive at all 10% 7% 6%
I would not get into a car driven by a friend if I thought they were over the legal blood alcohol limit
Total agree 91% 92% 95%Neither 1% 4% 3%Total disagree 8% c 4% 2%
Enforcing the speed limit helps lower the road toll Total agree 75% 76% 78%Neither 2% c 7% 8%Total disagree 23% c 17% 13%
It's easy to avoid being caught speedingTotal agree 29% 24% 18% a,bNeither 17% 21% 20%Total disagree 54% 55% 63%
Forms of transport used at least fortnightly Bus 8% 5% 5%Train 17% 17% c 11%Tram 6% 10% c 4%Walk 42% 45% 48%Ride motorcycle 9% c 5% 3%Ride bicycle 13% 9% 8%No other forms of transport regularly used 36% 34% 41%
The above results suggest that there is an inverse relationship between self-reported driving competence
and some ‘safe driving’ attitudes and behaviours among Victorian Licence holders. The better a licence
holder believes their skills to be in comparison to other drivers on the road, the more likely it is that they
engage in risky behaviours across a range of domains. This finding may have important ramifications for
road safety message penetration, especially in relation to speeding. While cell sizes were small, risky
behaviour was also consistently lower among drivers who considered themselves ‘worse’ than average.
The Social Research Centre

2012 Road Safety Monitor Page 77Transport Accident Commission
10.6 Perceptions of Victoria’s Comparative Road Safety Performance
Based on road toll figures for 12 months leading up to the end of December 2012, Victoria ranked second
behind the ACT in having the least fatalities per 100,000 head of population at 5.0 (1 fatality per 19,980
people). This was just ahead of NSW (5.1 per 100,000). The chart, below demonstrates that the Northern
Territory has by far the worst rate of fatalities per 100,000 people (20.7), followed by WA (7.7) and Tasmania
(6.4).
Figure 38: Road Fatalities per head 100,000 people by State / Territory, Jan-Dec, 2012
When licence holders were asked to judge how they thought Victoria stood in relation to reducing the road
toll in comparison to the rest of Australia:
26% believed that Victoria performed ‘better than average’ in comparison to the rest of Australia.
33% believed that Victoria was ‘about average’.
9% believed that Victoria was ‘worse’ to some degree.
33% were unsure or ‘didn’t know’.
Figure 39: Perceptions of Victoria’s Road toll performance against the rest of Australia
Base: All licence holders (n=1329)Q54 How do you think Victoria stands in reducing the road toll compared to the rest of Australia? Do you think Victoria is…
The Social Research Centre

2012 Road Safety Monitor Page 78Transport Accident Commission
When licence holders were asked to judge how they thought Victoria stood in relation to reducing the road
toll in comparison to leading countries in the world:
46% were unsure or ‘didn’t know’.
21% believed that Victoria performed ‘better’ than the rest of the world.
17% believed that Victoria was ‘about average’.
17% believed that Victoria was ‘worse’
In truth, Victoria’s rate of 5.0 deaths per 100,000 people in 2012 is compares favourably with the rest of the
world (20.8 per 100,000 people in 2010) and most developed countries.
The Social Research Centre

2012 Road Safety Monitor Page 79Transport Accident Commission
The Social Research Centre

2012 Road Safety Monitor Page 80Transport Accident Commission
11. Perceptions of the ‘Safe System’
11.1 Perceptions of the ‘Safe System’ of road safety
The Safe System approach suggests that when the elements of safe vehicles, speeds, roads, and drivers
combine, there is no need for anyone to be killed or severely injured on the roads. In 2012, licence holders
were asked whether they were familiar with the concept of the Safe System and whether they believed it was
achievable.
Overall, the ‘Safe System’ is not a familiar concept for Victorian licence holders, with only 10% of licence
holders indicating that they had previously heard of it. Once explained, licence holders were asked whether
they believed the Safe System was achievable. In total, 43% of licence holders believed the Safe System
was achievable. In terms of demographic differences, a significantly higher proportion of metropolitan
respondents (49% compared with 40% of regional respondents) and younger drivers (50% of 18 to 25 year
olds compared with 41% of 40 to 60 year olds and 40% of 60 to 90 year olds) believe the Safe System
approach is achievable.
The Social Research Centre

2012 Road Safety Monitor Page 81Transport Accident Commission
The Social Research Centre

2012 Road Safety Monitor Page 82Transport Accident Commission
12. Importance of Vehicle to Driver
12.1 Relationship between the importance of vehicle to driver, demographics, attitudes and behaviours.
For some drivers, their vehicles are more than just a means of transportation; they are an extension of their
personality. For such drivers, consideration of their role on the road and attitude to road safety may be
different to the remainder of the driving population. In 2012, participants who completed the online version of
the RSM were asked how important their car was to them. Analysis was then conducted on the difference
between levels of enthusiasm for their car and driving attitudes and behaviours. Results demonstrated that
licence holders placed a wide range of importance on the type of car that they drove with:
6% reporting that their car meant ‘everything’ to them
36% reporting that their car was ‘important but not everything’
28% reporting that they cared about the car they drove ‘a little’
22% reporting that they ‘didn’t mind’ what type of car they drove, and
8% reporting that they ‘didn’t care at all’ about the car they drove
When these groups were collapsed into 3 levels of ‘high importance’ (42%), ‘medium importance’ (28%), and
‘low importance’ (30%), differences in attitudes and behaviours were observed across groups. Primary
differences indicated that drivers who place higher importance on their vehicles:
Were more likely to be male, with 8% reporting “the type of car I drive is everything to me’ compared
with 3% of females.
Reported that drivers should be able to drive at higher speeds in both 60km/h zones, with12%
nominating a speed over 65km/h compared with 4% of ‘low importance’ drivers; and 100km/h zones,
with 30% nominating a speed over 105km/h compared with 21% of ‘low importance’ drivers.
Reported speeding above their personally defined speeding limit both 60km/h and 100km/h zones
more often than other drivers, and;
Were less likely to agree that speeding increases their chances of crashing
Despite this, drivers who placed high levels of importance on their cars were significantly more likely than
other drivers to believe that they were ‘better than average’ drivers (76%) than drivers who placed medium
importance on their cars (67%). Drivers who placed low importance on their cars were least likely to report
that they were ‘better than average’ drivers (58%).
The Social Research Centre

2012 Road Safety Monitor Page 83Transport Accident Commission
Figure 40: Importance of Car to Licence Holder
Base: All licence holders completing online (n=668)Q94 Which of the following statements best describes how important the type of car you drive is to you?
Table 42: Perception of Importance of Car, Demographics, Attitudes and Behaviours
High Importance(271)
Medium Importance(183)
Low Importance(196)
a b c
Age 40.4 39.8 40.3Gender (male) 63% b,c 48% 51%Metro 36% 41% 39%Age of vehicle (=< 10 years) 71% c 65%c 54%Caught speeding in last 12 months 18% 19% 16%How fast people should be allowed in a 60 km/h zone 63km/h c 63km/h 62km/hTravel above this speed at least half the time 14%c 9% 4%How fast people should be allowed in a 100 km/h zone 105km/h c 105km/h 104km/hTravel above this speed at least half the time 19% 14% 12%Agree that speeding increases chances of crashing 77% c 82% 89%Penalties act as a deterrent to speeding 79% 84% 74%Got into a car when driver was over limit 6% 7% 2%Driven a car when over the limit 5% 6% 6%Better than average driver 76% b,c 67% 58%Have fallen asleep while driving in last 12 months 5% 5% 3%Km's per year 21525 22833 21342Been involved in crash in past 5 years 17% 11% 18%
The Social Research Centre

2012 Road Safety Monitor Page 84Transport Accident Commission
The Social Research Centre

2012 Road Safety Monitor Page 85Transport Accident Commission
13. Analysis of Young Adult Attitudinal questions
13.1 Profiling the attitudes and behaviours of younger drivers
To further the TAC’s understanding of the attitudes of younger drivers, online respondents under 25 years of
age were given the option of completing two sets of scaled attitudinal questions. These question sets
covered a range of self-reported driver and general attitudinal behaviours, and asked respondents to rate
their agreement or disagreement with the following questions:
Attitudinal questions Driving behavioural questions
I often do things on the spur of the
moment I drive faster than the rest of the traffic
I have the best fun when I’m with lots of
other friends I take off from traffic lights as fast as I can
Taking risks makes me feel really alive I often overtake cars going slow
I enjoy taking risks I’ll drive closer to the car in front to encourage
them to move out of my way
Having fun means doing things that can
be a bit dangerous I use my hand-held mobile phone while driving
I like things to be unpredictable I prefer to accelerate through an amber light
rather than stop
I prefer to play it safe It isn’t fun to do burn outs
The people I hang out with are sensible
all the time I don’t get into races with other cars
I play by the rules because I know things
can go wrong at any time
I can’t see any point in taking off from traffic
lights as fast as possible
I usually plan things ahead of time I enter curves at a speed that I know is
appropriate and safe
Taking risks makes me feel anxious When I’m driving, I slow down when the roads are wet
I always have to fit in with my friends
I usually only listen to comments that
support what I want to do
I think through the consequences of the
things I’m about to do
The Social Research Centre

2012 Road Safety Monitor Page 86Transport Accident Commission
Respondents answered these questions on an eight point scale from ‘strongly disagree’ (1) to ‘strongly
agree’ (8), ‘risk profiles’ were calculated for each respondent from the mean collective score across all items
in each set. In this calculation, the scales for questions asking for agreement with non-risky behaviours – for
example, “I prefer to play it safe,” and “It isn’t fun to do burn outs” – were reversed, so that higher scores
consistently described agreement with risky attitudes and behaviours.
The mean risk profile score for the ‘attitudinal’ set was 3.9 and the maximum score was 7.1. For the
‘behavioural’ set, the mean risk profile score was 2.9 and the maximum score was 5.5. Because of the small
number of respondents who saw these question (n=129), only two segments of similar proportions were
created for each set:
For the attitudinal set, those with a score between 1 to 4 were classified as ‘low risk’ drivers, and those
with a score between 4 – 7 ‘high risk’ drivers.
For the behavioural set, those with a score between 1 to 3 were classified ‘low risk’ drivers, and those
with a score between 3 – 6 ‘high risk’ drivers.
13.2 The relationship between risk profiles and demographics
While there are a number of risky driving behaviours associated with the respondents who indicated higher
levels of agreement with the attitudinal questions, caution should be used in the interpretation of these
results due to the small base sizes.
As Table 43 shows, respondents under 25 who reported higher levels of agreement with risky attitudes:
Were significantly less likely to agree that they would not get into a car driven by a friend who they
thought was over the limit (82% total agreement compared with 97% of low-risk drivers)
Were significantly less likely to agree that they would be very likely to be caught if they were driving
while over legal BAC limit (53% total agreement compared with 66% of low-risk drivers).
By contrast, while agreement with the dangerous driving behavioural questions was lower overall than the
risky attitudinal set, the young licence holders who reported a higher agreement with the driving behavioural
set were, unsurprisingly, more permissive in their attitude to speeding and alcohol consumption.
In regards to speeding, respondents who reported higher levels of agreement with risky behaviours:
Thought people in 60km/h zones (63.6km/h) and 100km/h zones (105.8km/h) should be allowed to
travel faster than the low-risk group (62.3km/h and 103.0km/h respectively).
Were significantly less likely to agree that speeding increases the chance of crashing (72% compared
with 86% of low-risk younger drivers).
Were significantly less likely to agree that penalties act as a deterrent to speeding (73% compared
with 84% of low risk younger drivers), and
Agreed significantly less that enforcing the speed limit helps lower the road toll (51% compared with
79%).
Attitudes towards the consumption of alcohol and driving were also less strict among this group, with:
The Social Research Centre

2012 Road Safety Monitor Page 87Transport Accident Commission
Only 88% saying they would have no problem with telling a close friend not to drive if they thought
they were over the legal limit, compared with 96% of low-risk drivers.
While a similar (96%) proportion of low-risk drivers would not get in a car driven by friend they thought
was over the limit, only 77% of high-risk drivers agreed or strongly agreed.
They were also significantly less likely to agree that the penalties for drink driving are too lenient (35%)
compared with the low risk group (52%).
Finally, the high-risk behavioural group also rated handheld mobile danger (7.0) and hands free mobile
danger (3.9) significantly lower than the low-risk behavioural group (8.1 and 4.6, respectively).
Table 43: Relationship between risk profile and driving behaviours and attitudes
Attitudinal questions
Driving behaviours
Low-risk (1 - 4
mean)
High-risk (4 - 7
mean)
Low-risk (1 - 3
mean)
High-risk (3 - 5
mean)
How many times caught speeding (mean) 1.2 1.5 1.0 1.5
How fast people should be allowed in a 60 km/h zone 62.6 63.2 62.3 63.6
How fast people should be allowed in a 100 km/h zone 103.8 104.8 103.0 105.8
Agree that speeding increases chances of crashing 86% 78% 86% 72%
If I was to speed the next time I drive, I would have a high chance of being caught (total agree) 64% 55% 62% 56%
Penalties act as a deterrent to speeding (total agree) 80% 75% 84% 73%
Enforcing the speed limit helps lower the road toll (net agree) 71% 65% 79% 51%
I have no problem with telling a close friend not to drive if I thought they were over the legal blood alcohol limit (total agree) 95% 90% 96% 88%
I would not get into a car driven by a friend if I thought they were over the legal blood alcohol limit (total agree) 97% 82% 96% 77%
If I was driving and over the legal limit, I am very likely to be caught (total agree) 66% 53% 61% 57%
The penalties for drink driving are too lenient (total agree) 47% 43% 52% 35%
Handheld mobile phone danger, scale 0 - 10 (mean) 7.7 7.4 8.1 7.0
Hands free mobile phone danger, scale 0 -10 (mean) 4.4 4.1 4.6 3.9
While a number of other risky behaviours were significantly more prevalent in the high-risk groups, due to the
small base sizes they cannot be reported with any statistical confidence.
What does emerge from the limited number of responses obtained is a lax attitude towards the consumption
of alcohol and driving amongst the group displaying generally risky attitudes. This is particularly notable
given the average age of this risky respondent group is 20.7 years; an age that licence holders in Victoria are
restricted to a blood alcohol content of zero while driving. Noting again that while no valid statistical
significance can be attributed to the results due to the low number of responses, more respondents in the
attitudinal high-risk group also reported both driving a car when they thought they were over the limit, as well
and getting into a car with a driver they thought was over the legal limit.
The Social Research Centre

2012 Road Safety Monitor Page 88Transport Accident Commission
As Table 43 above shows, the high-risk driving behaviours group displayed is far more permissive across a
range of risky behaviours, including speed. When asked, these respondents were also significantly more
likely than low risk respondents to nominate whether or not they have passengers in the car (mean score of
3.4 out of 5) and whether they were late or in a hurry (mean score of 3.8 out of 5) as influencing the speed at
which they drove compared with the low risk cohort (rating them mean scores of 2.9 and 3.3 respectively).
Although more permissive, there was no significant difference between the high and low risk groups’ self-
reported driving competence, with two percentage points dividing them (high risk, 51% at all better than
average; low risk, 49% at all better than average).
The Social Research Centre

2012 Road Safety Monitor Page 89Transport Accident Commission
Appendix 1 – Questionnaires
The Social Research Centre

2012 Road Safety Monitor Page 90Transport Accident Commission
Metro Questionnaire
The Social Research Centre
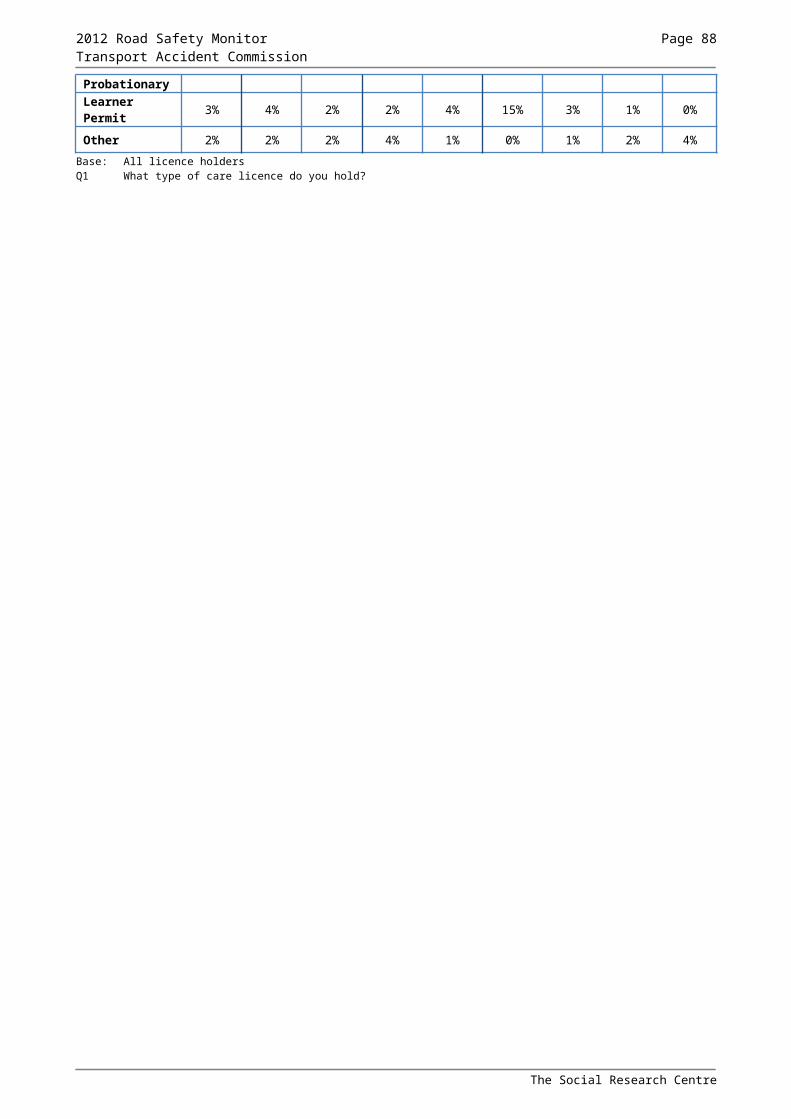
2012 Road Safety MonitorTransport Accident Commission
Regional Questionnaire
The Social Research Centre

2012 Road Safety Monitor Transport Accident Commission
Online Questionnaire
The Social Research Centre
2012 Road Safety Monitor Transport Accident Commission
Programming Instructions: Please ensure font size is at least 11 point and consistent style and colour (that is, same colour for
questions and answers). Please do not include section headings on screen. Please take note where text has been bolded and put in italics, we would like it to appear like this on
screen, or a similar appropriate font alteration to make this text stand out. Programming instructions are in brackets and capitals. For grid questions, please lightly shade every second line. No randomization to be applied to response frames We welcome feedback on structure and wording should the programmer notice anything that they
think won’t work so well, or anything else that can be done to result in a positive respondent experience with the survey process.
Please note page breaks. It will be necessary to group some questions onto the same page. Where there is more than one question on a page, please include a line between the two or
adequate space so that it can be seen that they are separate questions. Please include a small version of the SRC logo on screen. All questions are single response unless otherwise specified. Can you show question numbers for the test version but not in the final live version? Error messages: Please start error message with “Please don’t use the back button, but you have
missed ..... Please complete the question where highlighted below and then click next”. For “ranking” questions, assign a hidden letter per item e.g. a) power steering etc. according to its
position in the code frame
The Social Research Centre

2012 Road Safety Monitor Transport Accident Commission
*(Intro and login screen)
Thank you for agreeing to take part in this survey on behalf of the Transport Accident Commission. This research is conducted by the Social Research Centre on behalf of the Victorian Transport Accident Commission (TAC).
The results of this research will be used to assist the TAC in understanding aspects of road safety, in order to work towards developing improvements in this area.
The survey should take approximately 15 minutes to complete.
The information you provide will remain completely confidential and will not identify you in any way.
As a thank-you for your time, everyone who completes and returns this survey will go into a draw for one of 6 x $250 cash prizes. If you complete the survey online you also enter an additional draw for one cash prize of $500.
Please enter in the user name and password from the front of your letter to continue.
User name:
Password:
If you have misplaced your username or experience any difficulty completing the survey, please call the Social Research Centre on 1800 036 090 (freecall) or email [email protected] and they will be able to assist you.
For further information, frequently asked questions and prize draw terms and conditions, please click here.
Please note that if you are unable to finish the survey in one sitting, you are able to re-enter and complete the survey at a time that is more convenient.
Please use the back button within the survey to navigate. Please do not use the browser back button.
The Social Research Centre

2012 Road Safety Monitor Transport Accident Commission
*(Initial Demographics)
This survey is designed specifically for the person listed in the letter we sent regarding this survey. If you are not this person, some of the questions within this survey may not be relevant. Please only fill in this form if you are the person named in the letter.
----------------------------------------------------- PAGE BREAK -----------------------------------------------------*(ALL) (PAPER Q1)Q1.1 First we have a few questions about you personally. They are for statistical purposes only to make
sure we have contacted a good cross section of people.What type of car license do you hold?Please select just one response only.1. Full license2. Red Probationary3. Green Probationary4. Learner permit5. Other (please specify)6. None
*(ALL) (PAPER Q2)Q1.2 How old are you? (Write in years)
1. |_______|years
----------------------------------------------------- PAGE BREAK -----------------------------------------------------
*(ALL)Q1.2a What is the postcode of your household?.
1. Postcode2. Don’t know (please type in suburb) (SPECIFY)3. I’d prefer not to say
----------------------------------------------------- PAGE BREAK -----------------------------------------------------
*(ALL) (PAPER Q3)Q1.3 Please record your gender.
4. Male5. Female
*(ALL) (PAPER Q4)Q1.4 What is your current employment status?
1. Employed full-time2. Employed part-time or casual3. Self-employed4. Student (GO TO Q1.6)5. Unemployed (GO TO Q1.6)6. Home duties (GO TO Q1.6)7. Retired (GO TO Q1.6)8. Other (GO TO Q1.6)
----------------------------------------------------- PAGE BREAK -----------------------------------------------------
The Social Research Centre

2012 Road Safety Monitor Transport Accident Commission
*(IF IN PAID EMPLOYMENT) (Q1.4 = 1 OR 2 OR 3) (PAPER Q5)Q1.5 How would you describe your occupation? Please roll your cursor over each option to see a full
description (USE ROLL-OVERS AS PER LAST TIME)
1. Managers and administratorsHospitality, retail and service managers, Specialist managers, Farmers and farm managers, Chief executives, General managers and legislators
2. Professionals & Associate professionalsLegal, social and welfare professionals, ICT professionals, Health professionals, Education professionals, Design, engineering, science and transport professionals, Business, human resource and marketing professionals, Arts and media professionals
3. Technicians and trade workersOther technicians and trades workers, Skilled animal and horticultural workers, Food trades workers, Electro-technology and telecommunications trades workers, Construction trades workers, Automotive and engineering trades workers, Engineering, ICT and science technicians
4. Clerical and administrative workersOther clerical and administrative workers, Clerical and office support workers, Numerical clerks, Inquiry clerks and receptionists, General clerical workers, Personal assistants and secretaries, Office managers and program administrators
5. Community and personal service workersSports and personal service workers, Protective service workers, Hospitality workers, Carers and aides, Health and welfare support workers
6. Sales workersSales support workers, Sales assistants and salespersons, Sales representatives and agents
7. Machinery operators and driversStore person, Road and rail drivers, Mobile plant operators, Machine and stationary plant operators
8. Labourers and related workers Food preparation assistants, Farm, forestry and garden workers, Factory process workers, Construction and mining labourers, Cleaners and laundry workers
9. Other (describe) NEED SPACE FOR TEXT BOX HERE10. I’d prefer not to say
----------------------------------------------------- PAGE BREAK -----------------------------------------------------
The Social Research Centre

2012 Road Safety Monitor Transport Accident Commission
*(ALL) (PAPER Q6)Q2.1 What do you think are the three main factors that most often lead to serious road accidents?
Please number the boxes from 1 to 3.
1. Young drivers2. Alcohol3. Distraction from using mobile phones, MP3 players, GPS etc.4. Other distractions5. Driver Inexperience6. Drugs 7. Road conditions/ design8. Speed9. Tiredness/ fatigue10. Road rage / impatience / aggressive driving11. Weather conditions12. Poor vehicle maintenance13. Disregard for road rules / reckless driving14. Older drivers15. Other (please specify)
----------------------------------------------------- PAGE BREAK -----------------------------------------------------
*(ALL) (PAPER Q7)Q2.2 Have you been caught speeding in the last 12 months (either by police or a fixed/mobile camera)?
Please select one response only.1. Yes2. No – GO TO Q2.3a3. I’d prefer not to say – GO TO Q2.3a
----------------------------------------------------- PAGE BREAK -----------------------------------------------------
*(CAUGHT SPEEDING) (Q2.2=1) (PAPER Q8)Q2.3 How many times have you been caught speeding in the last 12 months?
1. (2 DIGITS) |___|___|2. I’d prefer not to say
----------------------------------------------------- PAGE BREAK -----------------------------------------------------
*(ALL) (PAPER Q9)Q2.3a How many demerit points have you received in the last three years for traffic offences?
1. (2 DIGITS) |___|___|2. Don’t know3. I’d prefer not to say
----------------------------------------------------- PAGE BREAK -----------------------------------------------------
The Social Research Centre

2012 Road Safety Monitor Transport Accident Commission
*(ALL) (PAPER Q10)Q2.4
How fast should people be allowed to drive in a 60km/h zone without being booked for speeding?
1. (3 DIGITS) |___|___|___|km PROGRAMMER RANGE 55 - 1002. Don’t know
----------------------------------------------------- PAGE BREAK -----------------------------------------------------
*(ALL) (PAPER Q11)Q2.5 When you have the opportunity, how often do you travel at or above <PROGRAMMER INSERT
RESPONSE FROM Q2.4=1> in a 60km/h zone? Please select one response only.1. None of the time2. Some of the time (Less than half but not never)3. About half the time (50%)4. Most of the time, or (More than half but not all)5. All of the time6. Don’t know
----------------------------------------------------- PAGE BREAK -----------------------------------------------------
*(ALL) (PAPER Q12)Q2.6
How fast should people be allowed to drive in a 100km/h zone without being booked for speeding?1. (3 DIGITS) |___|___|___|km 2. Don’t know
----------------------------------------------------- PAGE BREAK -----------------------------------------------------
*(ALL) (PAPER Q13)Q2.7 When you have the opportunity, how often do you travel at or above <PROGRAMMER INSERT
RESPONSE FROM Q2.6=1> in a 100km/h zone?Please cross one response only.1. None of the time2. Some of the time (Less than half but not never)3. About half the time (50%)4. Most of the time, or (More than half but not all)5. All of the time6. Don’t know
----------------------------------------------------- PAGE BREAK -----------------------------------------------------
The Social Research Centre
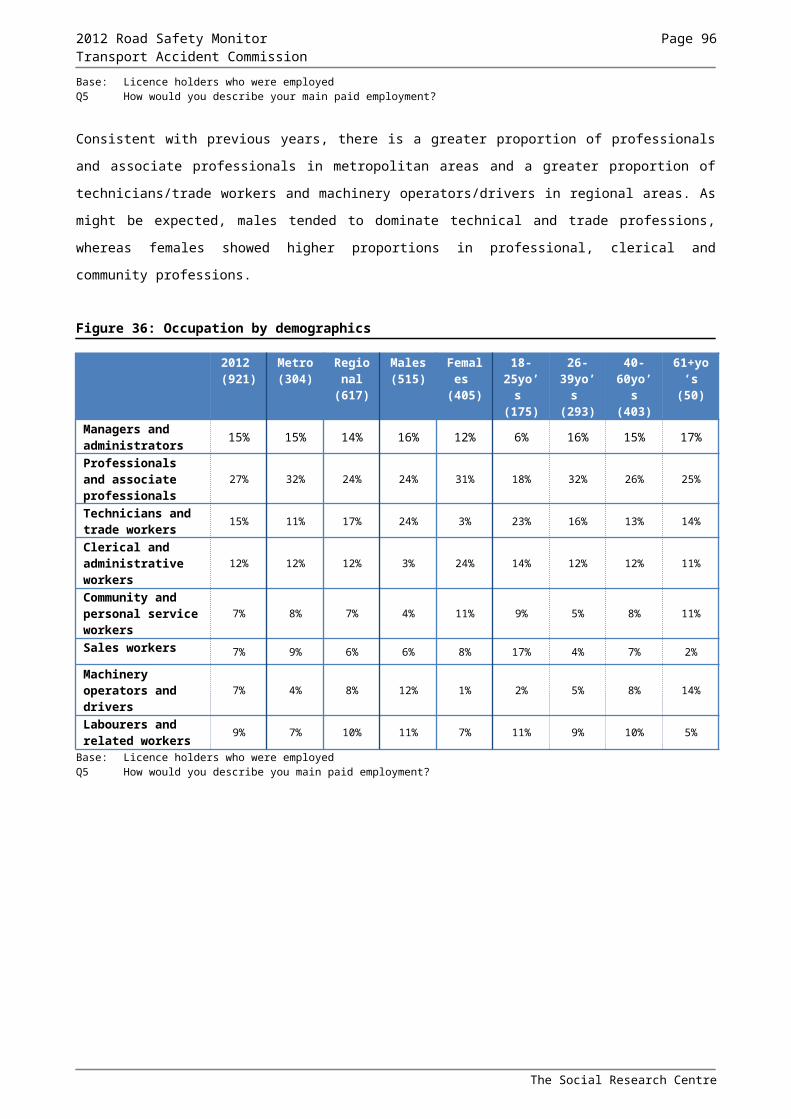
2012 Road Safety Monitor Transport Accident Commission
*(ALL) (PAPER Q14)Q2.8 On a scale of 1 to 5, where 1 is “Strongly disagree” and 5 is “Strongly agree”, to what extent do you
agree or disagree with the following statements Please select one answer per row
Stro
ngly
di
sagr
ee
Som
ewha
t di
sagr
ee
Nei
ther
Som
ewha
t ag
ree
Stro
ngly
ag
ree
Don
’t kn
ow
1 2 3 4 5 6a)
Speeding significantly increases my chances of crashing 1 2 3 4 5 6
b)
If I was to speed the next time I drive, I would have a high chance of being caught
1 2 3 4 5 6
c)
Penalties for speeding act as a deterrent when I’m driving 1 2 3 4 5 6
d)
Enforcing the speed limit helps lower the road toll 1 2 3 4 5 6
e)
It’s easy to avoid being caught speeding 1 2 3 4 5 6
----------------------------------------------------- PAGE BREAK -----------------------------------------------------
*(IF Q2.8e-4,5 CONTINUE ELSE GO TO Q2.9) (PAPER Q15)Q2.8a Why do you say that it is easy to avoid being caught speeding?
(TEXT BOX) ----------------------------------------------------- PAGE BREAK -----------------------------------------------------
*(ALL) (PAPER Q16)Q2.9 Now thinking about how fast or slow you travel when you are driving; what factors influence your driving speed? Please score each item from 1 to 5 where 1 is not important at all and 5 is very important
Score out of 5
The speed limit
The road conditions (gravel, paved, quality of the road surface, road design, etc)
The weather conditions (wet, windy, foggy etc)
My chances of being caught speeding
The speed of other traffic
The volume of traffic on the particular road
Whether or not I have passengers in my car
If late/in a hurry
----------------------------------------------------- PAGE BREAK ----------------------------------------------
The Social Research Centre

2012 Road Safety Monitor Transport Accident Commission
*(Drink Driving)
*(ALL) (PAPER Q17)Q3.1 The next set of questions relate to driving under the influence of alcohol and other drugs. Please be
honest in your answers and remember that your responses will be completely confidential.
Over the past 12 months have you been breath tested or been in a car when the driver was breath tested?
1. Yes2. No - GO TO Q3.33. Don’t know - GO TO Q3.3
----------------------------------------------------- PAGE BREAK -----------------------------------------------------
*(BREATH TESTED) (Q3.1=1) (PAPER Q18)Q3.2 Approximately on how many occasions in the last 12 months have you been breath tested or been
in a car when the driver was breath tested?1. (2 DIGITS) |___|___|2. Don’t know
----------------------------------------------------- PAGE BREAK -----------------------------------------------------
*(ALL) (PAPER Q19)Q3.3 Over the last 12 months have you been drug tested or been in a car when the driver was drug
tested?Please cross one response only.1. Yes2. No – GO TO Q3.53. Don’t know – GO TO Q3.5
----------------------------------------------------- PAGE BREAK -----------------------------------------------------
(DRUG TESTED) (Q3.3=1) (PAPER Q20)Q3.4 What type of drug test was it?
1. (VERBATIM BOX)
----------------------------------------------------- PAGE BREAK -----------------------------------------------------
*(ALL) (PAPER Q21)Q3.5 Have you ever gotten into a car in the last 12 months when you knew or thought the driver was over
the legal blood alcohol limit? Please select one response only.1. Yes2. No – GO TO Q3.73. Don’t know – GO TO Q3.7
----------------------------------------------------- PAGE BREAK -----------------------------------------------------
*(IN CAR WITH DRIVER OVER LIMIT) (Q3.5=1) (PAPER Q22)
The Social Research Centre

2012 Road Safety Monitor Transport Accident Commission
Q3.6 What was the main reason you got into a car when you knew or thought the driver was over the legal blood alcohol limit?Please write in your answer in the box below1. (VERBATIM BOX)2. Don’t know
----------------------------------------------------- PAGE BREAK -----------------------------------------------------
*(ALL) (PAPER Q23)Q3.7 During the last 12 months, have you driven a car when you knew or thought you were over the legal
blood alcohol limit?
1. Yes2. No - GO TO Q3.93. I’d prefer not to say - GO TO Q3.94. Not applicable (I do not drink alcohol) - GO TO Q3.13
----------------------------------------------------- PAGE BREAK -----------------------------------------------------
*(DROVE OVER LIMIT) (Q3.7=1) (PAPER Q24)Q3.8 What was the main reason for you driving a car when you knew or thought you were over the legal
blood alcohol limit?
1. (VERBATIM BOX)2. I’d prefer not to say
----------------------------------------------------- PAGE BREAK -----------------------------------------------------
*(Q3.7=1-3) (PAPER Q25)Q3.9 Do you drink alcohol?
Please select one response only.1. Yes2. No (GO TO Q3.13)
----------------------------------------------------- PAGE BREAK -----------------------------------------------------
*(DRINKS ALCOHOL) (Q3.9=1) (PAPER Q26)Q3.10 Now if for some reason you were to drive while over the legal blood alcohol limit, what would worry
you the most?
1. Having a crash2. Injuring/killing yourself3. Hurting/killing someone else4. Getting stopped by the police5. Being fined or losing licence6. Going to Jail / prison7. Nothing would worry me8. Other (please specify) 9. Don’t know
----------------------------------------------------- PAGE BREAK -----------------------------------------------------
*(DRINK ALCOHOL) (Q3.9=1) (PAPER Q27)
The Social Research Centre
2012 Road Safety Monitor Transport Accident Commission
Q3.11 In the next two questions, please think about the last time you went out (not at home) and drank alcohol.Did you decide how you would get home…? Please select one response only.1. Before you started drinking 2. After you started drinking3. Can’t remember
*(DRINK ALCOHOL) (Q3.9=1) (PAPER Q28)Q3.12 Which one of the following best describes your journey home after drinking on that occasion?
Please select one response only.1. Drove but limited my alcohol consumption so I was confident I was under the legal limit2. Drove but waited long enough between drinking and driving to be sure I was under the legal
limit3. Drove and was likely to have been over or close to the legal limit4. Used public transportation5. Got a taxi6. Got a lift7. Walked8. Rode a bicycle9. Someone else was driving me home10. Other (please specify)11. Don’t know
----------------------------------------------------- PAGE BREAK ----------------------------------------------------- *(ALL) (PAPER Q29)Q3.13 To what extent do you agree or disagree with the following statements, using a scale of 1 to 5,
where 1 is “Strongly disagree” and 5 is “Strongly agree”
Stro
ngly
di
sagr
ee
Som
ewha
t di
sagr
ee
Nei
ther
Som
ewha
t ag
ree
Stro
ngly
ag
ree
Don
’t kn
ow
1 2 3 4 5 6
a)
I have no problem with telling a close friend not to drive if I thought they were over the legal blood alcohol limit
1 2 3 4 5 6
b)
I would not get into a car driven by a friend if I thought they were over the legal blood alcohol limit
1 2 3 4 5 6
c)
If I was driving and over the legal limit, I am very likely to be caught 1 2 3 4 5 6
d)
The penalties for drink driving are too lenient 1 2 3 4 5 6
----------------------------------------------------- PAGE BREAK -----------------------------------------------------
*(Fatigue)
*(ALL) (PAPER Q30)
The Social Research Centre
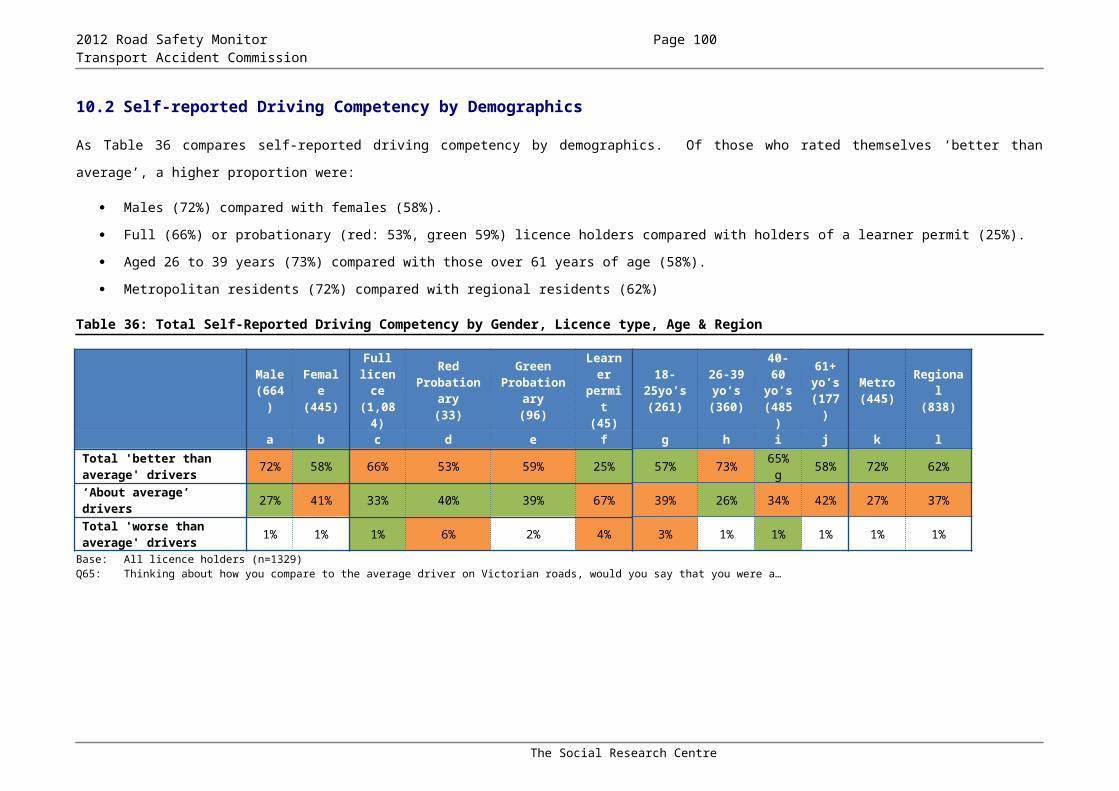
2012 Road Safety Monitor Transport Accident Commission
Q4.1 On a scale of 1 to 5, where 1 is “Strongly disagree” and 5 is “Strongly agree”, to what extent do you agree or disagree with the following statements?
Stro
ngly
di
sagr
ee
Som
ewha
t di
sagr
ee
Nei
ther
Som
ewha
t ag
ree
Stro
ngly
ag
ree
Don
’t kn
ow
1 2 3 4 5 6a)
Driving while tired can be as dangerous as drink driving 1 2 3 4 5 6
b)
The only remedy for fatigue while driving is stopping the car and resting
1 2 3 4 5 6
----------------------------------------------------- PAGE BREAK -----------------------------------------------------*(ALL) (PAPER Q31)Q4.2 If you’re feeling tired when driving, what do you normally do?
INSERT TWO LINES FOR FREE TEXT
*(ALL) (PAPER Q32)Q4.3 In the last 12 months, have you ever fallen asleep while driving?
1. Yes 2. No (GO TO Q5.1)3. Don’t know (GO TO Q5.1)
------------------------------------------------------ PAGE BREAK -----------------------------------------------------
*(Q4.3=1) (PAPER Q33)Q4.4 Can you tell us what happened when you fell asleep? What were the circumstances?
INSERT TWO LINES FOR FREE TEXT
----------------------------------------------------- PAGE BREAK -----------------------------------------------
*(Restraint Wearing)
*(ALL) (PAPER Q34)Q5.1 When you drive a car (or other vehicle) do you wear a seatbelt...?
Please select one response only.1. None of the time 2. Some of the time 3. About half of the time4. Most of the time, or5. All the time 6. I’d prefer not to say
----------------------------------------------------- PAGE BREAK -----------------------------------------------
*(ALL) (Q35)
The Social Research Centre

2012 Road Safety Monitor Transport Accident Commission
Q5.5 On a scale of 1 to 5, where 1 is “Strongly disagree” and 5 is “Strongly agree”, to what extent do you agree or disagree with the following statements? Please select one answer per row
Stro
ngly
di
sagr
ee
Som
ewha
t di
sagr
ee
Nei
ther
Som
ewha
t ag
ree
Stro
ngly
ag
ree
Don
’t kn
ow
1 2 3 4 5
a)
Wearing a seatbelt will significantly reduce my chances of serious injury in the event of a crash.
1 2 3 4 5 6
b)
I only wear a seatbelt because I am required to do so by law. 1 2 3 4 5 6
c)
If I am not wearing a seatbelt it is very likely that I will be pulled over by the police.
1 2 3 4 5 6
d)
If in a crash, it is important that others in the car are wearing a seatbelt to minimise my personal injury
1 2 3 4 5 6
----------------------------------------------------- PAGE BREAK ----------------------------------------------
*(Mobile Phones)
*(ALL) (PAPER Q36)Q6.1 During the last month, have you used a HANDHELD mobile phone (including using the inbuilt
speaker)…Please note: Handheld means the phone is in your hand whilst drivingPlease select one answer per row
Yes Noa) To answer a call while stopped at the lights 1 2
b) To read a text message while stopped at the lights 1 2
c) To make a call while stopped at the lights 1 2
d)
To write and send a text message while stopped at the lights 1 2
e)
To answer the phone while driving but I put the phone on my lap and use the in-built speaker 1 2
f)
To make a call while driving but put the phone on my lap and use the in-built speaker 1 2
g) To read a text message while actively driving 1 2
h) To write a text message while actively driving 1 2
The Social Research Centre

2012 Road Safety Monitor Transport Accident Commission
i) To answer a call while actively driving 1 2
j) To make a call while actively driving 1 2
----------------------------------------------------- PAGE BREAK ----------------------------------------------
*(ALL) (PAPER Q37)Q6.2 When you use your phone to make or answer calls while driving, what do you normally do…?
Please select one Yes
e I hold the phone to my ear □b) I hold the phone away from my ear □
c) I put the phone in my lap or on the console □
e I only use a hands free kit such as Bluetooth □e) I never make or answer calls while driving □
----------------------------------------------------- PAGE BREAK ----------------------------------------------
*(ALL) (PAPER Q38)Q6.3 Do you use your mobile phone for anything else while driving?
1. Yes I…(TEXT BOX)2. I don’t use my mobile phone for anything else while driving.3. I don’t use my mobile phone at all while driving
----------------------------------------------------- PAGE BREAK ----------------------------------------------
*(ALL) (PAPER Q39)Q6.4 Using a scale where 0 is not at all dangerous and 10 is extremely dangerous, how dangerous do you
think it is to drive while using a handheld mobile phone (not HANDSFREE)?
1. (2 DIGITS) |___|___| (VALIDATE 0 TO 10) 2. Don’t know
----------------------------------------------------- PAGE BREAK ----------------------------------------------
*(ALL) (PAPER Q40)Q6.5 During the last month, have you used a HANDS FREE mobile phone whilst driving?
That is, used your mobile phone through some secondary device (like a headset, separate speaker system, voice controls through your phone, or the radio. This does NOT include the inbuilt speaker on your phone), so that you don’t have the phone in your hand. Please select one response only.1. Yes2. No3. Don’t know
The Social Research Centre

2012 Road Safety Monitor Transport Accident Commission
----------------------------------------------------- PAGE BREAK ----------------------------------------------
*(ALL) (PAPER Q41)Q6.6 Using a scale where 0 is not at all dangerous and 10 is extremely dangerous, how dangerous do you
think it is to drive while using a hands free mobile phone?
Please enter number from 0 to 101. (2 digits) |___|___| 2. Don’t know
----------------------------------------------------- PAGE BREAK ----------------------------------------------
*(ALL) (PAPER Q42)Q6.7 Do you ever use a GPS or Electronic Navigation device in your car?
This is including either factory fit, built in or portable devices (including part of your phone). Please select one response only.1. Yes2. No (GO TO Q7.1)----------------------------------------------------- PAGE BREAK ----------------------------------------------
(Q6.7=1) (PAPER Q43)
Q6.8 The GPS or Electronic Navigation device I use in my car is…
Please select one answer per rowYes
a) Factory installed □b) A portable device □c) A feature of my mobile phone □d) Don’t know □
----------------------------------------------------- PAGE BREAK ----------------------------------------------
(Q6.7=1) (PAPER Q44)
Q6.9 How do you use the GPS or Electronic Navigation device…?
Please select one answer per rowYes No
a)
Rely on voice prompts only without looking at the screen 1 2
b) Look at the screen 1 2
The Social Research Centre

2012 Road Safety Monitor Transport Accident Commission
c) Touch the GPS to make adjustments 1 2
----------------------------------------------------- PAGE BREAK ----------------------------------------------
*(Driver History)
*(ALL) (PAPER Q45)Q7.1 In the past five years, have you been involved in any road accidents as a driver (car, truck, bus)
regardless of who was at fault? (This does not include minor accidents, car parks and driveways or as a rider of a bicycle or motorcycle) Please select one response only.1. Yes2. No - GO TO Q7.7
----------------------------------------------------- PAGE BREAK ----------------------------------------------
*(IN ACCIDENT) (Q7.1=1) (PAPER Q46)Q7.2 Did anyone involved in the accident(s) sustain personal injury?
If you have had more than one accident, it would be personal injury in ANY accidents in the last five years.1. Yes2. No - GO TO Q7.73. Don’t know/can’t remember - GO TO Q7.7
----------------------------------------------------- PAGE BREAK ----------------------------------------------
*(IN ACCIDENT WITH INJURY) (Q7.2=1) (PAPER Q47)Q7.3 Thinking about the most recent crash in which you were a driver and someone required medical
treatment…When did that crash occur?1. Within the last 12 months2. 1 to 5 years ago3. Don’t know/can’t remember
----------------------------------------------------- PAGE BREAK ----------------------------------------------
*(IN ACCIDENT WITH INJURY) (Q7.2=1) (PAPER Q48)Q7.4 Who do you believe was at fault in this most recent crash?
Please select one response only1. I was at fault2. Another party was at fault3. Both myself and another party were at fault4. No-one was at fault5. No other vehicles were involved6. Other (Text box)7. Don’t know/can’t remember
----------------------------------------------------- PAGE BREAK ----------------------------------------------
*(IN ACCIDENT WITH INJURY) (Q7.2=1) (PAPER Q49)Q7.5 What sort of treatment did the injured person require, if any?
Select all that apply
The Social Research Centre

2012 Road Safety Monitor Transport Accident Commission
1. Admitted to a hospital (in a ward)2. Went to Emergency3. Treated by ambulance at the scene4. Went to a doctor5. Saw a physiotherapist/chiropractor or similar6. Admitted to a rehabilitation facility7. Other (Text box)8. Prefer not to say9. None10. Don’t know
----------------------------------------------------- PAGE BREAK ----------------------------------------------
*(IN ACCIDENT WITH INJURY) (Q7.2=1) (PAPER Q50)Q7.6 Have you personally received any compensation or income support as a result of injuries received
as a result of a transport accident (excluding injuries while riding a bicycle or motorcycle or as a pedestrian)?Select one onlyDid you receive compensation from:1. TAC2. WorkSafe/WorkCover3. Comcare4. Personal insurance organisation (e.g. health insurance, income protection)5. Property/vehicle insurance organisation6. Centrelink (e.g. Disability Support Pension or Sickness Allowance)7. Other (Text box)8. No, I have never received compensation9. I’d prefer not to say
----------------------------------------------------- PAGE BREAK ----------------------------------------------
*(ALL)Q7.7 Have you heard about the safe system approach to road safety?
1. Yes 2. No 3. Don’t know.
----------------------------------------------------- PAGE BREAK ----------------------------------------------
*(ALL)Q7.8 The Safe System approach has an underlying philosophy that 'nobody need be killed or injured on
Victoria's roads' based on the four pillars of safer road users on safer roads with safer speed limits and in safer vehicles. Do you believe this is achievable?
1. Yes, I think this is achievable 2. No, I don’t think this is achievable
----------------------------------------------------- PAGE BREAK ----------------------------------------------
*(ALL)Q7.9 Why do you think this?
TEXT BOX
----------------------------------------------------- PAGE BREAK ----------------------------------------------
The Social Research Centre

2012 Road Safety Monitor Transport Accident Commission
*(ALL)Q7.10 How do you think Victoria stands in reducing the road toll compared to the rest of Australia? Do you
think Victoria is:
1. Much better 2. Better3. Slightly better4. About average5. Slightly worse6. Worse7. Much worse8. Unsure / Don’t know
----------------------------------------------------- PAGE BREAK ----------------------------------------------
*(ALL)Q7.11 How do you think Victoria stands in reducing the road toll compared with leading countries around
the world (e.g. Germany, Great Britain, Sweden etc.)? Do you think Victoria is:
1. Much better 2. Better3. Slightly better4. About average5. Slightly worse6. Worse7. Much worse8. Unsure / Don’t know
*(ALL)Q7.12 What do you think Victoria should do to reduce the road toll?
Text box
----------------------------------------------------- PAGE BREAK ----------------------------------------------
*(Vehicles)
*(ALL) (ONLINE ONLY)Q8.0 Some people really love their cars and are very loyal to the brands and type of car they drive. Which
of the following statements best describes how important the type of car you drive is to you?
1. The type of car I drive is everything to me2. The type of car I drive is important to me, but not everything3. I care about the type of car I drive a little, but not too much4. I don’t mind what type of car I drive5. I don’t care about the type of car I drive at all
----------------------------------------------------- PAGE BREAK ----------------------------------------------
*(ALL) Q8.1 Are you planning to purchase a car in future? This can be a new car or a used car.
1. Yes, in the next 12 months2. Yes, after 12 months
The Social Research Centre

2012 Road Safety Monitor Transport Accident Commission
3. No, not planning to purchase a car in the future - GO TO Q8.64. Have not decided yet – GO TO Q8.6
----------------------------------------------------- PAGE BREAK -----------------------------------------------------
*(PLANNING TO BUY IN FUTURE) (Q8.1=1 OR 2) Q8.2 Do you intend to buy a new or a used car?
Please select one response only.1. New car2. Used car3. Haven’t decided yet
*(PLANNING TO BUY IN FUTURE) (Q8.1=1 OR 2)Q8.2a What do you think your budget range is likely to be?
1. Under $25002. Between $2500-$5,0003. $5,000-$10,0004. $10,000-$15,0005. $15,000-$20,0006. $20,000-$25,0007. $25,000-$30,0008. $30,000-$40,0009. $40,000-$50,00010. $50,000-$60,00011. Over $60,00012. I don’t know13. I’d prefer not to say
----------------------------------------------------- PAGE BREAK -----------------------------------------------------
*(PLANNING TO BUY IN FUTURE) (Q8.1=1 OR 2)Q8.3 Below is list of factors that could be considered when buying a car.
Once you have decided on your budget, please give each of the factors a score out of five (with 1 being not at all important and 5 being very important)
Score out of 5
Condition of the vehicle/roadworthiness/low kilometres/mileage/reliability
Features of vehicle (e.g., air conditioning, power steering, CD Player)
Fuel economy /fuel cost
Manufacturer (e.g, Toyota, Ford)
Power/performance
Safety features of the vehicle (e.g., ABS, airbags, ESC, stability control)
Size of vehicle
The Social Research Centre

2012 Road Safety Monitor Transport Accident Commission
Style/appearance/image
Transmission type (manual/automatic)
Type of vehicle (sports, sedan, wagon, 4WD, ute, body type)
----------------------------------------------------- PAGE BREAK -----------------------------------------------------
*(PLANNING TO BUY IN FUTURE) (Q8.1=1 OR 2) Q8.4 Below is list of safety features that could be considered when buying a car. From this list, please
give each of the features a score out of five (with 1 being not at all important and 5 being very important)
Score out of 5
ABS brakes
Adaptive cruise control
Autonomous Emergency Braking
Driver and passenger frontal airbags
Lane departure warning systems
Rear parking aids
Side airbags (Torso)
Side curtain airbags (Head Protecting)
Stability Control (also known as (ESC)/ Electronic Stability Control/ (ESP) Electronic Stability Program /(DSC) Dynamic Stability Control)
Traction control
*(PLANNING TO BUY IN FUTURE) (Q8.1=1 OR 2)Q8.5 Will you consider crash test results or safety ratings before you purchase your next car?
This includes ANCAP, used car safety ratings and 5 star ratingsPlease select one response only.1. Yes 2. No3. Don’t know
----------------------------------------------------- PAGE BREAK -----------------------------------------------------
*(ALL) Q8.6 If you were looking for information about the vehicle safety features that are available on a car,
where would you look? Please select all that apply1. Internet2. Newspapers3. Magazines4. Family member/friend5. Car dealers6. RACV (Including Royal Auto)7. Other (please specify)
----------------------------------------------------- PAGE BREAK -----------------------------------------------------
The Social Research Centre

2012 Road Safety Monitor Transport Accident Commission
*(ALL)
Q8.7 Are you aware of the ‘How Safe is Your Car’ website?
1. Yes2. No
----------------------------------------------------- PAGE BREAK -----------------------------------------------------
*(Additional Demographics)
The following questions are to help group your responses with other people.
Q9.0 Thinking about how you compare to the average driver on Victorian Roads, would you say that you are a…
1. Much better driver2. Better driver3. Slightly better driver4. About average driver5. Slightly worse driver6. Worse driver7. Much worse driver8. Unsure / Don’t know
----------------------------------------------------- PAGE BREAK -----------------------------------------------------
*(ALL) Q9.1 How many people aged 18 and over, including yourself, live in your household?
Please do not include other family members who do not live at home1. (3 DIGITS) |___|___|___|2. I’d prefer not to say
----------------------------------------------------- PAGE BREAK -----------------------------------------------------
*(MORE THAN ONE 16+ PERSON HOUSEHOLD) (Q9.1=>1)Q9.2 How many of the people in your household, including yourself, have a current Victorian Drivers
Licence? (RECORD NUMBER) This includes learners’ permits and probationary licenses1. (3 DIGITS) |___|___|___| 2. Not sure – but definitely one or more3. Don’t know if any do – possibly none
----------------------------------------------------- PAGE BREAK -----------------------------------------------------*(ALL) Q9.3 How many of each of the following types of registered vehicles are there at your home address?
If none, please record as zero
Record Number(3 DIGITS)
Don’t know
a Cars (anything that you can |___|___|___| 3
The Social Research Centre

2012 Road Safety Monitor Transport Accident Commission
) drive with a standard car licence)
b)
Trucks or buses (where you need a special licence) |___|___|___| 3
c) Motorbikes |___|___|___| 3
----------------------------------------------------- PAGE BREAK -----------------------------------------------------
*(ALL)Q9.4 Which of the following statements best describes the car (not motorcycle or truck) you usually drive?
(Please note that personally owned includes cars that are under finance or leased)Please select one response only.1. I personally own the car that I usually drive 2. The car that I usually drive is owned by someone else in my household3. I usually drive a company car but also have my own personal car4. I only drive a company car and do not own a car personally5. I do not personally own a car but hire or borrow one as needed6. I do not own a car and do not ever drive a car (GO TO Q9.10)
----------------------------------------------------- PAGE BREAK -----------------------------------------------------
*(Q9.4=1-5)
Q9.5 What type of car do you usually drive? Write in make, model and year of manufacture.
Make:........................................................................
Model:.......................................................................
Year:.........................................................................
----------------------------------------------------- PAGE BREAK -----------------------------------------------------
*(Q9.4=1-5)Q9.6 In a typical year, how many kilometres would you drive for any reason?
An approximate number is OK1. (6 DIGITS) |___|___|___|___|___|___|km 2. Don’t know
*(Q9.4=1-5)Q9.7 And In a typical week how many kilometres would you drive for any reason?
An approximate number is OK1. (6 DIGITS) |___|___|___|___|___|___|km2. Don’t know
----------------------------------------------------- PAGE BREAK -----------------------------------------------------
*(EMPLOYED) (Q1.4=1-3) OTHERWISE GO TO Q9.10 Q9.8 How often do you drive a vehicle for work related purposes (not including driving to and from work)?
1. Daily2. A few times a week
The Social Research Centre

2012 Road Safety Monitor Transport Accident Commission
3. About once a week4. Less than once a week5. Never - GO TO Q9.106. Don’t know - GO TO Q9.10
----------------------------------------------------- PAGE BREAK -----------------------------------------------------
*(IF DRIVE FOR WORK) (Q9.8=1-4 OR Q9.4=3-4) OTHERWISE GO TO Q9.10Q9.9 What type of vehicle do you usually drive as part of your job?If you drive more than one type, please select the type you use most often.
1. Car2. Truck3. Bus4. Motorcycle5. Other6. Don’t know 7. I only commute to and from work
----------------------------------------------------- PAGE BREAK -----------------------------------------------------*(ALL)Q9.10 What other forms of transport do you regularly (at least once a fortnight) use?
Please select all that apply1. Bus2. Train3. Tram4. Walk5. Ride motorcycle6. Ride bicycle
----------------------------------------------------- PAGE BREAK -----------------------------------------------------*(ALL) Q9.11 In which country were you born?
Please select one response only.1. Australia2. New Zealand3. United Kingdom4. Italy5. Vietnam6. China7. Greece8. India9. Other (please specify) 10. I’d prefer not to say
----------------------------------------------------- PAGE BREAK -----------------------------------------------------*(ALL) (ONLINE ONLY)
Q1.6. Listed below are a number of statements concerning personal attitudes and traits. Read each item and decide whether the statement is true or false as it applies to you personally. It’s best to go with your first judgment and not spend too long on any one statement.
True False
a) I never hesitate to go out of my way to help someone in troubleb) I have never intensely disliked anyone
The Social Research Centre

2012 Road Safety Monitor Transport Accident Commission
c) I sometimes feel resentful when I don’t get my way
d) There have been times when I felt like rebelling against people in authority even though I knew they were right
e) I can remember “playing sick” to get out of somethingf) When I don’t know something I don’t at all mind admitting itg) I am always courteous, even to people who are disagreeable
h) I would never think of letting someone else be punished for my wrong-doings
i) There have times when I was quite jealous of the good fortune of othersj) I am sometimes irritated by people who ask favours of me
-------------------------------------------------------------PAGE BREAK -------------------------------------------------------------
*(Telephone Services)*(ALL)
Q10.1 Now, just a few questions about telephone services to help us better understand whether it is better to conduct studies like this via paper surveys, web, or phone.
Do you have a LANDLINE number at your house that you use to make and receive telephone calls? Please exclude those only used for internet access.
1. Yes2. No3. Don’t know 4. I’d prefer not to say
----------------------------------------------------- PAGE BREAK -----------------------------------------------------
*(ALL)Q10.2 Do you have a mobile phone?
1. Yes 2. No (Go to Q10.3)3. I’d prefer not to say (Go to Q10.3)
----------------------------------------------------- PAGE BREAK -----------------------------------------------------
*(DUAL USERS) (Q10.1=1 AND Q10.2=1) OTHERWISE GO TO TEXT BOX BELOWX4 Of all the private calls that you receive are … (READ OUT)
1. All or almost all calls received on your mobile2. Some received on your mobile and some on your regular home phone, or3. Very few or none on your mobile phone4. Don’t know5. I’d prefer not to say
----------------------------------------------------- PAGE BREAK -----------------------------------------------------PROGRAMMER NOTE: IF REGIONAL FLAG=1 CONTINUE ELSE GO TO Q11
*(REGIONAL SAMPLE)Q10.3 To finish off, we have a few final questions especially for regional and rural respondents. Where do
you get most of your news from?
1. Television
The Social Research Centre

2012 Road Safety Monitor Transport Accident Commission
2. Newspapers3. Radio4. Internet5. Other INSERT LINE FOR FREE TEXT
----------------------------------------------------- PAGE BREAK -----------------------------------------------------
*(REGIONAL SAMPLE)Q10.4 Do you read any print versions of the following newspapers? Please answer yes only if you read any of these papers in print, not online
1. The Age2. Herald Sun3. The Australian4. Financial Review5. Weekly Times6. Other
----------------------------------------------------- PAGE BREAK -----------------------------------------------------
*(REGIONAL SAMPLE)Q10.5 Please list any local newspapers that you read
1. TEXT BOX2. I’d prefer not to say
----------------------------------------------------- PAGE BREAK -----------------------------------------------------
*(REGIONAL SAMPLE)Q10.6 Which radio stations do you listen to?I listen to…(select all that apply)
1. 3AW2. ABC Local3. Radio National4. Local commercial or community radio stations5. Melbourne-based commercial or community radio stations6. I don’t listen to the radio
----------------------------------------------------- PAGE BREAK -----------------------------------------------------
*(REGIONAL SAMPLE)Q10.7 Have you seen or heard of “Talk the Toll Down” before?
The Social Research Centre

2012 Road Safety Monitor Transport Accident Commission
1. Yes2. No - GO TO Q10.93. Don’t know - GO TO Q10.9
----------------------------------------------------- PAGE BREAK -----------------------------------------------------
*(HAS SEEN TTTD)Q10.8 Where have you seen or heard this?
1. Billboard2. Newspapers3. Television4. Radio5. On-line 6. Other
----------------------------------------------------- PAGE BREAK -----------------------------------------------------
*(REGIONAL SAMPLE)Q10.9 What is the message that you think Talk The Toll Down is trying to promote?
LEAVE TWO LINES FOR FREE TEXT
----------------------------------------------------- PAGE BREAK -----------------------------------------------------*(REGIONAL SAMPLE)Q10.10 Have you talked to anyone about the road toll in the past 6 months?1. Yes2. No
----------------------------------------------------- PAGE BREAK -----------------------------------------------------
*(REGIONAL SAMPLE)Q10.11 Do you think “Talk the Toll Down” has any meaning or relevance in your local area?
1. Yes 2. No3. Don’t know - GO TO Q10.13
----------------------------------------------------- PAGE BREAK -----------------------------------------------------
*(REGIONAL SAMPLE)(If Q10.11 = 1 or 2)Q10.12 Why do you think that?
LEAVE TWO LINES FOR FREE TEXT
----------------------------------------------------- PAGE BREAK -----------------------------------------------------
*(REGIONAL SAMPLE)Q10.13 In the last 12 months, have you become more conscious of road safety than you had been before?
The Social Research Centre

2012 Road Safety Monitor Transport Accident Commission
1. Yes2. No3. Don’t know
----------------------------------------------------- PAGE BREAK -----------------------------------------------------
*(REGIONAL SAMPLE)Q10.14 Some Regional Victorians have expressed concern about a number of road safety issues they
believe are relevant to them. Which of these are a concern in your local area? .Major
concernMinor
concernNot a
concern
1. Weather conditions 1 2 3
2. Road conditions/maintenance 1 2 3
3. Speed limits 1 2 3
4. Animals on the road (stock or wildlife) 1 2 3
5. Drink driving 1 2 3
6. Traffic mix (cyclists, trucks, tourists) 1 2 3
7. Speeding drivers 1 2 3
8. Inexperienced drivers 1 2 3
9. Fatigue/driving long distances 1 2 3
10. Drug driving 1 2 3
11. Older drivers 1 2 3
12. Other…LEAVE LINE FOR FREE TEXT 1 2 3
----------------------------------------------------- PAGE BREAK -----------------------------------------------------
*Young adult attitudinal questions (ONLINE ONLY)
PROGRAMMER NOTE: Q12.1 IS TO BE ASKED OF UNDER 25s ONLY. IF (Q1.2 > 24) GO TO Q11
We now have an optional short series of questions for young drivers. If you choose to complete this section, you will go into an extra prize draw for an iPad (3rd generation), valued at $539. If you’d rather skip this section, you will still be entered in the other prize draws but will go straight to the final questions.
1. Continue2. Skip (GO TO Q11)
----------------------------------------------------- PAGE BREAK -----------------------------------------------------
*(Q1.2<25).Q12.1 Which of the following have you done in the last twelve months?
Yes No I’d prefer not to say
The Social Research Centre

2012 Road Safety Monitor Transport Accident Commission
Gambled and lost more money than I could afford
Used illegal drugs more than once
Failed to wear a seat belt
Smoked cigarettes
Participated in unsafe sex
Failed to buy a ticket when using public transport
Had a speeding ticket
Shoplifted something
Drank alcohol with the intention of getting drunk
Driven when you could have been over the legal limit
Driven after using illegal drugs
None of these
----------------------------------------------------- PAGE BREAK -----------------------------------------------------
*(Driving Habits)
*(Q1.2<25) (ONLINE ONLY.Q12.0.
Please indicate your level of agreement or disagreement with each statement using the following scale.
Strongly disagree
Strongly agree
1 2 3 4 5 6 7 8
a) I often do things on the spur of the moment.................................................
1 2 3 4 5 6 7 8
b) I have the best fun when I’m with lots of other friends..............................
1 2 3 4 5 6 7 8
c) Taking risks makes me feel really alive...................................................
1 2 3 4 5 6 7 8
d) I enjoy taking risks.......................................1 2 3 4 5 6 7 8
e) Having fun means doing things that can be a bit dangerous.........................
1 2 3 4 5 6 7 8
f) I like things to be unpredictable...................1 2 3 4 5 6 7 8
g) I prefer to play it safe...................................1 2 3 4 5 6 7 8
h) The people I hang out with are sensible all the time.....................................
1 2 3 4 5 6 7 8
i)I play by the rules because I know things can go wrong at any time.......................................................
1 2 3 4 5 6 7 8
j) I usually plan things ahead of time.............................................................
1 2 3 4 5 6 7 8
k) Taking risks makes me feel anxious........................................................
1 2 3 4 5 6 7 8
l) I always have to fit in with my friends.........................................................
1 2 3 4 5 6 7 8
m) I usually only listen to comments that support what I want to do.....................
1 2 3 4 5 6 7 8
The Social Research Centre

2012 Road Safety Monitor Transport Accident Commission
n)I think through the consequences of the things I’m about to do..................................................
1 2 3 4 5 6 7 8
----------------------------------------------------- PAGE BREAK -----------------------------------------------------
Now a series of statements about your behaviour when you are in a car. Please indicate your level of agreement or disagreement with each statement using the following scale.
o) I drive faster than the rest of the traffic...........................................................
1 2 3 4 5 6 7 8
p) I take off from traffic lights as fast as I can.................................................
1 2 3 4 5 6 7 8
q) I often overtake cars going slow..................1 2 3 4 5 6 7 8
r)I’ll drive closer to the car in front to encourage them to move out of my way....................................................
1 2 3 4 5 6 7 8
s) I use my hand-held mobile phone while driving......................................
1 2 3 4 5 6 7 8
t) I prefer to accelerate through an amber light rather than stop.........................
1 2 3 4 5 6 7 8
u) It isn’t fun to do burn outs............................1 2 3 4 5 6 7 8
v) I don’t get into races with other cars.............................................................
1 2 3 4 5 6 7 8
w)I can’t see any point in taking off from traffic lights as fast as possible.......................................................
1 2 3 4 5 6 7 8
x) I enter curves at a speed that I know is appropriate and safe.......................
1 2 3 4 5 6 7 8
y) When I’m driving, I slow down when the roads are wet...............................
1 2 3 4 5 6 7 8
----------------------------------------------------- PAGE BREAK -----------------------------------------------------
*(Q1.2<25).Q12.2 Have you attended any of the following events (or similar events) in the last 12 months?
Please select all that apply.
1. Parklife2. Falls Festival 3. Shine On 4. Stereosonic 5. Meredith Music Festival 6. Falls Festival 7. Solar Festival 8. Twilight Cinemas 9. Big Day Out 10. St Jeromes Laneway Festival 11. St Kilda Festival 12. Soundwave 13. Golden Plains 14. Apollo Bay Music Festival 15. Groovin the Moo
The Social Research Centre
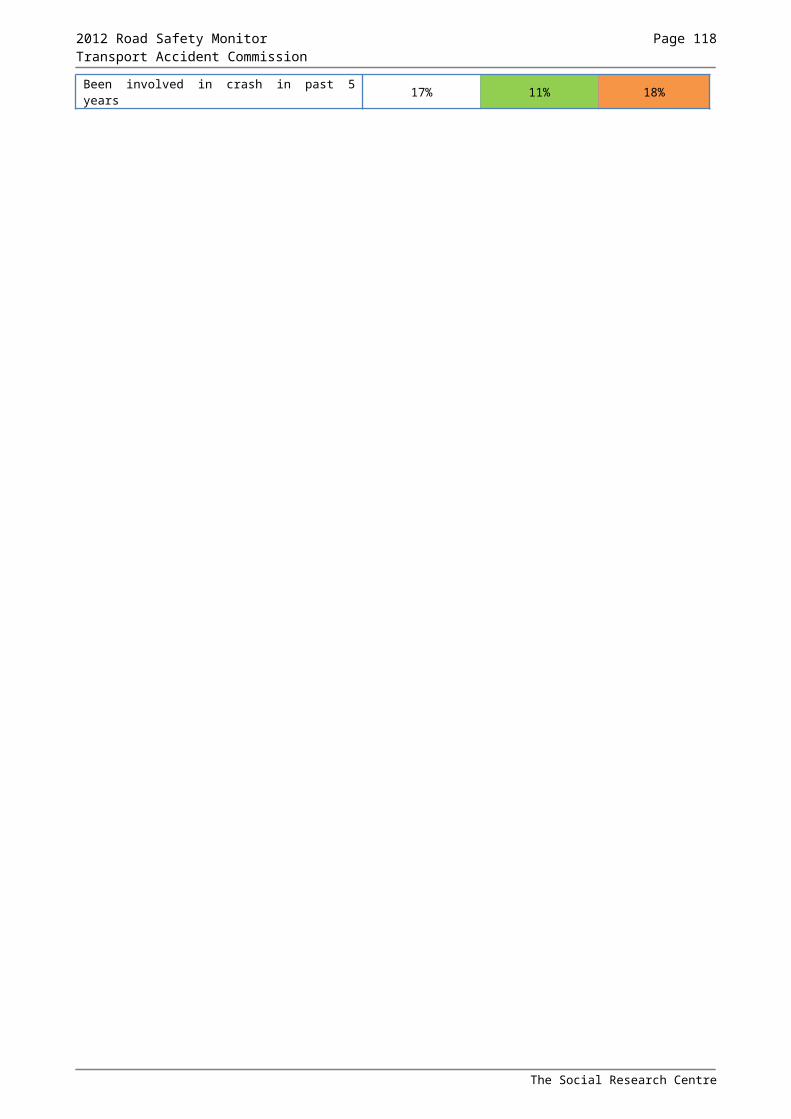
2012 Road Safety Monitor Transport Accident Commission
16. Creamfields17. 3630 festival 18. Uni/ Tafe Open Day - please specify which institution (TEXT BOX)19. Uni /Tafe Orientation week - please specify which institution (TEXT BOX)20. None of the above
IF 1-19, GO TO Q12.3 ELSE GO TO Q11
----------------------------------------------------- PAGE BREAK -----------------------------------------------------
The Social Research Centre

2012 Road Safety Monitor Transport Accident Commission
*(WENT TO EVENT) (Q12.2=1-19)
Q12.3 Have you seen a bus called Vanessa or Mini Vanessa at events?
1. Yes – GO TO Q12.42. No – GO TO Q113. Don’t know – GO TO Q11
----------------------------------------------------- PAGE BREAK -----------------------------------------------------
*(SAW VANESSA) (Q12.3=1)
Q12.4 Where did you see the bus Vanessa or Mini Vanessa at events?
1. TEXT BOX2. Don’t know
----------------------------------------------------- PAGE BREAK -----------------------------------------------------*(SAW VANESSA) (Q12.3=1)
Q12.5 Did you visit Vanessa or Mini Vanessa or use any of the services it provides?
1. Yes - GO TO Q12.62. No - GO TO Q11
----------------------------------------------------- PAGE BREAK -----------------------------------------------------
*(VISITED VANESSA) (Q12.5=1)
Q12.6 Were you breath-tested by Vanessa or Mini Vanessa staff?
1. Yes2. No
----------------------------------------------------- PAGE BREAK -----------------------------------------------------*(VISITED VANESSA)
Q12.7 What other services would you like Vanessa or Mini Vanessa to provide?
1. Saliva based drug testing2. Drug testing information3. Drug driving information4. Other (TEXT BOX)
----------------------------------------------------- PAGE BREAK -----------------------------------------------------
The Social Research Centre

2012 Road Safety Monitor Transport Accident Commission
*(ALL)Q11.0 Would you be interested in participating in other TAC road safety related research?
If you are interested in taking part in other research, your name and contact details will be forwarded to the TAC. Please be assured that your personal details will be treated in strict confidence and will remain separate to your responses to this survey.
1. No, I would not be interested 2. Yes, I would be interested (please provide your details below)
Name:Contact phone:
OR
Email address:
The Social Research Centre