
Introduction to web.pdfstrategic decision making of its ... – Key actor in the €40bn merger of...
42
Introduction to March 2017
-
Upload
phunghuong -
Category
Documents
-
view
220 -
download
0
Transcript of Introduction to web.pdfstrategic decision making of its ... – Key actor in the €40bn merger of...
Introduction to
March 2017
GBL March 2017
1. GBL’s Strategy – 2016 and forward 2
2. 2016 Financial performance 22
3. Outlook 27
4. Appendix 30
2
GBL | March 2017
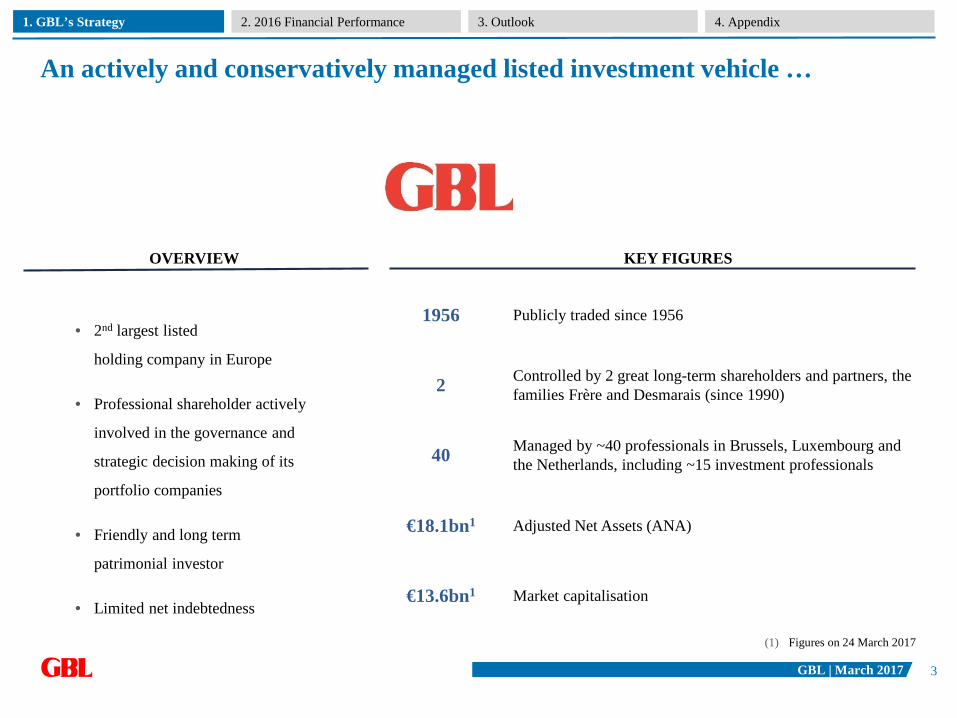
An actively and conservatively managed listed investment vehicle …
1. GBL’s Strategy 4. Appendix3. Outlook2. 2016 Financial Performance
1956 Publicly traded since 1956
2 Controlled by 2 great long-term shareholders and partners, the families Frère and Desmarais (since 1990)
€13.6bn1 Market capitalisation
40 Managed by ~40 professionals in Brussels, Luxembourg and the Netherlands, including ~15 investment professionals
€18.1bn1 Adjusted Net Assets (ANA)
• 2nd largest listed
holding company in Europe
• Professional shareholder actively
involved in the governance and
strategic decision making of its
portfolio companies
• Friendly and long term
patrimonial investor
• Limited net indebtedness
KEY FIGURES
(1) Figures on 24 March 2017
OVERVIEW
3
GBL | March 2017
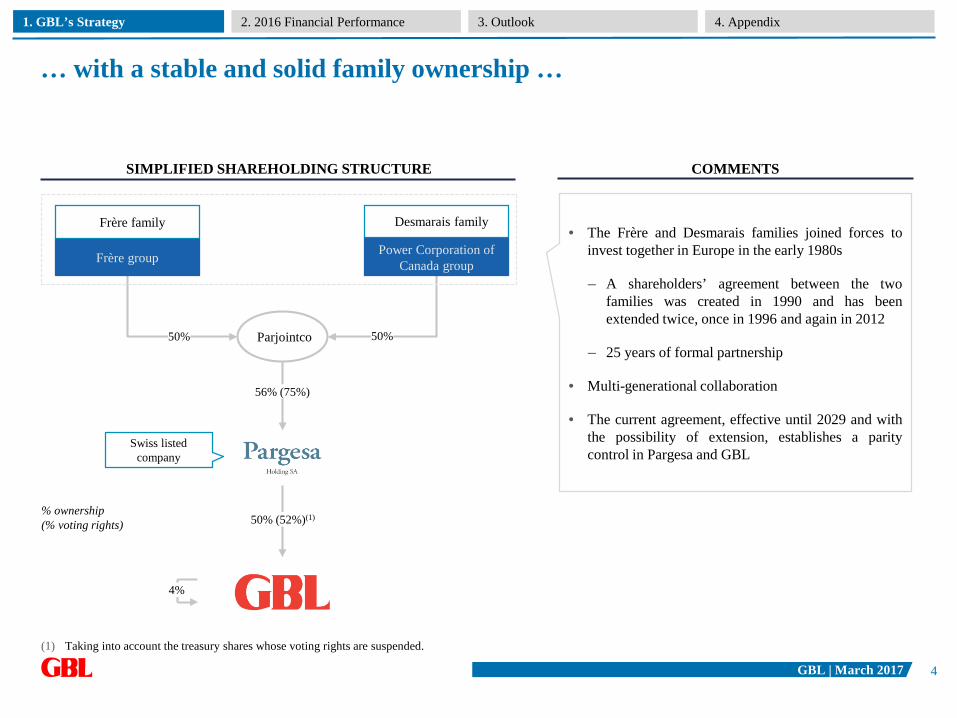
… with a stable and solid family ownership …
1. GBL’s Strategy 4. Appendix3. Outlook2. 2016 Financial Performance
SIMPLIFIED SHAREHOLDING STRUCTURE
Desmarais familyFrère family
Frère group
Parjointco50% 50%
56% (75%)
Power Corporation of Canada group
% ownership(% voting rights)
• The Frère and Desmarais families joined forces toinvest together in Europe in the early 1980s
– A shareholders’ agreement between the twofamilies was created in 1990 and has beenextended twice, once in 1996 and again in 2012
– 25 years of formal partnership
• Multi-generational collaboration
• The current agreement, effective until 2029 and withthe possibility of extension, establishes a paritycontrol in Pargesa and GBL
Swiss listed company
4%
50% (52%)(1)
COMMENTS
(1) Taking into account the treasury shares whose voting rights are suspended.
4
GBL | March 2017
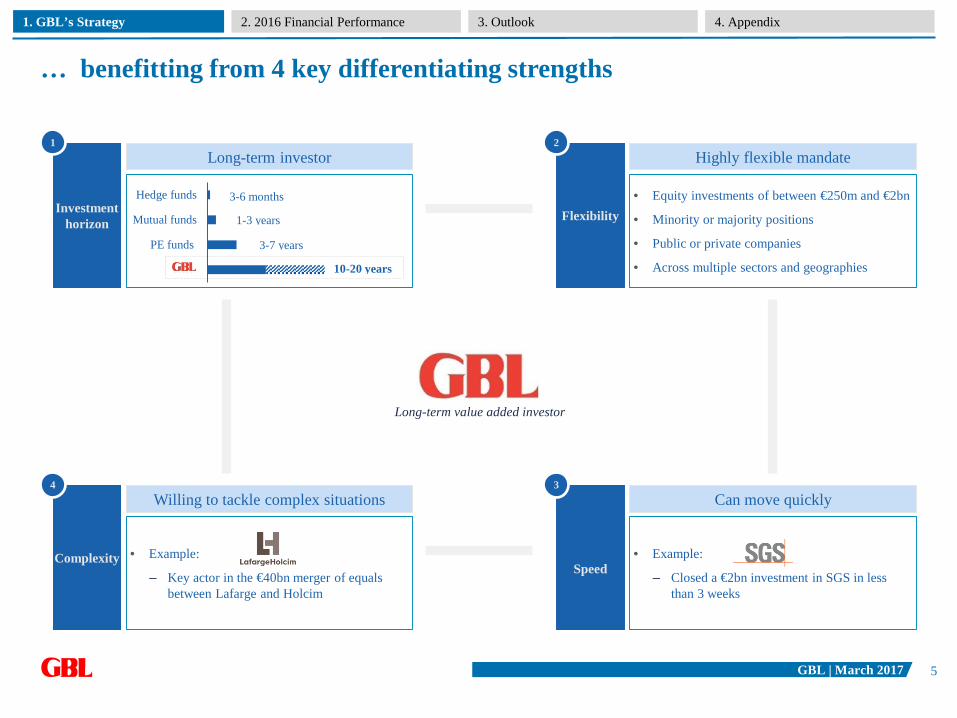
… benefitting from 4 key differentiating strengths
1. GBL’s Strategy 4. Appendix3. Outlook2. 2016 Financial Performance
Long-term value added investor
Investment horizon
Long-term investor1
• Equity investments of between €250m and €2bn
• Minority or majority positions
• Public or private companies
• Across multiple sectors and geographies
Flexibility
Highly flexible mandate 2
• Example:
– Key actor in the €40bn merger of equals between Lafarge and Holcim
Complexity
Willing to tackle complex situations 4
• Example:
– Closed a €2bn investment in SGS in less than 3 weeks
Speed
Can move quickly3
10-20 years
3-7 years
1-3 years
3-6 months
GBL
PE funds
Mutual funds
Hedge funds
5
GBL | March 2017
Q1 2016
MARCH
Q2 2016
MAY
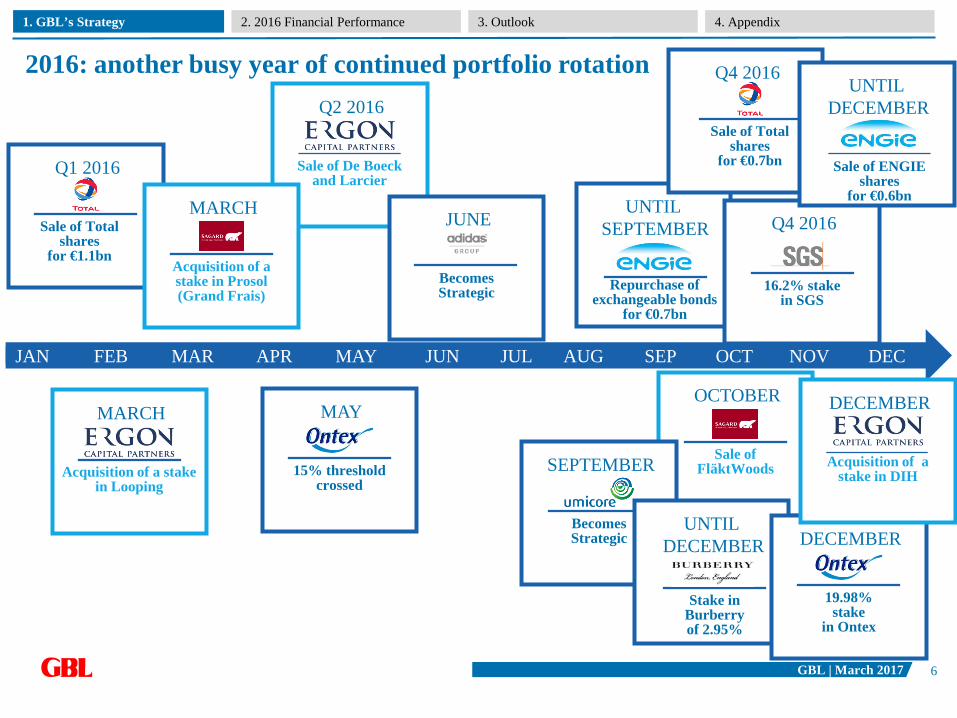
2016: another busy year of continued portfolio rotation
1. GBL’s Strategy 4. Appendix3. Outlook2. 2016 Financial Performance
JAN FEB MAR APR MAY JUN JUL AUG SEP OCT DECNOV
OCTOBER
Sale of FläktWoodsSEPTEMBER
MARCH
Acquisition of a stake in Prosol(Grand Frais)
Acquisition of a stake in Looping
Becomes Strategic
15% threshold crossed
Sale of De Boeckand Larcier
Sale of Total shares
for €1.1bn
UNTIL DECEMBER
Stake in Burberry of 2.95%
UNTIL SEPTEMBER
Repurchase of exchangeable bonds
for €0.7bn
Q4 2016
Sale of Total shares
for €0.7bn
DECEMBER
19.98%stake
in Ontex
JUNE
Becomes Strategic
Q4 2016
16.2% stake in SGS
UNTIL DECEMBER
Sale of ENGIE shares
for €0.6bn
DECEMBER
Acquisition of a stake in DIH
6
GBL | March 2017
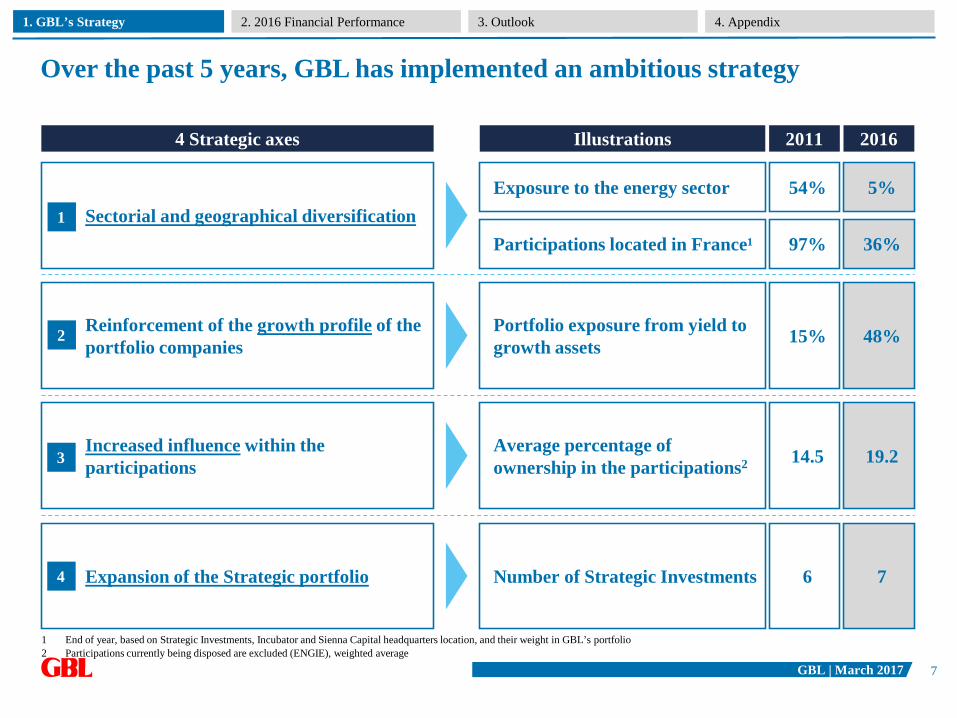
Over the past 5 years, GBL has implemented an ambitious strategy
1 End of year, based on Strategic Investments, Incubator and Sienna Capital headquarters location, and their weight in GBL’s portfolio2 Participations currently being disposed are excluded (ENGIE), weighted average
Sectorial and geographical diversification
4 Strategic axes Illustrations
Reinforcement of the growth profile of the portfolio companies
Increased influence within the participations
Expansion of the Strategic portfolio
Participations located in France¹
Exposure to the energy sector
Portfolio exposure from yield to growth assets
5%54%
20162011
36%97%
48%15%
Number of Strategic Investments 76
Average percentage of ownership in the participations2 19.214.5
1. GBL’s Strategy 4. Appendix3. Outlook2. 2016 Financial Performance
1
4
3
2
7
GBL | March 2017
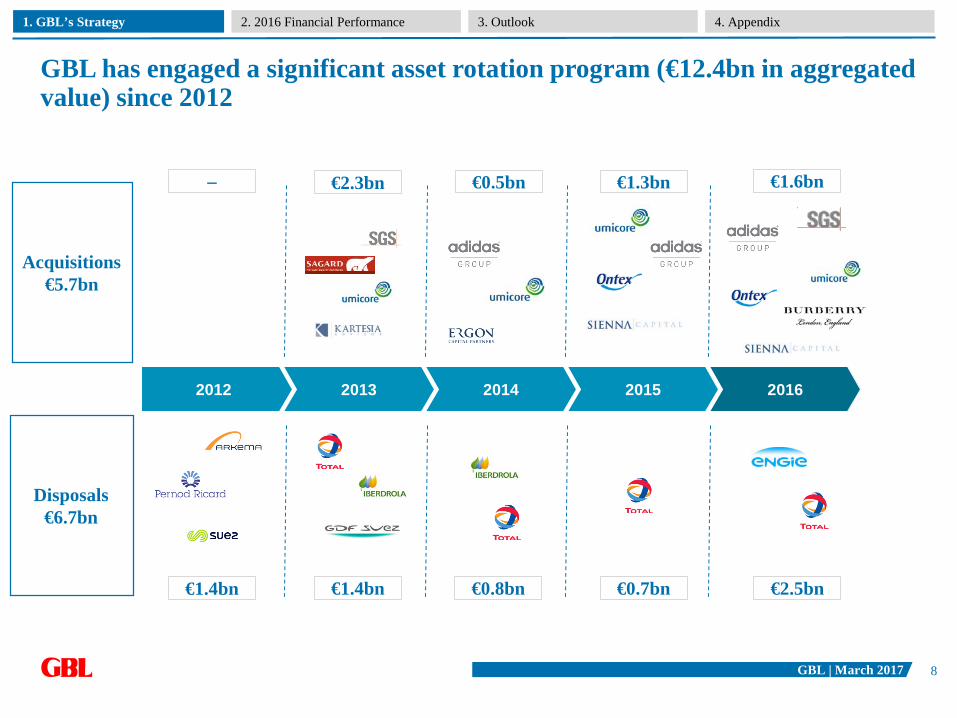
GBL has engaged a significant asset rotation program (€12.4bn in aggregatedvalue) since 2012
– €2.3bn €0.5bn €1.3bn
€1.4bn €1.4bn €0.8bn €0.7bn
€1.6bn
€2.5bn
2012 2013 2014 2015 2016
Acquisitions€5.7bn
Disposals€6.7bn
1. GBL’s Strategy 4. Appendix3. Outlook2. 2016 Financial Performance
8
GBL | March 2017
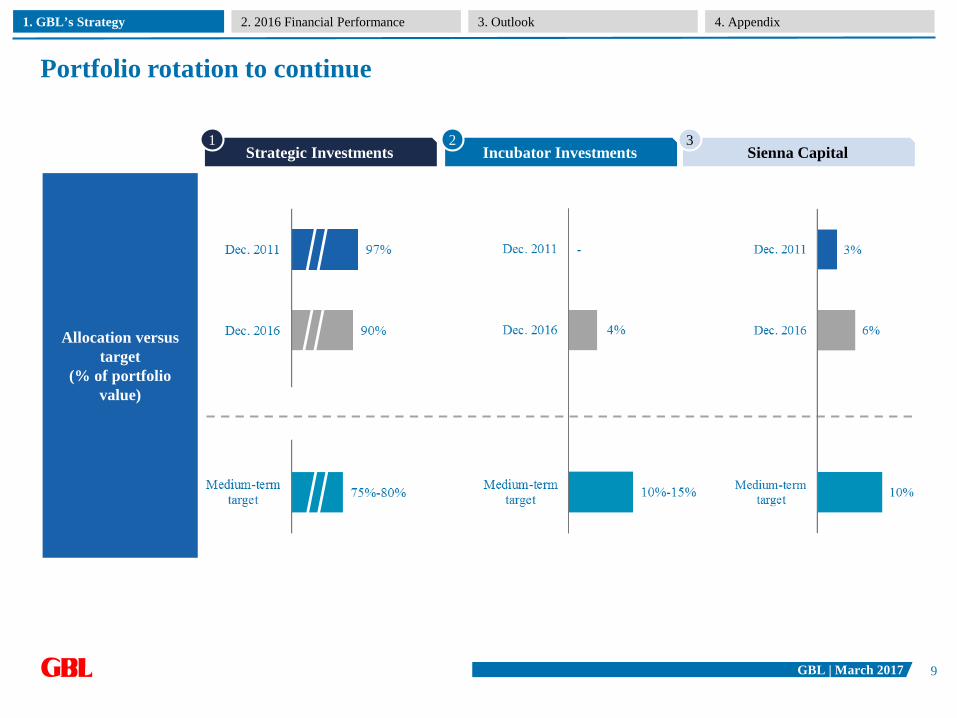
Portfolio rotation to continue
Strategic Investments1
Incubator Investments Sienna Capital
Allocation versus target
(% of portfolio value)
2 3
1. GBL’s Strategy 4. Appendix3. Outlook2. 2016 Financial Performance
9

GBL | March 2017
Increase in adjusted net assets and anticipated decline in cash earnings
ADJUSTED NET ASSETS CASH EARNINGS
In €bn In €m
1. GBL’s Strategy 4. Appendix3. Outlook2. 2016 Financial Performance
+56%
10

GBL | March 2017
A more balanced portfolio in terms of exposure between growth and yield
WEIGHT IN GBL PORTFOLIO PER ASSET TYPE AS AT END OF 2011
WEIGHT IN GBL PORTFOLIO PER ASSET TYPE AS AT END OF 2016
Value/CyclicalValue/Yield Growth Incubator Sienna Capital
1. GBL’s Strategy 4. Appendix3. Outlook2. 2016 Financial Performance
11
GBL | March 2017
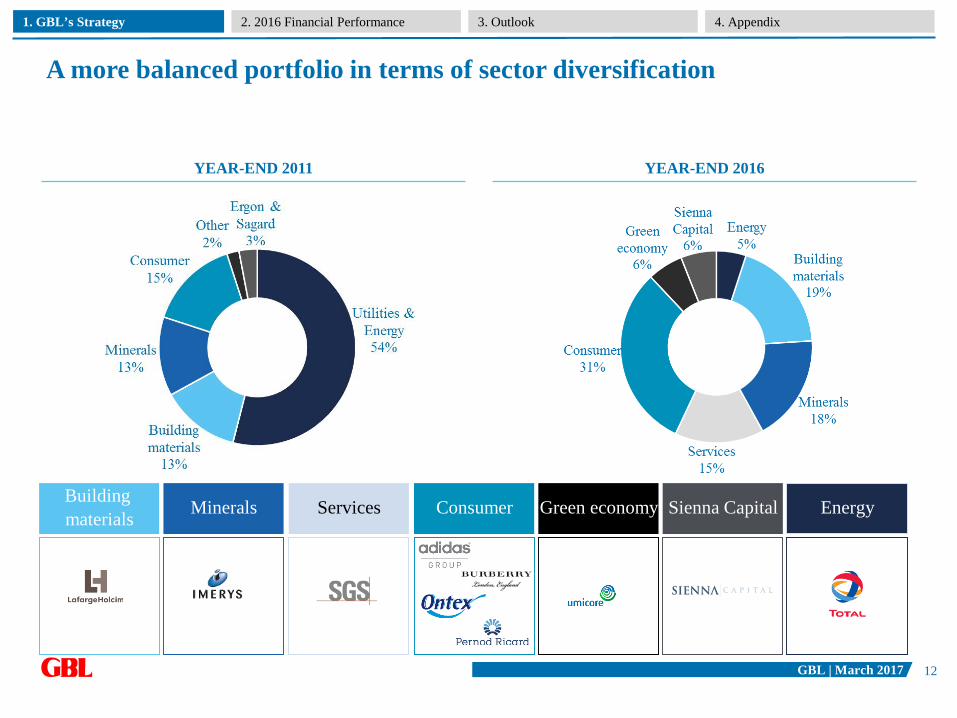
A more balanced portfolio in terms of sector diversification
YEAR-END 2011 YEAR-END 2016
1. GBL’s Strategy 4. Appendix3. Outlook2. 2016 Financial Performance
MineralsBuilding materials Services Consumer Green economy Sienna Capital Energy
12
GBL | March 2017
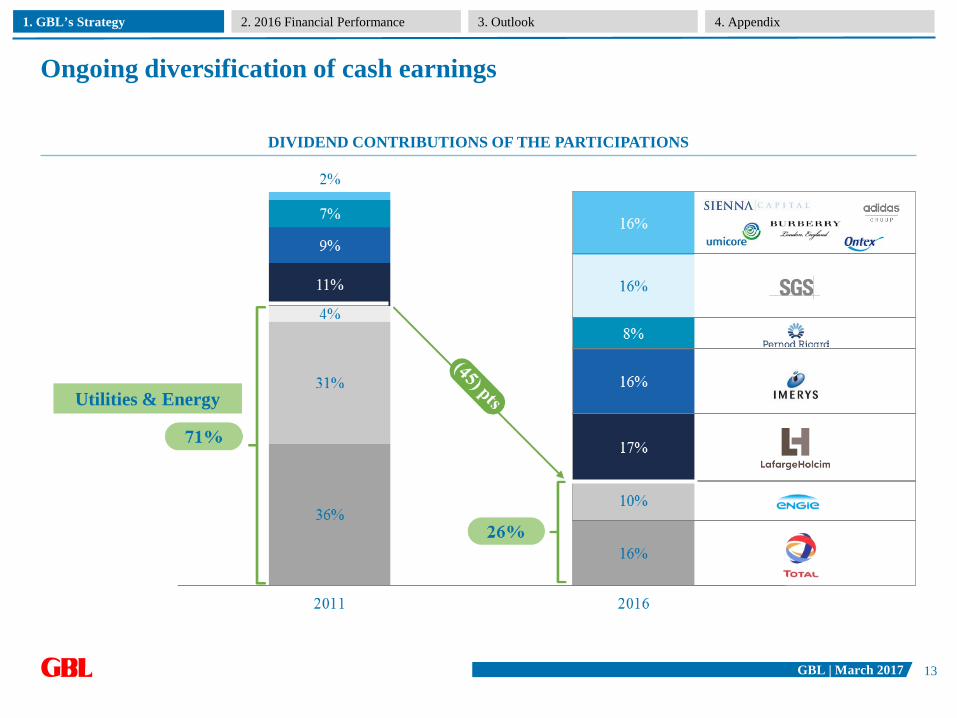
Ongoing diversification of cash earnings
DIVIDEND CONTRIBUTIONS OF THE PARTICIPATIONS
Utilities & Energy
1. GBL’s Strategy 4. Appendix3. Outlook2. 2016 Financial Performance
13

GBL | March 2017
High return from the new participations
New participationsANA
contribution 31/12/2016
1
€2.4bn
€2.4bn
€1.0bn
€0.4bn
Stock price31/12/2016
CHF2,072
€150.15
€54.15
€28.25
Investedcapital
€2.2bn
€1.3bn
€0.7bn
€0.5bn
ANA contribution 31/12/2015
€2.1bn
€0.9bn
€0.7bn
€0.2bn
€0.2bnGBP14.97 €0.2bn -
Total €6.5bn€3.9bn
2
3
4
5
1. GBL’s Strategy 4. Appendix3. Outlook2. 2016 Financial Performance
7%
78%
18%
11%
34%
TSR sinceinception
19%
ANA contribution 24/03/2017
€2.5bn
€2.8bn
€1.0bn
€0.5bn
€0.3bn
€7.0bn
14

GBL | March 2017
94,13
105,31
112,04
2,031,13 0,27
5,34
1,841,29 0,15 0,91
(1,09)
(0,15)(0,28)
2,94
(2,86) (0,34)
AN
A31
/12/
15
Imer
ys
Lafa
rge
Hol
cim
Tota
l
ENG
IE
adid
as
Um
icor
e
SGS
Bur
berr
y
Ont
ex
Pern
odR
icar
d
Sien
naC
apita
l
Div
.R
ecei
ved
Div
. Pai
d
Oth
ers
AN
A31
/12/
16
AN
A24
/03/
17
12% y/y increase of ANA ensuing new investments and the rise in stock price
Commodities Consumer and servicesSiennaCapital
Dividends, and others
In € per share
1. GBL’s Strategy 4. Appendix3. Outlook2. 2016 Financial Performance
15
GBL | March 2017
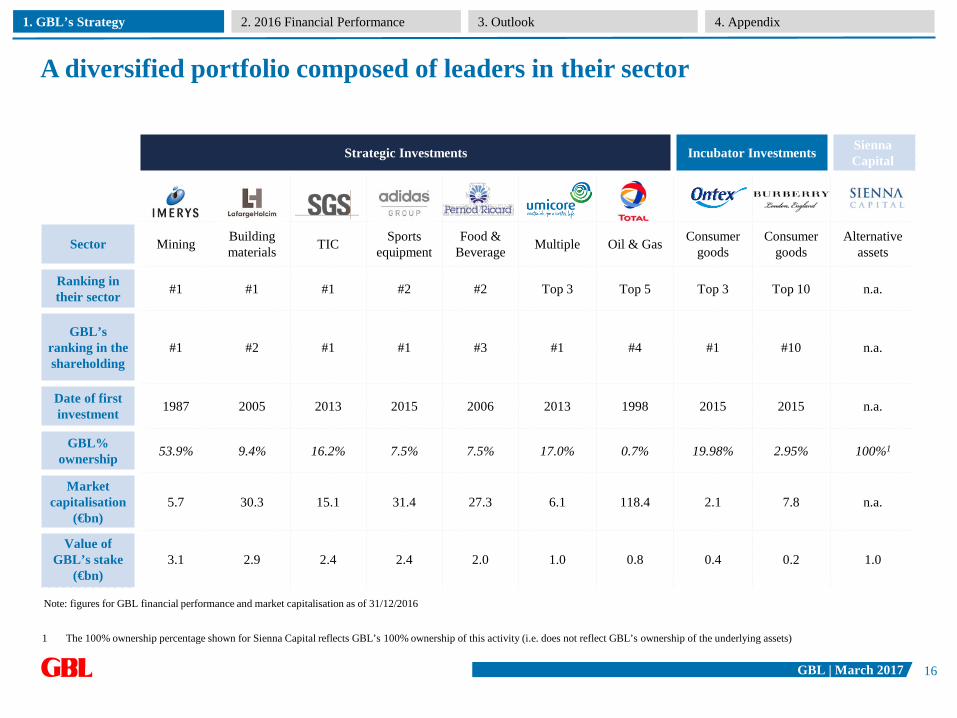
A diversified portfolio composed of leaders in their sector
Strategic Investments Incubator Investments Sienna Capital
Sector Mining Buildingmaterials TIC Sports
equipmentFood &
Beverage Multiple Oil & Gas Consumer goods
Consumer goods
Alternative assets
Ranking in their sector #1 #1 #1 #2 #2 Top 3 Top 5 Top 3 Top 10 n.a.
GBL’s ranking in the shareholding
#1 #2 #1 #1 #3 #1 #4 #1 #10 n.a.
Date of first investment 1987 2005 2013 2015 2006 2013 1998 2015 2015 n.a.
GBL% ownership 53.9% 9.4% 16.2% 7.5% 7.5% 17.0% 0.7% 19.98% 2.95% 100%1
Market capitalisation
(€bn)5.7 30.3 15.1 31.4 27.3 6.1 118.4 2.1 7.8 n.a.
Value of GBL’s stake
(€bn)3.1 2.9 2.4 2.4 2.0 1.0 0.8 0.4 0.2 1.0
Note: figures for GBL financial performance and market capitalisation as of 31/12/2016
1 The 100% ownership percentage shown for Sienna Capital reflects GBL’s 100% ownership of this activity (i.e. does not reflect GBL’s ownership of the underlying assets)
1. GBL’s Strategy 4. Appendix3. Outlook2. 2016 Financial Performance
16
GBL | March 2017
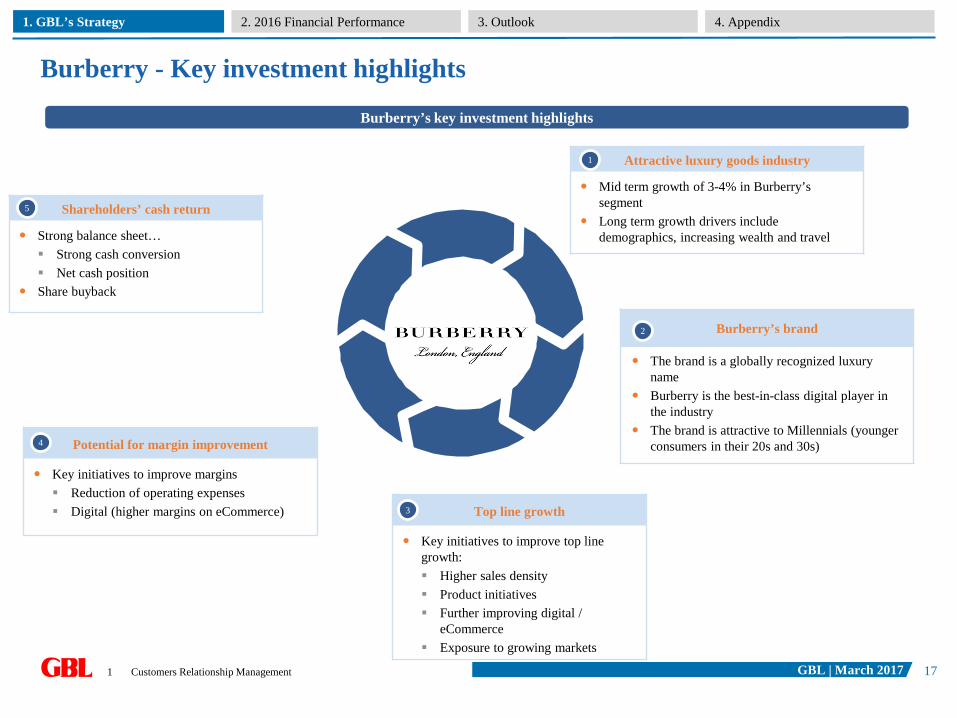
Burberry - Key investment highlights
Burberry’s key investment highlights
Attractive luxury goods industry
Mid term growth of 3-4% in Burberry’s segment
Long term growth drivers include demographics, increasing wealth and travel
1
Burberry’s brand
The brand is a globally recognized luxury name
Burberry is the best-in-class digital player in the industry
The brand is attractive to Millennials (younger consumers in their 20s and 30s)Potential for margin improvement
Key initiatives to improve margins Reduction of operating expenses Digital (higher margins on eCommerce) Top line growth
Key initiatives to improve top line growth: Higher sales density Product initiatives Further improving digital /
eCommerce Exposure to growing markets
Shareholders’ cash return
Strong balance sheet… Strong cash conversion Net cash position
Share buyback
5
4
3
2
1 Customers Relationship Management
1. GBL’s Strategy 4. Appendix3. Outlook2. 2016 Financial Performance
17
GBL | March 2017
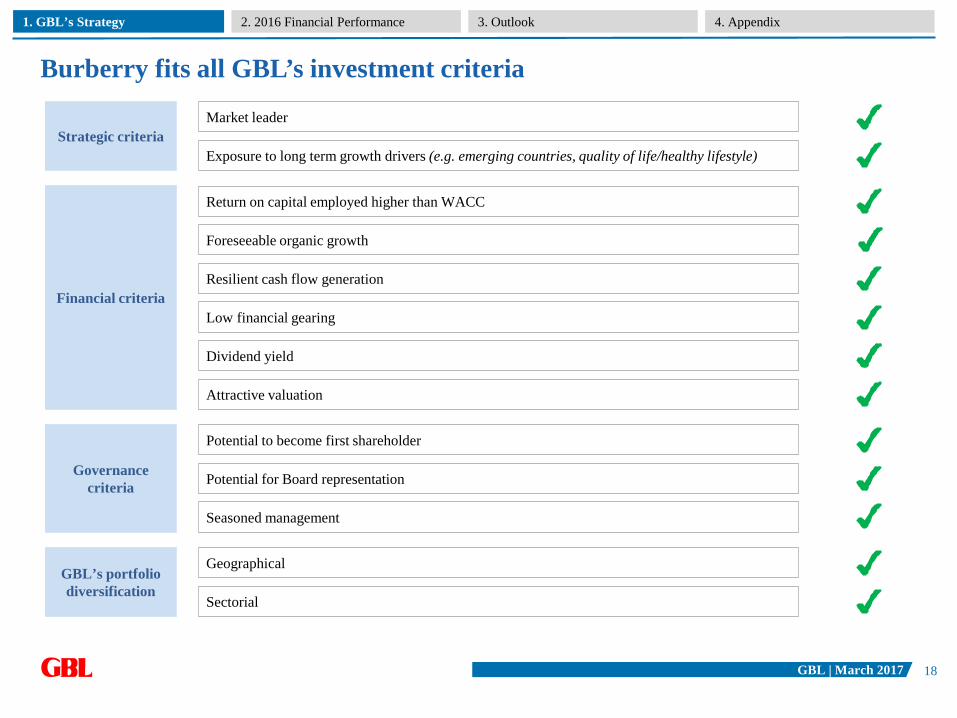
Burberry fits all GBL’s investment criteria
Strategic criteriaMarket leader
Exposure to long term growth drivers (e.g. emerging countries, quality of life/healthy lifestyle)
Governance criteria Potential for Board representation
Seasoned management
Potential to become first shareholder
GBL’s portfolio diversification
Sectorial
Geographical
Financial criteria
Return on capital employed higher than WACC
Foreseeable organic growth
Resilient cash flow generation
Low financial gearing
Dividend yield
Attractive valuation
1. GBL’s Strategy 4. Appendix3. Outlook2. 2016 Financial Performance
18
GBL | March 2017
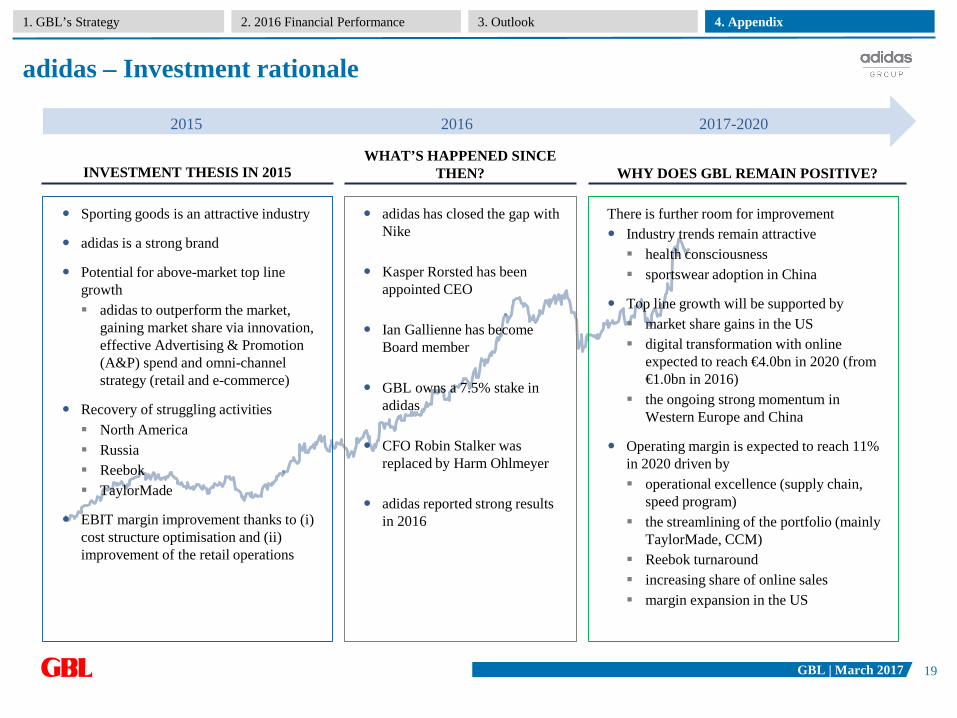
adidas – Investment rationale
1. GBL’s Strategy 4. Appendix3. Outlook2. 2016 Financial Performance
2015 2016 2017-2020
INVESTMENT THESIS IN 2015WHAT’S HAPPENED SINCE
THEN? WHY DOES GBL REMAIN POSITIVE?
Sporting goods is an attractive industry
adidas is a strong brand
Potential for above-market top line growth adidas to outperform the market,
gaining market share via innovation, effective Advertising & Promotion (A&P) spend and omni-channel strategy (retail and e-commerce)
Recovery of struggling activities North America Russia Reebok TaylorMade
EBIT margin improvement thanks to (i) cost structure optimisation and (ii) improvement of the retail operations
adidas has closed the gap with Nike
Kasper Rorsted has been appointed CEO
Ian Gallienne has become Board member
GBL owns a 7.5% stake in adidas
CFO Robin Stalker was replaced by Harm Ohlmeyer
adidas reported strong results in 2016
There is further room for improvement Industry trends remain attractive health consciousness sportswear adoption in China
Top line growth will be supported by market share gains in the US digital transformation with online
expected to reach €4.0bn in 2020 (from €1.0bn in 2016)
the ongoing strong momentum in Western Europe and China
Operating margin is expected to reach 11%in 2020 driven by operational excellence (supply chain,
speed program) the streamlining of the portfolio (mainly
TaylorMade, CCM) Reebok turnaround increasing share of online sales margin expansion in the US
19
GBL | March 2017
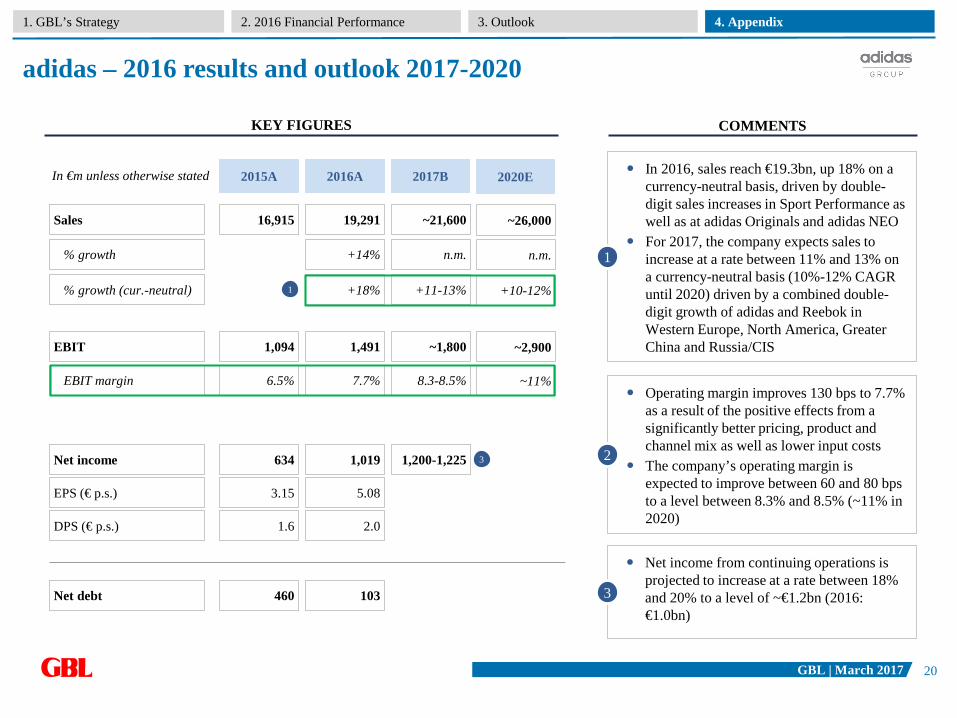
adidas – 2016 results and outlook 2017-2020
1. GBL’s Strategy 4. Appendix3. Outlook2. 2016 Financial Performance
In 2016, sales reach €19.3bn, up 18% on a currency-neutral basis, driven by double-digit sales increases in Sport Performance as well as at adidas Originals and adidas NEO
For 2017, the company expects sales to increase at a rate between 11% and 13% on a currency-neutral basis (10%-12% CAGR until 2020) driven by a combined double-digit growth of adidas and Reebok in Western Europe, North America, Greater China and Russia/CIS
1
Operating margin improves 130 bps to 7.7% as a result of the positive effects from a significantly better pricing, product and channel mix as well as lower input costs
The company’s operating margin is expected to improve between 60 and 80 bps to a level between 8.3% and 8.5% (~11% in 2020)
2
Net income from continuing operations is projected to increase at a rate between 18% and 20% to a level of ~€1.2bn (2016: €1.0bn)
3
KEY FIGURES COMMENTS
EPS (€ p.s.)
DPS (€ p.s.)
Sales
EBIT
EBIT margin
Net income
3.15
1.6
16,915
1,094
6.5%
634
2015A
5.08
2.0
19,291
1,491
7.7%
1,019
2016A
1
3
% growth
% growth (cur.-neutral)
+14%
Net debt 460 103
In €m unless otherwise stated 2017B
~21,600
~1,800
8.3-8.5%
1,200-1,225
+11-13%
n.m.
+18%
2020E
~26,000
~2,900
~11%
+10-12%
n.m.
20
GBL | March 2017
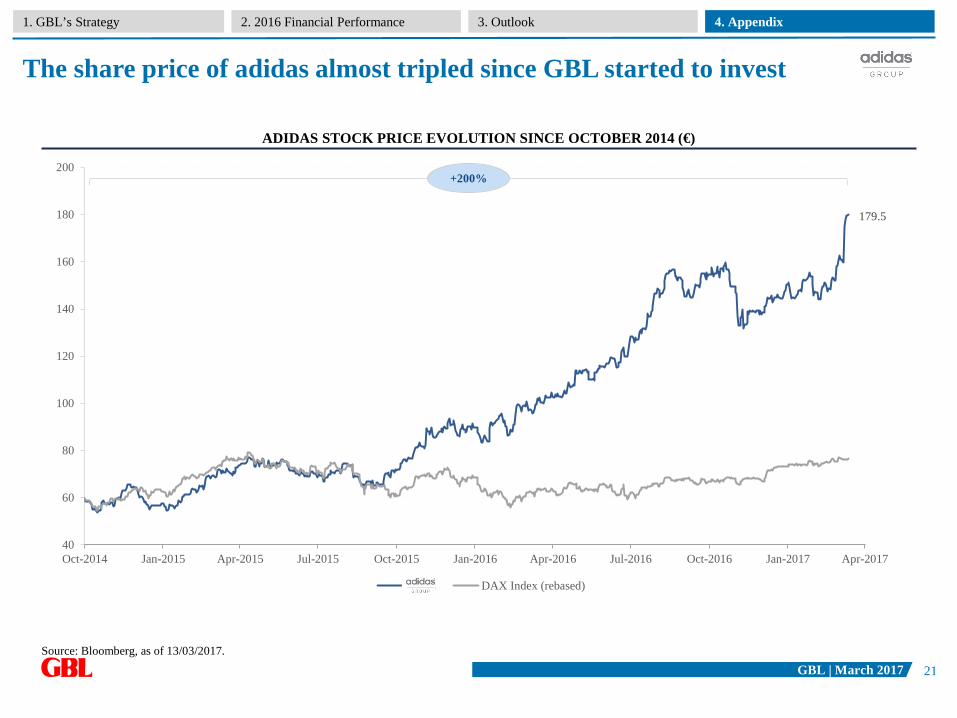
The share price of adidas almost tripled since GBL started to invest
1. GBL’s Strategy 4. Appendix3. Outlook2. 2016 Financial Performance
179.5
40
60
80
100
120
140
160
180
200
Oct-2014 Jan-2015 Apr-2015 Jul-2015 Oct-2015 Jan-2016 Apr-2016 Jul-2016 Oct-2016 Jan-2017 Apr-2017
adidas DAX Index (rebased)
Source: Bloomberg, as of 13/03/2017.
ADIDAS STOCK PRICE EVOLUTION SINCE OCTOBER 2014 (€)
+200%
21
GBL March 2017
1. GBL’s strategy – 2016 and forward 2
2. 2016 Financial performance 22
3. Outlook 27
4. Appendix 30
22
GBL | March 2017
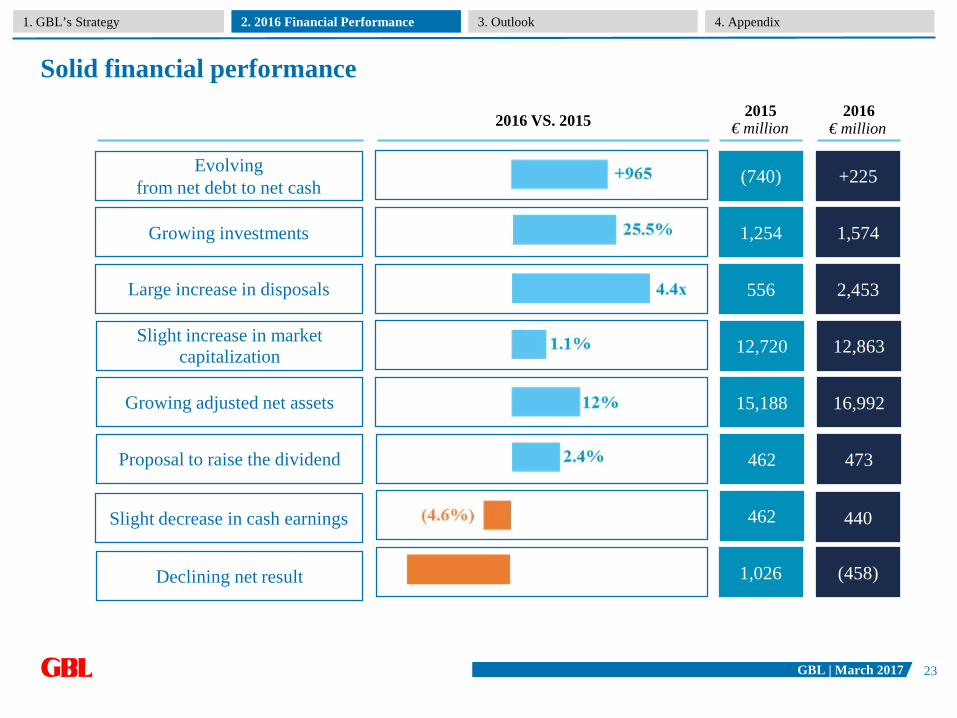
Solid financial performance
Declining net result
Slight decrease in cash earnings
Proposal to raise the dividend
(458)
440
473
Evolvingfrom net debt to net cash +225
Slight increase in marketcapitalization 12,863
Growing adjusted net assets 16,992
Growing investments 1,574
1,026
462
462
(740)
12,720
15,188
1,254
Large increase in disposals 2,453556
2016 VS. 2015 2015 2016€ million € million
1. GBL’s Strategy 4. Appendix3. Outlook2. 2016 Financial Performance
23
GBL | March 2017
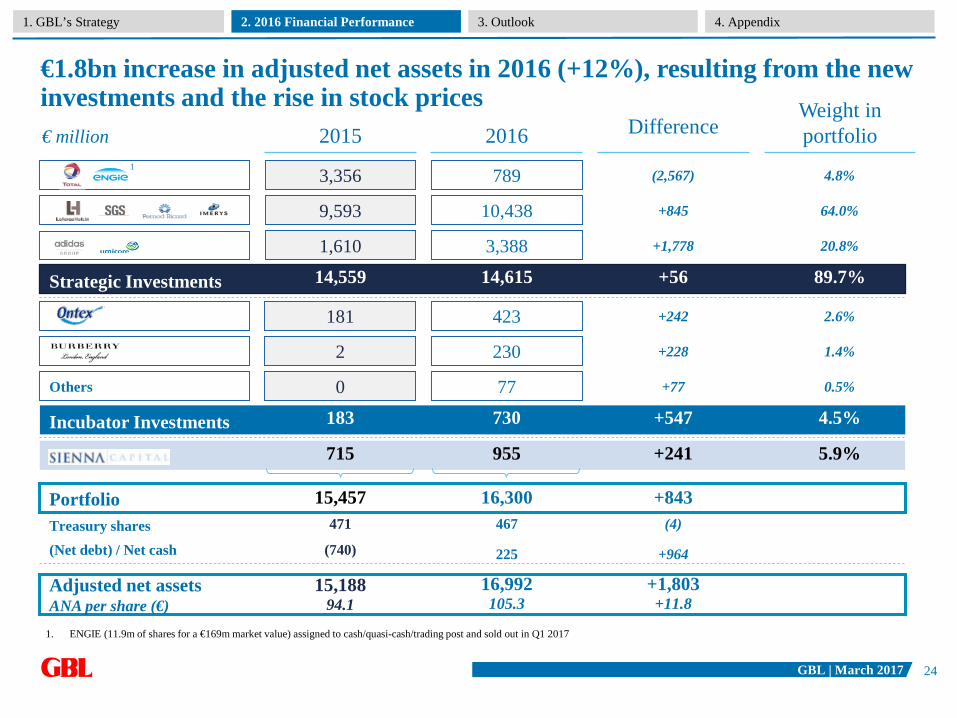
2015 2016 DifferenceWeight in portfolio
€1.8bn increase in adjusted net assets in 2016 (+12%), resulting from the new investments and the rise in stock prices
Portfolio
14,559 14,615
181 423
715 955
15,457 16,300
€ million
+56
+242
+241
89.7%
2.6%
5.9%
Treasury shares 471 467 (4)
(Net debt) / Net cash (740) 225 +964
Adjusted net assetsANA per share (€)
15,18894.1
16,992105.3
+1,803+11.8
+843
1. ENGIE (11.9m of shares for a €169m market value) assigned to cash/quasi-cash/trading post and sold out in Q1 2017
183 730 +547 4.5%
2 230 +228 1.4%
1,610 3,388 +1,778 20.8%
9,593 10,438 +845 64.0%
3,356 789 (2,567) 4.8%
0 77 +77 0.5%
Strategic Investments
Incubator Investments
Others
1
1. GBL’s Strategy 4. Appendix3. Outlook2. 2016 Financial Performance
24
GBL | March 2017
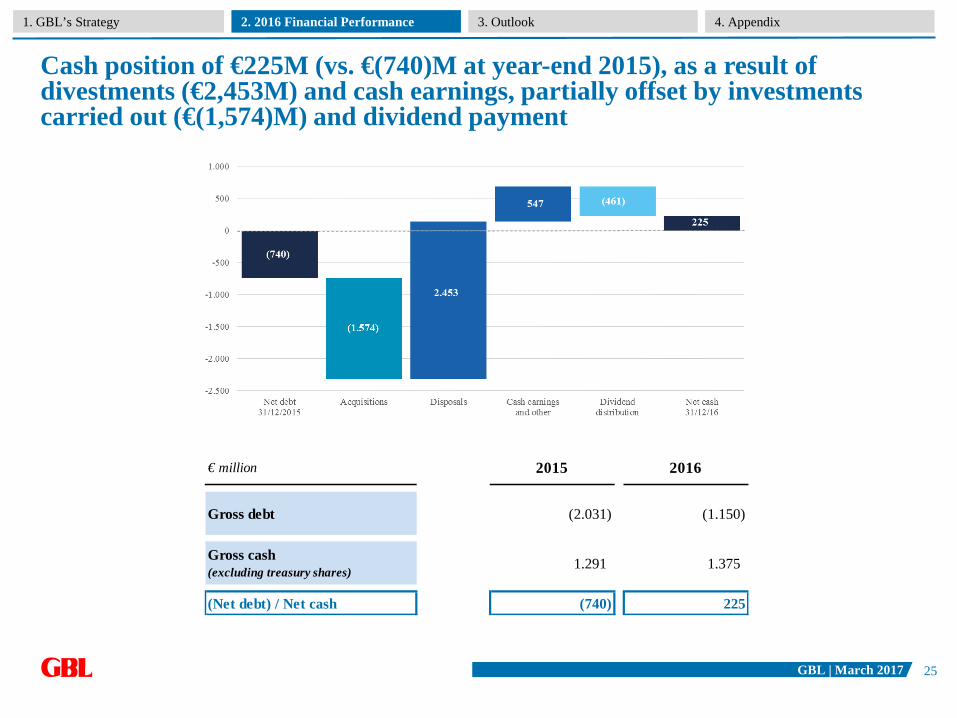
Cash position of €225M (vs. €(740)M at year-end 2015), as a result of divestments (€2,453M) and cash earnings, partially offset by investmentscarried out (€(1,574)M) and dividend payment
1. GBL’s Strategy 4. Appendix3. Outlook2. 2016 Financial Performance
Gross debt (2.031) (1.150)
Gross cash (excluding treasury shares) 1.291 1.375
(Net debt) / Net cash (740) 225
2016€ million 2015
25
GBL | March 2017
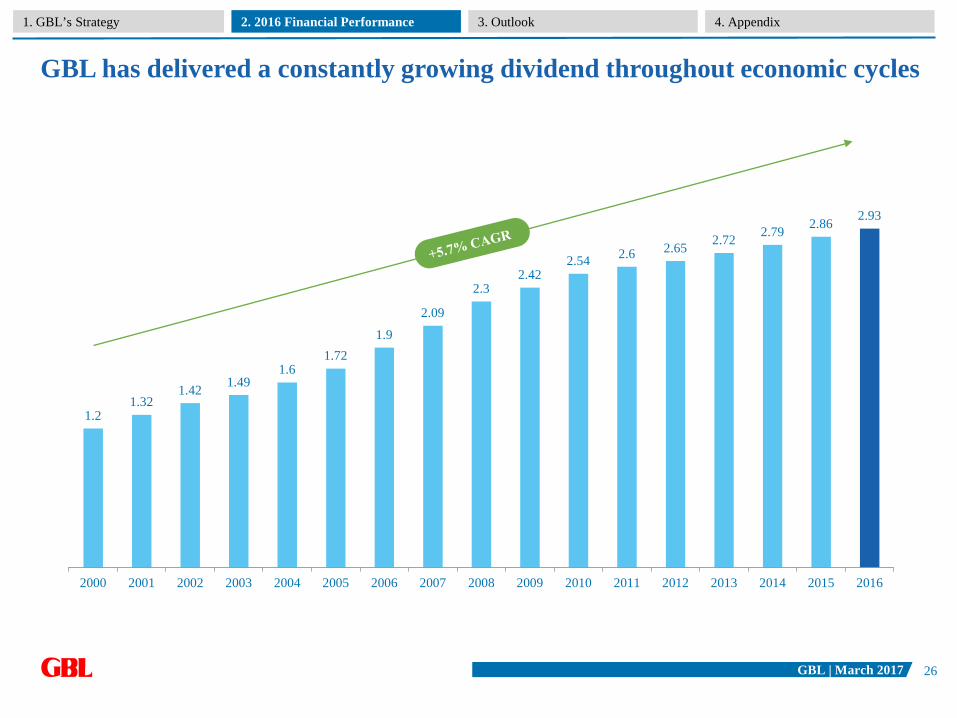
1.21.32
1.42 1.491.6
1.721.9
2.09
2.32.42
2.54 2.6 2.65 2.72 2.79 2.86 2.93
2000 2001 2002 2003 2004 2005 2006 2007 2008 2009 2010 2011 2012 2013 2014 2015 2016
GBL has delivered a constantly growing dividend throughout economic cycles
1. GBL’s Strategy 4. Appendix3. Outlook2. 2016 Financial Performance
26
GBL March 2017
1. GBL’s strategy – 2016 and forward 2
2. 2016 Financial performance 22
3. Outlook 27
4. Appendix 30
27
GBL | March 2017
Total1
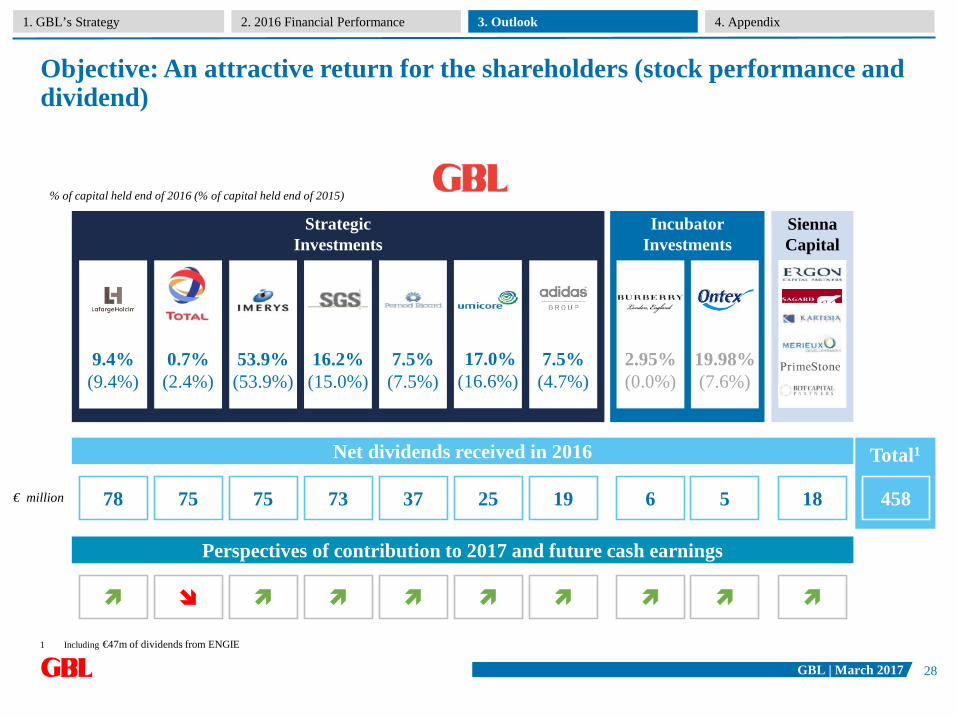
Objective: An attractive return for the shareholders (stock performance and dividend)
IncubatorInvestments
% of capital held end of 2016 (% of capital held end of 2015)
Strategic Investments
9.4%(9.4%)
16.2%(15.0%)
53.9%(53.9%)
7.5%(7.5%)
19.98%(7.6%)
17.0%(16.6%)
Sienna Capital
4581878 75 75 73 37 19 525
Net dividends received in 2016
€ million
7.5%(4.7%)
Perspectives of contribution to 2017 and future cash earnings
0.7%(2.4%)
6
2.95%(0.0%)
1 Including €47m of dividends from ENGIE
1. GBL’s Strategy 4. Appendix3. Outlook2. 2016 Financial Performance
28
GBL | March 2017
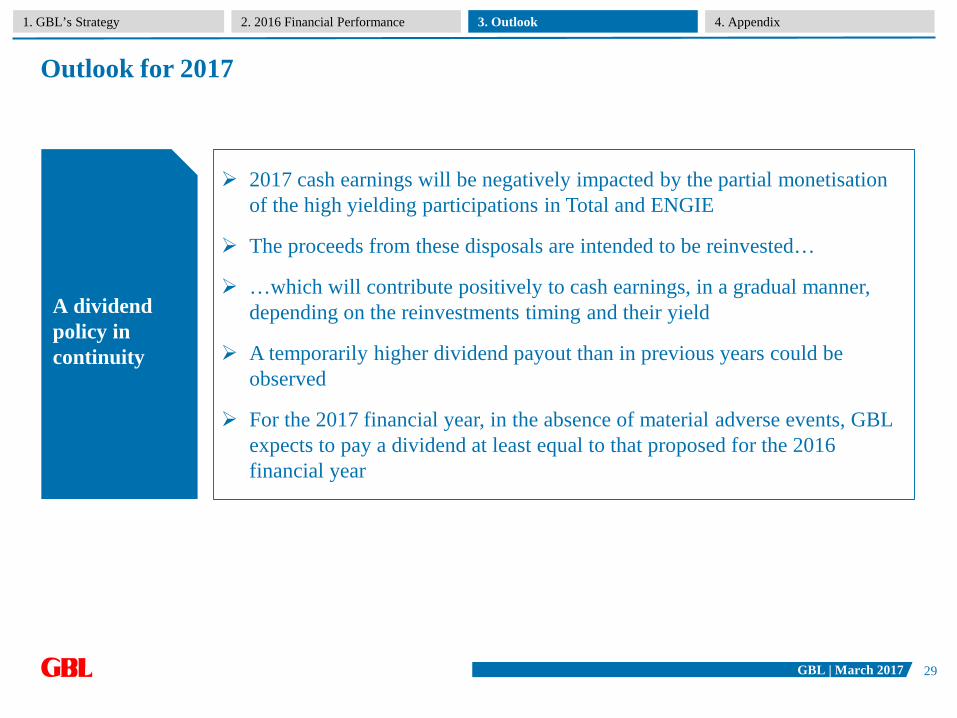
Outlook for 2017
A dividendpolicy in continuity
2017 cash earnings will be negatively impacted by the partial monetisationof the high yielding participations in Total and ENGIE
The proceeds from these disposals are intended to be reinvested…
…which will contribute positively to cash earnings, in a gradual manner, depending on the reinvestments timing and their yield
A temporarily higher dividend payout than in previous years could be observed
For the 2017 financial year, in the absence of material adverse events, GBL expects to pay a dividend at least equal to that proposed for the 2016 financial year
1. GBL’s Strategy 4. Appendix3. Outlook2. 2016 Financial Performance
29
GBL March 2017
1. GBL’s strategy – 2016 and forward 2
2. 2016 Financial performance 22
3. Outlook 27
4. Appendix 30
30
GBL | March 2017
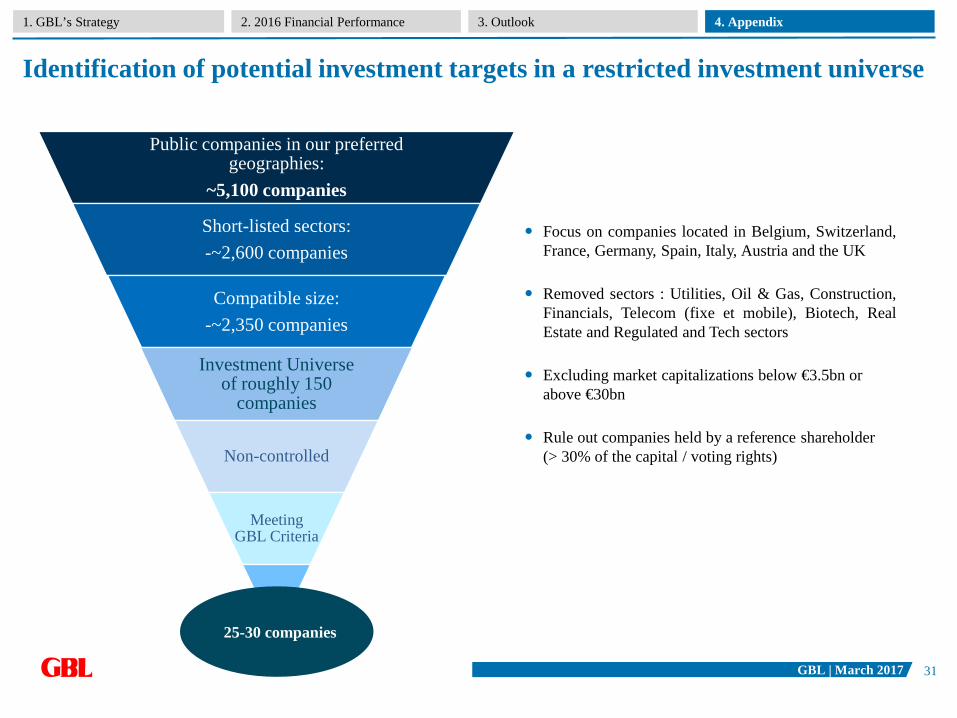
Identification of potential investment targets in a restricted investment universe
1. GBL’s Strategy 4. Appendix3. Outlook2. 2016 Financial Performance
Public companies in our preferred geographies:
~5,100 companies
Short-listed sectors: -~2,600 companies
Compatible size: -~2,350 companies
Investment Universe of roughly 150
companies
Non-controlled
Meeting GBL Criteria
25-30 companies
Focus on companies located in Belgium, Switzerland,France, Germany, Spain, Italy, Austria and the UK
Removed sectors : Utilities, Oil & Gas, Construction,Financials, Telecom (fixe et mobile), Biotech, RealEstate and Regulated and Tech sectors
Excluding market capitalizations below €3.5bn or above €30bn
Rule out companies held by a reference shareholder (> 30% of the capital / voting rights)
31
GBL | March 2017
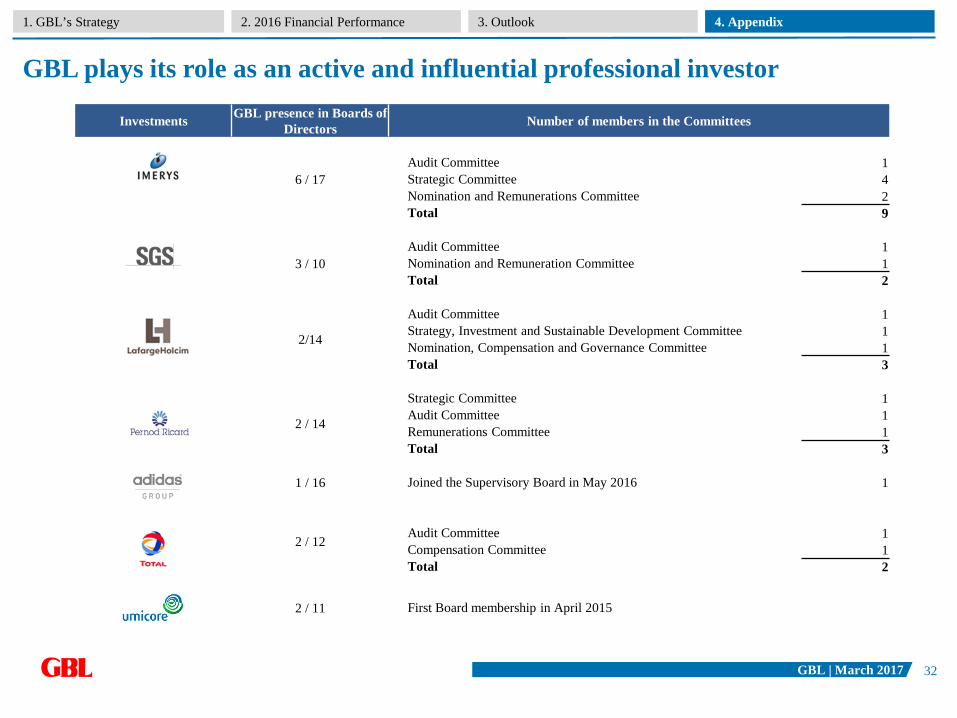
GBL plays its role as an active and influential professional investor
1. GBL’s Strategy 4. Appendix3. Outlook2. 2016 Financial Performance
Investments GBL presence in Boards of Directors Number of members in the Committees
6 / 17Audit Committee 1Strategic Committee 4Nomination and Remunerations Committee 2Total 9
3 / 10Audit Committee 1Nomination and Remuneration Committee 1Total 2
2/14
Audit Committee 1Strategy, Investment and Sustainable Development Committee 1Nomination, Compensation and Governance Committee 1Total 3
2 / 14
Strategic Committee 1Audit Committee 1Remunerations Committee 1Total 3
1 / 16 Joined the Supervisory Board in May 2016 1
2 / 12Audit Committee 1Compensation Committee 1Total 2
2 / 11 First Board membership in April 2015
32

GBL | March 2017
Sienna Capital provides several benefits to GBL
1. GBL’s Strategy 4. Appendix3. Outlook2. 2016 Financial Performance
Earn attractive risk-adjusted returns and contribute to growing GBL’s NAV and dividend+
Part of an ongoing diversification of GBL’s portfolio and revenue stream+
Attract talent around the activities of GBL and serve as a best ideas factory+
Provide co-investment opportunities +
100%
33
GBL | March 2017
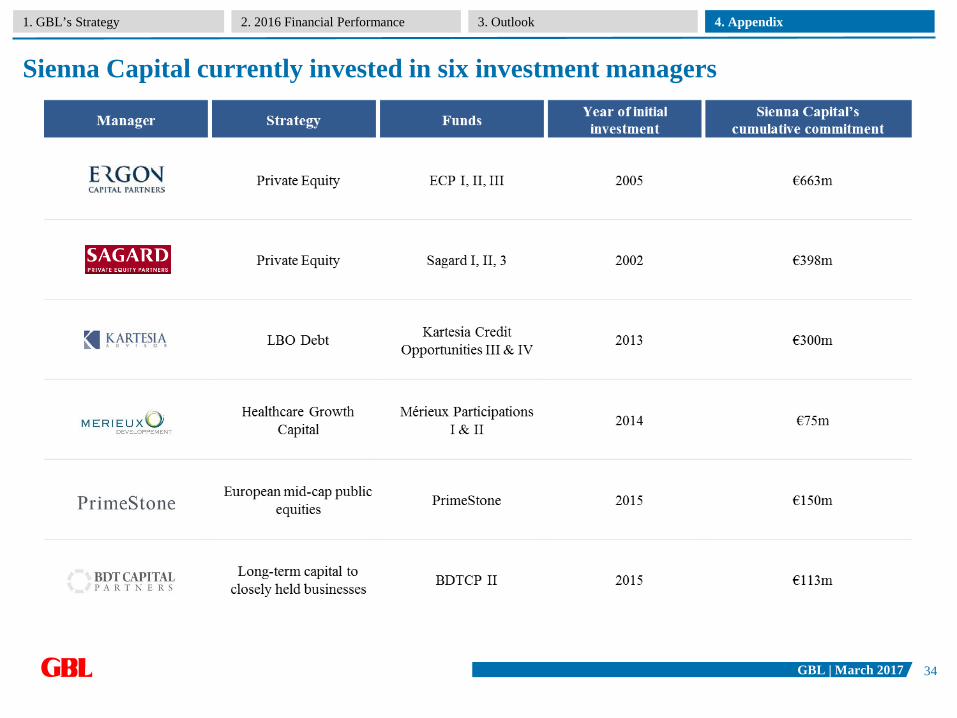
Sienna Capital currently invested in six investment managers
1. GBL’s Strategy 4. Appendix3. Outlook2. 2016 Financial Performance
34

GBL | March 2017
Sienna Capital – Description of the investments
1. GBL’s Strategy 4. Appendix3. Outlook2. 2016 Financial Performance
Ergon Capital Partners (ECP) was created in 2005 as a private equity fund operating in the mid-market segment. It invests between €20m and €70m in companies operating in niche markets in the Benelux, Italy, Spain, France, Germany and Switzerland, with positions that are dominant and sustainable over the long term and in industries with prospects for consolidation.
Kartesia offers liquidity and credit solutions to mid-sized European companies, while providing a higher stable return to its investors. In general, Kartesia wishes to facilitate the participation of institutional investors and major individual investors in the European LBO debt market, by offering them exposure to highly rated, resilient and diversified credit through primary, secondary or rescue financing operations carried out with duly selected mid-sized companies.
Created in 2002 on the initiative of Power Corporation of Canada, Sagard invests in companies valued at more than €100m that are leaders in their markets, primarily in French-speaking European countries. Working with company management, it supports them in their growth.
Established in 2009, Mérieux Développement is an investment manager specialised in growth and venture capital investments in the healthcare sector. Mérieux Développement works alongside entrepreneurs and companies whose products and services can bring genuine advances to the health of patients and consumers worldwide, offering them access to its industry expertise and global network. Mérieux Développement is an affiliate of Institut Mérieux.
BDT Capital Partners was created in 2009 by Byron Trott, a longstanding partner of Goldman Sachs, with the aim of meeting the strategic and financial needs of families and/or company founders around the globe.
PrimeStone was established in 2014 by three former partners from the Carlyle Group, specialised in buyouts, having worked and invested together across Europe for more than 15 years. PrimeStone has a strategy of construc-tive and active management in mid-sized listed European companies that have significant value creation potential through strategic, operational or fin. improvement. PrimeStone creates value by taking a long-term perspective, adopting an active approach and having a significant influence over its under-lying investments through a dialogue with boards and management teams.
35
GBL | March 2017
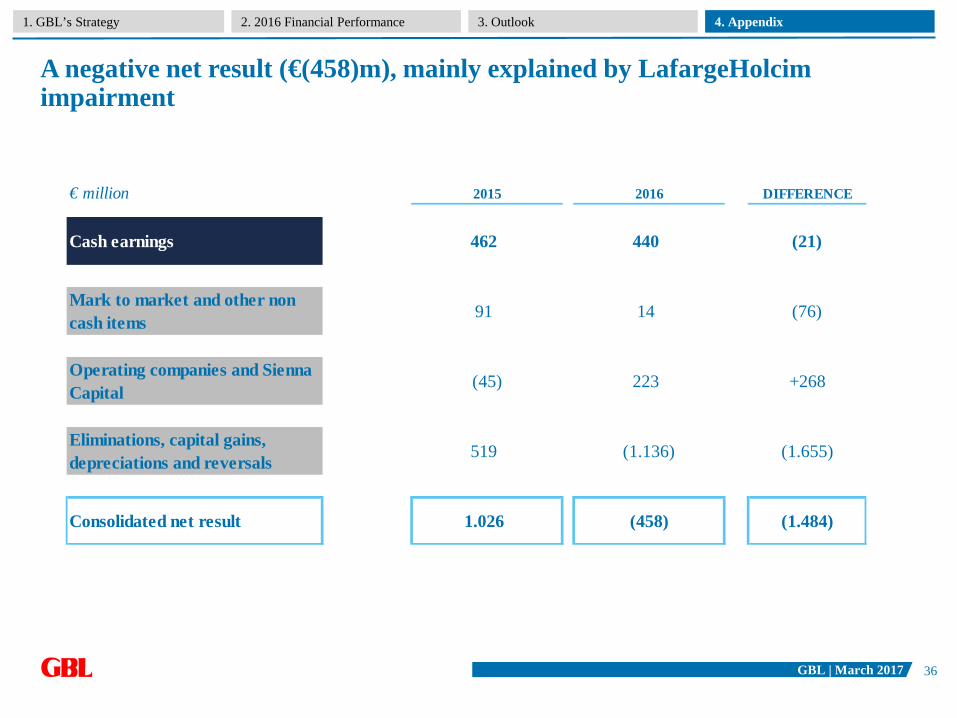
A negative net result (€(458)m), mainly explained by LafargeHolcimimpairment
€ million 2015 2016 DIFFERENCE
Cash earnings 462 440 (21)
Mark to market and other non cash items 91 14 (76)
Operating companies and Sienna Capital (45) 223 +268
Eliminations, capital gains, depreciations and reversals 519 (1.136) (1.655)
Consolidated net result 1.026 (458) (1.484)
1. GBL’s Strategy 4. Appendix3. Outlook2. 2016 Financial Performance
36
GBL | March 2017
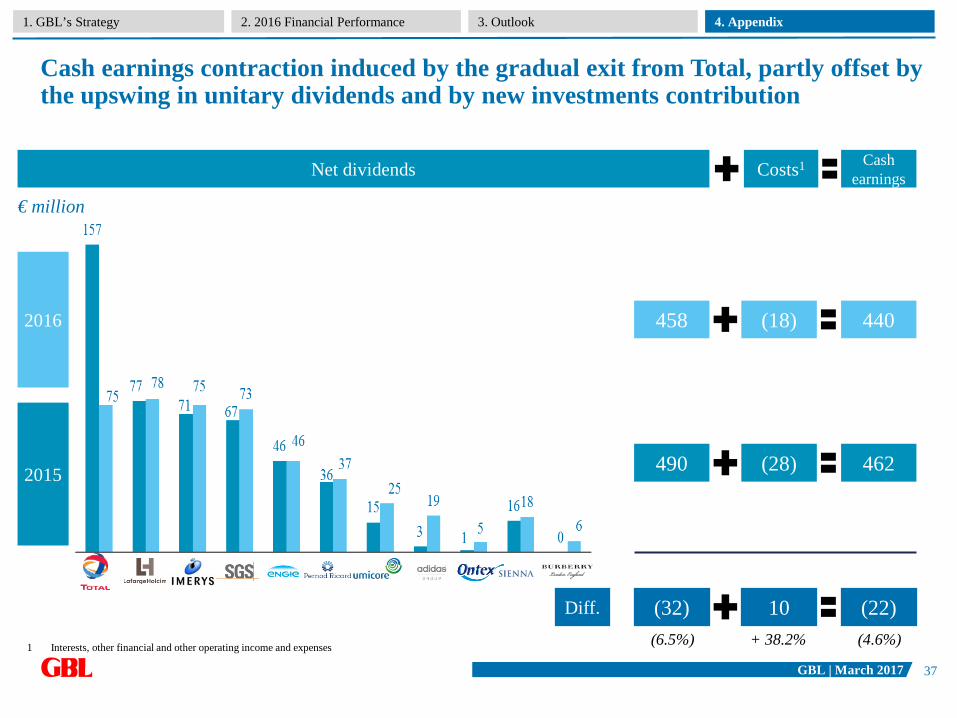
Cash earnings contraction induced by the gradual exit from Total, partly offset by the upswing in unitary dividends and by new investments contribution
2015
2016
Costs1Net dividends Cashearnings
10 (22)Diff. (32)
(28) 462490
(18) 440458
(4.6%)(6.5%) + 38.2%
€ million
1 Interests, other financial and other operating income and expenses
1. GBL’s Strategy 4. Appendix3. Outlook2. 2016 Financial Performance
37
GBL | March 2017
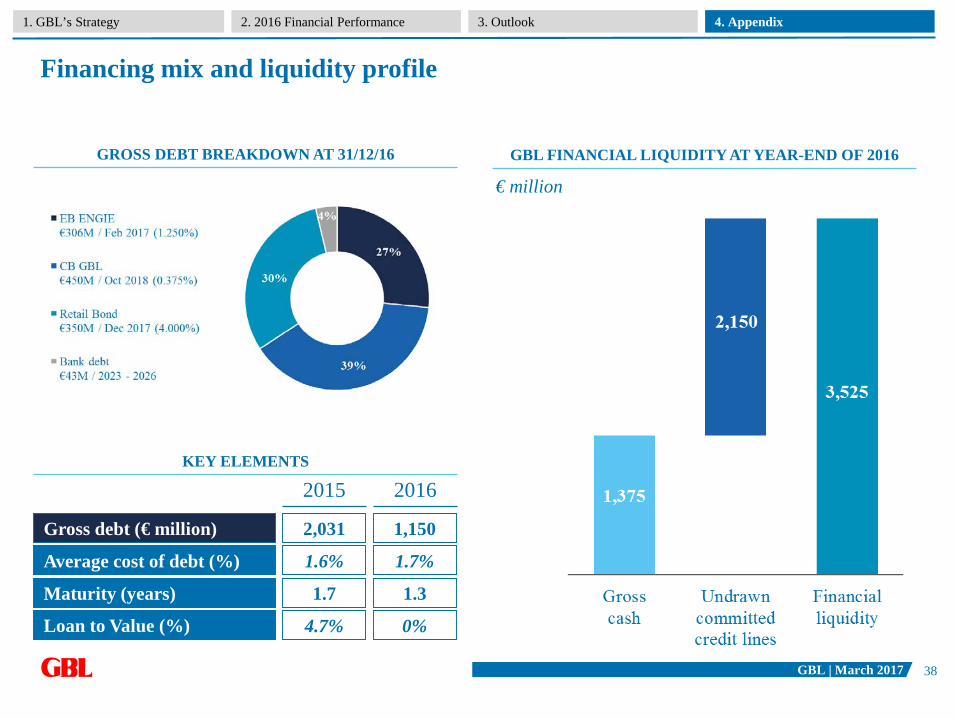
Financing mix and liquidity profile
GBL FINANCIAL LIQUIDITY AT YEAR-END OF 2016GROSS DEBT BREAKDOWN AT 31/12/16
2015 2016
Gross debt (€ million) 2,031 1,150
Average cost of debt (%) 1.6% 1.7%
Maturity (years) 1.7 1.3
Loan to Value (%) 4.7% 0%
KEY ELEMENTS
€ million
1. GBL’s Strategy 4. Appendix3. Outlook2. 2016 Financial Performance
38
GBL | March 2017
Profiles
Earlier in his career, Mr. Gallienne worked at the private equity firm Rhône Group in New York and London. In 2005, he founded and was Managing Director of the private equity funds of Ergon Capital Partners in Brussels.
He has been a Director of Groupe Bruxelles Lambert since 2009 and Co-CEO since 2012.
He graduated in Management and Administration, with a major in Finance, from the ESDE Business School in Paris and obtained an MBA from INSEAD in Fontainebleau.
Mr. Gallienne serves as a Director of Imerys, Pernod Ricard, SGS, Umicore and adidas.
Ian Gallienne – Co-CEO
Mr. Lamarche began his career at Deloitte Haskins & Sells in Belgium and in the Netherlands. He joined SociétéGénérale de Belgique as an investment manager and management controller from 1989 to 1995. He moved to Compagnie Financière de Suez as Advisor to the Chairman and Secretary of the Executive Committee (1995-1997) before becoming Deputy Director for Planning, Control and Accounting. In 2000, Gérard Lamarche joined NALCO (American subsidiary of the Suez Group and world leader in industrial water treatment) as Director, Senior Executive Vice President and CFO. In January 2003, he was appointed CFO of the Suez group.
He has been a Director of Groupe Bruxelles Lambert since 2011 and Co-CEO since 2012.
Mr. Lamarche has a degree in Economics from the University of Louvain-La-Neuve and the INSEAD Institute of Management (Advanced Management Program for Suez Group Executives).
Gérard Lamarche is on the board of several other quoted and non-quoted companies in Europe including Total, SGS and LafargeHolcim.
Gérard Lamarche – Co-CEO
1. GBL’s Strategy 4. Appendix3. Outlook2. 2016 Financial Performance
39
GBL | March 2017
Profiles
Mr. Blomme started his career in 1981 with Touche Ross (now Deloitte). In 1997, he was promoted Audit Partner of Deloitte. William Blomme joined GBL on 1 December 2014 and assumed the CFO function since 1 January 2015.
He holds a master degree in Applied Economics from UFSIA and INSEAD (International Director Program and Transition to General Manager). He is also holder of an EHSAL master degree in Taxation and a CEPAC master from Solvay Business School.
William Blomme – CFO
Mr. Hall began his career in the merchant banking group of Morgan Stanley. In 1997, he joined Rhône Group, aprivate equity firm, where he held various positions for 10 years in New York and London. In 2009, he was the co-founder of a hedge fund, sponsored by Tiger Management, where he worked until 2011. In 2012 he joined, as CEO,Sienna Capital, a 100% subsidiary of GBL, which manages GBL’s alternative investments (private equity, credit andspecific thematic funds). In 2016, Mr. Hall was appointed Head of Investments at GBL.
He holds a BA from Amherst College and an MBA from the Stanford University Graduate School of Business.
Mr. Hall also serves as a Director and member of the Audit Committee of Imerys; a Director of Umicore; Chairmanof the Supervisory Board of the credit fund Kartesia Management; and a Director of Ergon Capital Partners.
Colin Hall – Head of Investments
1. GBL’s Strategy 4. Appendix3. Outlook2. 2016 Financial Performance
40

GBL | March 2017
Profiles
He started his career in the banking sector at Générale de Banque (now BNP Paribas Fortis), where he held various commercial positions. He moved on to Crédit Lyonnais Belgium (now Deutsche Bank) working mainly in fixed income and after a couple of years he joined de Buck Vermogensbankiers in Ghent where he managed for eight years the buy-side research department. After 12 years of experience as a sell-side equity analyst for Benelux holding and portfolio companies at Bank Degroof Petercam, Hans D’Haese joined GBL in December 2016, where he is in charge of investor relations.
Hans D’Haese graduated in Business Management from the Ghent Odysee University-College.
Hans D’Haese – IR
1. GBL’s Strategy 4. Appendix3. Outlook2. 2016 Financial Performance
41
GBL | March 2017
Disclaimer
This presentation has been prepared by Groupe Bruxelles Lambert (“GBL”) exclusively for information purposes. This presentation isincomplete without reference to, and should be viewed solely in conjunction with, the oral briefing provided by GBL.
This document should not be construed as an offer, invitation to offer, or solicitation, or any advice or recommendation to buy, subscribe for, issue or sell any financial instrument, investment or derivative thereof referred to in this document or as any form of commitment to enter into any transaction in relation to the subject matter of this document.
This presentation has not been reviewed or registered with any public authority or stock exchange. Persons into whose possession this presentation come are required to inform themselves about and to comply with all applicable laws and regulations in force in anyjurisdiction in or from which it invests or receives or possesses this presentation.
Prospective investors are required to make their own independent investigations and appraisals of GBL before taking any investment decision with respect to securities of GBL.
GBL does not make any representation or warranty (expressed or implied) as to the accuracy or completeness of the informationcontained in this document and as to the accuracy of the projections, estimates, assumptions and figures contained in this document. By receipt of this document, the recipient agrees that GBL (or either of its shareholders, directors or employees) shall have no liability for any misstatement or omission or fact or any opinion expressed herein, nor for the consequences of any reliance upon any statement, conclusion or opinion contained herein. All value indications included in this document are derived from the financial markets as of the date of this report. It is therefore obvious that a modification of the conditions prevailing in the financial markets will have an effect on the figures present hereafter.
This document is the exclusive property of GBL. Recipient of this presentation may not reproduce, redistribute or pass on, in whole or in part, this presentation to any person.
By using or retaining a copy hereof, user and/or retainer hereby acknowledge, agree and accept that they have read this disclaimer and agreed to be bound by it.
1. GBL’s Strategy 4. Appendix3. Outlook2. 2016 Financial Performance
42