Introduction to Transportation Engineering Prof. K...
38
Introduction to Transportation Engineering Prof. K. Sudhakar Reddy Department of Civil Engineering Indian Institute of Technology, Kharagpur Lecture - 39 Concrete Pavement Design PCA and AASHTO Methods Hello students welcome to lesson 16 of module IV. Module IV is on pavement design. This lesson is about designing concrete pavements as per PCA and AASHTO design procedures. In the previous lesson that is lesson 4.15 we have discussed about designing concrete pavements as per Indian Road Congress guidelines that is IRC: 58 - 2002 version. We will see the similarities and differences between these two procedures that I am going to discuss in this lesson and the Indian Road Congress design procedure also. (Refer Slide Time: 00:01:33 min) So the specific objectives of this lesson would be after completing this lesson the student is expected to understand the basis for the PCA and AASHTO methods for design of concrete pavements. PCA is the Portland Cement Association and AASHTO is the American Association of State Highway and Transport Officials as we have learnt in the earlier lessons. Therefore the student would be in a position to understand the basis for the PCA and the AASHTO methods for the design of concrete pavements. They would be familiar with the concepts adopted for these two different agencies for design of concrete pavements. The students would be able to select appropriate traffic and material inputs for design as per these two different procedures and they would be also be in a position to carry out designs of concrete pavements as per PCA and AASHTO criteria. 1
Transcript of Introduction to Transportation Engineering Prof. K...

Introduction to Transportation Engineering Prof. K. Sudhakar Reddy
Department of Civil Engineering Indian Institute of Technology, Kharagpur
Lecture - 39 Concrete Pavement Design PCA and AASHTO Methods
Hello students welcome to lesson 16 of module IV. Module IV is on pavement design. This lesson is about designing concrete pavements as per PCA and AASHTO design procedures. In the previous lesson that is lesson 4.15 we have discussed about designing concrete pavements as per Indian Road Congress guidelines that is IRC: 58 - 2002 version. We will see the similarities and differences between these two procedures that I am going to discuss in this lesson and the Indian Road Congress design procedure also. (Refer Slide Time: 00:01:33 min)
So the specific objectives of this lesson would be after completing this lesson the student is expected to understand the basis for the PCA and AASHTO methods for design of concrete pavements. PCA is the Portland Cement Association and AASHTO is the American Association of State Highway and Transport Officials as we have learnt in the earlier lessons. Therefore the student would be in a position to understand the basis for the PCA and the AASHTO methods for the design of concrete pavements. They would be familiar with the concepts adopted for these two different agencies for design of concrete pavements. The students would be able to select appropriate traffic and material inputs for design as per these two different procedures and they would be also be in a position to carry out designs of concrete pavements as per PCA and AASHTO criteria.
1

(Refer Slide Time: 00:02:38 min)
So the two design methods that we are discussing today in this lesson are those adopted by Portland Cement Association PCA method and the American Association of State Highway and Transport Officials AASHTO. (Refer Slide Time: 00:02:56 min)
We will first start with Portland Cement Association method PCA method.
2

(Refer Slide Time: 00:03:03 min)
The first set of guidelines as per PCA was published in 1984. The performance criteria and design criteria and the design methodology that was published in 1984 was based mainly on the performance data collected at the AASHO road test. In fact as i indicated AASHO test had various types of pavements, flexible pavements, and different types of concrete pavements. So the performance of different types of concrete pavements were observed during the AASHO road test, that data and those pavements were analyzed with subsequently led to different types of performance criteria for different types of pavements. We have already seen AASHTO guidelines for design of flexible pavements. We will also discuss about AASHTO guidelines for design of concrete pavements in this lesson and with the same data form the basis for most of the other design procedures such as Portland Cement Association also. the main failures considered in the PCA design procedure are fatigue cracking of concrete and erosion of foundation, these are the two main failures. If you recollect in the previous lesson on design of concrete pavements as per IRC procedure there also we made a mention of erosion failure but IRC does not make any specific design provisions for carrying out erosion analysis. But one provision that was made to handle erosion in IRC concrete pavement design was provision of concrete rather paved shoulders of 1.5 m width. But there is no specific analysis included in the IRC procedure for erosion analysis. So PCA considers two types of failures fatigue cracking and erosion of foundations. Fatigue failure is the one in which the pavements fail by fatigue of concrete. Erosion failure is the one in which the pavements fail by pumping. We have discussed about pumping in the previous lesson. Erosion of foundation leading to formation of gaps below the slab and joint faulting that is joint being at different levels.
3

(Refer Slide Time: 00:05:35 min)
For fatigue analysis the critical stress is because if the load is placed in different regions of the slab the tensile stresses that will be developed will be different so the critical condition of load position has to be selected. The critical stress condition is considered to be edge stresses and the midway between the transverse joints. If you consider these two transverse joints and if this is the longitudinal edge which is the free edge and next to this we have a shoulder so we are concerned about the edges that are developed along the sides when the wheel load is placed close to the edge with the tire imprints being tangential to the longitudinal edge and it is away from these two transverse joints, that’s what we mean by midway. So this is the position of the load that we are concerned about, the edge stresses midway between the transverse joints in the edge region away from the joints. There are two cases that we consider with and without concrete shoulders. This is what PCA considers, there are two cases. There will be concrete shoulders tied to the main slab or without tied concrete shoulders.
4

(Refer Slide Time: 00:07:11 min)
Cumulative fatigue damage concept is used in PCA. Stresses due to warping and curling are not considered for fatigue analysis. these stresses are not added to the wheel load stress while carrying out fatigue damage analysis because both of them happen throughout the year throughout the life period both the combination being additive is not possible, sometimes it is additive and sometimes it is subtractive. So the warping and curling stresses are not considered and they are not added to the wheel load stresses for carrying out fatigue analysis. The combined stresses due to warping which occurs because of variation moisture within the slab and curling which occurs because of the variation in temperature within the slab are usually subtractive from load stresses most of the time. (Refer Slide Time: 00:08:09 min)
5

The fatigue damage is computed using this expression where Dr is the cumulative damage caused to the slab given as sum of ni divided by Ni where i varies from 1 to m. Here m is the number of load groups. suppose if you have the axle load data and then you have to group the axle load data into m groups, group 1 being say 0 to 4 tons, group 2 could be 4 to 8 tons whichever way you classify it we have eight groups of load groups then Ni is the predicted number of repetitions for ith load group. What is the number of load repetitions of the ith group? Say 0 to 4 tons expected to be applied on the pavement during its service life period. This is has to be available to us from traffic projections. So small ni is the number of load repetitions of group i. Capital Ni is the allowable number of repetitions for ith load group. That means if you apply only the ith load group loads say 0 to 4 ton loads only then how many repetitions of this load group the slab can handle before it fails? That is capital Ni. So once you get this ratio for different load groups you can sum up all those relative damages and accumulated damage ratio should be smaller than hundred percent for the slab to be safe. (Refer Slide Time: 00:09:50 min)
This is the fatigue relationship considered for concrete. In terms of the stress ratio these relationships explain how many repetitions the slab can handle or the concrete material can handle before it fails in fatigue damage. As you have seen in the case of IRC guidelines in fact these are similar guidelines. For different stress ratio conditions different relationships are given correlating the number of repetitions the concrete can handle for a given stress ratio before it fails in fatigue damage. As you can see in this slide for different stress ratio values given by sigma by Sc where sigma is the tensile stress in concrete because of the load under consideration where Sc is the tensile strength of concrete we have represented this as stress ratio SR. So, if the stress ratio is greater than or equal to 0.55 the
6

number of repetitions to fatigue failure Nf is given as the function of stress ratio sigma by Sc by this equation. For stress ratio range of 0.45 to 0.55 number of repetitions to failure of the slope group are again given as a function of stress ratio. For N less than 0.45 it is assumed that the concrete is capable of handling infinite number of repetitions. (Refer Slide Time: 00:11:40 min)
For carrying out fatigue analysis that means for calculating the wheel load stresses the wheels placed close to the edge produce maximum stresses. Even if the loads are slightly placed away from the edge the reduction in stress is significant. So it is important to understand what percentage of wheel loads are going to be placed close to the pavement edge. All those loads that are placed even slightly away from the pavement edge it is seen that the reduction in stress is significant and it is not going to significantly be contributing towards fatigue damage. So we are concerned about those wheel loads which are placed very close to the pavement edge. Portland Cement Association PCA analysis indicates that considering only 6% of total traffic traveling in one direction and assuming that all these trucks have their outer wheels placed in the edge region produces the same cumulative fatigue damage produced by all the trucks positioned at different locations from the edge.
7

(Refer Slide Time: 00:12:57 min)
But again what we are trying to indicate is if this is the pavement, for example at a given point of time if this is how the vehicles are placed (Refer Slide Time: 13:20) if we put these wheels exactly in the same position if this is the realistic practical position of vehicles then depending on the traffic intensity depending on the facility that is available all the wheels are not going to travel along the same path, they are not going to follow any particular path but they are going to be distributed across the carriage way breadth. One vehicle may travel all along this path, another vehicle will travel along this path and another may take a slightly different path so the wheel load positions are going to be distributed across this width. So, if you put these wheel loads exactly in the same position and calculate stresses in the edge region and on the other hand if you put only six percentage of all these vehicular traffic exactly in the edge region position as shown here then in both cases the edge stresses that are going to be computed will almost be similar. So that is what PCA has worked out. Hence to repeat this again PCA analysis indicates that considering only six percentage of traffic and assuming that all these trucks have their outer wheels placed in the edge region produces the same cumulative fatigue damage produced by all the trucks positioned at different locations from the edge. So what is being emphasized here is that we need to consider only certain portion of all the truck traffic and then assume that these vehicles are traveling with their outer wheels placed tangential to the outer edge and then analyze the slab only for those wheels. If the total traffic is considered, for example, if you trying to consider the total traffic, assume all the hundred percent repetitions you are considering then it can still be done but the edge stress computed will have to be reduced by a factor of 0.894 that will be corresponding to the actual total cumulative damage that you can obtain.
8

(Refer Slide Time: 00:15:50 min)
Coming to erosion analysis that is considered in PCA analysis pavement problems such as pumping, faulting and erosion of foundation etc are more due to the deflection than due to stresses in the slab. Deflection is the consideration that we have to be concerned about. If there are more deflections there is going to be more amount of pumping, more amount of erosion and more faulting problems also are likely to be there if the slab deflects more. Most critical location for deflection obviously is the corner because of its discontinuity in two directions that is when the load is placed in the corner region. Erosion is influenced by the type of joint. obviously if there is low transfer across the joint the deflection is going to be lesser erosion is going to be lesser so we have to consider what is the type of joint that is there, what is the type of low transfer mechanism whether it is through granular interlocking or if there is a provision of dual bars placed across the joints so we have to take all these things into account before computing what is the deflection and accordingly what is going to be the erosion damage caused to the foundation.
9

(Refer Slide Time: 00:17:05 min)
So, for carrying out erosion analysis the critical loading positions will be the corner location as we just discussed. So the load has to be placed in a corner region. this is one free edge (Refer Slide Time: 17:23) there is shoulder on this side, there is another free edge this may not be exactly free but there is another slab that is on the other side and there is a joint here so this is where some amount of discontinuity is there in both the directions so we have to place these wheel loads as close to the corner as possible and that is when we are going to be having maximum deflection in the corner region that is the critical condition. Again we will have to assess what percentage of total traffic will have their wheel load positions in the corner region, whether it is hundred percent or part of that. (Refer Slide Time: 00:17:56 min)
10

This is the erosion criteria that PCA adopts to estimate how many repetitions the pavement can sustain before unacceptable levels of erosion takes place before the slab or the foundation fails because of erosion failure. This is given as log N = 14.524 – 6.77 into C1 P – 9 to the power 0.103. In this case C1 is an adjustment factor. To account for different types of sub-bases that are used C1 will be one for untreated granular sub-base and C1 will be 0.9 for stabilized sub-base. The other parameter that we use here P is the rate of work computed as 268.7 into P square by h into k to the power of 0.73. This is the function of the pressure on the foundation under the slab corner, h is the thickness of the slab and k is the modulus of subgrade reaction. So the rate of work is a function of all the pavement parameters, thickness of slab and modulus of subgrade reaction and the deflection of the slab at the corner which can be used to obtain the pressure as p = kw where’ w’ is the deflection in the corner region because of load applied in the corner, ‘k’ is the modulus of subgrade reaction because of the assumption that we made about the spring foundation the reactive pressure is proportional to the deflection proportional to constant as we know is the modulus of subgrade reaction. So, if you can calculate the deflection in the corner region due to a load that is placed in the corner then using this expression we can find out ‘p’ slab thickness has to be known and ‘k’ also is an input parameter so you can calculate the rate of work. So substituting this in the above equation we can find out given the load how many repetitions the slab can sustain before it fails because of erosion failure. (Refer Slide Time: 00:20:38 min)
Percentage erosion damage, again here we are going to have different magnitudes of loads and different magnitudes of load would produce different amount of deflection so the erosion damage caused by different axle load groups will be different so we have to sum up all the damage caused because of all the groups of axle loads so this is how we do the summation. So the total erosion damage is again a summation of a multiplication factor C2 small ni divided by capital Ni
11

C2 takes values of 0.06 or 0.94 depending upon what type of a shoulder is provided, whether it is without concrete shoulder or with a concrete shoulder which is tied to the main slab, accordingly C2 will take values of either 0.06 or 0.94. The percentage erosion should be less than 100%. Again small ni as discussed in the previous slide or as discussed in the case of fatigue damage analysis is the number of repetitions of group i and capital Ni is the number of repetitions the slab can sustained as per the criteria given in the previous slide for a given load because we can calculate the corresponding deflection for that load and for that deflection for a given pavement system how many repetitions it can sustain can be obtained from the erosion criteria as given in the previous slide. So the total percentage erosion should be less than 100%. (Refer Slide Time: 00:22:17 min)
The design inputs that are to be obtained for carrying out design as per PCA analysis are; about the concrete we need to have the flexural strength of concrete represented in terms of modulus of rupture expressed as MR, we have to have information regarding the subgrade strength in terms of the modulus of subgrade reaction, we also have to have information in terms of the loading, magnitudes of axle loads and also the frequency of axles of commercial vehicles, we are interested in only commercial vehicles. Normally design period is considered to be 20 years.
12

(Refer Slide Time: 00:22:59 min)
The flexural strength of concrete influences the fatigue behavior of concrete. Modulus of rupture determined at 28 days under third point loading; how this has to be obtained is also specified, the specimens have to be prepared, third point loading has to be conducted and the modulus of rupture obtained from the test at a 28 day period has to be used for design. Subgrade strength has to be obtained by conducting a plate load test. This is what is recommended by Indian Roads Congress also. The load per unit loaded area per unit deflection is the modulus of subgrade reaction as we already know. PCA also suggests that k value can be estimated from California Bearing ratio value of the subgrade or its R-value. It also recommends that normal summer or fall k values should be used. Seasonal variation of k is not normally considered.
13
(Refer Slide Time: 00:24:03 min)
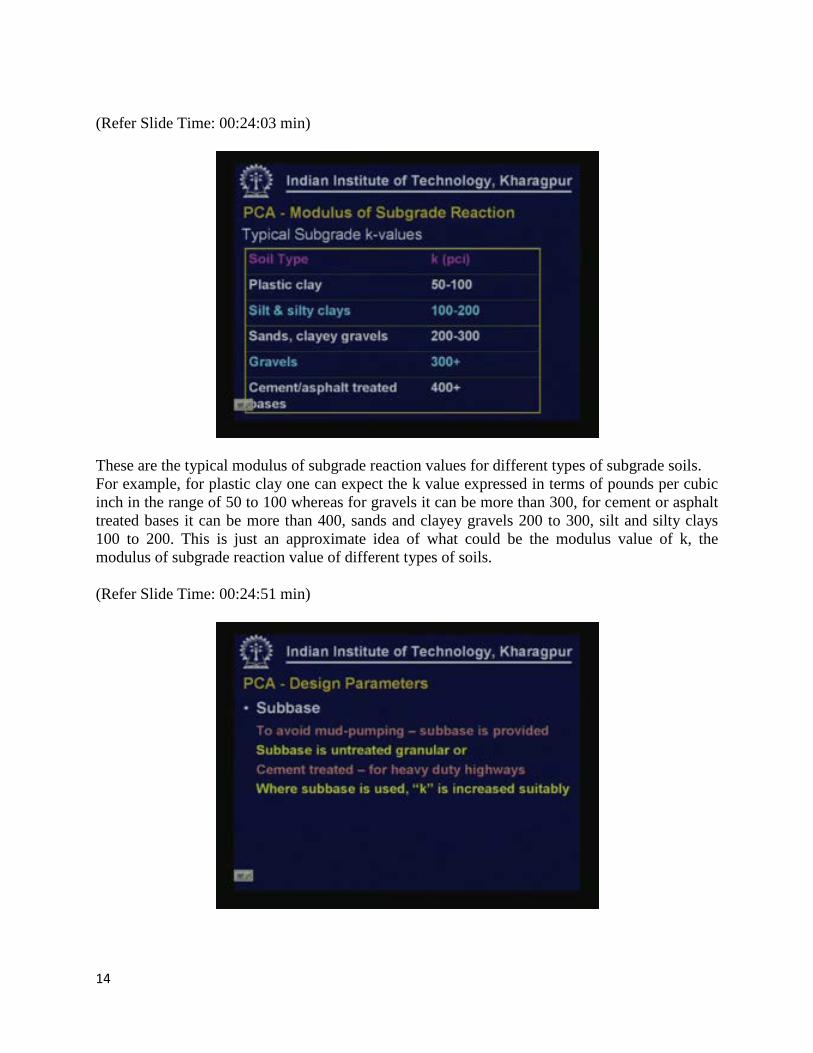
These are the typical modulus of subgrade reaction values for different types of subgrade soils. For example, for plastic clay one can expect the k value expressed in terms of pounds per cubic inch in the range of 50 to 100 whereas for gravels it can be more than 300, for cement or asphalt treated bases it can be more than 400, sands and clayey gravels 200 to 300, silt and silty clays 100 to 200. This is just an approximate idea of what could be the modulus value of k, the modulus of subgrade reaction value of different types of soils. (Refer Slide Time: 00:24:51 min)
14

We may provide sub-base to avoid mud-pumping. Sub-base can be untreated granular base or cement treated especially for heavy duty highways high volume roads. So normally we provide granular sub-base untreated, untreated either with cement or asphalt or bitumen so that is what is known as granular sub-base or we can also have cement treated base. If you recollect IRC: 58 recommends use of dry lean concrete as sub-base. Especially IRC: 58 is meant for high volume roads like national highways and other heavy traffic roads. So dry lean concrete is what is recommended there. So PCA also recommends that you can either use an untreated granular surface or cement treated base. And wherever the sub-base is used obviously the k value has to be increased suitably. (Refer Slide Time: 00:25:54)
This is how we can increase the modulus of subgrade reaction of a given subgrade if sub-base of different thicknesses are used. This table here gives us guidelines about how to obtain the corresponding increased effect to combined modulus of subgrade reaction for the two layers subgrade and the granular sub-base this is for untreated sub-base. If you provide a 6 inch untreated sub-base over the subgrade having 100 pci modulus of subgrade reaction the combined effect to modulus of subgrade reaction can be taken to be 140 pci pounds per cubic inch. Similarly, if we place a 12 inch granular sub-base over a subgrade having a k value of 300 pci the effective k value can be taken as 430.
15

(Refer Slide Time: 00:27:05 min)
Similarly if cement-treated sub-base is used on subgrade this is how you select the combined effective subgrade modulus of reaction. So for different thicknesses for different subgrade k values the effect to k values are given here. (Refer Slide Time: 00:27:27 min)
Other design parameters relating to traffic are; we have to select a design period or the traffic analysis period, this has to be selected on the basis of economic analysis of pavement costs and services. Other traffic parameters are selecting number of heavy axle loads expected during the pavement life. These are to be derived from commercial traffic as percentage of average daily
16

traffic average daily traffic, average daily truck traffic in both the directions and also we have to have information regarding axle loads spectrum. (Refer Slide Time: 00:28:07 min)
The traffic projections are to be made in the following manner: Design ADT will be a projection factor multiplied by the present average daily traffic. Projection factors normally range from 1.2 to 1.8 for annual growth rates of 2 to 6%. PCA also recommends usage of load safety factors LSF as you have done in the case of IRC: 58 also. For different types of facilities different load safety factors are given. as you can see here for high traffic volume roads load safety factor of 1.2, for moderate volumes of truck traffic load safety factor of 1.1, for roads, residential streets, other streets where small volumes of truck traffic is there a load safety factor of 1 can be used. These are similar to the values that are adapted in the case of IRC: 58.
17

(Refer Slide Time: 00:28:59 min)
The other inputs that are required for design are what type of joints are provided, what is the type of shoulder that is there; concrete shoulder, unpaved, tight concrete shoulder etc, so different PCA gives design provisions for different types of shoulders. Concrete flexural strength at 28th day has to be obtained and the k-value of subgrade or the combined modulus of subgrade reaction of subgrade and any granular treated or untreated base has to be available. We have to select a load safety factor depending on the type of facility, we have to have information on the axle load distribution, and we also have to have projection about the expected number of repetitions of different axle load groups during the design period. (Refer Slide Time: 00:29:52 min)
18

The design method follows the following steps: For both fatigue analysis and erosion analysis separate tables are available and separate charts are available. Although if the program is available one can do the analysis independently but for somebody who is doing the analysis on the basis of tables and charts a series of charts and tables are available in the PCA guidelines to easily work out what is the fatigue damage and also what is the erosion damage. Separate tables are used to evaluate fatigue and erosion damage. Equivalent stress tables are available which give us for a given thickness of slab say 4 to 14 inches thick and for a given k-value of foundation either only the subgrade or the combined effective k value of subgrade and the base we can find two values in the table. For example, for 4 inches and for a k-value of 50 825 and 679 are the values that are available whereas 829 is the equivalent stress for single axle and 679 is an equivalent stress parameter for a tandem axle. So the number on the left that is 825 in this case is for single axle and the number on the right that is 679 in this case is for a tandem axle. This table is for a case where no concrete shoulder is used but a similar table is available for pavement with concrete shoulder. (Refer Slide Time: 00:31:43 min)
These stress analysis tables were developed using a finite element program JSLAB for the following data: • Modulus value of concrete was considered to be 4 into 10 to power of 6 psi • Poisson ratio is taken as 0.15 • For dowel bar that were considered the dowel bar dia was taken as 0.5 inches • The dowel spacing was 12 inches • Modulus of dowel support was taken as 2 into 10 to power of 6 pci
19

• Spring constants were used to model the aggregate interlocking and similarly spring constants were also used to model the joint between the shoulder and • The main slab through this tied concrete shoulder so these are the spring constants that are used 5000 psi and 25000 psi. (Refer Slide Time: 00:32:41 min)
The equivalent stresses shown in the tables are edge stresses multiplied by 0.894. This is to account for the portion of loads placed close to the edge. So it’s assumed we are considering only those loads which are going to be placed close to the edge so to account for that the stresses are already multiplied by a factor of 0.894. Edge design is considered to be critical and the stresses that are computed are for edge design. The single axle considered is 18 kip and tandem axle considered is 36 kip in this analysis. These stresses are corresponding to 18 kip single axle and 36 kip tandem axle.
20

(Refer Slide Time: 00:33:34 min)
The fatigue analysis proceeds like this; we assume a trial thickness and determine equivalent stress for single axle that is 18 kip axle and tandem axle that is 36 kip axle. We determine these from the tables for a given slab thickness for a given k-value and for either single axle or tandem axle as you have seen in the previous slide we have equivalent stress values available for both single and tandem axle so we can select those values from those tables. Next we compute stress ratio factor as the ratio for equivalent stress to the design MR. For the given concrete grade that you have selected we know the modulus of rupture value that is the flexural strength of concrete. Once we know that we have already selected the equivalent stress value from the table so equivalent stress divided by modulus of rupture gives us the stress ratio. Obviously we will have one stress ratio value for single axle because we have a different equivalent stress value selected from the table for a single axle. Similarly we will have another value of stress ratio for tandem axle because there is another equivalent stress value that is obtained from the table. For modulus of rupture we use 28 days strength. We estimate allowable repetitions Nf from the following chart which will be shown in the next slide. For allowable repetitions falling outside the range of the chart it is assumed that the allowable repetitions are considered to be infinite.
21
(Refer Slide Time: 00:35:04 min)
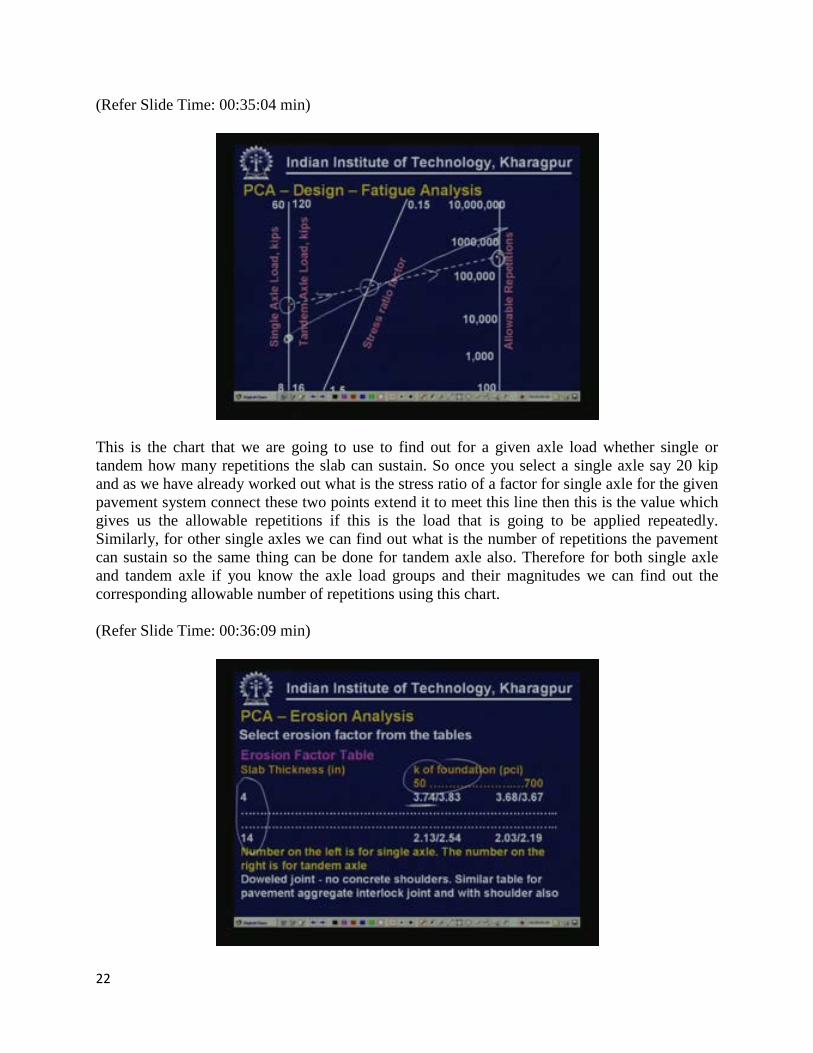
This is the chart that we are going to use to find out for a given axle load whether single or tandem how many repetitions the slab can sustain. So once you select a single axle say 20 kip and as we have already worked out what is the stress ratio of a factor for single axle for the given pavement system connect these two points extend it to meet this line then this is the value which gives us the allowable repetitions if this is the load that is going to be applied repeatedly. Similarly, for other single axles we can find out what is the number of repetitions the pavement can sustain so the same thing can be done for tandem axle also. Therefore for both single axle and tandem axle if you know the axle load groups and their magnitudes we can find out the corresponding allowable number of repetitions using this chart. (Refer Slide Time: 00:36:09 min)
22

Similar analysis can be done for erosion also. We have tables available in PCA design procedure for finding out erosion factors. Again these are functions of slab thickness and the k-value of the foundation. Here also we have different erosion factors for single axle and then tandem axle. You can see that the tandem axle factors are larger than the values given for single axle whereas in the case of stresses the stress factors are more for single axle when compared to the tandem axles. Here also we have tables available for different types of shoulders. (Refer Slide Time: 00:36:58 min)
Therefore like we have done in the case of fatigue analysis we can carry out erosion analysis also for a single axle load if you know the magnitude so this will be connected to the erosion factor that is selected from the table connecting these two extending this to meet the other line we will get the number of repetitions the pavement can sustain before it fails in erosion damage. So we can select other magnitudes of single axle also connect this to this, find out how many repetitions it can sustain and a similar analysis can be done for random axles also. So if you have axle load spectrum available different load groups for single axle the number of repetitions of single axle that are going to be expected these charts will give us for fatigue analysis how many repetitions of this load group are going to be permissible if it’s a single axle and similarly how many repetitions of this particular load is going to be acceptable if it is a tandem axle. We know what repetitions are expected, we know what repetitions are permitted so from this we can calculate the cumulative damage.
23

(Refer Slide Time: 00:38:13 min)
Now let us take a design example. The input data that we were considering is this is a 4-lane interstate pavement with doweled joints with no concrete shoulders so we are not providing any concrete shoulders here. We are providing a 6 inch thick untreated sub-base on a subgrade having k of 100 pci, modulus of rupture of concrete that is flexible strength of concrete is 600 psi and the expected load repetitions are given in the following tables: (Refer Slide Time: 00:38:45 min)
24

For single axle for different load groups this is the frequency. For example, for the load group having a midpoint value of axle load of 30 tons there are going to be about 6000 repetitions. Similarly for a load group having a midpoint of 16 tons we are going to have about 450,000 repetitions. Similarly axle load spectrum for tandem axles is also given in the slide. (Refer Slide Time: 00:39:13 min)
Starting with a trial thickness of about 10 inches for the 6 inches untreated sub-base that we have provided let us assume we are going to provide dowel joints there is no concrete shoulder so the combined k-value is selected from the charts that are available from PCA as 140 pci, MR is given as 650 and this being an important road we will select a load safety factor of 1.2, the design period let us consider to be 20 years. For a slab thickness of 10 inches and combined k-value of 140 pci equivalent stress this being a case without shoulders for single axle is 189 so the stress ratio is 189 divided by 650 which is the flexural strength of the concrete that is 0.291. Similarly, for tandem axle the stress ratio is 0.272, the erosion factors for the given case it is 2.53 for single axle and 2.73 for tandem axle.
25
(Refer Slide Time: 00:40:17 min)
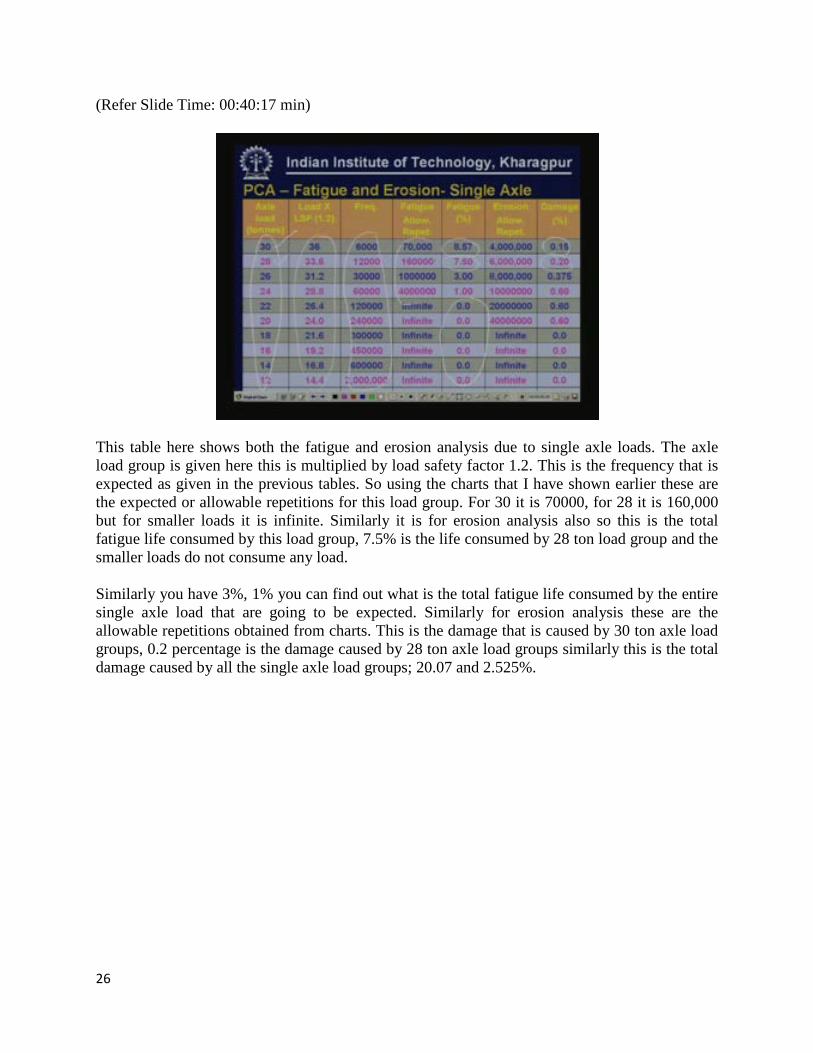
This table here shows both the fatigue and erosion analysis due to single axle loads. The axle load group is given here this is multiplied by load safety factor 1.2. This is the frequency that is expected as given in the previous tables. So using the charts that I have shown earlier these are the expected or allowable repetitions for this load group. For 30 it is 70000, for 28 it is 160,000 but for smaller loads it is infinite. Similarly it is for erosion analysis also so this is the total fatigue life consumed by this load group, 7.5% is the life consumed by 28 ton load group and the smaller loads do not consume any load. Similarly you have 3%, 1% you can find out what is the total fatigue life consumed by the entire single axle load that are going to be expected. Similarly for erosion analysis these are the allowable repetitions obtained from charts. This is the damage that is caused by 30 ton axle load groups, 0.2 percentage is the damage caused by 28 ton axle load groups similarly this is the total damage caused by all the single axle load groups; 20.07 and 2.525%.
26

(Refer Slide Time: 00:41:45 min)
Let us do a similar analysis for tandem axle load groups also. Total fatigue damage that is caused, none of the tandem axle load groups are causing any fatigue damage but they are causing more erosion damage as expected. (Refer Slide Time: 00:42:03 min)
So the total fatigue damage caused by single axle load groups and tandem axle load groups is 20.07 + 0 that is a total of 20.07 which is of course well below 100% and the total erosion damage is 2.53 + 22.73 = 25.26 which also is well below 100%. So obviously the thickness that was selected is quite safe. However, it is desirable that more trials be made to reduce the slab thickness because the slab is over safe in this case.
27

(Refer Slide Time: 00:42:48 min)
We will next deal with the American Association of State Highway and Transport Officials design method of designing concrete pavements. (Refer Slide Time: 00:42:58 min)
We are referring to the guide for design of pavement structures 1993 as discussed in the case of design of flexible pavements using AASHTO design procedure. This design procedure is also based extensively on the findings from AASHO road test which were conducted in the 1950s. There was an interim guide published in 1972, there is a revised guide in 1981 and there was another one in 1993. There is a draft revision of 2002 version being discussed at present.
28

(Refer Slide Time: 00:43:39 min)
But the salient features and the design features that we are going to discuss in this lesson will be those which are there in the 1993 version of AASHTO guidelines. There are number of salient features that are incorporated in these guidelines like reliability concept, traffic consideration in terms of 18 kip standard axle repetitions, to convert a given axle load into 18 kip standard axle load repetitions use of the equivalent axle load factors, then measuring performance in terms of present serviceability index and so on. We have discussed earlier that present serviceability index at a particular time is obtained from measurements of roughness and distress which will be in terms of cracking and patching. (Refer Slide Time: 00:44:30 min)
29

So the AASHO road test equation for present serviceability index for concrete pavements is given as present serviceability index is equal to 5.41 – 1.71 log 1 + SV – 0.09 multiplied by C + P under root. We discussed about slope variance in the lesson on design of flexible pavements as per AASHTO procedure. Slope variance gives us an indication of how the longitudinal slope varies when it is measured over a small base length of 9 inches. C is the cracked area expressed in terms of square feet per thousand square feet of paved area, P is the patched area again expressed in terms of square feet of patched area in terms of thousand square feet of paved area. The one thing that is different in this equation compared to the one that we have used for flexible pavements is that in flexible pavements we have also used the parameter rutting. Obviously these being concrete pavements we would not consider rutting of concrete pavements. (Refer Slide Time: 00:45:52 min)
This is the performance equation which is the heart of design of concrete pavements using AASHTO procedure. As you can see here the number of repetitions which is expressed in terms of standard axle load repetitions is expressed as a function of all the pavement parameters and the reliability parameters. Let us have a look at this equation. we will have the explanation of what all these expressions or parameters stand for; log W18 = ZR into So and we have another expression in terms of D which is the thickness of the slab and another expression in terms of delta PSI loss in serviceability and another expression in terms of D thickness of slab, another expression in terms of terminal serviceability index, expressions in terms of Sc which is the parameter of concrete, Cd drainage coefficient which reflects the drainage conditions thickness of slab, J is the parameter representing the joint efficiency low transfer mechanism, D thickness of slab, E modulus value of concrete and k modulus of subgrade reaction.
30

So as you can see W18 is the function of thickness of slab concrete modulus value, modulus of subgrade reaction, concrete flexural strength, drainage coefficient, low transfer efficiency, reliability parameter and loss in serviceability and of course terminal serviceability value that we consider for designing a given pavement. (Refer Slide Time: 00:47:45 min)
AASHTO performance equation: • W18 is the number of 18 kip single axle load repetitions to time t • ZR is standard normal deviate which corresponds to the level of reliability that we select • So is the combined standard error of traffic prediction and performance prediction • D is the slab thickness expressed in inches • delta psi is the drop in present serviceability index starting from the time of construction • Pt is the serviceability at time t • Sc is the modulus of rupture of concrete flexural strength of concrete • Cd is the drainage coefficient which reflects the drainage conditions that would be prevailing • J is the load transfer coefficient • Ec is the modulus of elasticity of concrete and • k is the modulus of subgrade reaction expressed in terms of pci
31

(Refer Slide Time: 00:48:35 min)
The modulus of subgrade reaction k has to be determined by conducting a plate load test. It can also be estimated from the resilient modulus value of a subgrade material if the resilient modulus value is available. It can be obtained as k = Mr by 19.4 where k is in pci and Mr is in psi. For combined foundations with sub-base placed over subgrade AASHTO gives us charts using which we can estimate the effective of equivalent modulus of subgrade reaction for the combined foundation. That can be done as a function of k value of subgrade and thickness of the sub-base and also the material quality of the sub-base. (Refer Slide Time: 00:49:20 min)
32

Elastic modulus value of concrete can be estimated from its compressive strength using this expression. These are the guidelines for selecting load transfer coefficient J for different types of shoulder and different types of asphalt shoulder, tied PCC shoulder, different types of presence or absence of load transfer device, especially we were referring to presence or absence of dowel bars whether they are present or not present and also the type of slab such as plain cement concrete, jointed reinforce concrete, continuously reinforced concrete pavement the corresponding load transfer coefficients can be selected. (Refer Slide Time: 00:50:08 min)
This is how we select the drainage coefficient. This is similar to the drainage coefficient that we have used in the case of flexible pavement design as per AASHTO. This can be selected as a function of percentage of timing for which the foundation is going to be under saturated condition in a year and also we can find out how fast the water can be removed, what are the drainage arrangements that can be made depending on the rating that we can give to the drainage facility that is available. So accordingly you can select different values of Cd depending on the conditions that we have in a given situation.
33

(Refer Slide Time: 00:50:47 min)
Reliability: Obviously for different types of facilities we go for different levels of reliability. The overall standard deviation which accounts for variability in materials, variability in construction, variability in prediction models can be selected as 0.34 if traffic projection errors are not considered and 0.39 if traffic projections errors are considered. (Refer Slide Time: 00:51:10 min)
This is a nomograph that is available for estimating the slab thickness. One can of course solve the performance equation that is given for any given inputs. One can find out the thickness of the slab for a given number of W18 by substituting all the other parameters. But of course that has to be done in an iterative fashion because D appears at more than one place in that equation so we
34

have to select a trial thickness, compute the W18 value substituting all the other input parameters, check whether the W18 value compares with the projected W18 value if not we will change the thickness value and then redo the calculations again. But using this nomograph we can obtain it directly. We will start with the effective modulus of subgrade reaction k (Refer Slide Time: 52:04) this is the combined k-value then these different lines give you R for different modulus of concrete value then from this we go up to this select the concrete modulus value raise this vertical line and this point will be connected to a point which corresponds to the concrete flexural strength so connect these two points (Refer Slide Time: 52:37) extend this to a line known as transfer line or transition line TL, after this we select a point on this line which corresponds to the load transfer coefficient J which we have already selected. So connecting these two we extend it to another transfer line TL and then you select another point corresponding to drainage coefficient connect these two points and extend it to meet a match line, this is a match line because there is another nomograph which will be matching with this. (Refer Slide Time: 00:53:07 min)
Hence starting from this match line we select a loss in serviceability value delta psi connect these two points let it meet this chart here then we start with the selected reliability value let us say 95% and then we also select the standard deviation value So connect these two points and then extend it, this meets the transfer line here and from this point we select the point which corresponds to W18 and then connect these points let it meet here, so extend these two lines like this and wherever these two lines meet that is the thickness of the slab. In this case it is coming out to be approximately around 9 inches. One can solve the equation or one can also use this nomograph to easily find out the thickness of the slab.
35

(Refer Slide Time: 00:54:08 min)
Here is the design example. You have to design a concrete slab for the following inputs: K effective is 100 pci, Ec is 5 into 10 to the power 6 psi, Sc is 650 psi J is 3.2 for the given conditions, Cd is 1.0, Pt is 2.5, delta PSI is 2.0, reliability selected is 95%, So is 0.32, W18 for which we have to design is 10 millions 10 into 10 to the power of 6. Solving the performance equation by trial and error the slab thickness worked out to be 10.5 inches. The thickness can also be obtained using nomographs. (Refer Slide Time: 00:54:45 min)
Let us take a few questions from this lesson.
36

1) What are the main differences in terms of failure or performance models considered in PCA and AASHTO Designs? 2) Which are the critical regions for a half slab to be considered for fatigue and erosion damage analysis? 3) Do PCA and AASHTO consider thermal that is curling stresses in the design of jointed concrete slabs? (Refer Slide Time: 00:55:20 min)
Let us consider the answer to the questions we have asked in lesson 4.15 which was on design of concrete pavements as per Indian Roads Congress guidelines IRC: 58 – 2002. 1) How to estimate the modulus of subgrade reaction of a concrete pavement? This is with reference to IRC: 58. We know that the modulus of subgrade reaction of concrete pavement has to be determined by connecting a plate load test in a particular season which corresponds to the worst season of the year using the 750 mm dia plate. But if this cannot be done this value of modulus of subgrade reaction of foundation can be obtained if we know the CBR value of the subgrade. So IRC: 58 gives us guidelines to select the k-value of modulus of subgrade reaction from its CBR value. On the other hand if you also have a sub-base placed over subgrade the combined k-value also can be estimated if you know the k-value of the subgrade and also if you know the thickness of the sub-base that is going to be placed. So IRC: 58 also gives us guidelines as how to select an appropriate equivalent combined k-value for both the layers together. 2) Why is the separation membrane provided between the slab and the sub-base? If you have understood the procedures that were discussed for PCA and IRC: 58 design procedure many concepts are similar. But PCA does not recommend use of plastic sheet between
37
the sub-base and the slab which would make it to be a smooth interface. It may not be perfectly smooth but it will not be roughly bounded. But IRC recommends that for the higher pavements that we have a plastic sheet has to be placed between the sub-base and the slab. The reasons for this are the concern for lot of shrinkage failures and cracks that are occurring in concrete slabs because of volumetric contraction and shrinkage. To prevent that if you provide a smooth interface between slab and the foundation the restrain that is offered to the slab for its contraction will be significantly reduced. So when the slab is free to contract the stresses that are going to be generated will be significantly less so the possibility of cracking because of contraction or shrinkage is going to be reduced significantly. 3) What is the critical position of load considered for design of concrete pavement as per IRC: 58? Concrete pavement considers the edge position, the wheel load has to be placed in the edge region, this is considered to be the critical position for wheel loads. 4) What is the need for using load safety factor? Because we know in the analysis we multiply the load by a load safety factor of 1.2, 1.1 or 1.0 depending on the importance of the facility. If you are using a load safety factor of 1.2 then we are trying to build in more safety into the consideration, we are also trying to take care of those unexpectedly high loads that may come because we are trying to consider only the 98th percentile speed 98 percentile wheel load, thank you
38