INTRODUCTION TO THE TIDYVERSE - Amazon S3 · DataCamp Introduction to the Tidyverse Visualizing...
21
DataCamp Introduction to the Tidyverse Visualizing with ggplot2 INTRODUCTION TO THE TIDYVERSE David Robinson Chief Data Scientist, DataCamp
Transcript of INTRODUCTION TO THE TIDYVERSE - Amazon S3 · DataCamp Introduction to the Tidyverse Visualizing...
DataCamp IntroductiontotheTidyverse
Visualizingwithggplot2
INTRODUCTIONTOTHETIDYVERSE
DavidRobinsonChiefDataScientist,DataCamp
DataCamp IntroductiontotheTidyverse
DataCamp IntroductiontotheTidyverse
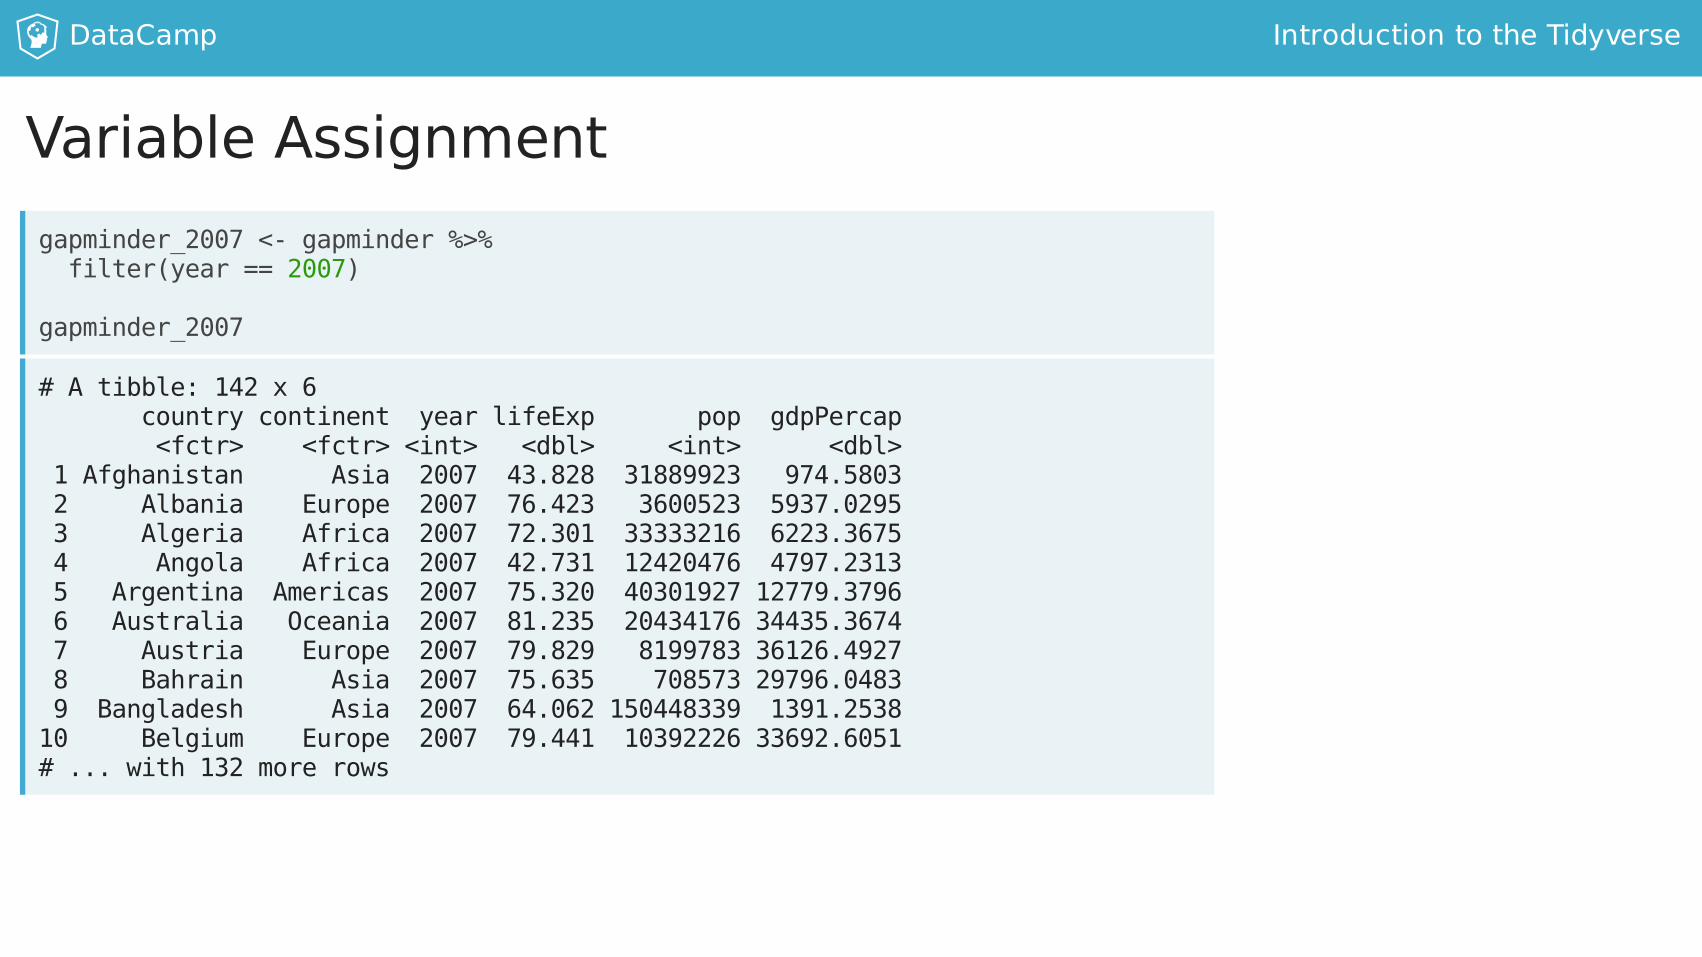
VariableAssignmentgapminder_2007<-gapminder%>%filter(year==2007)
gapminder_2007
#Atibble:142x6countrycontinentyearlifeExppopgdpPercap<fctr><fctr><int><dbl><int><dbl>1AfghanistanAsia200743.82831889923974.58032AlbaniaEurope200776.42336005235937.02953AlgeriaAfrica200772.301333332166223.36754AngolaAfrica200742.731124204764797.23135ArgentinaAmericas200775.3204030192712779.37966AustraliaOceania200781.2352043417634435.36747AustriaEurope200779.829819978336126.49278BahrainAsia200775.63570857329796.04839BangladeshAsia200764.0621504483391391.253810BelgiumEurope200779.4411039222633692.6051#...with132morerows

DataCamp IntroductiontotheTidyverse
Visualizingwithggplot2
library(ggplot2)
ggplot(gapminder_2007,aes(x=gdpPerCap,y=lifeExp))+geom_point()

DataCamp IntroductiontotheTidyverse
Let'spractice!
INTRODUCTIONTOTHETIDYVERSE

DataCamp IntroductiontotheTidyverse
Logscales
INTRODUCTIONTOTHETIDYVERSE
DavidRobinsonChiefDataScientist,DataCamp

DataCamp IntroductiontotheTidyverse
Scatterplot
library(ggplot2)
ggplot(gapminder,aes(x=gdpPerCap,y=lifeExp))+geom_point()

DataCamp IntroductiontotheTidyverse
Logscale
ggplot(gapminder_2007,aes(x=gdpPercap,y=lifeExp))+geom_point()+scale_x_log10()

DataCamp IntroductiontotheTidyverse
Let'spractice!
INTRODUCTIONTOTHETIDYVERSE

DataCamp IntroductiontotheTidyverse
Additionalaesthetics
INTRODUCTIONTOTHETIDYVERSE
DavidRobinsonChiefDataScientist,DataCamp

DataCamp IntroductiontotheTidyverse
Scatterplots

DataCamp IntroductiontotheTidyverse
Additionalvariablesgapminder_2007
#Atibble:142x6countrycontinentyearlifeExppopgdpPercap<fctr><fctr><int><dbl><dbl><dbl>1AfghanistanAsia200743.82831889923974.58032AlbaniaEurope200776.42336005235937.02953AlgeriaAfrica200772.301333332166223.36754AngolaAfrica200742.731124204764797.23135ArgentinaAmericas200775.3204030192712779.37966AustraliaOceania200781.2352043417634435.36747AustriaEurope200779.829819978336126.49278BahrainAsia200775.63570857329796.04839BangladeshAsia200764.0621504483391391.253810BelgiumEurope200779.4411039222633692.6051#...with132morerows

DataCamp IntroductiontotheTidyverse
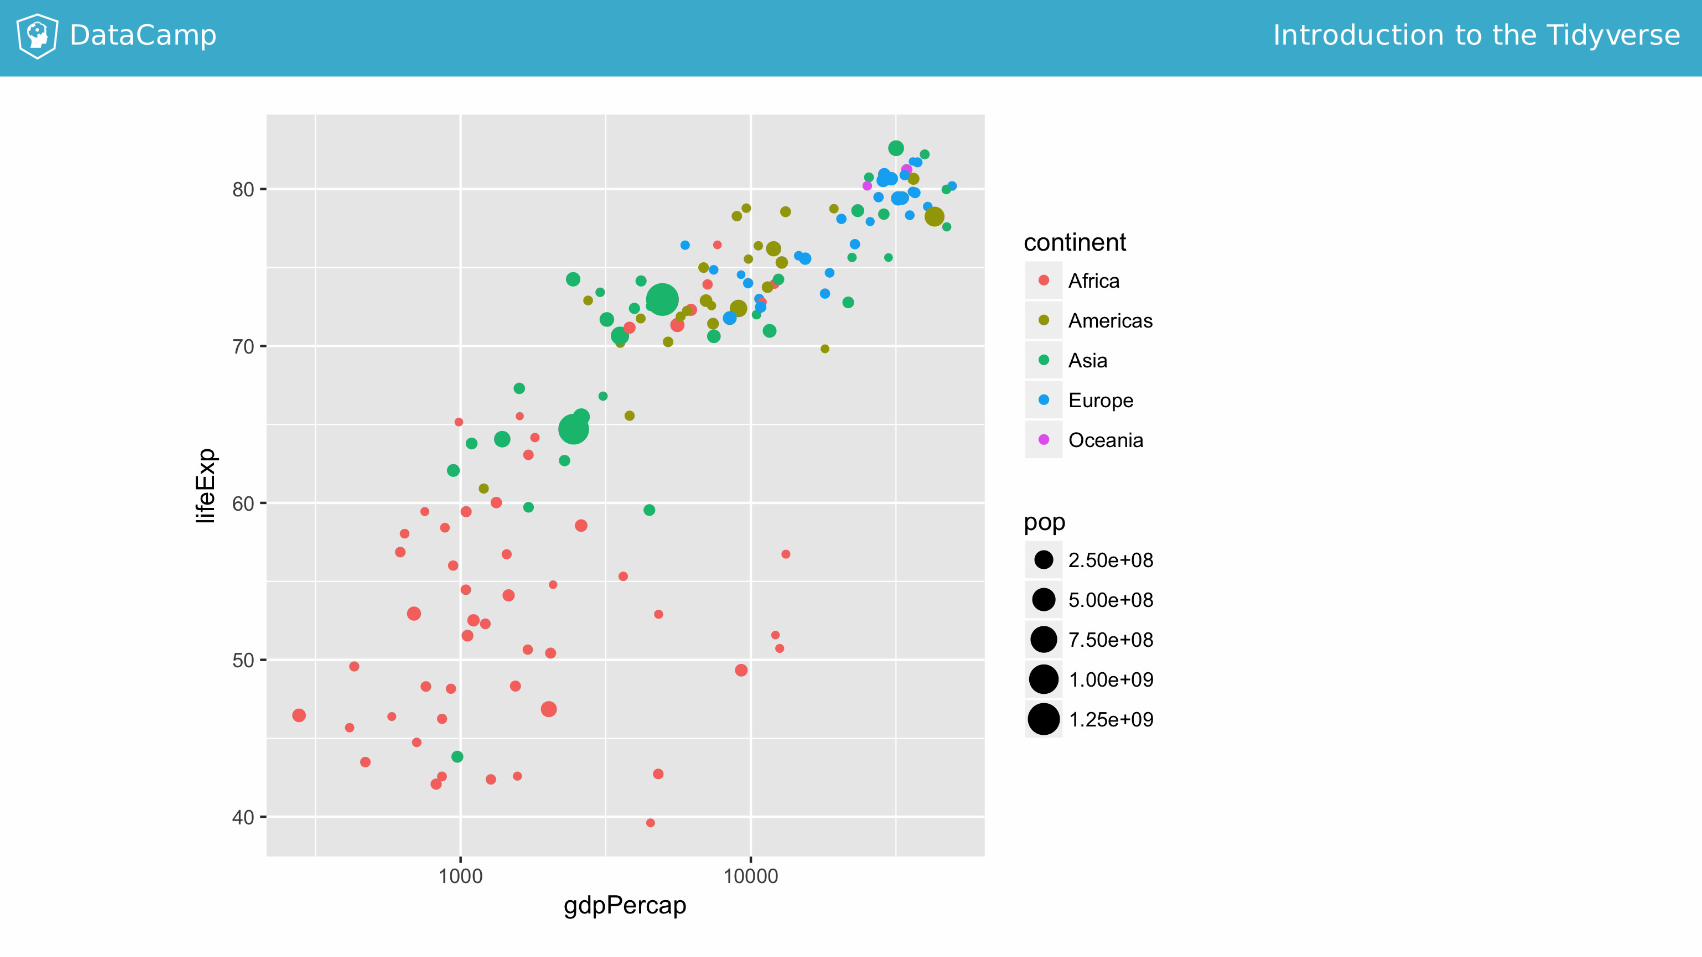
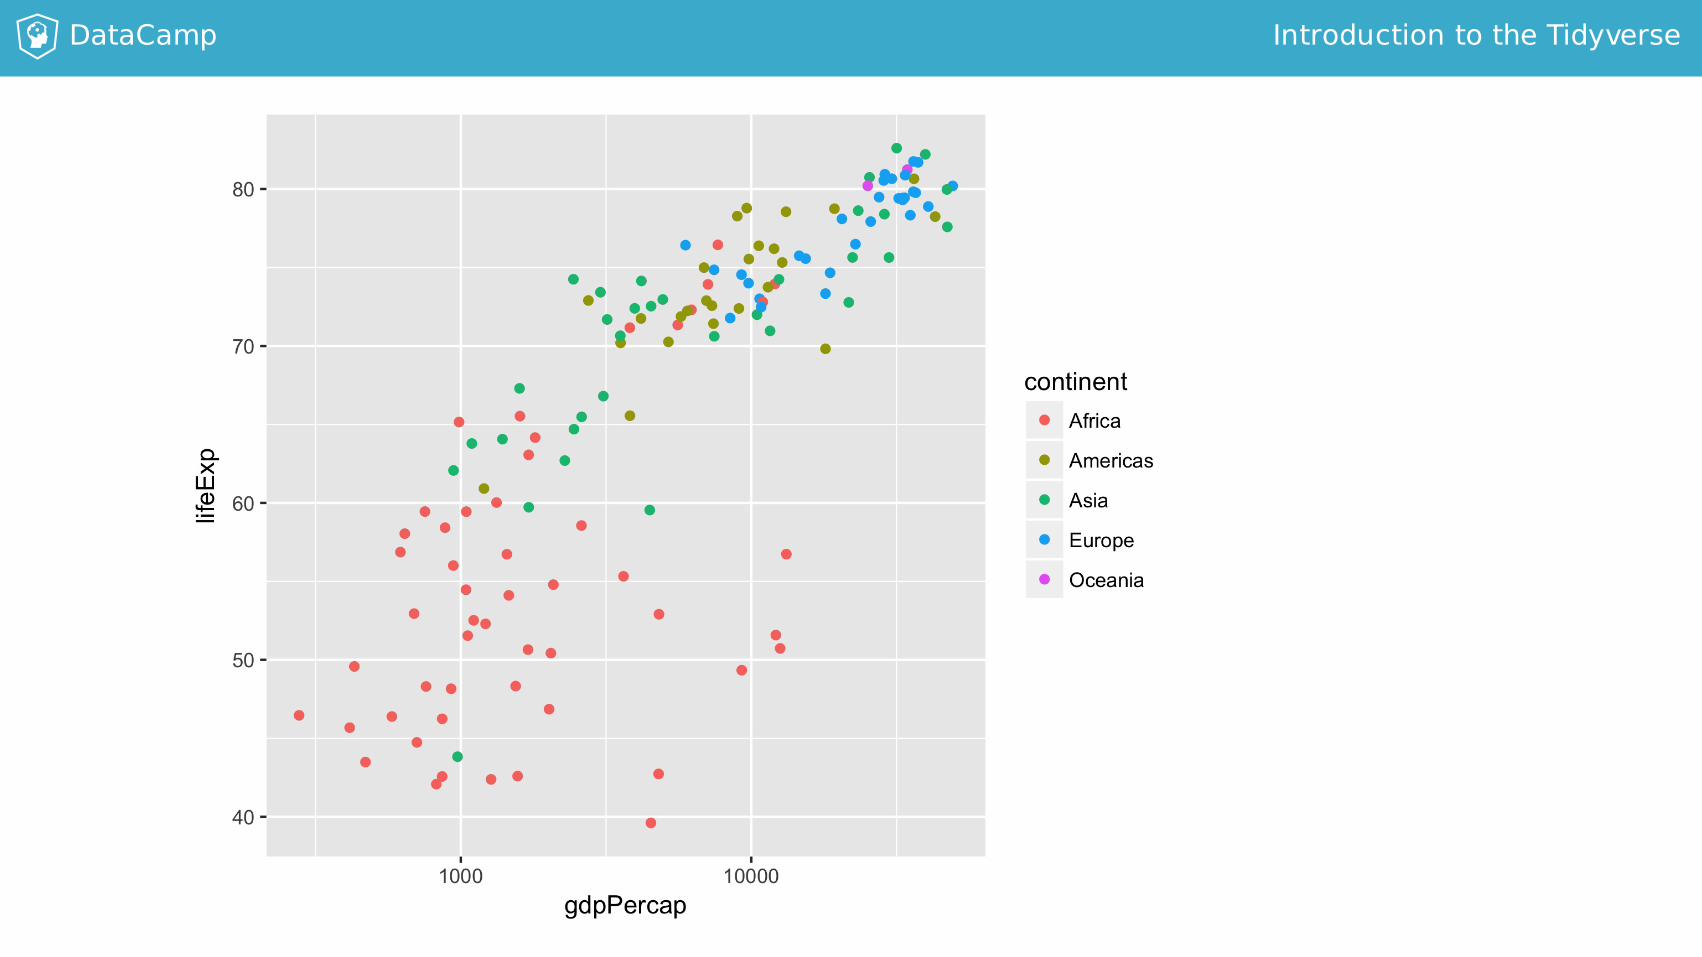
Thecoloraesthetic
ggplot(gapminder_2007,aes(x=gdpPercap,y=lifeExp,color=continent))+geom_point()+scale_x_log10()
DataCamp IntroductiontotheTidyverse
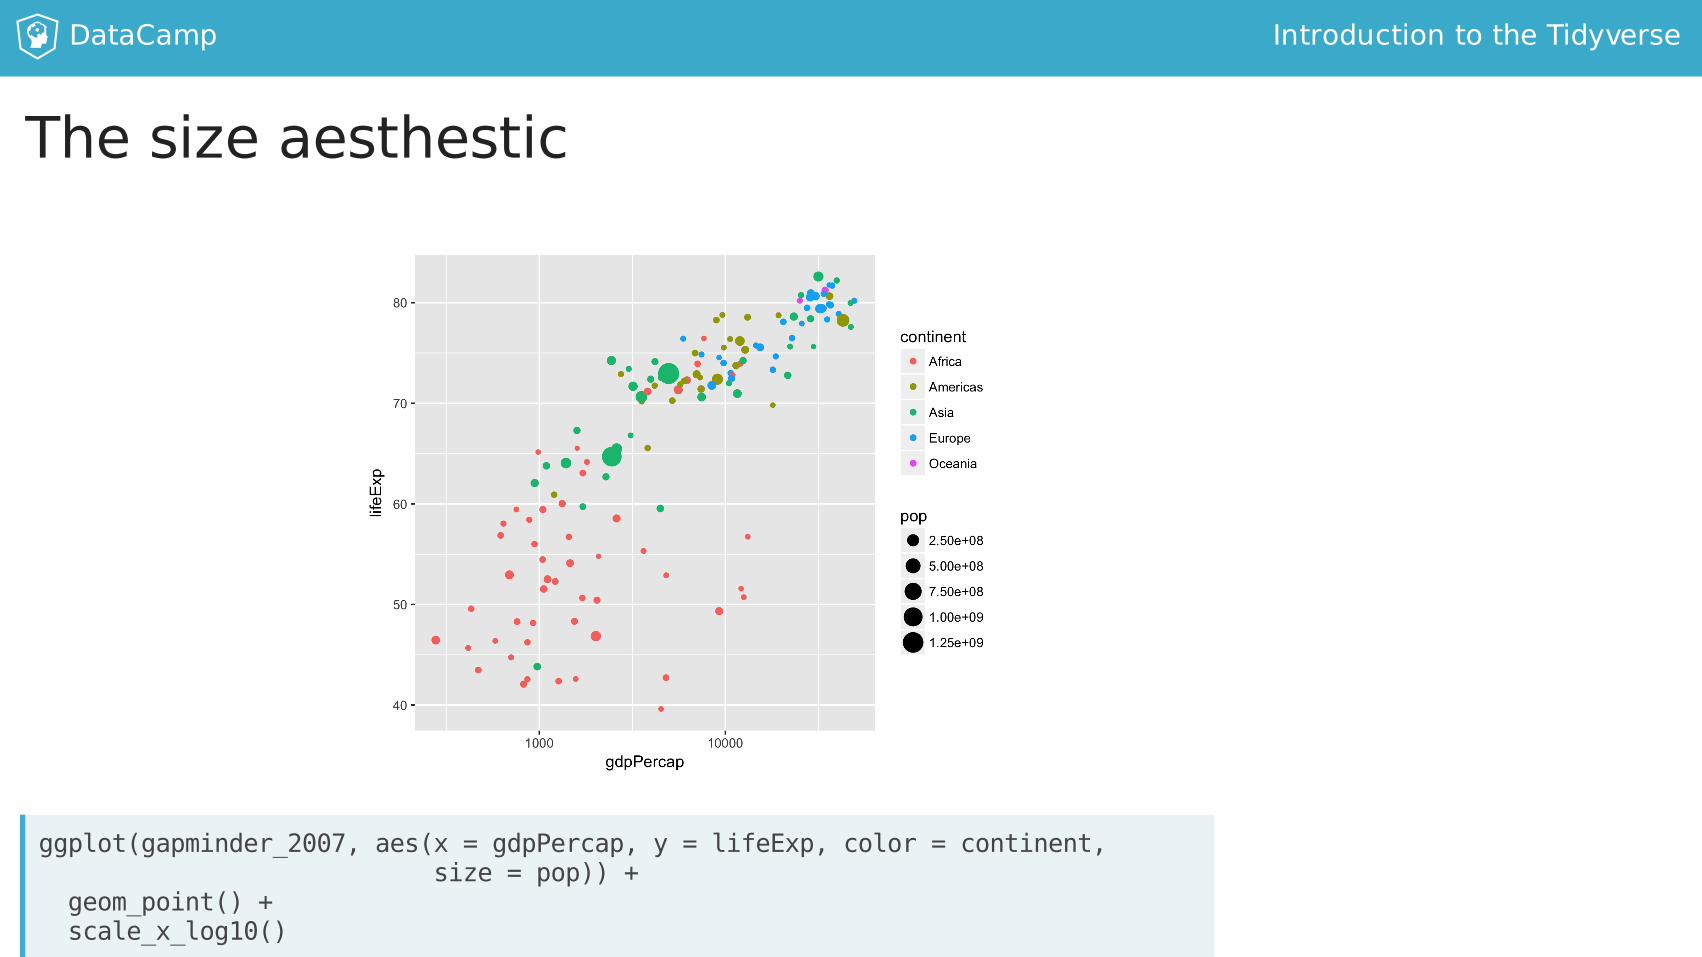
Thesizeaesthestic
ggplot(gapminder_2007,aes(x=gdpPercap,y=lifeExp,color=continent,size=pop))+geom_point()+scale_x_log10()
DataCamp IntroductiontotheTidyverse
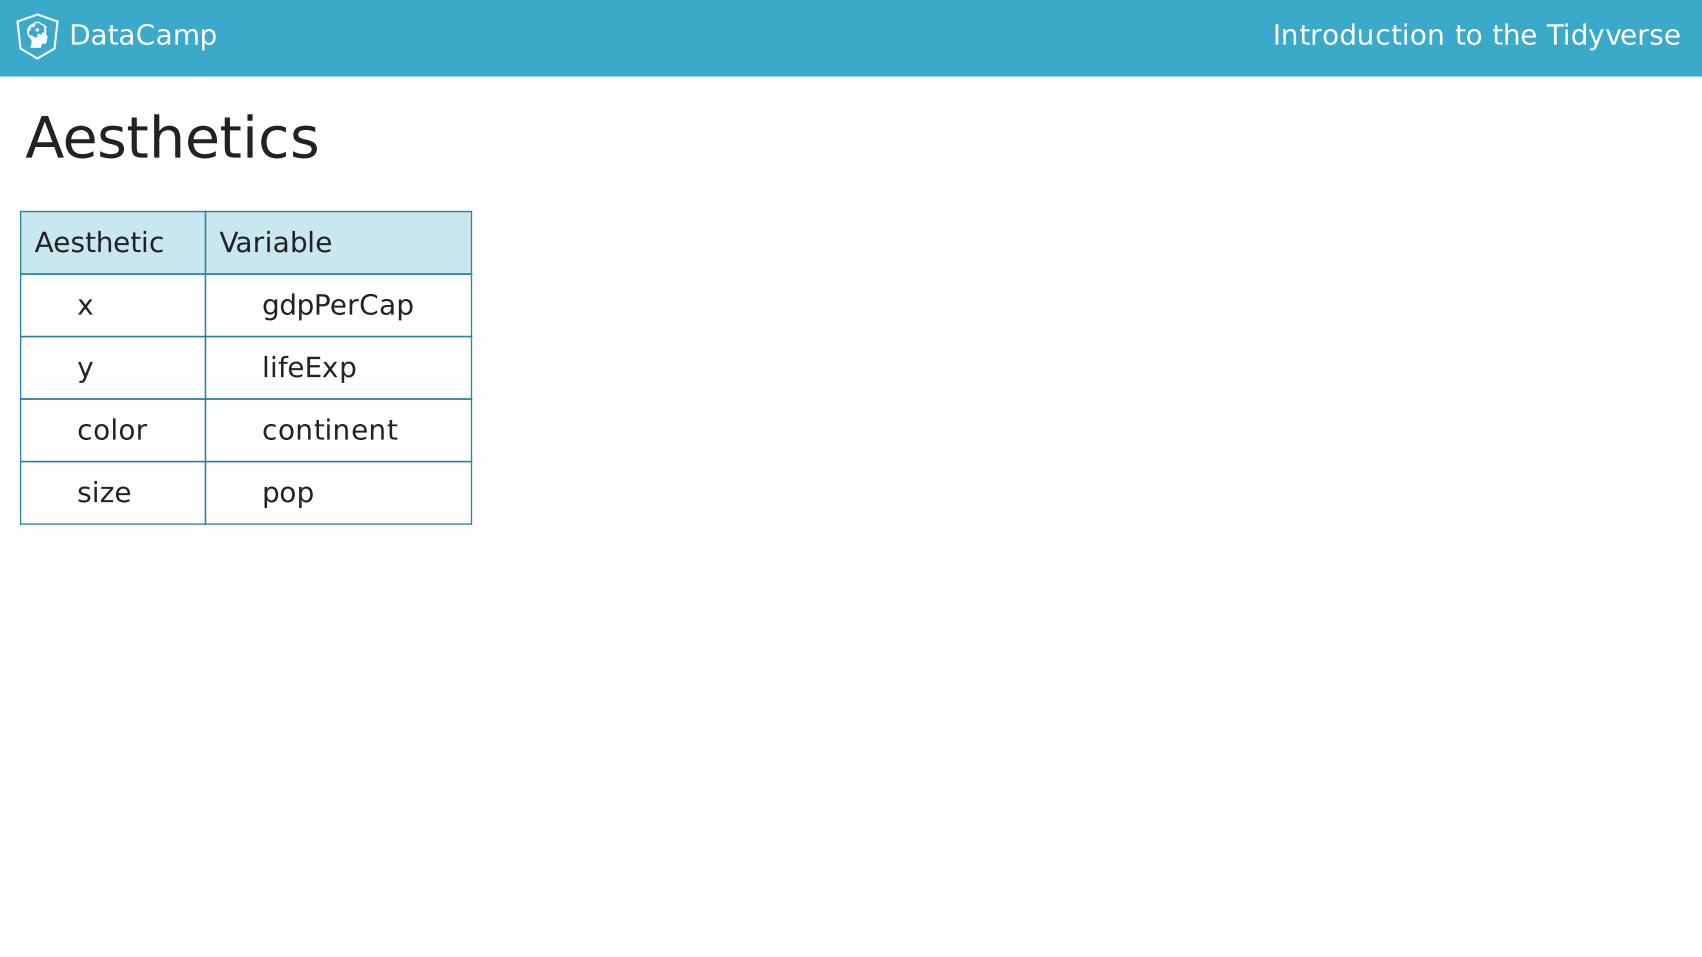
AestheticsAesthetic Variable
x gdpPerCap
y lifeExp
color continent
size pop

DataCamp IntroductiontotheTidyverse
Let'spractice!
INTRODUCTIONTOTHETIDYVERSE
DataCamp IntroductiontotheTidyverse
Faceting
INTRODUCTIONTOTHETIDYVERSE
DavidRobinsonChiefDataScientist,DataCamp
DataCamp IntroductiontotheTidyverse

DataCamp IntroductiontotheTidyverse
Faceting
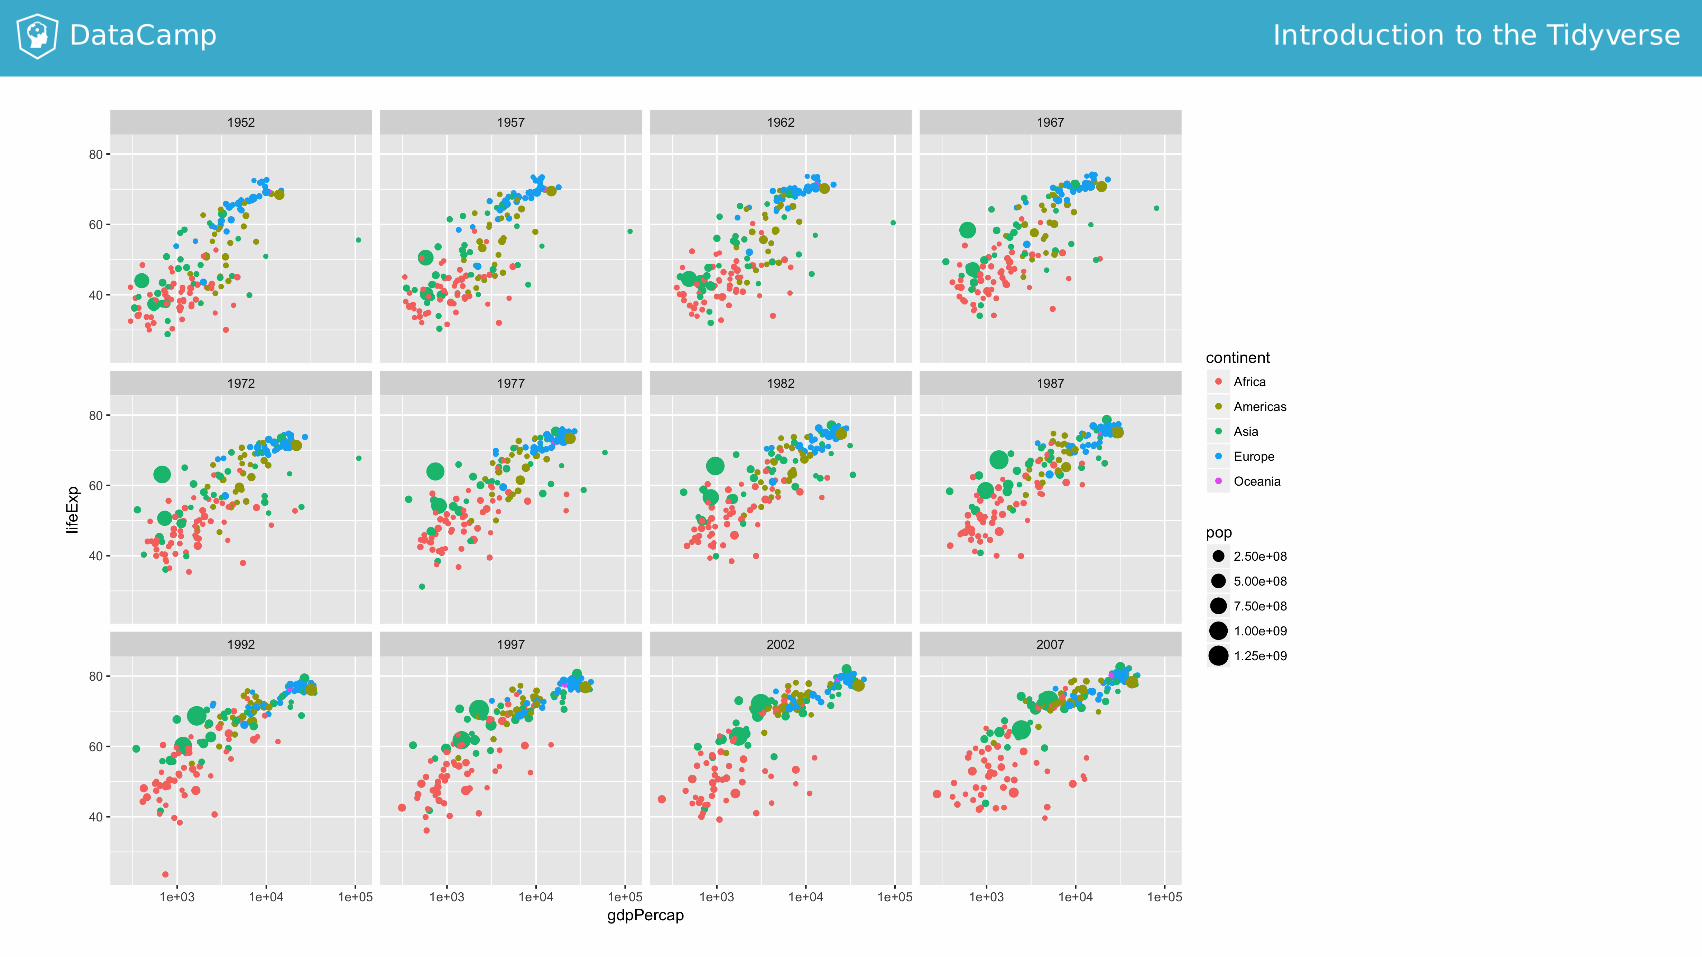
ggplot(gapminder_2007,aes(x=gdpPercap,y=lifeExp))+geom_point()+scale_x_log10()+facet_wrap(~continent)
DataCamp IntroductiontotheTidyverse

DataCamp IntroductiontotheTidyverse
Let'spractice!
INTRODUCTIONTOTHETIDYVERSE