Introduction to the Policy Analysis Modeling System (PAMS ...
19
Introduction to the Policy Analysis Modeling System (PAMS) and Case Study
Transcript of Introduction to the Policy Analysis Modeling System (PAMS ...

Introduction to the Policy Analysis Modeling System (PAMS) and Case Study

Outline
1. Use of PAMS
2. Policy scenario(s)
3. Methodology
4. Inputs needed and potential data sources
5. Case Study

Use of PAMS
Policy Analysis Modeling System (PAMS) was developed by CLASP and Lawrence Berkeley National Laboratory (LBNL) to help local policymakers assess the benefit of standards and labeling programs, and it is available at clasp.ngo
• Excel workbook
• Bottom-up approach
A. The Consumer Perspective examines costs and benefits from the perspective of the individual household
B. The National Perspective projects the total national costs and benefits including both financial benefits, energy savings and environmental benefits.

Use of PAMS
Used to estimate savings potential from implementing policies that improve the energy efficiency of new products in any economy
At the National Level: • Energy savings – lower
electricity consumption due to the market introduction of more efficient appliances
• Environmental Impacts - carbon dioxide emissions mitigation due to reduced electricity consumption
At the Consumer level: • Energy bill savings –
reduced energy bills for users due to lower electricity consumption

Policy scenario(s)
Policies implemented in 2020, impacts estimated through 2030:
• Base case no policies requiring improvements made to the appliances
• Policy case 1 Design 1 a specific efficiency improvement
• Policy case 2 Design 2 a specific efficiency improvement
• Policy case 3 Design 3 a specific efficiency improvement
Results: a comparison between the policy and the base case

Methodology
PAMS methodology for stock and sales forecasting:
• Ownership levels are based on a diffusion model based on: o household income
o electrification,
o urbanization, and
o a climate variable for air conditioners
• Sales forecast considers: o First purchase (increase in number of households and ownership
levels)
o Replacement of retired appliances

Inputs needed and potential data sources
Product data • Lifetime • Baseline Price $ • Baseline Unit Energy
Consumption
Country data • Electricity price ($/kWh) • CO2 emissions factor • Transmission & distribution
losses • Consumer discount rate
Efficiency data • Efficiency design options and
cost of efficiency
• National market assessments • Local manufacturers / importers • Industry associations
• Normally provided by Ministry of Energy, Environment or other relevant agency
Technical reports that support regulatory processes: • EU preparatory studies • US DOE rulemakings • Other countries’ regulatory analysis

Case Study
Technical Assistance provided to CONUEE in the Elaboration and Revision of MEPS
Revision of the Mexican standards of refrigerators/freezers and room air conditioners and their possible alignment with new US DOE rulemaking
• Impact assessments were developed using PAMS and included:
o A market analysis
o A cost-benefit analysis
o Summary of national impacts: energy savings and GHG emissions mitigation
MEPS revision for Room Air
Conditioners (RACs)
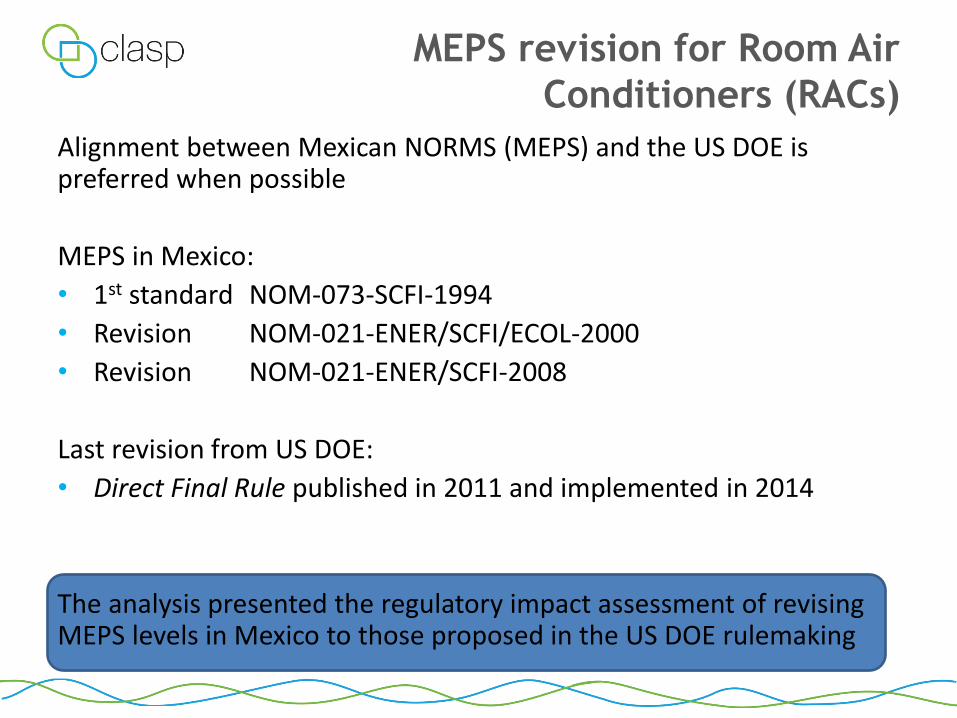
Alignment between Mexican NORMS (MEPS) and the US DOE is preferred when possible
MEPS in Mexico:
• 1st standard NOM-073-SCFI-1994
• Revision NOM-021-ENER/SCFI/ECOL-2000
• Revision NOM-021-ENER/SCFI-2008
Last revision from US DOE:
• Direct Final Rule published in 2011 and implemented in 2014
The analysis presented the regulatory impact assessment of revising MEPS levels in Mexico to those proposed in the US DOE rulemaking

Market Analysis
RACs market share per technology type
• RACs are mostly used in
hot and dry areas in the north, and hot and humid areas in the south
• RACs use has increased in recent years due to warmer weather
• For consumers, energy costs related to the use of RACs represent up to 20% of household income
• For utilities, RACs use pressures system growth due to increased demand during peak loads
• RACs ownership ~ 20%

Market Analysis
Table 1: RACs market share per cooling capacity
Table 2: Efficiency levels
Hours of operation: 8-12 h/day

Cost-benefit analysis
PAMS calculates the LCC for two cases:
• Baseline: the case where no improvements are made to the appliance
• Policy case: a specific efficiency improvement is made to an appliance
The LCC calculation demonstrates how: increases in efficiency may increase the purchase price of an
appliance for a consumer, and the energy savings can result in reduced energy expenses
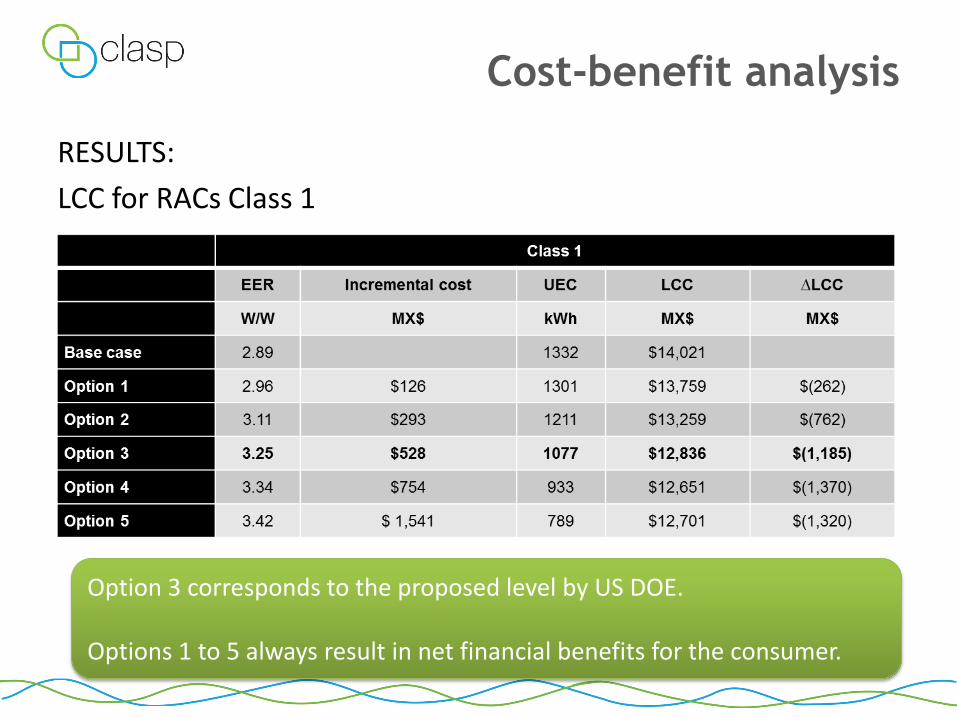
Cost-benefit analysis
RESULTS:
LCC for RACs Class 1
Option 3 corresponds to the proposed level by US DOE. Options 1 to 5 always result in net financial benefits for the consumer.

Cost-benefit analysis
PAMS also calculates the payback period: the period of time required for the return on an investment to "repay" the sum of the original investment
In this case, the payback period is always less than half of the equipment lifetime (average lifetime = 10.5 y) Very good!!

National impacts
• Energy savings – lower electricity consumption due to the market introduction of more efficient air conditioners
• Net Present Value - Net financial savings due to the lower electric bill (and the higher cost of equipment), discounted at the current year
• Environmental Impacts - carbon dioxide emissions mitigation due to reduced electricity consumption
• Avoided Generation Capacity – Reduction of peak demand and the need to implement new power plants

National impacts
RESULTS:
Cost and savings for Class 1

National impacts
RESULTS:
Energy and economic impacts at a national level

National impacts
RESULTS:
• The analysis shows that aligning Mexican MEPS with US DOE will be profitable for the consumer for all product classes
• It also shows that there are MEPS levels more profitable than those aligned to US DOE.

Thank you!