Healthiest Wisconsin 2020 Baseline and Health Disparities Report Asian Population

Introduction to the Healthy People/Healthiest Wisconsin 2010 Data
Package : July 2002Package : July, 2002
The Healthy People/Healthiest Wisconsin 2010 Local Data Package has been developed andLocal Data Package has been developed and produced through collaboration between the Wisconsin Division of Public Health (DPH) and the Wisconsin Division of Health Care Financing, g,Bureau of Health Information (BHI). It is provided to all county health departments by DPH to assist in monitoring progress toward Healthy People 2010/Healthiest Wisconsin 2010 objectives.
The package for each county consists of two files: P P i t fil d W d fil Th P P i ta Power Point file and a Word file. The Power Point
file contains charts and maps. The Word file contains detailed information about the production and contents of the package and a set of technicaland contents of the package, and a set of technical notes about the data and methodology employed.

Wisconsin HealthyWisconsin HealthyPeoplePeople 20102010Data PackageData Package
A local data package developed by the Bureau of Health InformationBureau of Health Information
in collaboration with the Division of Public Healththe Division of Public Health
July, 2002Wisconsin Department of Health and Family Services

Slides forSlides for...
Washington CountyWashington County

Leading gHealth Indicators

Binge DrinkingAdults 18+ with 5+ drinks on one occasion in the past 30 daysp y
Washington County
30%
22% 23%25%
23%23%25% Southeast Region
Washington20% WashingtonCounty
Wisconsin
6%10%
2010 Target
Source: Wisconsin Behavioral Risk Factor
0%
Behavioral Risk Factor Survey (BHI, DHFS)
1991-1995 1996-2000
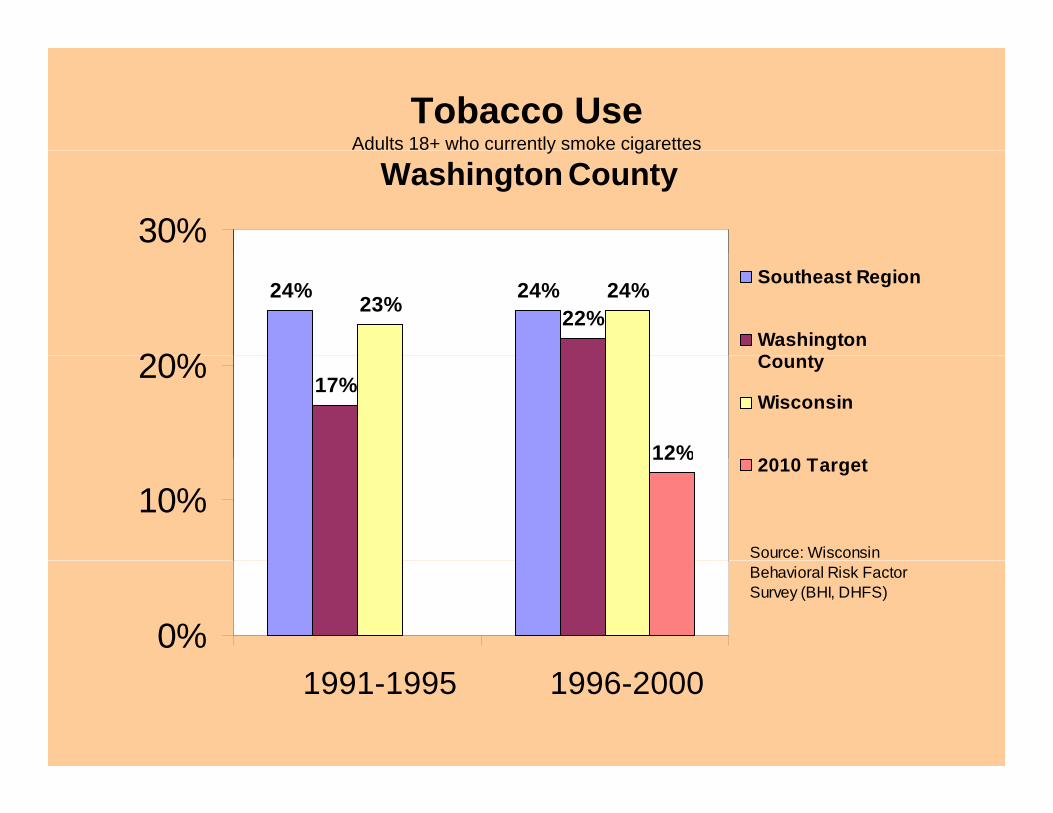
Tobacco UseAdults 18+ who currently smoke cigarettesy g
Washington County
30%24% 24%
22%23% 24%
20%
Southeast Region
WashingtonC t
17%
12%
20% County
Wisconsin
2010 T12%
10%2010 Target
Source: Wisconsin
0%
Behavioral Risk Factor Survey (BHI, DHFS)
1991-1995 1996-2000

Health Insurance CoverageAdults 18+ with coverage entire preceding yearg p g y
Washington County
96% 93%100%
100% 90% 92%96% 93%91% 91%
75%
100%Southeast Region
Washington
50%
75% WashingtonCounty
Wisconsin
2010 Target
25%
50% 2010 Target
Source: Wisconsin Behavioral Risk Factor
0%
Behavioral Risk Factor Survey (BHI, DHFS)
1991-1995 1996-2000

Regular and Vigorous Physical ActivityAdults 18+ who exercise 20 minutes or more, 3 or more times per week, p
Southeast Region/Washington County
40%
30%30%
40%
SoutheastRegion
20%
Region
Wisconsin
2010 Target
6%8%8%
6%10%
2010 Target
Source: Wisconsin Behavioral Risk
0%
Behavioral Risk Factor Survey (BHI, DHFS)
1991-1995 1996-2000

Overweight and Obesity, 2000Percent of adults 18+ with Body Mass Index greater than or equal to
25 0 ( i ht) 30 0 ( b )25.0 (overweight) or 30.0 (obese)
Southeast Region/ Washington County60%
18% 19%50%
18% %
30%
40%
Obese
36% 36%20%
30% Overweight
10%Source: Wisconsin Behavioral Risk Factor Survey (BHI, DHFS)
0%Southeast Region Wisconsin

MortalityMortality

Mortality Due to Coronary Heart DiseaseRates per 100,000 population (age-adjusted to year 2000 standard population)( g j y )
Washington County400
290.4268.6261.2
282.0255.2
300SoutheastRegion
233.7255.2
166.0200WashingtonCounty
Wisconsin
100 2010 Target
Source: Wisconsin
01991 1995 1996 2000
Source: Wisconsin resident death certificates (BHI, DHFS)
1991-1995 1996-2000

Mortality Due to Cerebrovascular DiseaseRates per 100,000 population (age-adjusted to year 2000 standard population)p , p p ( g j y p p )
Washington County100
Southeast
67.075.6
82.4
66.5 66.568.680
SoutheastRegion
WashingtonCounty
48.0
40
60 Wisconsin
2010 Target
20
40Source: Wisconsin resident death certificates (BHI,
0
20 ( ,DHFS)
1991-1995 1996 -2000

Mortality Due to Lung CancerRates per 100,000 population (age-adjusted to year 2000 standard population)p , p p ( g j y p p )
Washington County
52 6 54.46052.6
45.741.3
49.5 49.744.9
40
SoutheastRegion
Washington40 gCounty
Wisconsin
2010 Target
202010 Target
Source: Wisconsin resident death
0
resident death certificates (BHI, DHFS)
1991-1995 1996 -2000
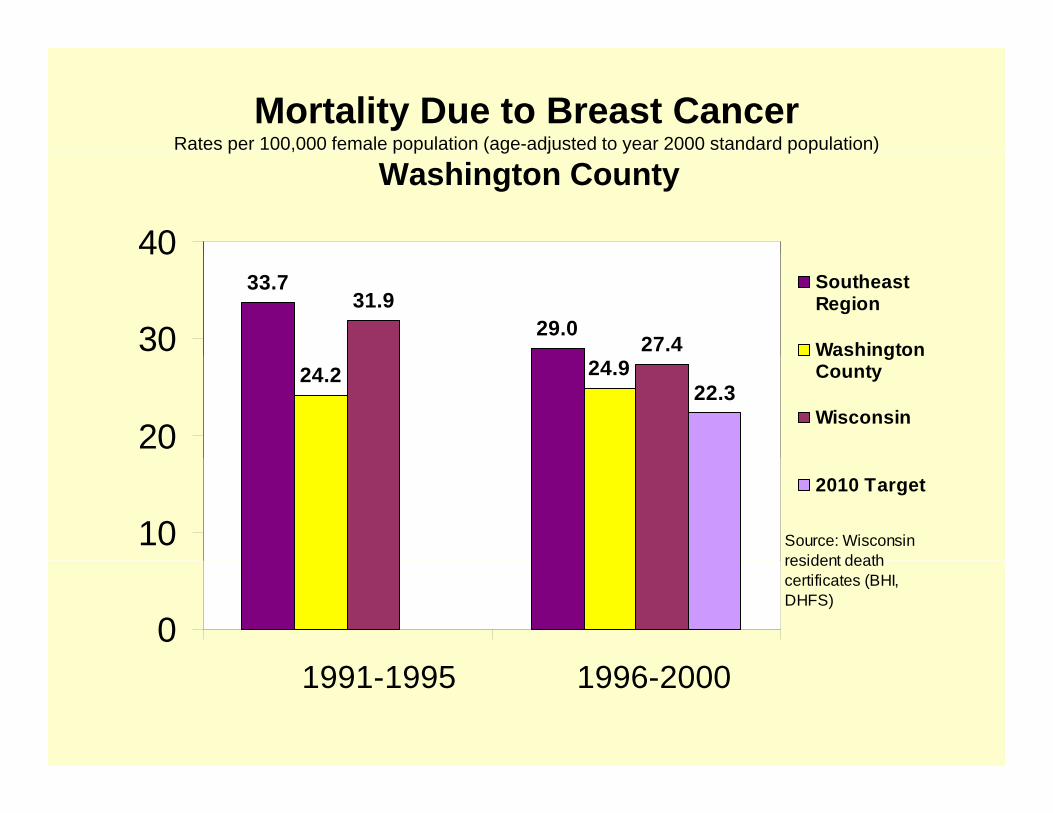
Mortality Due to Breast CancerRates per 100,000 female population (age-adjusted to year 2000 standard population)p , p p ( g j y p p )
Washington County
4033.7
29.031.9
27.430
40SoutheastRegion
Washington24.9
22.324.2
20
WashingtonCounty
Wisconsin
102010 Target
Source: Wisconsin resident death
0
resident death certificates (BHI, DHFS)
1991-1995 1996-2000
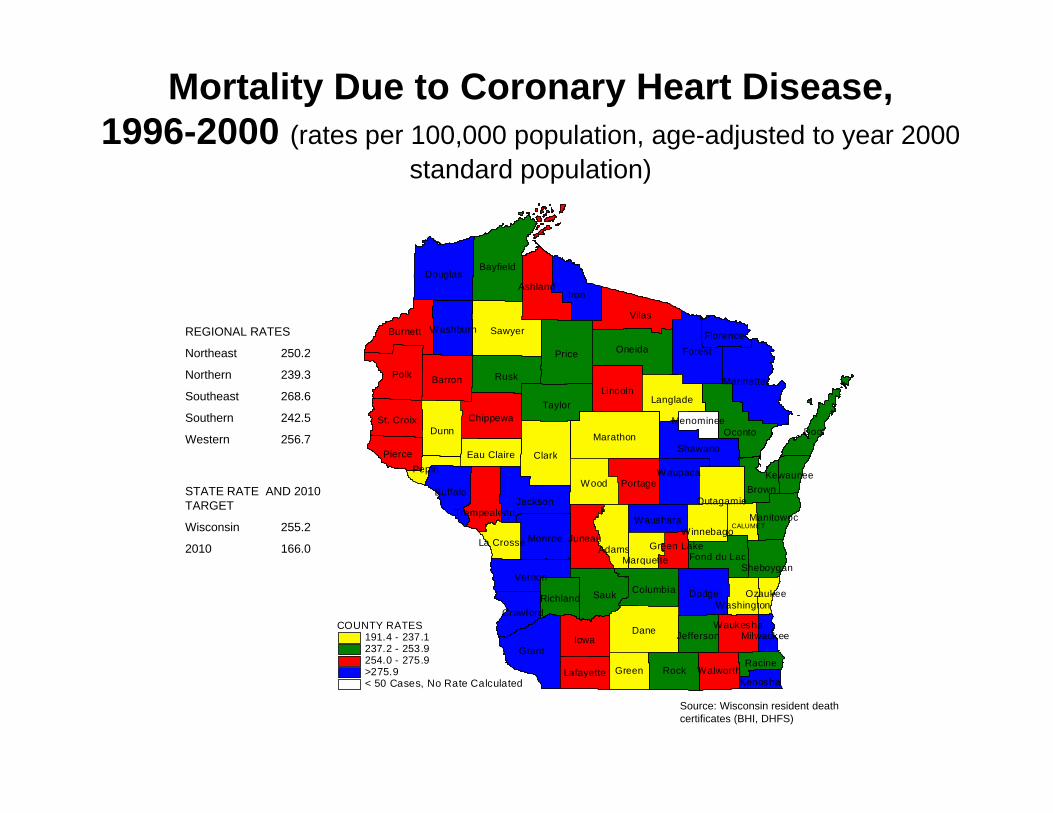
Mortality Due to Coronary Heart Disease, 1996-2000 (rates per 100,000 population, age-adjusted to year 2000
standard population)
Price
Vilas
Iron
Bayfield
Sawyer
Oneida Forest
Douglas
Burnett
Ashland
Washburn FlorenceREGIONAL RATES
Northeast 250 2 Price
Clark
Polk Rusk
MarathonDunn
Taylor
Marinette
Oconto
BarronLincoln
Chippewa
Shawano
Langlade
Door
Pierce
St. Croix
Eau Claire
Menominee
Northeast 250.2
Northern 239.3
Southeast 268.6
Southern 242.5
Western 256.7Clark
Wood
Jackson
Monroe Juneau
PortageBuffalo
Adams
Brown
Waupaca
Waushara
au C a e
Fond du Lac
OutagamieTrempealeau Manitowoc
WinnebagoLa Crosse
Marquette
Pepin Kewaunee
Green Lake
CALUMET
STATE RATE AND 2010 TARGET
Wisconsin 255.2
2010 166.0
COUNTY RATES191.4 - 237.1237.2 - 253.9254.0 - 275.9
Dane
Grant
Sauk
Iowa
Dodge
VernonColumbia
RichlandCrawford
JeffersonWaukesha
Racine
MarquetteSheboygan
WashingtonOzaukee
Milwaukee
< 50 Cases, No Rate Calculated
254.0 275.9>275.9 RockGreenLafayette Walworth
Racine
Kenosha
Source: Wisconsin resident death certificates (BHI, DHFS)

Mortality Due to Cerebrovascular Disease, 1996-2000 (rates per 100,000 population, age-adjusted to year
BayfieldDouglas
2000 standard population)
Price
Polk
Vilas
Iron
Sawyer
Rusk
Oneida Forest
MarinetteBarron
Burnett
Ashland
Washburn FlorenceREGIONAL RATES
Northeast 65.6
Northern 58.9
Clark
MarathonDunn
Taylor
Marinette
Oconto
Wood
BarronLincoln
Chippewa
Portage
Shawano
Langlade
Door
Pierce
St. Croix
Waupaca
Eau ClairePepin Kewaunee
Menominee
Southeast 68.6
Southern 68.3
Western 66.2
Wood
Jackson
Monroe
Vernon
Juneau
PortageBuffalo
Adams
Brown
Columbia
Waushara
Fond du Lac
OutagamieTrempealeau Manitowoc
WinnebagoLa Crosse
MarquetteSheboygan
Green Lake
CALUMET
STATE RATE AND 2010 TARGET
Wisconsin 65.5
2010 48.0
< 50 Cases, No Rate Calculated
COUNTY RATES42.7 - 59.659.7 - 66.066.1 - 71.3>71.3
Dane
Grant
Sauk
Iowa
Rock
Dodge
Green
Columbia
Lafayette
RichlandCrawford
Jefferson
Walworth
Waukesha
Racine
Washington
Kenosha
Ozaukee
Milwaukee
50 Cases, No Rate Calculated
Source: Wisconsin resident death certificates (BHI, DHFS)

Mortality Due to Lung Cancer, 1996-2000 (rates per 100,000 population, age-adjusted to year 2000 standard
BayfieldDouglas
population)
Price
Polk
Vilas
Iron
Sawyer
Rusk
Oneida Forest
Douglas
MarinetteBarron
Burnett
Ashland
Washburn FlorenceREGIONAL RATES
Northeast 47.1
Northern 47.3
Clark
MarathonDunn
Taylor
Marinette
Oconto
Wood
BarronLincoln
Chippewa
PortageBuffalo
Shawano
Langlade
Door
Pierce
St. Croix
Brown
Waupaca
Eau ClairePepin
Kewaunee
Menominee
Southeast 54.4
Southern 48.1
Western 46.2
STATE RATE AND 2010
Sauk Dodge
Jackson
Monroe
Vernon
Juneau
Buffalo
Adams
Brown
ColumbiaRichland
Waushara
Fond du Lac
OutagamieTrempealeau Manitowoc
WinnebagoLa Crosse
MarquetteSheboygan
Green Lake
Ozaukee
CALUMET
TARGET
Wisconsin 49.2
2010 44.9
Dane
GrantIowa
Rock
g
GreenLafayette
RichlandCrawford
Jefferson
Walworth
Waukesha
Racine
Washington
Kenosha
Milwaukee
< 50 Cases, No Rate Calculated
COUNTY RATES25.4 - 42.842.9 - 48.748.8 - 56.6>56.6
Source: Wisconsin resident death certificates (BHI, DHFS)

Lung Cancer Deaths, 1996-2000Number of deaths
Washington County80
60
43 4144 46
3940
20
0
Source: Wisconsin resident death certificates (BHI, DHFS)
1996 1997 1998 1999 2000

Breast Cancer Deaths, 1996-2000Number of deaths
Washington County
25
17
20
1517
15
1213
15
5
10
Source: Wisconsin resident death
0
5
1996 1997 1998 1999 2000
resident death certificates (BHI, DHFS)
1996 1997 1998 1999 2000

Cerebrovascular Disease Deaths, 1996-2000Number of deaths
Washington County120
8590
80 80 7885 82
60
30
0
30Source: Wisconsin resident death certificates (BHI, DHFS)
01996 1997 1998 1999 2000

EnvironmentalEnvironmental QualityQuality

Hospitalizations for AsthmaRates per 10,000 population (age-adjusted to year 2000 standard population)p , p p ( g j y p p )
Washington County18.820
16.4
12.815
SoutheastRegion
WashingtonC t
9.3
7 4
811.4
7.710
County
Wisconsin
2010 Target7.4 7.7
5
2010 Target
Source: Wisconsin
0
hospital inpatient data (BHI, DHFS)
1991-1995 1996-2000

Children in Medicaid/WIC Screened for LeadChildren in Medicaid/WIC Screened for LeadPercent of program-eligible children ever tested
Washington County100%
80%
100%
60%MedicaidWIC
20%
40%WIC
Source: Wisconsin Division of Public
0%
20%Health
1997 1998 1999 2000 2001

SocioeconomicSocioeconomic FactorsFactors

Children In PovertyPercent of children 0-17
Washington County20%
14.3%15%10.5%
10%
4.7%5% Source: U.S. Census Small Area Income and Poverty Estimates: 1997 Model-Based Estimate
0%Southeast
R iWashington
CWisconsin
Based Estimate
Region County

WIC Participation, 2000Number of participantsp p
Washington County
1,7702,000
1 200
1,600
529 580661800
1,200
529 580
400Source: Wisconsin Division of Public Health
0Women Infants Children
1 4Total
1-4

Maternal and InfantMaternal and Infant Health

Infant MortalityDeaths before age one per 1,000 live birthsg p ,
Washington County
8 610
8.67.97.8
6.98
SoutheastRegion
WashingtonCounty
5.5
4.3 4.5
4
6County
Wisconsin
2010 Target
2
4 2010 Target
Source: Wisconsin birth and death
0
birth and death certificates (BHI, DHFS)
1991-1995 1996-2000

First-Trimester Prenatal Care, 2000Percent of births to mothers who received early prenatal carey p
Washington County
83 6%91.1%
83 9%90.0%
100%83.6% 83.9%
75%
50%
25% Source: Wisconsin resident birth certificates (BHI, DHFS)
0%Southeast Washing- Wisconsin 2010
DHFS)
Regiong
ton County Target

Teen Births, 1996-2000Number of births to mothers less than 20 years of agey g
Washington County125125
8088 89
100
8088 89
100
8073 77
50
75 8073 77
50
75
25
50Source: Wisconsin resident birth certificates (BHI,
25
50Source: Wisconsin resident birth certificates (BHI,
01996 1997 1998 1999 2000
(DHFS)
01996 1997 1998 1999 2000
(DHFS)
1996 1997 1998 1999 20001996 1997 1998 1999 2000

Injury andInjury and Violence

Motor Vehicle Crashes Related to AlcoholPercent of total crashes where alcohol was a factor
Washington County15%
10%10%WashingtonCounty
5%Wisconsin
0%
Source: Wisconsin Department of Transportation
1996 1997 1998 1999 2000

Homicide Rates, 1996-2000 CombinedRates per 100,000 population (age-adjusted to year 2000 standard population)p , p p ( g j y p p )
Southeast Region10
7.4
6
8
3.73.04
6
3.0
2 Source: Wisconsin resident death certificates (BHI, DHFS)
0Southeast
RegionWisconsin 2010 Target
Region

Sexually Transmitted Diseases

Chlamydia Cases Reported, 1996-2000Numbers are approximatepp
Washington County
80
566360
56
48 4944
40
20Source: Wisconsin
0
Division of Public Health
1996 1997 1998 1999 2000

Gonorrhea Cases ReportedNumbers are approximatepp
Washington County15
13
8
109
10
65
0Source: Wisconsin Division of Public Health
01996 1997 1998 1999 2000

The EndThe End