Introduction to the graph technologies landscape
31
SAS founded in 2013 in Paris | http://linkurio.us | @linkurious Introduction to the graph technologies landscape.
-
Upload
linkurious -
Category
Software
-
view
228 -
download
6
description
A quick intro to some of the new graph technologies.
Transcript of Introduction to the graph technologies landscape
SAS founded in 2013 in Paris | http://linkurio.us | @linkurious
Introduction to the graph technologies landscape.
Introduction.
“At Linkurious we believe graph technologies can have a powerful impact in the way we think about data and turn it into new products. This small report is meant to give you a glimpse into the emerging graph ecosystem. May it inspire you to join, use or launch graph projects.”
Sébastien HeymannCEO of Linkurious

Father Of
Father Of
Siblings
What is a graph ?
This is a graph.
Father Of
Father Of
Siblings
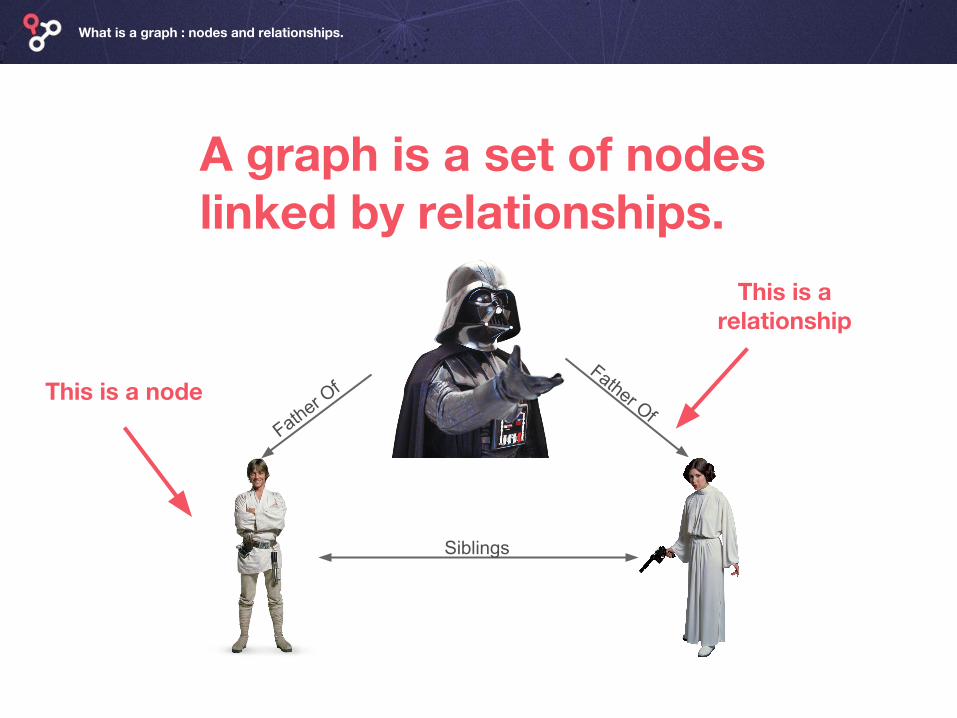
This is a node
This is a relationship
What is a graph ? / Nodes & relationshipsWhat is a graph : nodes and relationships.
A graph is a set of nodes linked by relationships.
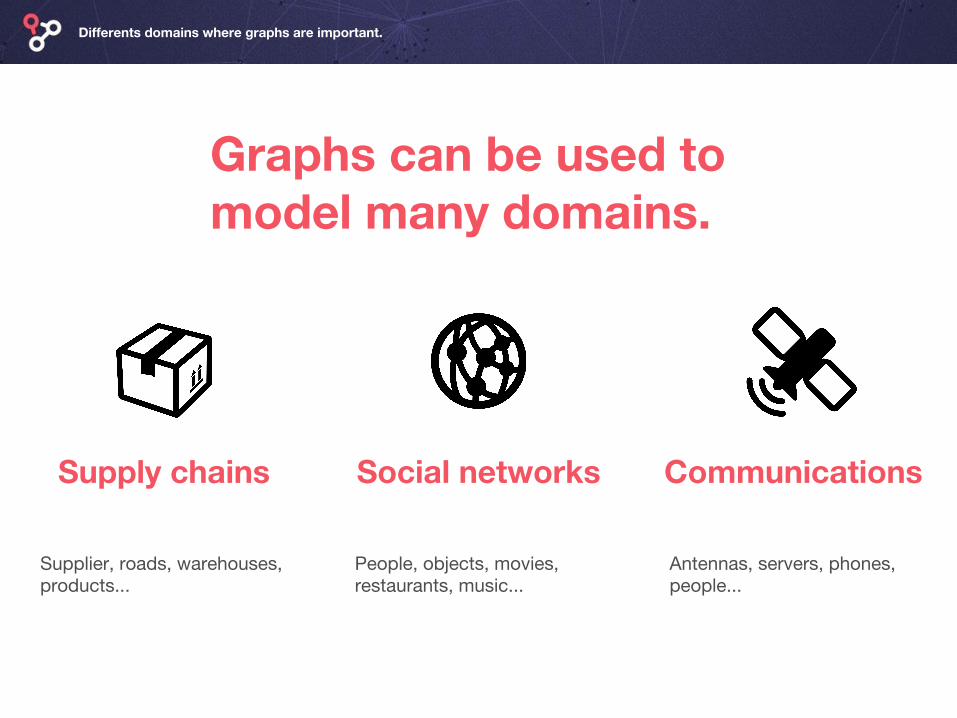
People, objects, movies, restaurants, music...
Antennas, servers, phones, people...
Supplier, roads, warehouses, products...
Supply chains Social networks Communications
Differents domains where graphs are important.
Graphs can be used to model many domains.
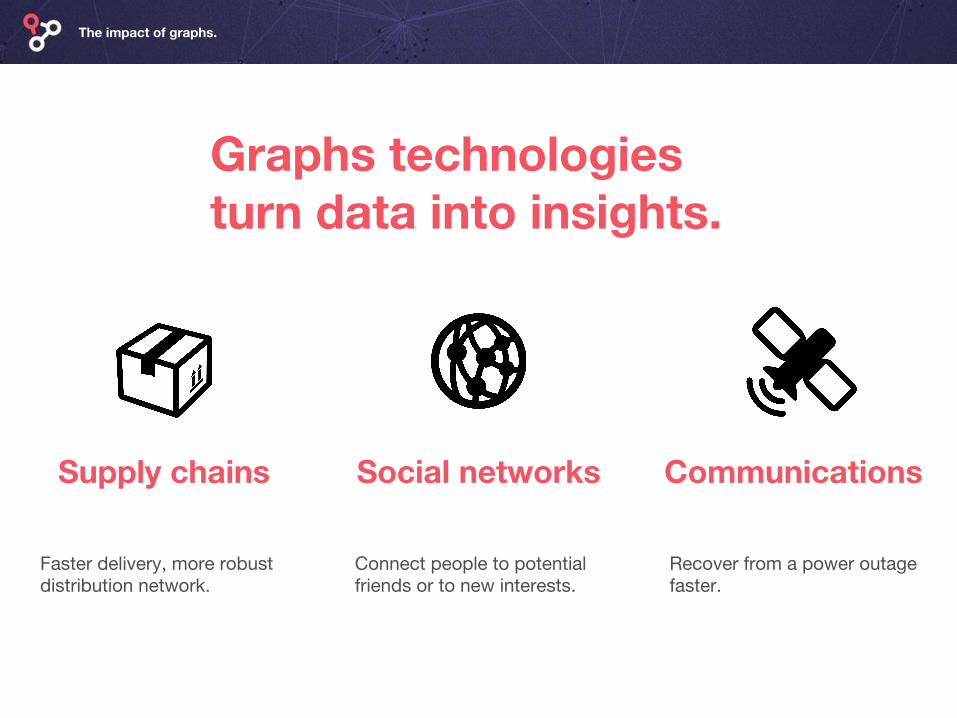
Connect people to potential friends or to new interests.
Graphs technologies turn data into insights.
Supply chains Social networks Communications
The impact of graphs.
Faster delivery, more robust distribution network.
Recover from a power outage faster.
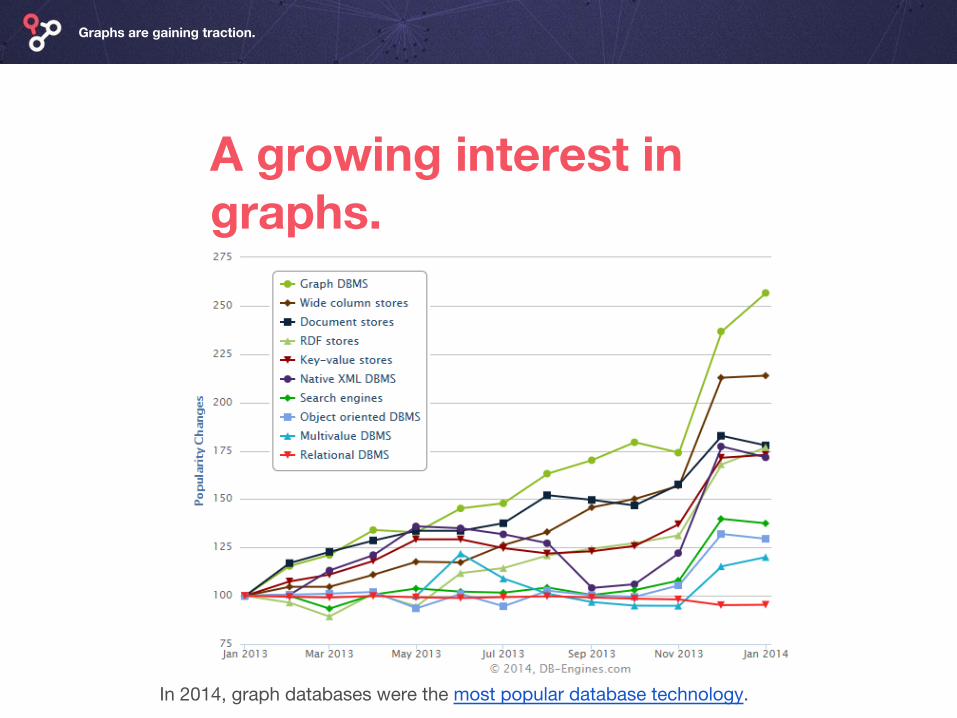
A growing interest in graphs.
Graphs are gaining traction.
In 2014, graph databases were the most popular database technology.
Do you know the graph landscape?
The graph technologies landscape.
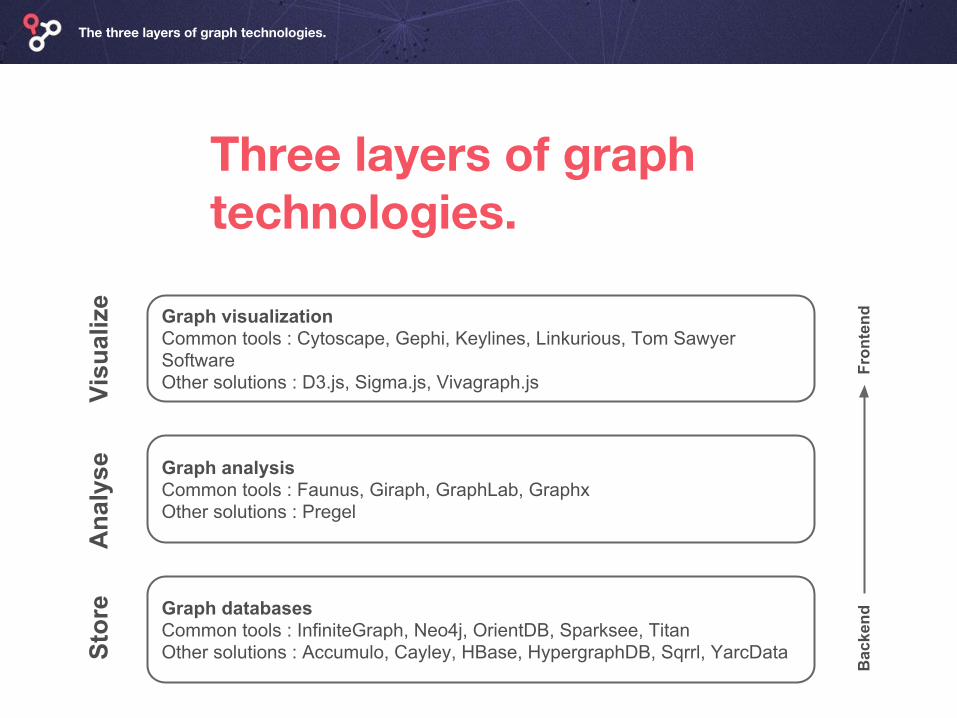
The three layers of graph technologies.
Graph visualizationCommon tools : Cytoscape, Gephi, Keylines, Linkurious, Tom Sawyer SoftwareOther solutions : D3.js, Sigma.js, Vivagraph.js
Graph analysisCommon tools : Faunus, Giraph, GraphLab, GraphxOther solutions : Pregel
Graph databasesCommon tools : InfiniteGraph, Neo4j, OrientDB, Sparksee, TitanOther solutions : Accumulo, Cayley, HBase, HypergraphDB, Sqrrl, YarcDataSt
ore
Three layers of graph technologies.
Bac
kend
Visu
aliz
eA
naly
se
Fron
tend

First layer : the graph databases.
InfiniteGraph Neo4j OrientDB Sparksee Titan
License commercial commercial/open-source
apache 2.0 license
commercial apache 2.0 license
Website http://www.objectivity.com/infinitegraph
http://www.neo4j.org/
http://www.orientechnologies.com/orientdb/
http://www.sparsity-technologies.com/
http://thinkaurelius.github.io/titan/
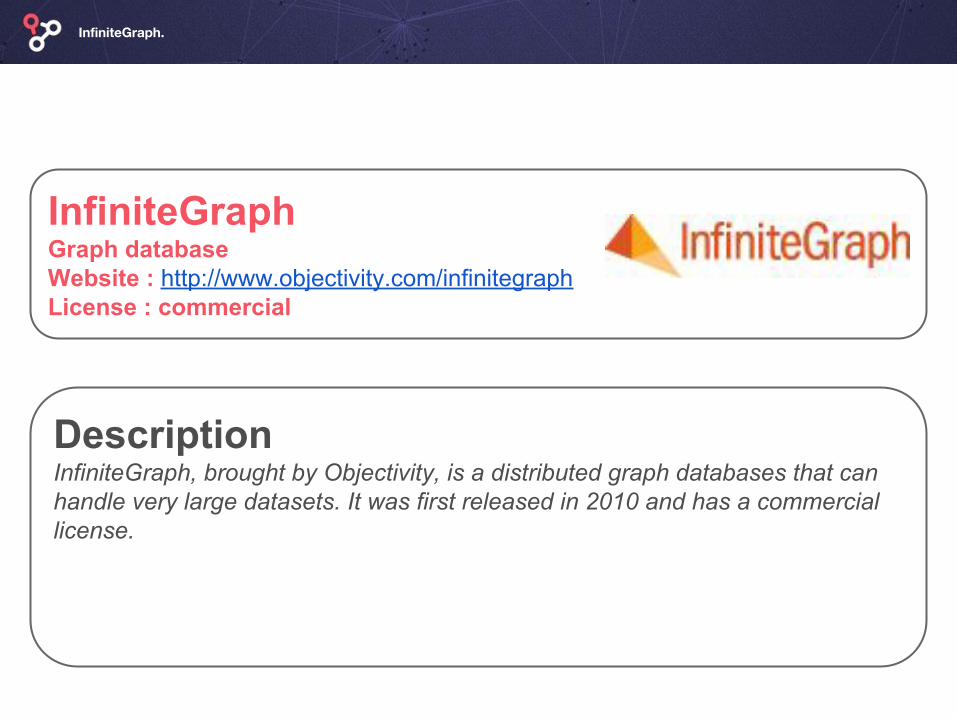
InfiniteGraphGraph databaseWebsite : http://www.objectivity.com/infinitegraphLicense : commercial
InfiniteGraph.
DescriptionInfiniteGraph, brought by Objectivity, is a distributed graph databases that can handle very large datasets. It was first released in 2010 and has a commercial license.
Neo4jGraph databaseWebsite : http://www.neo4j.org/License : commercial/open-source
Neo4j.
DescriptionNeo4j, the graph database developed by Neo Technology made it easier to work with graphs. Since the launch of the V1 in 2010, Neo4j garnered a lot of interest. Its open-source edition makes it very easy for developers to start experimenting with graph databases. Today, Neo Technology is the leading graph database with a long list of customer references. It remains focused on usability with recent releases bringing changes in the ETL process and data visualization.

DescriptionOrientDB is an Open Source database with the features of both Document and Graph databases. OrientDB is written completely in Java and can run on any platform without configuration and installation.
OrientDBGraph databaseWebsite : http://www.orientechnologies.com/orientdb/License : Apache 2.0 license
OrientDB.
DescriptionSparksee (formerly known as DEX) is a proprietary graph database built for performance. It has a small footprint, is natively available for .Net, C++, Python and Java. Sparksee mobile is the first graph database available for iOS and Android.
SparkseeGraph databaseWebsite : http://www.sparsity-technologies.com/License : commercial
Sparksee.
DescriptionTitan, an other open-source project has been gaining a lot of attention lately. Though still in early stage, Titan is an ambitious project. It is a distributed graph database built to store and query graphs in the hundreds of billions of vertices and edges.
TitanGraph databaseWebsite : http://thinkaurelius.github.io/titan/License : Apache 2.0 license
Titan.
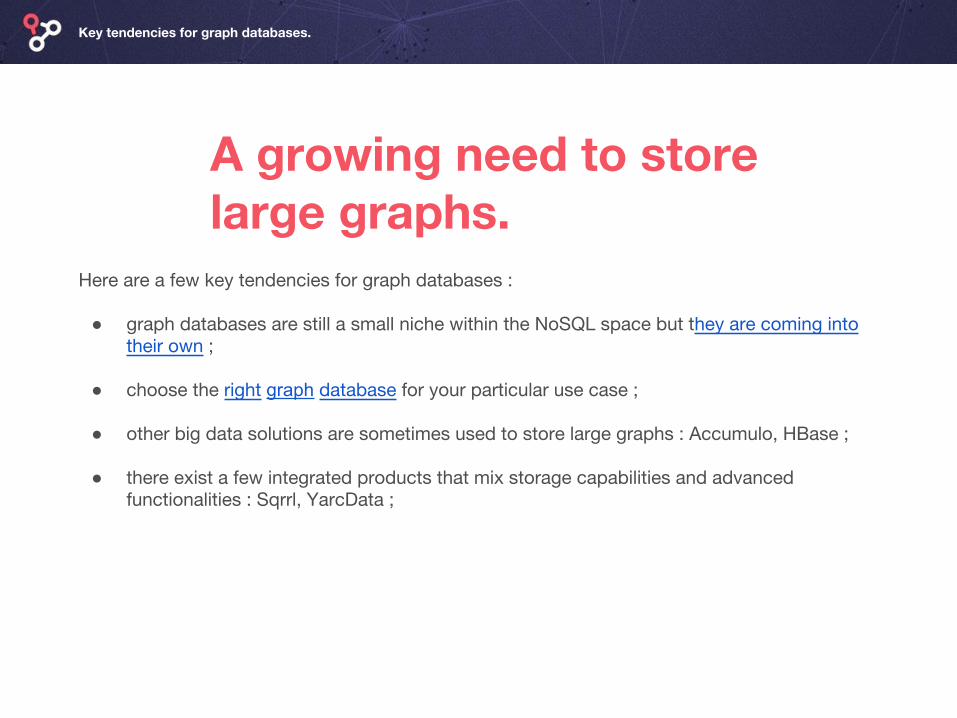
A growing need to store large graphs.
Key tendencies for graph databases.
Here are a few key tendencies for graph databases :
● graph databases are still a small niche within the NoSQL space but they are coming into their own ;
● choose the right graph database for your particular use case ;
● other big data solutions are sometimes used to store large graphs : Accumulo, HBase ;
● there exist a few integrated products that mix storage capabilities and advanced functionalities : Sqrrl, YarcData ;
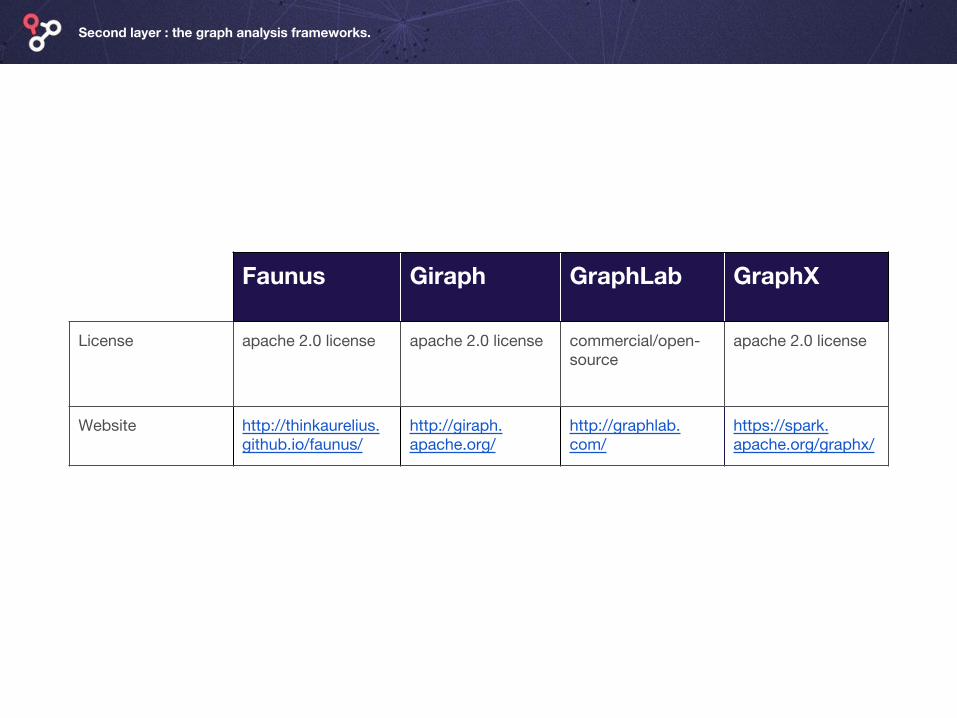
Faunus Giraph GraphLab GraphX
License apache 2.0 license apache 2.0 license commercial/open-source
apache 2.0 license
Website http://thinkaurelius.github.io/faunus/
http://giraph.apache.org/
http://graphlab.com/
https://spark.apache.org/graphx/
Second layer : the graph analysis frameworks.
DescriptionThe team behind the Titan graph database has also released Faunus. Faunus is a Hadoop-based graph analytics engine for analyzing graphs represented across a multi-machine compute cluster. It is compatible with HBase, Cassandra or Hadoop.
Faunus.
FaunusGraph analysisWebsite : http://thinkaurelius.github.io/faunus/License : Apache 2.0 license
DescriptionGiraph, the Apache project, is an iterative graph processing system built for high scalability. It is currently used at Facebook to power its famous Graph Search. At Facebook, Giraph can process a graph with trillions of connections between people, places, likes and interests in minutes. It is compatible with Hadoop.
Giraph.
GiraphGraph analysisWebsite : http://giraph.apache.org/License : Apache 2.0 license
DescriptionPeople interested in Machine Learning can turn to GraphLab to analyse their graph data. GraphLab was started as an open-source project by Prof. Carlos Guestrin of Carnegie Mellon University in 2009. Recently it has evolved in a data science toolbox but remains very useful for graph analytics.
GaphLab.
GraphLabGraph analysisWebsite : http://graphlab.com/License : Commercial/Open-source

DescriptionAnother popular solution for graph computing is Graphx. It is integrated to Apache Spark, an open-source data analytics cluster computing framework. GraphX has a built in library of algorithms and include ETL functionalities. It doesn’t offer the same performances as Giraph but is easier to use.
GraphX.
GraphXGraph analysisWebsite : https://spark.apache.org/graphx/License : Apache 2.0 license
Graph computation is part of the big data toolset.
Here are a few key tendencies for the graph analysis frameworks :
● most graph databases have their own query language (ex : Cypher for Neo4j and Faunus for Titan ) ;
● GraphX and Giraph are bringing graph paradigms to HBase, Cassandra and Hadoop ;
● GraphBuilder, an Intel project can help transform tabular data into graphs ;
Key tendencies for graph analysis frameworks.
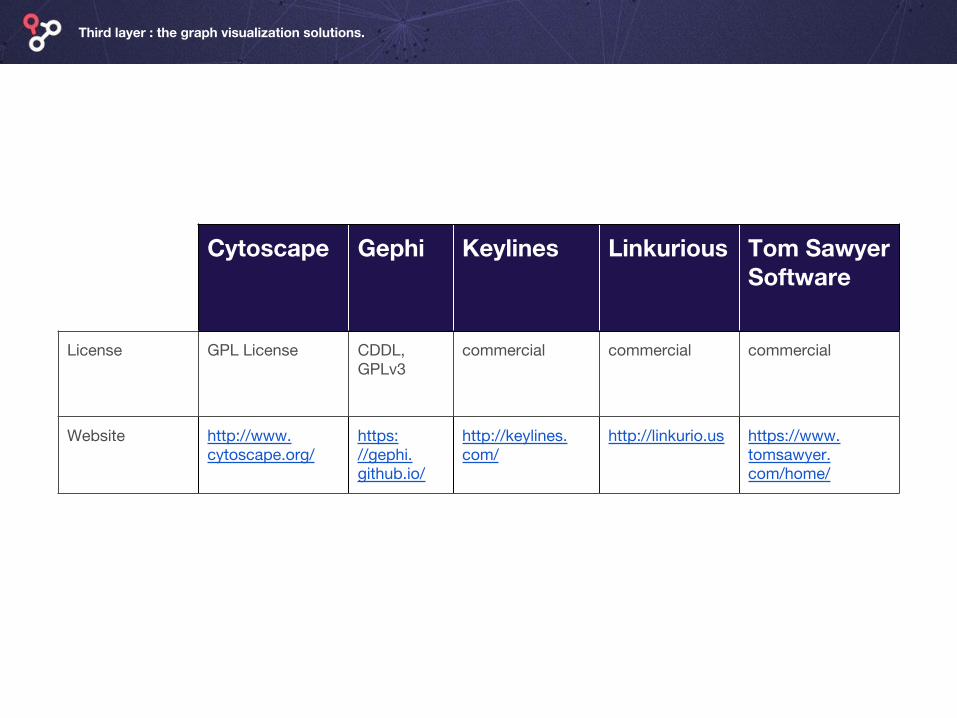
Third layer : the graph visualization solutions.
Cytoscape Gephi Keylines Linkurious Tom Sawyer Software
License GPL License CDDL, GPLv3
commercial commercial commercial
Website http://www.cytoscape.org/
https://gephi.github.io/
http://keylines.com/
http://linkurio.us https://www.tomsawyer.com/home/
DescriptionAnother graph visualization solution is Cytoscape. Mostly used by biologists at first, it has progressively evolved in a general platform for complex network analysis and visualization. It is desktop-based and is supported by a large community.
Cytoscape.
CytoscapeGraph visualizationWebsite : http://www.cytoscape.org/License : GPL License

Gephi.
GephiGraph visualizationWebsite : https://gephi.github.io/License : CDDL, GPLv3
DescriptionGephi has played a key role in this process. It is an open-source graph visualization solution. It packs a powerful set of SNA algorithms and visualization options. Used by a wide community of scientists and data scientists, it is akin to a “Photoshop for graphs”.
DescriptionKeyLines is a software library for graph visualization. Developed by Cambridge Intelligence, it is designed to help developers create interactive web applications around graphs.
Keylines.
KeylinesGraph visualizationWebsite : http://keylines.com/License : commercial

DescriptionGraph visualization is going beyond the world of scientists. Linkurious is a commercial graph visualization solution that aims to democratize graph visualization. Its interface is designed for the interactive exploration of large graphs and comes directly with features common in traditional business intelligence applications (security, user management, etc).
Linkurious.
LinkuriousGraph visualizationWebsite : http://linkurio.usLicense : commercial
DescriptionTom Sawyer Software sells a collection of software development kits for graph visualization and analysis. Its products are used by established companies like NASA and Oracle. It is compatible with ActiveX, C++, Java, and .NET.
Tom Sawyer Software.
Tom Sawyer SoftwareGraph visualizationWebsite : https://www.tomsawyer.com/home/License : commercial
Here are a few key tendencies for graph databases :
● traditional graph visualization solutions were targeted at developers and data scientists : Cytoscape, Gephi ;
● companies like Cambridge Intelligence and Linkurious are making graphs easier to understand for business people, not just data scientists ;
● a few projects try to integrate the different layers of the graph technologies into complete products : Dendrite, Linkurious, Tom Sawyer Software ;
Graph visualization moving to the enterprise.
Key tendencies for graph visualization solutions.

Other notable players.
Full stack graph startups
Data science platforms