
Introduction to the Base and Yield Option Update Analyzer (BYA) James W. Richardson Professor and...
63
Introduction to the Base and Yield Option Update Analyzer (BYA) James W. Richardson Professor and TAES Faculty Fellow and Joe L. Outlaw Associate Professor and Extension Economist Agricultural and Food Policy Center Texas A&M University National Extension Training for 2002 Farm Bill
-
Upload
elwin-tate -
Category
Documents
-
view
217 -
download
2
Transcript of Introduction to the Base and Yield Option Update Analyzer (BYA) James W. Richardson Professor and...

Introduction to the Base and Yield Option Update Analyzer (BYA)
James W. Richardson
Professor and TAES Faculty Fellow
and
Joe L. Outlaw
Associate Professor and Extension Economist
Agricultural and Food Policy Center
Texas A&M University
National Extension Training for 2002 Farm Bill
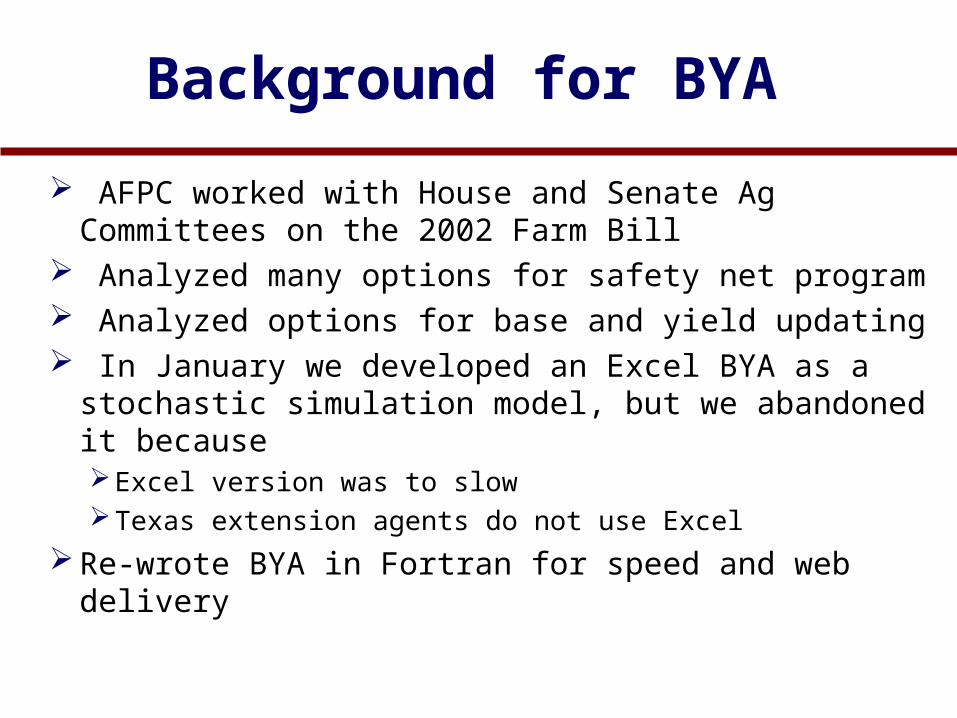
Background for BYA
AFPC worked with House and Senate Ag Committees on the 2002 Farm Bill
Analyzed many options for safety net program Analyzed options for base and yield updating In January we developed an Excel BYA as a stochastic
simulation model, but we abandoned it becauseExcel version was to slow Texas extension agents do not use Excel
Re-wrote BYA in Fortran for speed and web delivery

Development of BYA
Realized early on the Web was the only practical delivery method
Web based front-end and back-end around a Fortran simulation model offered numerous benefits:Utilized our experience in analyzing riskGuarantees everyone uses the same modelWe could post updated versions as the FSR Rules changed
We recognize that there are a large number of decision aids that have been developed
Our version is the only web based decision aid that offers the ability to analyze options under risk

After We had a Working BYA
Texas State office suggested contacting Diane Sharp Met with FSA D.C. leadership in April
Looking for help checking our software and implementation specifics
Began cross-checking with Brad Karmen Many iterations later – in a win-win situation
FSA found that it is working with a group that won’t quit until it is right
AFPC is assured the software will actually be used Common goal is to help producers make more
informed decisions on base and yield options
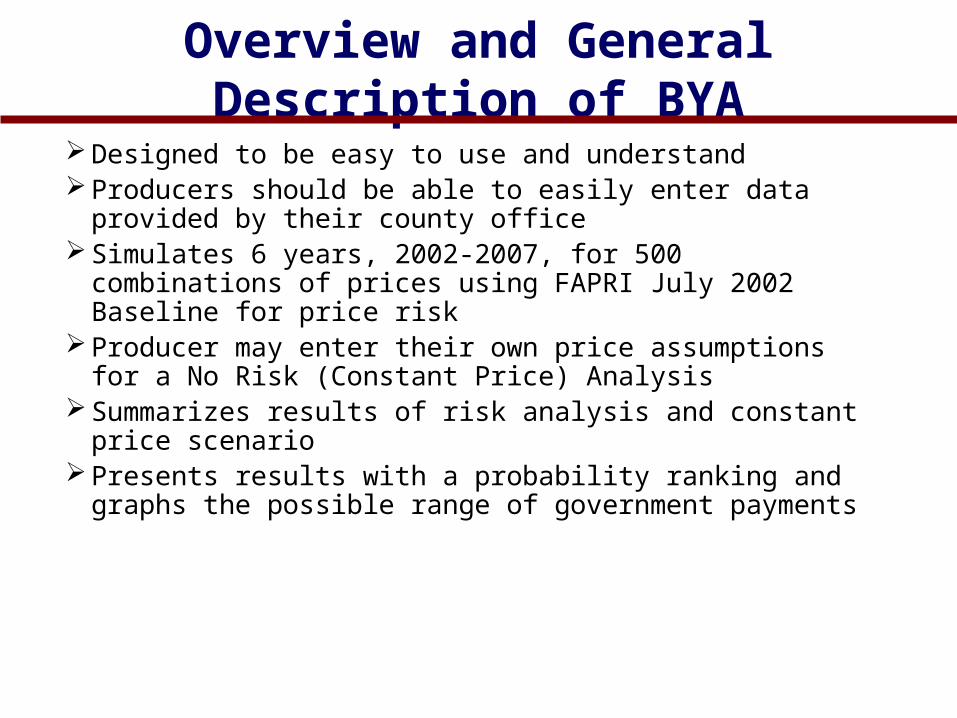
Overview and General Description of BYA
Designed to be easy to use and understand Producers should be able to easily enter data provided by
their county office Simulates 6 years, 2002-2007, for 500 combinations of
prices using FAPRI July 2002 Baseline for price risk Producer may enter their own price assumptions for a No
Risk (Constant Price) Analysis Summarizes results of risk analysis and constant price
scenario Presents results with a probability ranking and graphs the
possible range of government payments

Link to BYA From House Ag. Committee Web Page
agriculture.house.gov/farmbill.htm
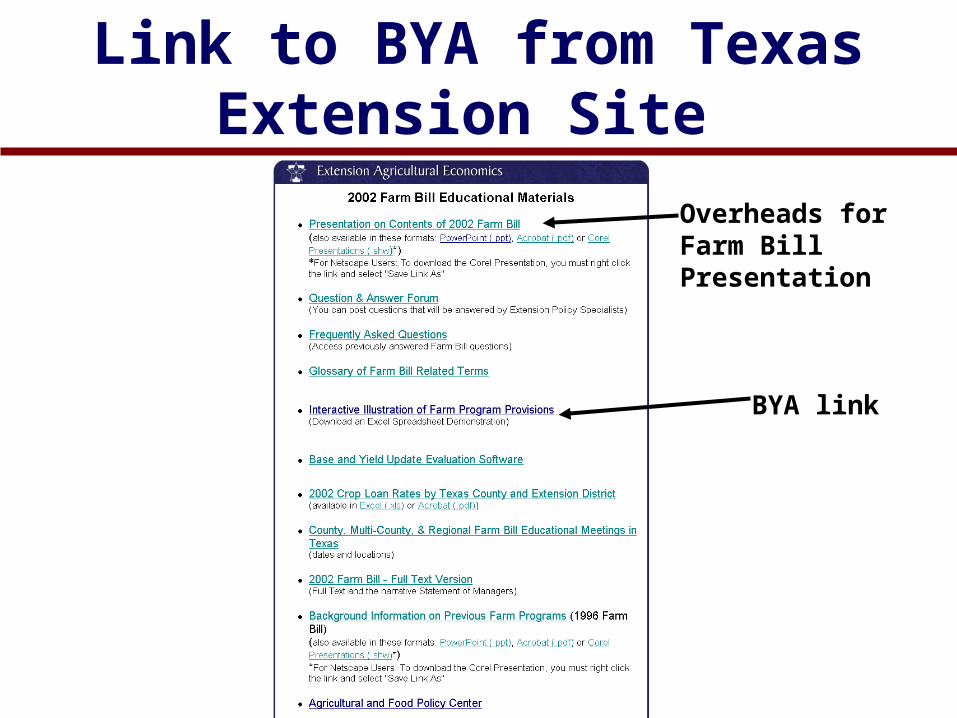
Link to BYA from Texas Extension Site
BYA link
Overheads for Farm Bill Presentation

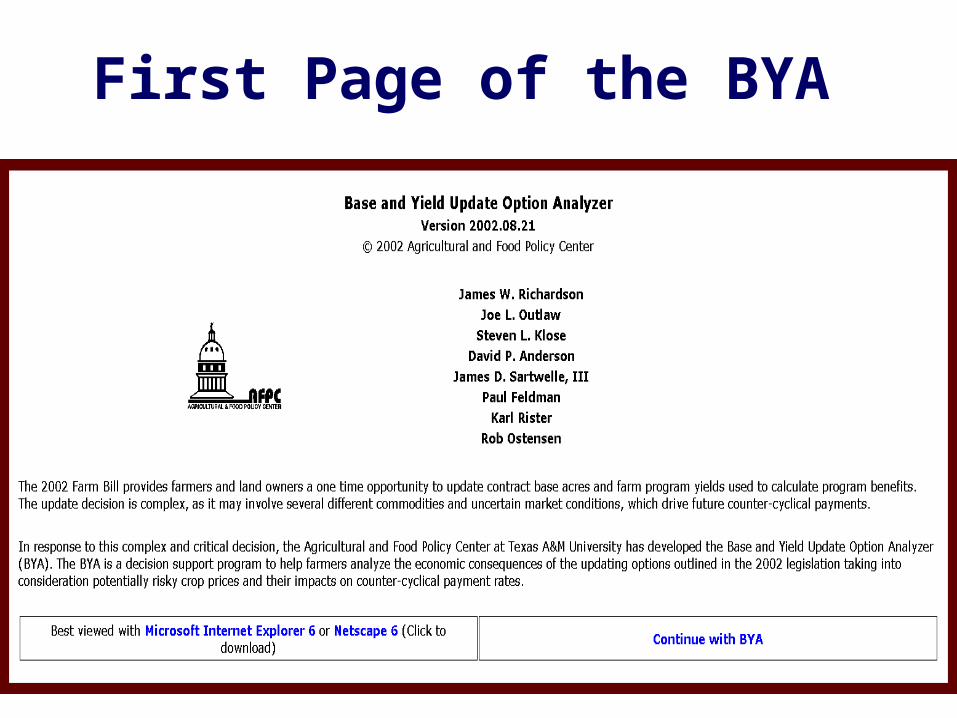
First Page of the BYA
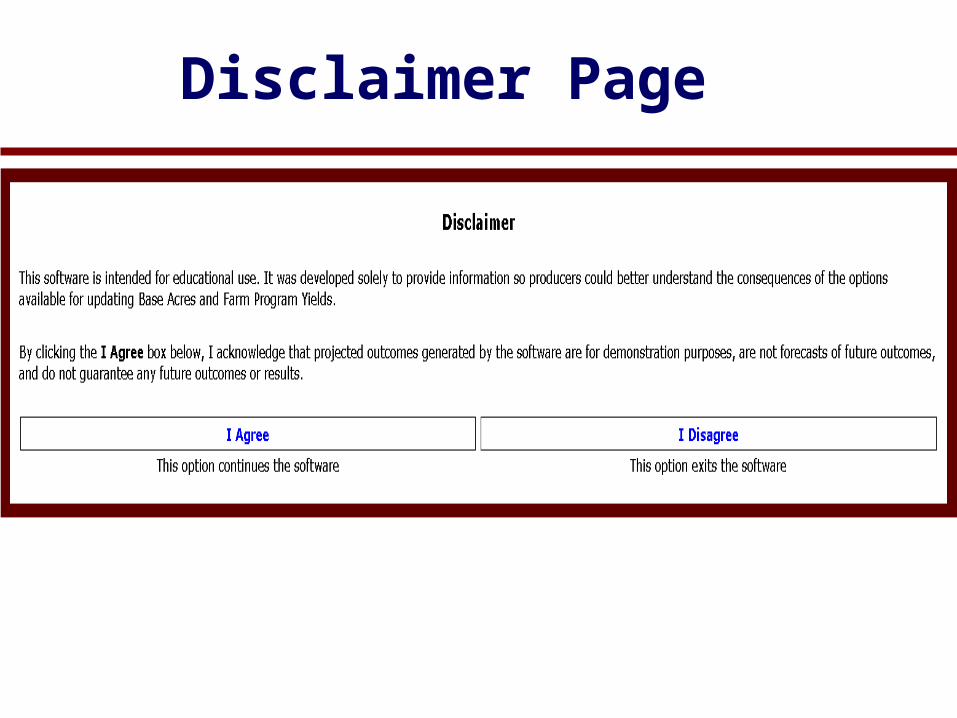
Disclaimer Page
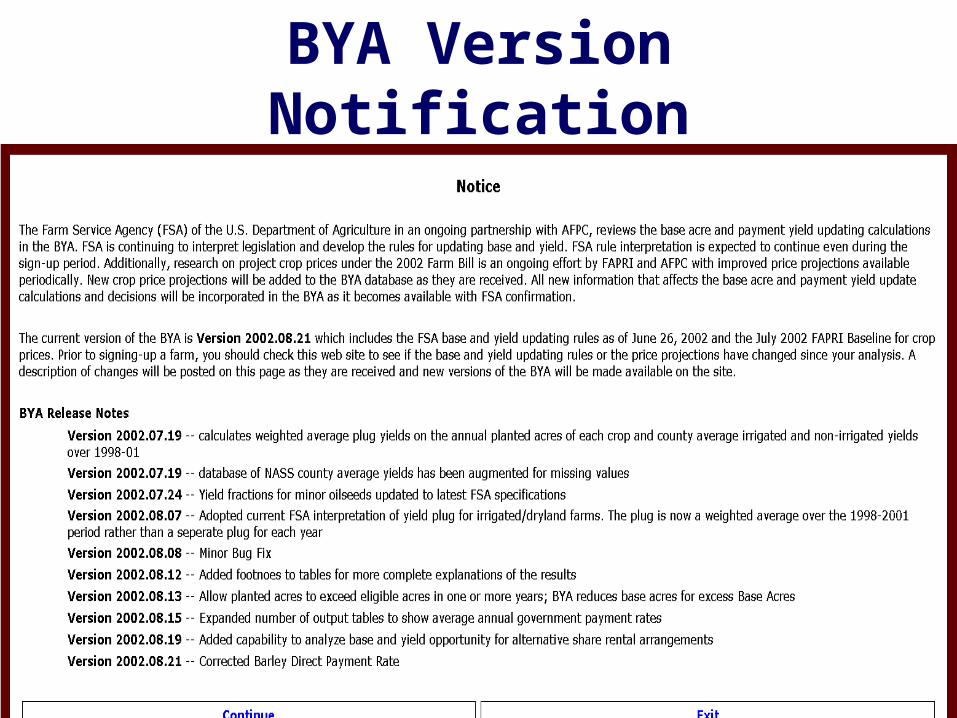
BYA Version Notification

Options for the BYA

Example Farm
Webster County Iowa farm unit named The Smith Farm 160 acres of cropland
Two crops grown 1998-2002 Historical base for three crops Production and Farm Program History
Crop Planted Base (PFC) Payment YieldCorn 80 80 100Soybeans 80 0 0Oats 0 15 50Wheat 0 15 40
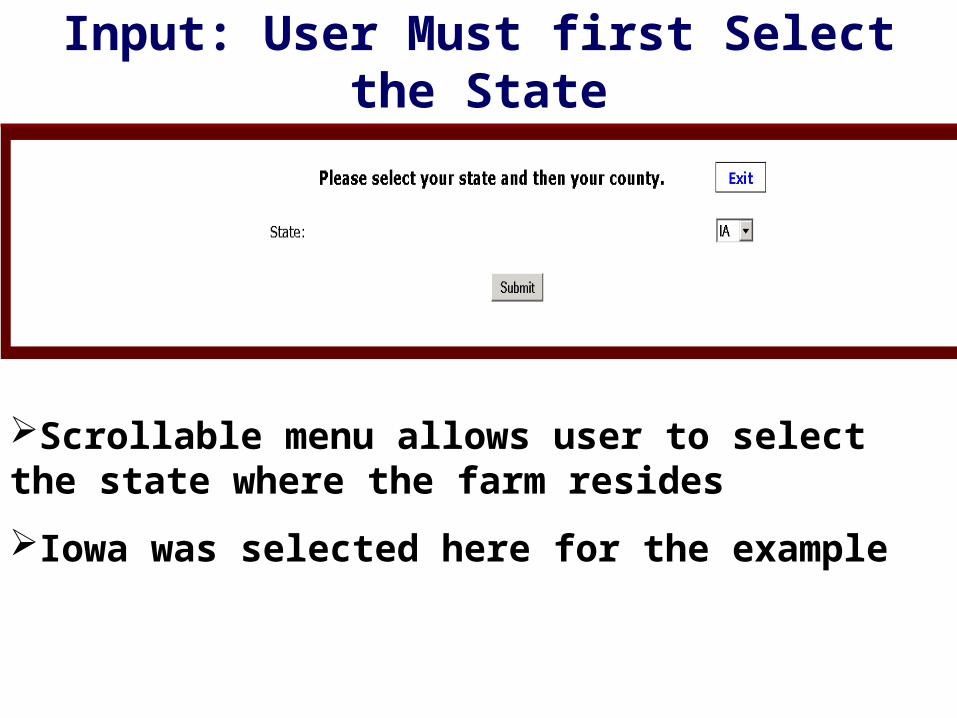
Input: User Must first Select the State
Scrollable menu allows user to select the state where the farm resides
Iowa was selected here for the example
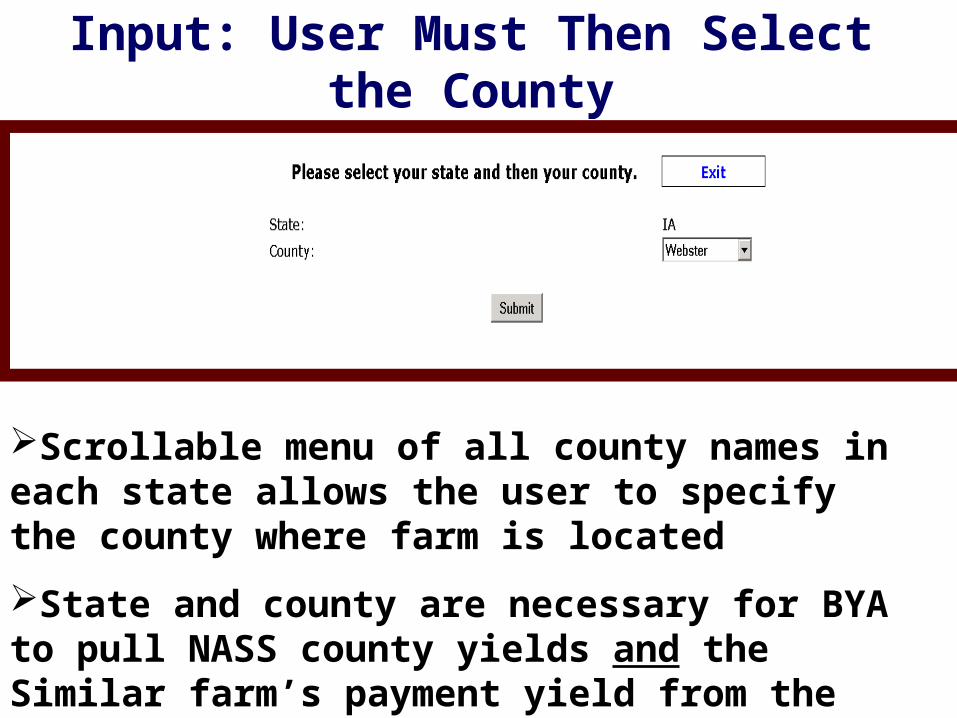
Input: User Must Then Select the County
Scrollable menu of all county names in each state allows the user to specify the county where farm is located
State and county are necessary for BYA to pull NASS county yields and the Similar farm’s payment yield from the county data base

Input: Specify All Covered Crops Produced on the Farm
• User specifies crops based on production practice:
– Irrigated
– Non-Irrigated
– Combined irrigated and non-irrigated
• Must include crops with base acres and crops produced in 1998-2001

Crop Input: Selected Four Crops for the Example Farm Unit
• Four cropsproduced on the farm unit:
– Corn – Soybeans
• Two crops have historical
base acres– Oats– Wheat
• Combined is used when crop is grown under both irrigated and non-irrigated conditions
Crops Selected

Crop Input Screen: User Enters History for Each Crop on the Farm Unit
• Example shows State:IA County:Webster and first crop is wheat
• Enter total cropland on farm and acres in CRP and WRP
• Note County average yields are inserted by BYA from State/County names
From a NASS data base
From an FSA data base
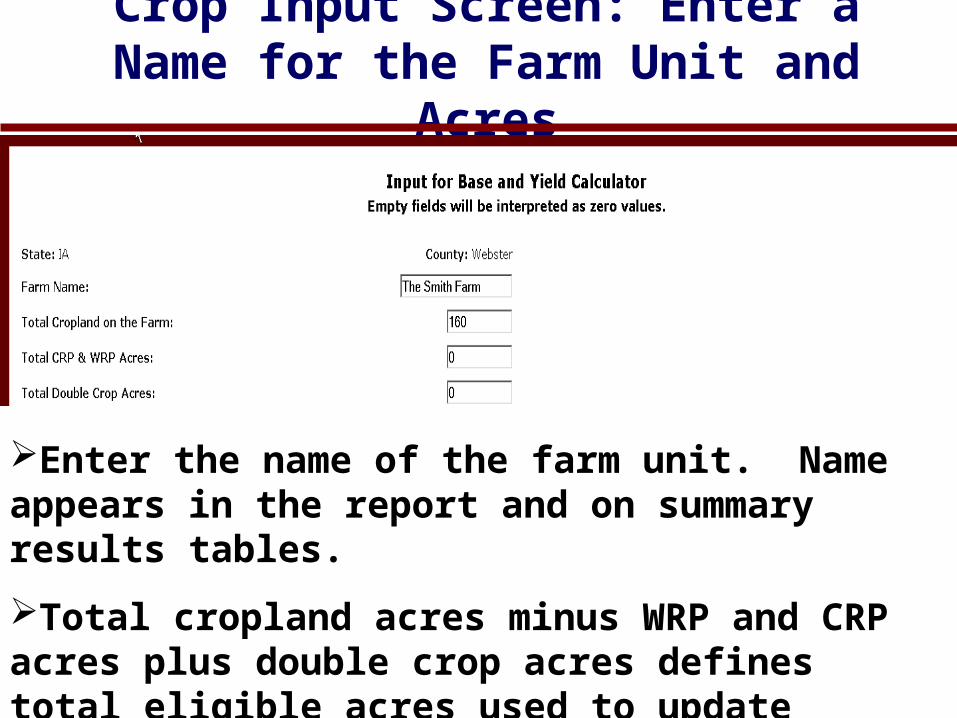
Crop Input Screen: Enter a Name for the Farm Unit and Acres
Enter the name of the farm unit. Name appears in the report and on summary results tables.
Total cropland acres minus WRP and CRP acres plus double crop acres defines total eligible acres used to update base acres.

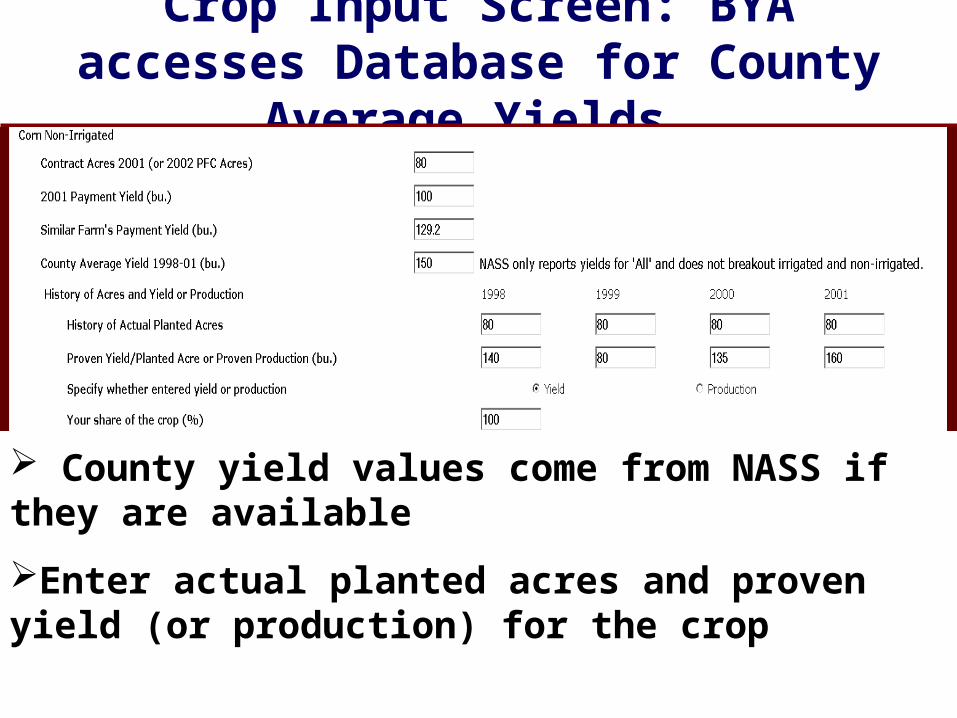
Crop Input Screen: BYA accesses Database for County Average Yields
Wheat has a historical base but was not planted 1998-2002. Enter the base acres and zero planted acres
Provide the historical payment yield
County yield values come from NASS if they are available
Crop Input Screen: BYA accesses Database for County Average Yields
County yield values come from NASS if they are available
Enter actual planted acres and proven yield (or production) for the crop
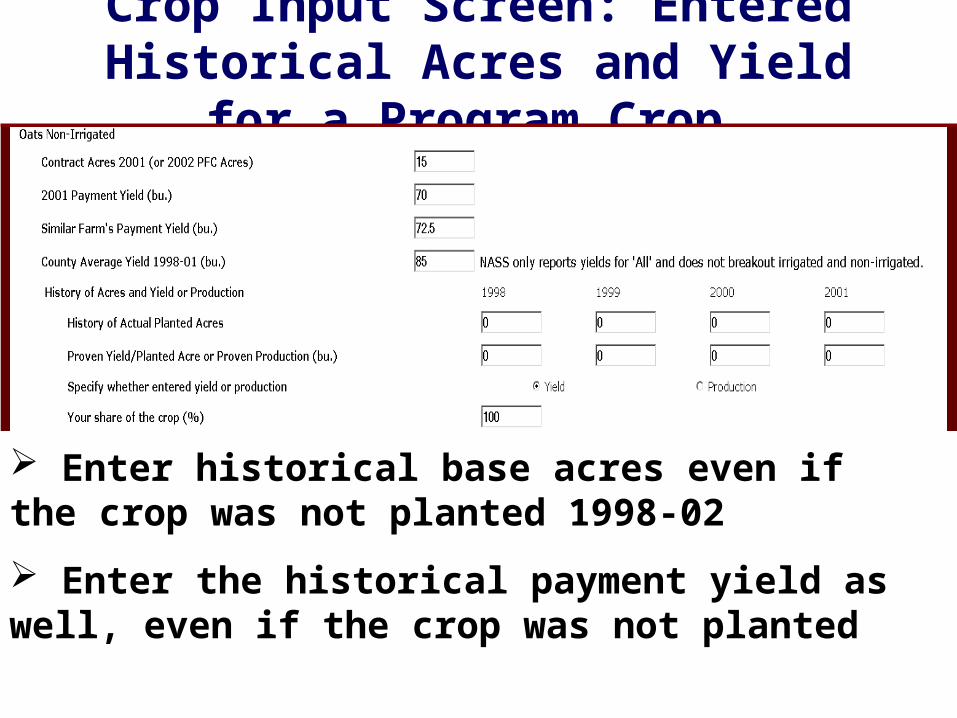
Crop Input Screen: Entered Historical Acres and Yield for a Program Crop
Enter historical base acres even if the crop was not planted 1998-02
Enter the historical payment yield as well, even if the crop was not planted

Crop Input Screen: Example for Oilseed Crops -- Note Entered Production
Less input is required because oilseed crops have no historical base acres and payment yield
NASS county average yield is provided if it is available
User can type in their own county average yield if FSA’s value is in error

Crop Input Screen: User May Review, Revise or Accept Default Annual Prices
• Producers prices used for the constant price analysis of the alternative base and payment yields
• Users can specify their own annual prices for use in calculating government payments by typing their own values into the cells
• The default prices come from the July 2002 FAPRI Baseline assuming continuation of the 2002 Farm Bill

Crop Input Screen: Last Option is to Select the Output Format for Report
Two reports are generated by BYA.
Minimum provides the basic tables plus footnotes
Maximum provides all tables and all footnotes
Click on Submit for Analysis to simulate the farm unit for 500 iterations of 6 years

Report: Starts with Users Input Data and Continues with Calculations and Results

Report: Farm Name, Acreage and Version Number with a Date
• Farm unit’s name, state and count at the outset presented first
• Total cropland on the farm unit is also provided
• BYA version number is important as FSA is changing the rules as we go; unannounced versions will appear
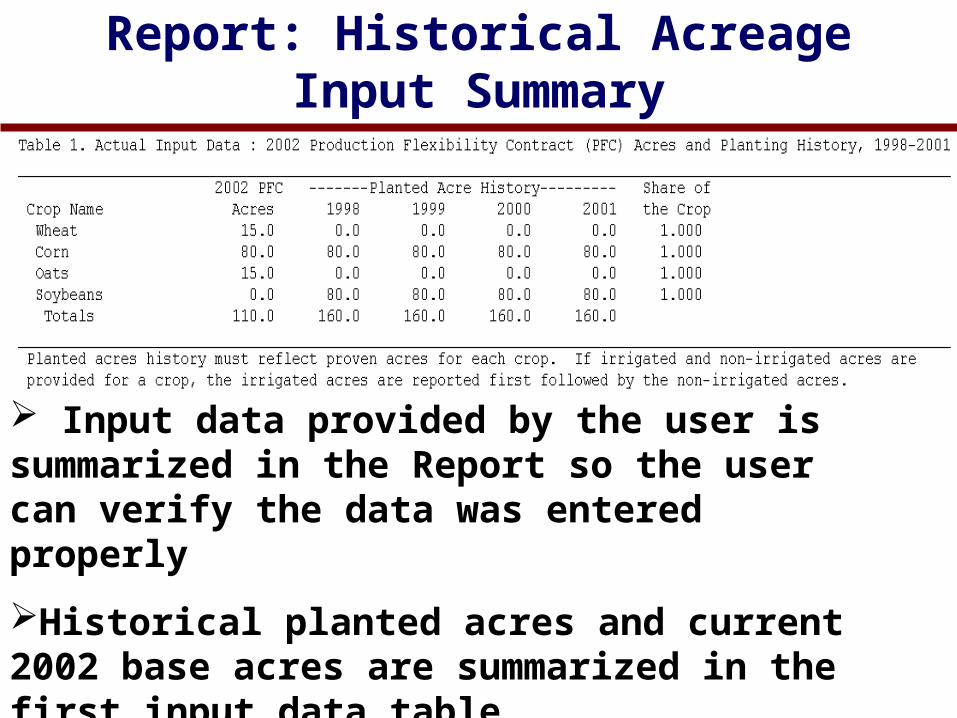
Report: Historical Acreage Input Summary
Input data provided by the user is summarized in the Report so the user can verify the data was entered properly
Historical planted acres and current 2002 base acres are summarized in the first input data table
Share of the crop is provided in this table
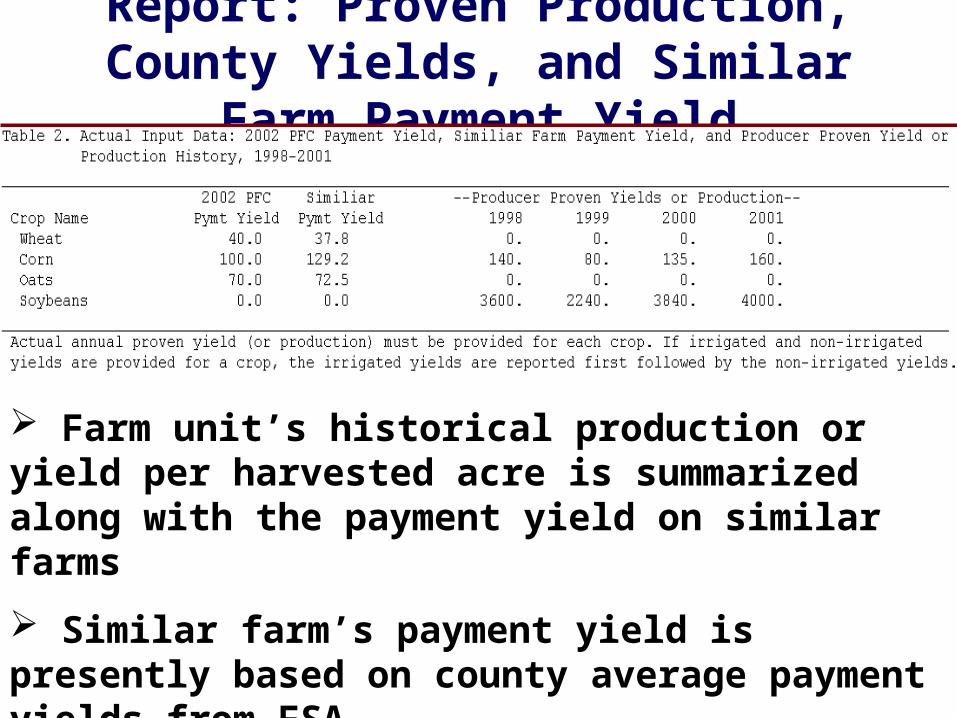
Report: Proven Production, County Yields, and Similar Farm Payment Yield
Farm unit’s historical production or yield per harvested acre is summarized along with the payment yield on similar farms
Similar farm’s payment yield is presently based on county average payment yields from FSA
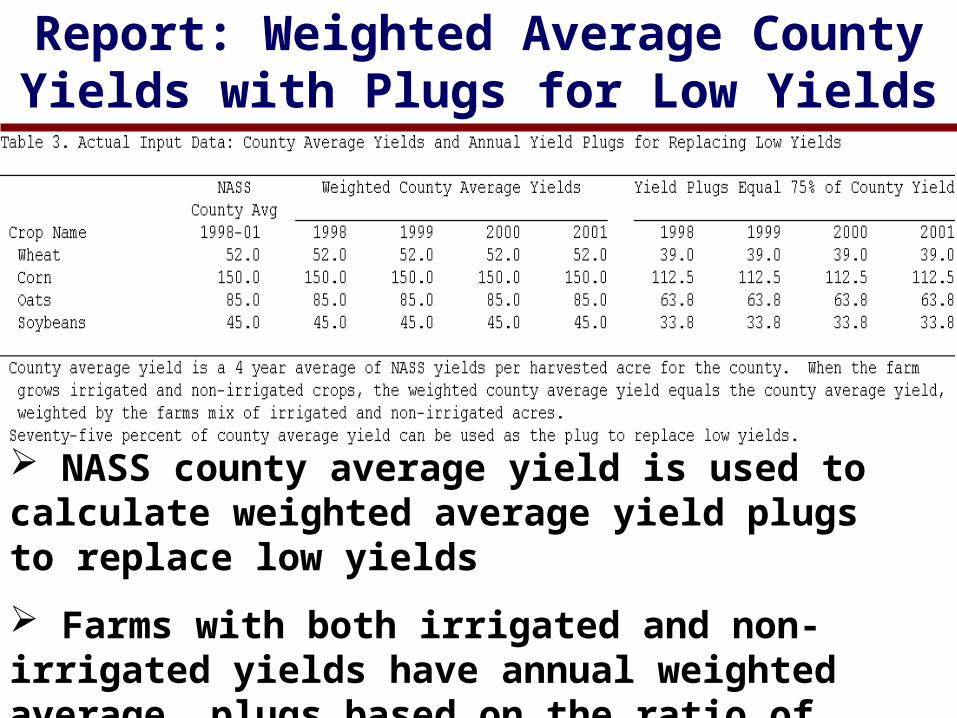
Report: Weighted Average County Yields with Plugs for Low Yields
NASS county average yield is used to calculate weighted average yield plugs to replace low yields
Farms with both irrigated and non-irrigated yields have annual weighted average plugs based on the ratio of irrigated and non-irrigated acres each year
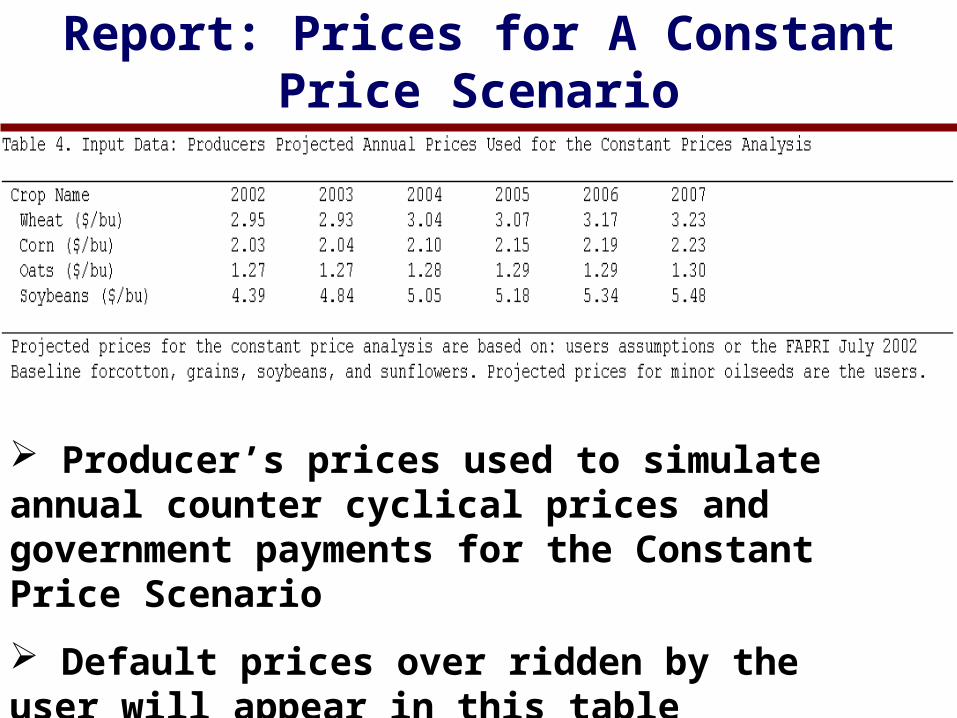
Report: Prices for A Constant Price Scenario
Producer’s prices used to simulate annual counter cyclical prices and government payments for the Constant Price Scenario
Default prices over ridden by the user will appear in this table
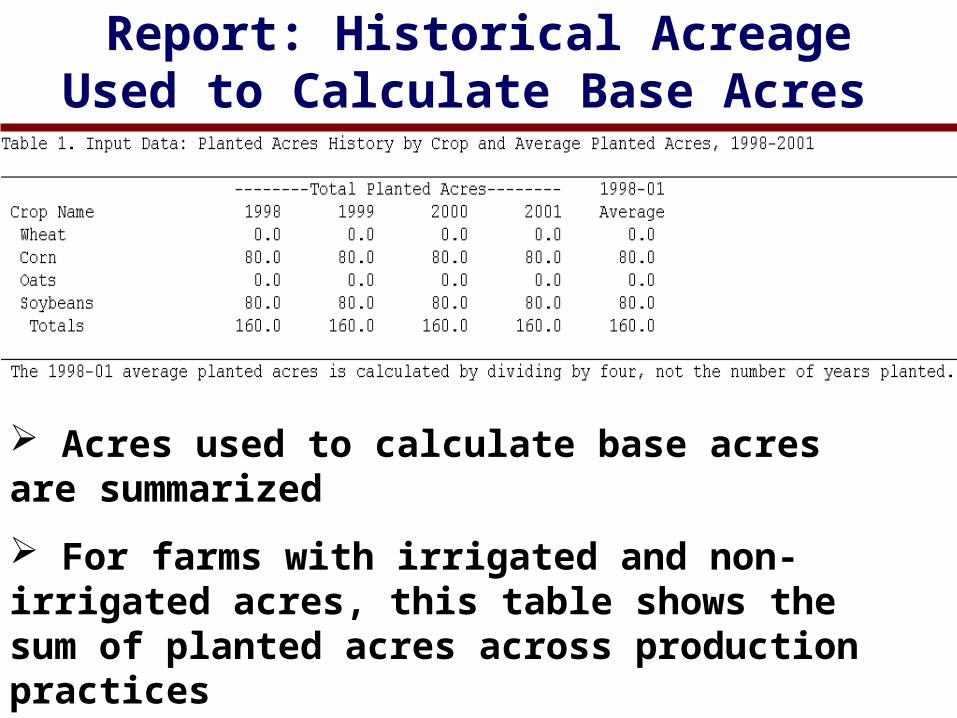
Report: Historical Acreage Used to Calculate Base Acres
Acres used to calculate base acres are summarized
For farms with irrigated and non-irrigated acres, this table shows the sum of planted acres across production practices
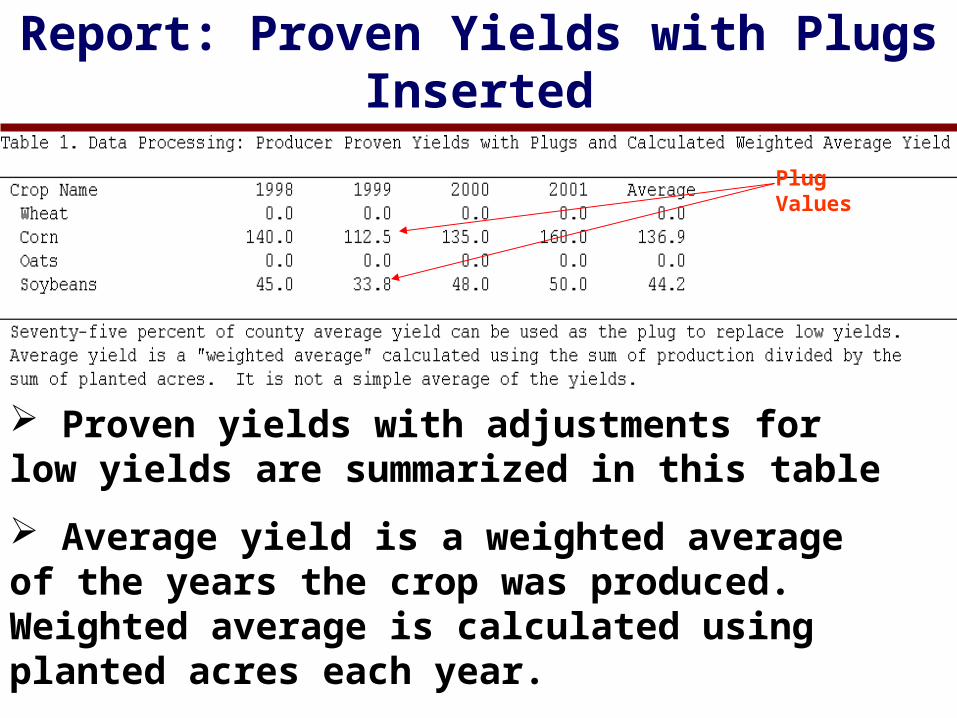
Report: Proven Yields with Plugs Inserted
Proven yields with adjustments for low yields are summarized in this table
Average yield is a weighted average of the years the crop was produced. Weighted average is calculated using planted acres each year.
Plug Values
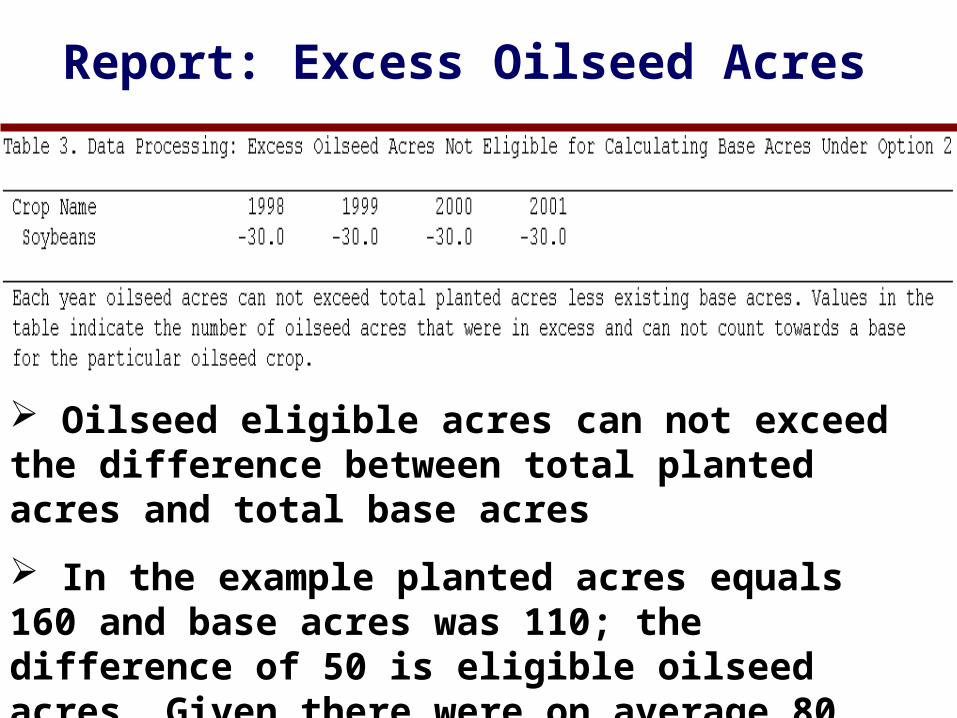
Report: Excess Oilseed Acres
Oilseed eligible acres can not exceed the difference between total planted acres and total base acres
In the example planted acres equals 160 and base acres was 110; the difference of 50 is eligible oilseed acres. Given there were on average 80 soybean planted acres, then 30 acres are in excess.
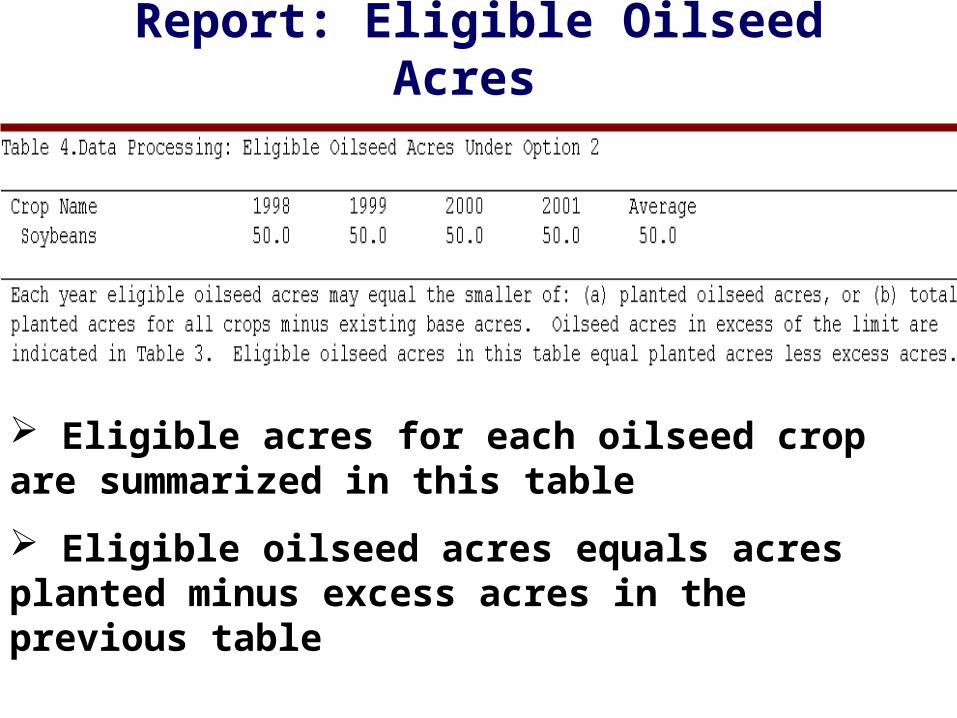
Report: Eligible Oilseed Acres
Eligible acres for each oilseed crop are summarized in this table
Eligible oilseed acres equals acres planted minus excess acres in the previous table

Report: Estimated Annual Government Payment/Acre by Crop
Estimated per acre government payments are calculated based on an average of the 2002-2007 period CCP rates and direct payment rates and payment yields
Only calculated if the crop has been grown 1998-02
These values used when determining which base acres to trade for oilseed base when trying to maximize oilseed base acres
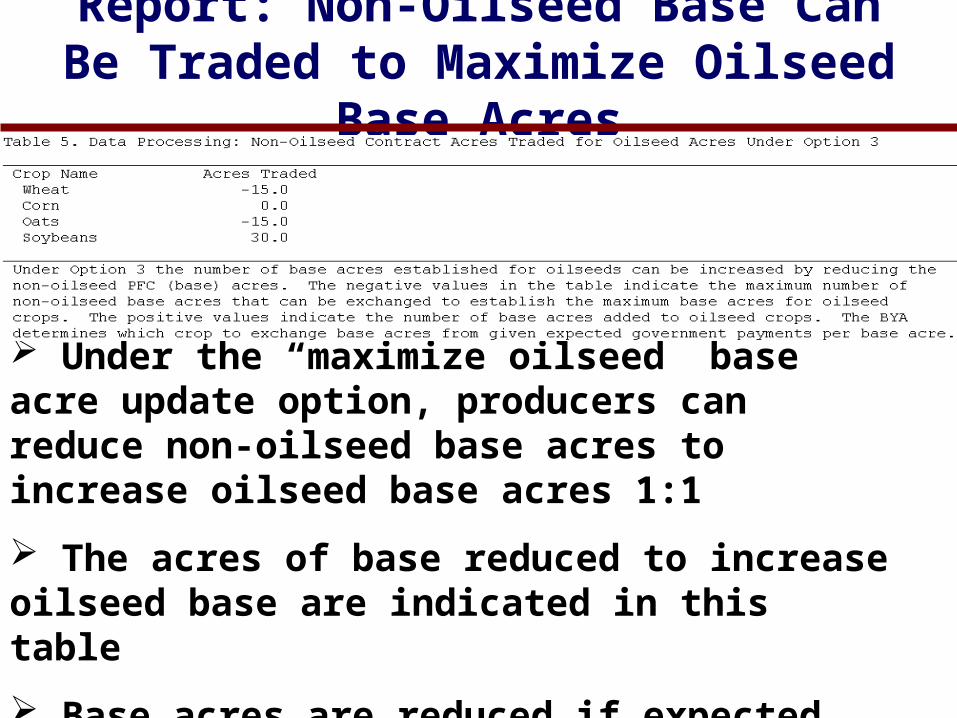
Report: Non-Oilseed Base Can Be Traded to Maximize Oilseed Base Acres
Under the “maximize oilseed” base acre update option, producers can reduce non-oilseed base acres to increase oilseed base acres 1:1
The acres of base reduced to increase oilseed base are indicated in this table
Base acres are reduced if expected payments are less than for the oilseed crop

Report: Definition of Base Update and Yield Establishment Options

Report: Calculated Base Acres for Permitted Options
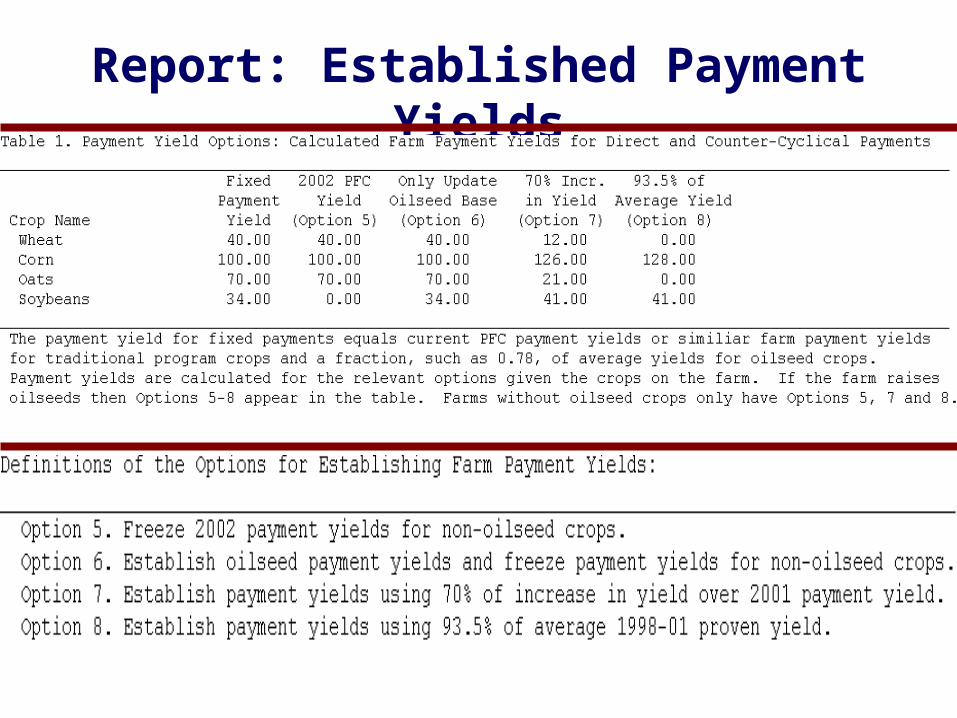
Report: Established Payment Yields
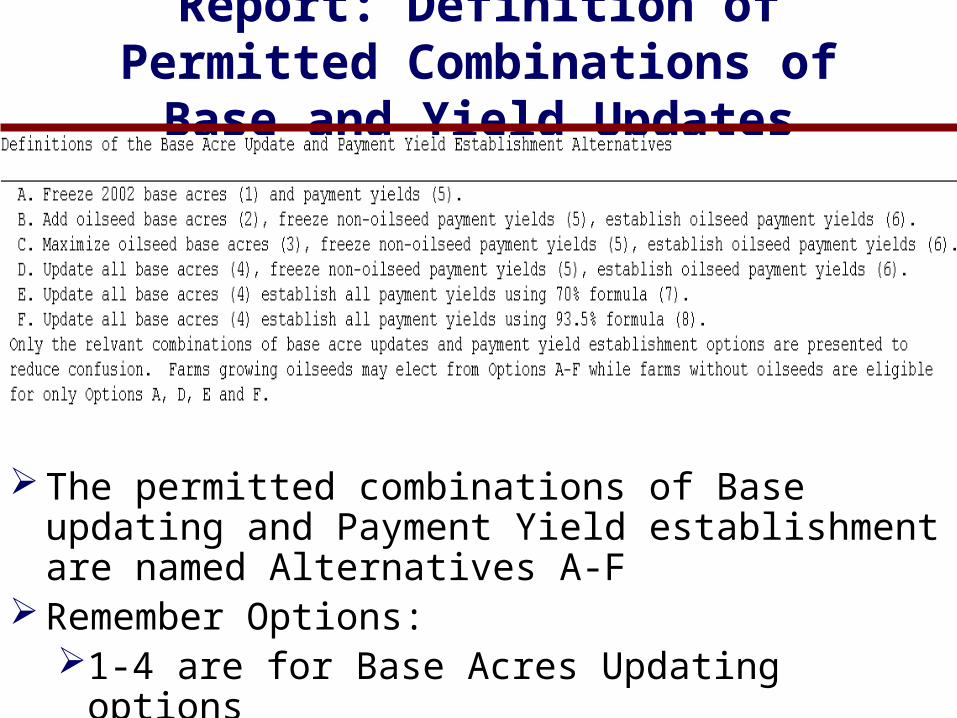
Report: Definition of Permitted Combinations of Base and Yield Updates
The permitted combinations of Base updating and Payment Yield establishment are named Alternatives A-F
Remember Options:1-4 are for Base Acres Updating options5-8 are for Payment Yield Establishment options

Report: Annual Direct Payment Rates
Annual direct payment rates are provided as a check
Annual rates appear in this table for each crop on the farm unit

Report: Average Annual CC Payment Rates for Risk Prices
Average annual CC payment rates are calculated from the 500 draws of crop prices each year
These CC payment rates will not equal the rates for the constant price scenario
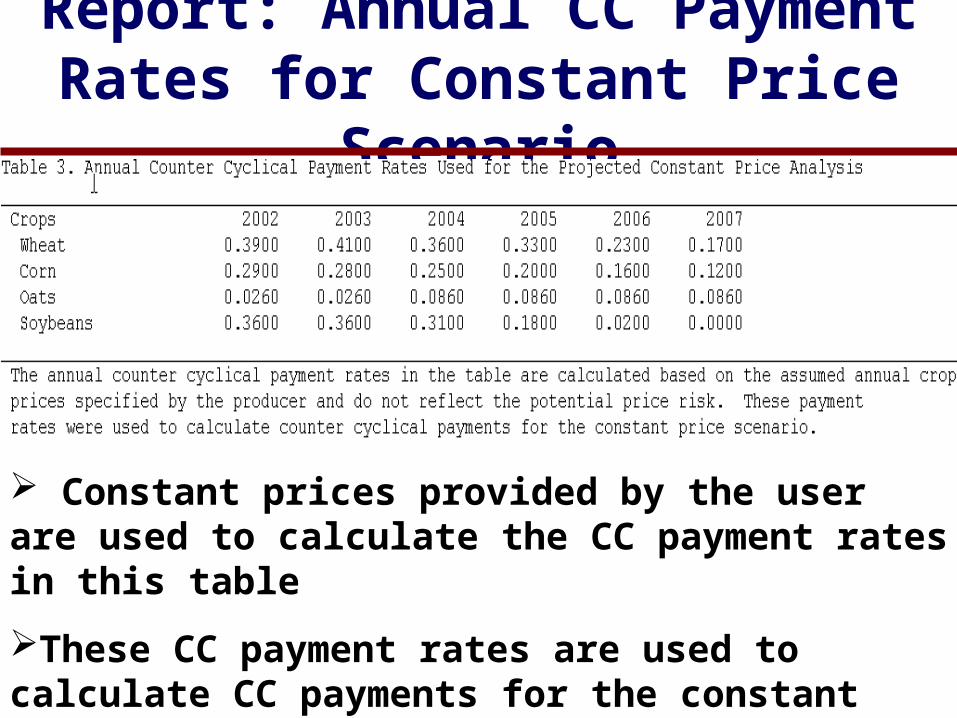
Report: Annual CC Payment Rates for Constant Price Scenario
Constant prices provided by the user are used to calculate the CC payment rates in this table
These CC payment rates are used to calculate CC payments for the constant price scenario
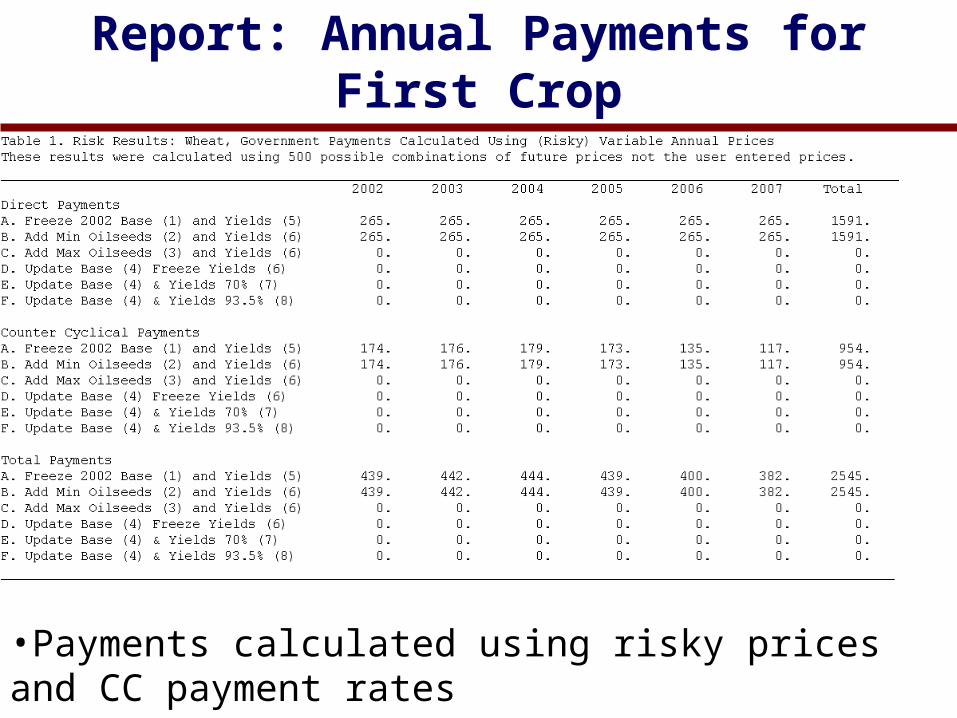
Report: Annual Payments for First Crop
•Payments calculated using risky prices and CC payment rates

Report: Annual Payment for Second Crop
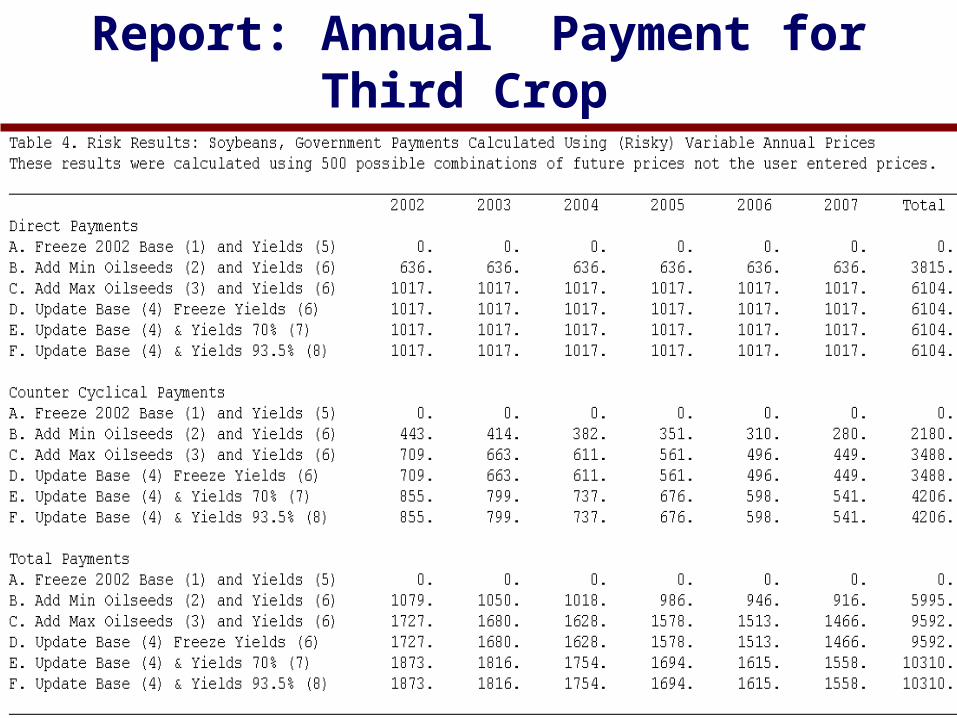
Report: Annual Payment for Third Crop
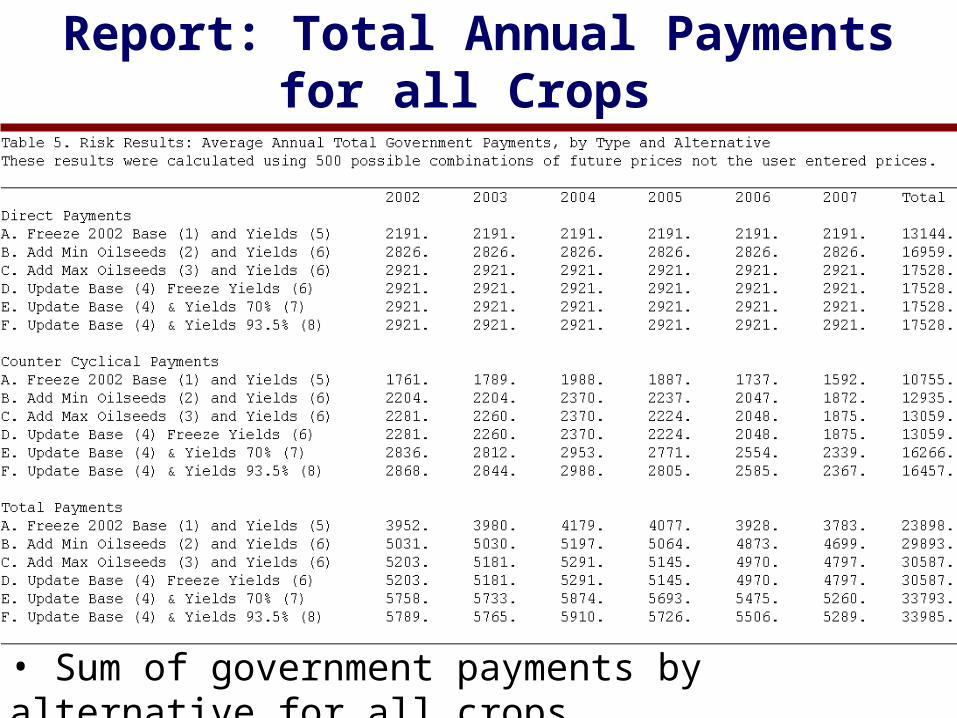
Report: Total Annual Payments for all Crops
• Sum of government payments by alternative for all crops
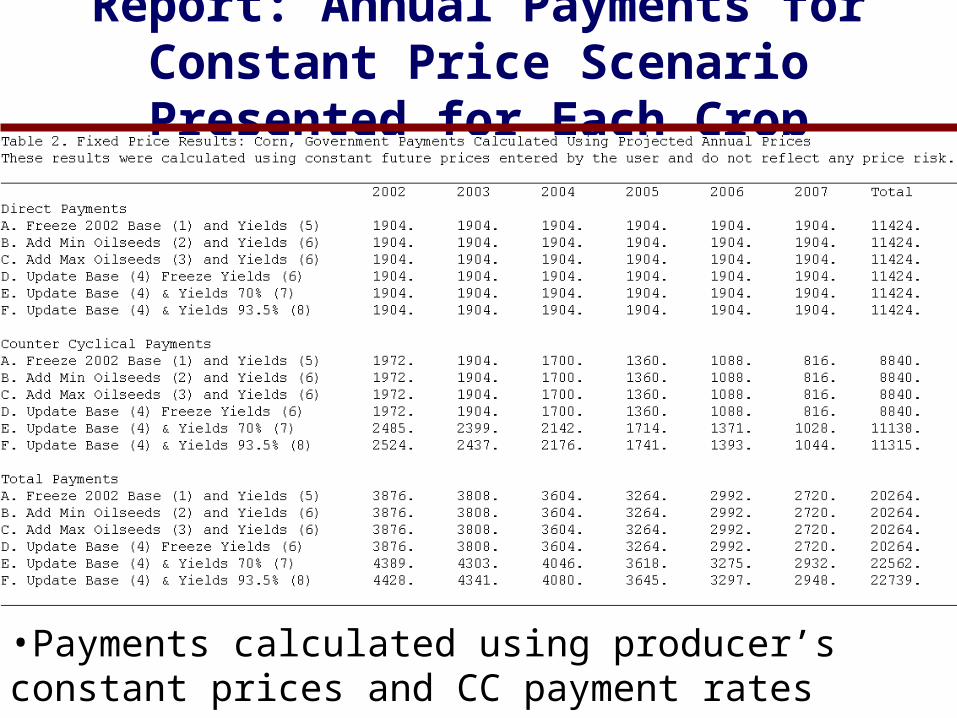
Report: Annual Payments for Constant Price Scenario Presented for Each Crop
•Payments calculated using producer’s constant prices and CC payment rates
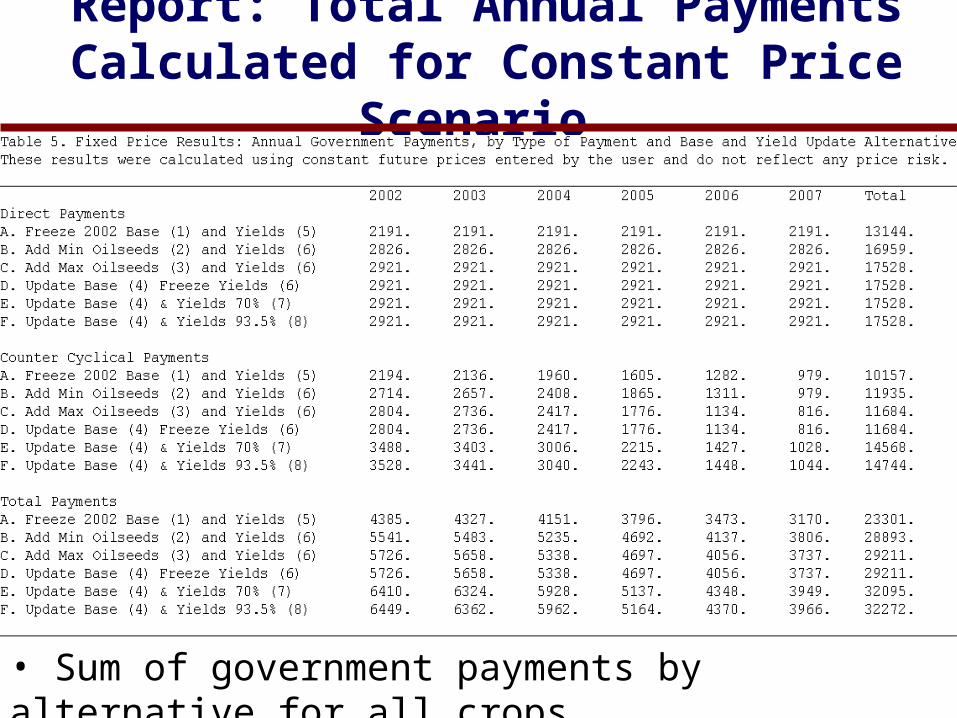
Report: Total Annual Payments Calculated for Constant Price Scenario
• Sum of government payments by alternative for all crops

Report: Table Summarizing Risk Results by Alternative
•Ranked based on the number of times Alternative earned most govt. payments over the 6 year planning horizon
•90% confidence intervals shows risk on payments
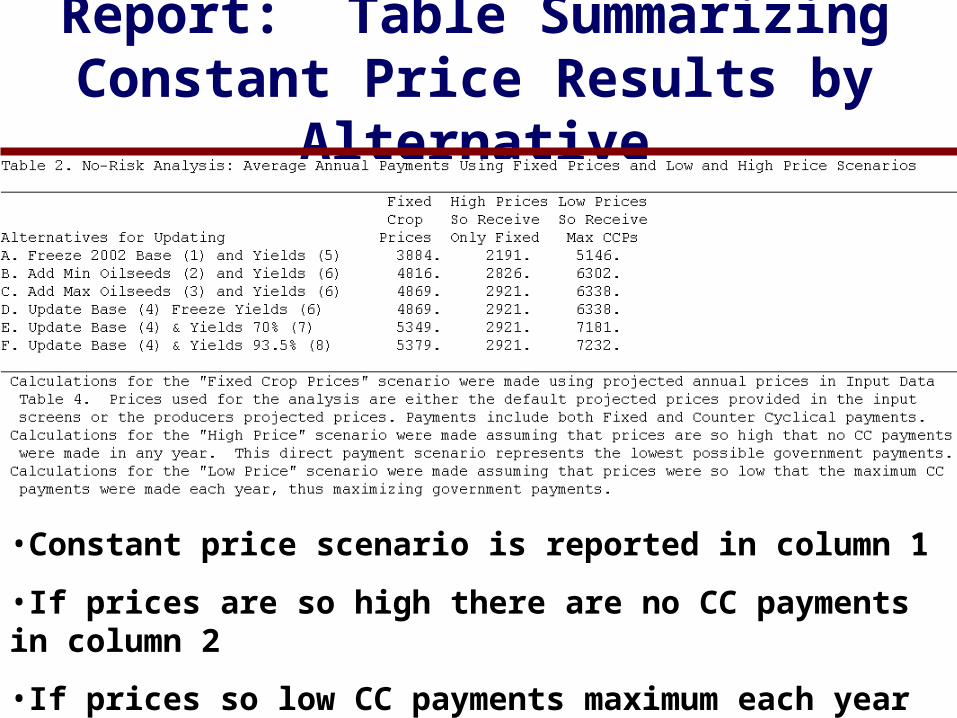
Report: Table Summarizing Constant Price Results by Alternative
•Constant price scenario is reported in column 1
•If prices are so high there are no CC payments in column 2
•If prices so low CC payments maximum each year in column 3
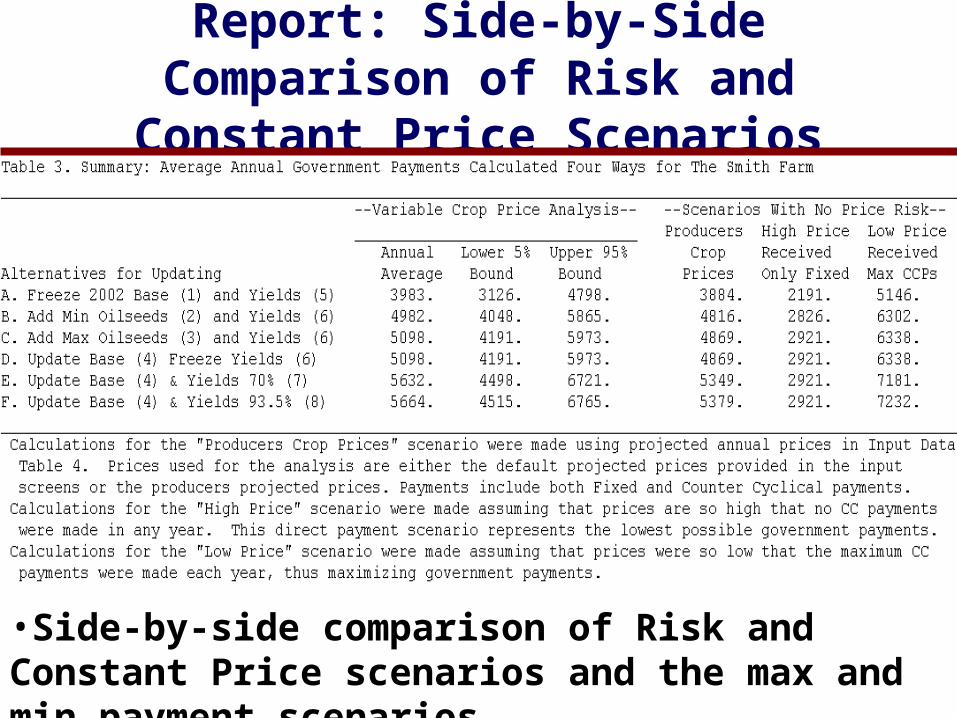
Report: Side-by-Side Comparison of Risk and Constant Price Scenarios
•Side-by-side comparison of Risk and Constant Price scenarios and the max and min payment scenarios

Report: Risk Graph of the Risky Price Analysis
•Risk averse decision makers prefer the alternative further to the right -- E and F in this case near indifferent

Report: Preparing a Printable Output
Create a printable report in pdf format that can be saved or printed immediately
Go back and change the data for this farm or modify this farm for a similar farm unit
Revising the data and re-running retains existing information for the farm’s crops
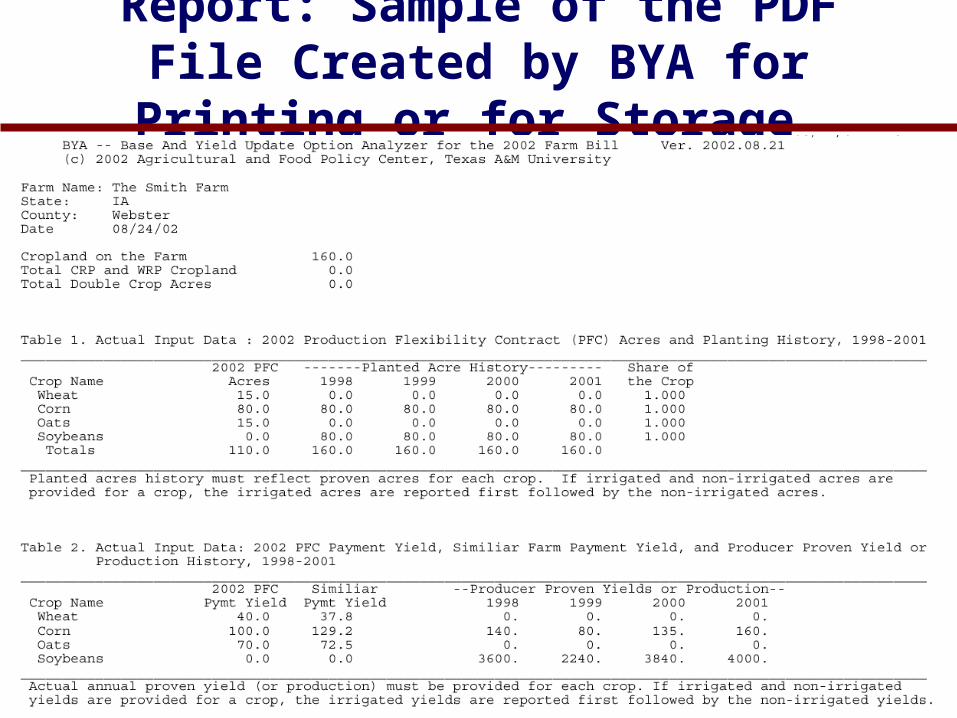
Report: Sample of the PDF File Created by BYA for Printing or for Storage
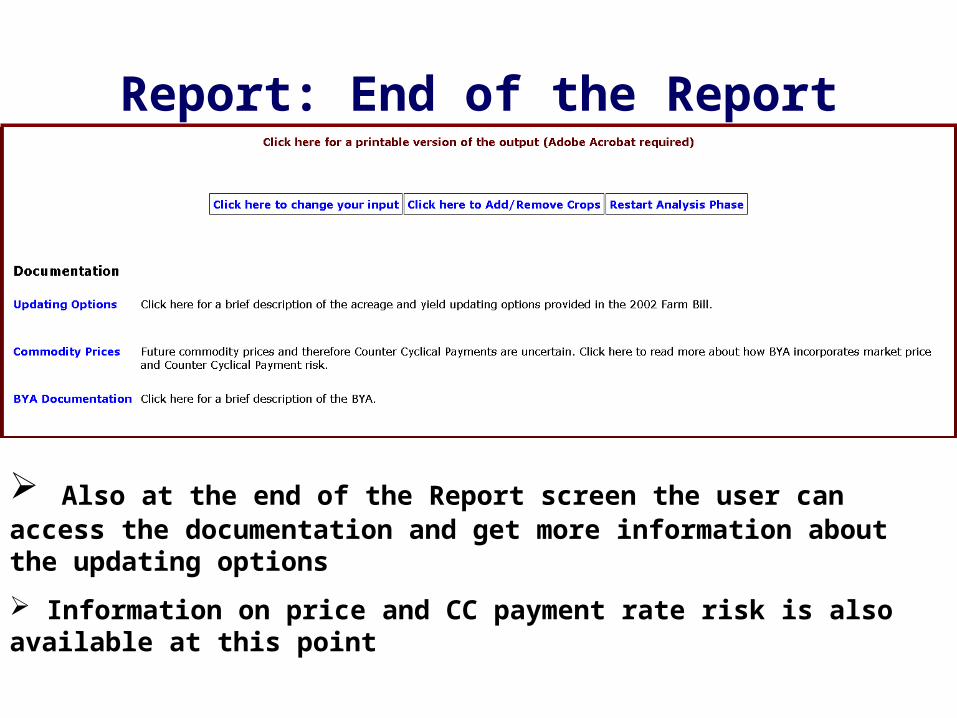
Report: End of the Report
Also at the end of the Report screen the user can access the documentation and get more information about the updating options
Information on price and CC payment rate risk is also available at this point

Demand for the BYA Decision Aid
• The AFPC BYA was first made available on our web site in mid July on a limited basis to our testers
• FSA in Washington
• Texas Extension Specialists and County Agents
• Revisions were made to improve completeness of output
• Presentation at the FSA National Training on Base and Yield Updating on July 26th
•Usage on the BYA really took off after that
•We get dozens of calls and e-mails a day from all across the US asking for CD version, and explanations

BYA Usage Since August 1st
•Number of Unique Visitors 16,601
•Number of Visits 25,924
•Page Transferred 312,776
•Hits on BYA Page 528,995
•All stats as of 12 p.m. Sunday August 25, 2002
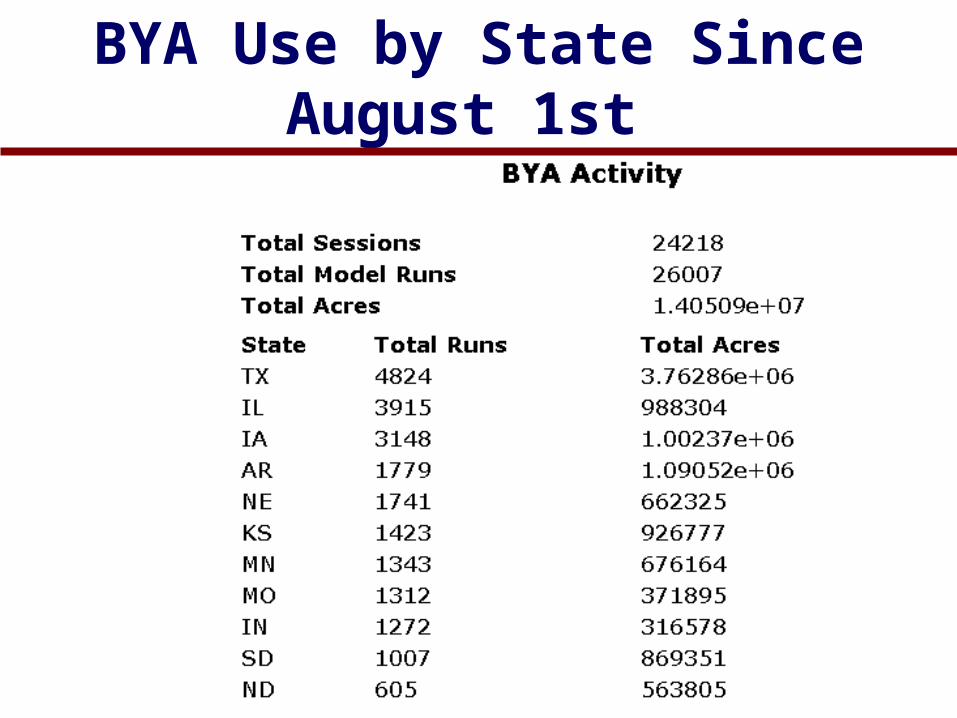
BYA Use by State Since August 1st

BYA Use by Crop Since August 1st, Irrigated (I) and Non-Irrigated (N)

Daily BYA Use Since August 1st
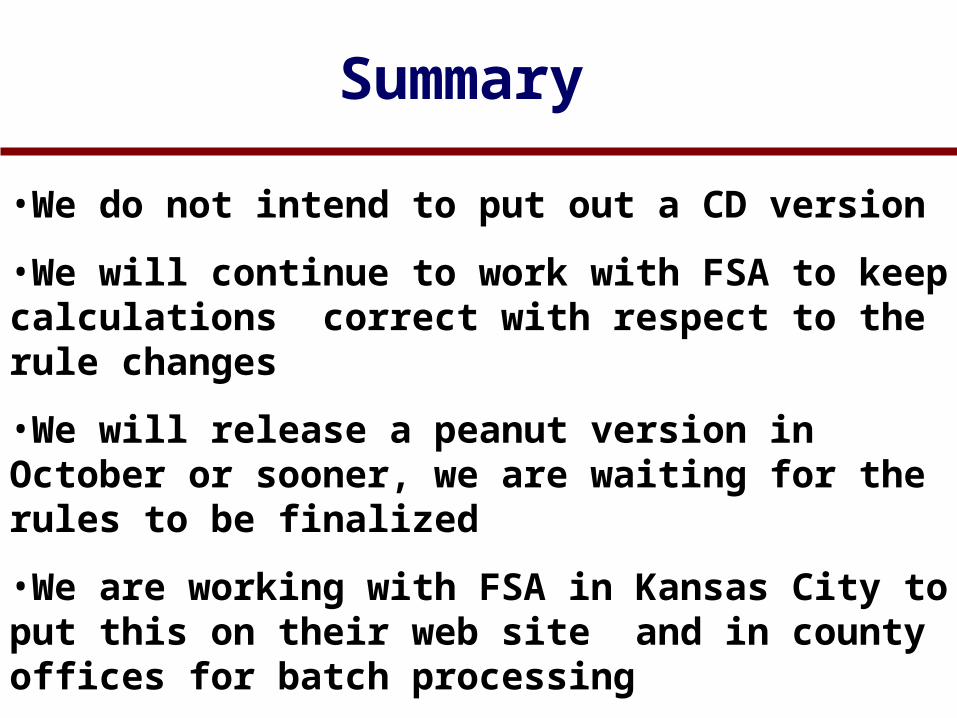
Summary
•We do not intend to put out a CD version
•We will continue to work with FSA to keep calculations correct with respect to the rule changes
•We will release a peanut version in October or sooner, we are waiting for the rules to be finalized
•We are working with FSA in Kansas City to put this on their web site and in county offices for batch processing


