Introduction to the analysis and reporting features ... • Introduction to the analysis and...
52
Topics • Introduction to the analysis and reporting features • Measuring and benchmarking seasonality • Comparing the guest mix of destinations • Market volume and growth analysis (‚Portfolio A.‘) • Shopping barometer (ECM) • Webanalytics • Analysis of tourism intensity • Visitors to attractions and sites • MyTourMIS • Travel Distance Estimator • Outlook (possible developments for the next years) • MICE database • Summary and feedback
-
Upload
truongkhanh -
Category
Documents
-
view
226 -
download
6
Transcript of Introduction to the analysis and reporting features ... • Introduction to the analysis and...

Topics
• Introduction to the analysis and reporting features
• Measuring and benchmarking seasonality
• Comparing the guest mix of destinations
• Market volume and growth analysis (‚Portfolio A.‘)
• Shopping barometer (ECM)
• Webanalytics
• Analysis of tourism intensity
• Visitors to attractions and sites
• MyTourMIS
• Travel Distance Estimator
• Outlook (possible developments for the next years)
• MICE database
• Summary and feedback

Introduction to the analysis and
reporting features

Measuring and comparing seasonality in
European destinations

Causes of seasonality in tourism
• Seasonality: The systematic intra-year variation in
visitation caused by exogenous factors:
• Natural (e.g. climate)
• Institutional
• caused by the markets of origin (e.g. timing of school holidays)
• caused by the destination (e.g. regular mega-events)
• Calendar effects (e.g. Easter)
• Problems:
• The need to optimize the use of tourism infrastructure such
as roads to accommodate high flows during certain periods
• Seasonality increases the risk of high unemployment
during the low seasons
• In dryer regions the issue of water scarcity is of particular
concern

Actions to overcome seasonality
• Product
• Development of new offers, events, packages, ...
• Pricing
• Providing discounts for periods with less demand
• Promotion
• When and how intensively we will promote the tourism
products
• Placement
• Which geographic region/market should be promoted
• Which segments (e.g. young adults, families, business
people)

0%
2%
4%
6%
8%
10%
12%
14%
16%
I II III IV V VI VII VIII IX X XI XII
0%
2%
4%
6%
8%
10%
12%
I II III IV V VI VII VIII IX X XI XII
LÜBECK
Gini=0.207
MADRID
Gini=0.088
Gini coefficient

I II III IV V VI VII VIII IX X XI XII I IIIII IV V VI VIIVIIIIXX XIXII
100%
sorted normalized and cumulated
GINI = 0.25
The Gini coefficient
Measure of statistical dispersion. The Gini can be approximated
with trapezoids:
12
1
11
* 1i
iiii YYXXG

0,0
2,0
4,0
6,0
8,0
10,0
12,0
1 2 3 4 5 6 7 8 9 10 11 12
Zurich (Gini = .087)
in %
0,0
5,0
10,0
15,0
20,0
25,0
1 2 3 4 5 6 7 8 9 10 11 12
Dubrovnik (Gini = .511)
in %
0,0
1,0
2,0
3,0
4,0
5,0
6,0
7,0
8,0
9,0
1 2 3 4 5 6 7 8 9 10 11 12
Gini = 0
in %
0,0
20,0
40,0
60,0
80,0
100,0
120,0
1 2 3 4 5 6 7 8 9 10 11 12
Gini = 1
in %
Measuring seasonality (Gini coefficient)

Similarity of seasonal patterns

Comparing the guest mix of destinations

Diversity of guest mix
Assumption: A high diversity of guest mix spreads the risk of negative economic developments in single markets
Austria (Gini = 0.792)Hungary (Gini = 0.525)

Barcelona
France
Germany
Italy
Japan
US
UK
Domestic
Other
Vienna
France
Germany
Italy
Japan
USUK
Domestic
Other
Budapest
FranceGermany
Italy
Japan
US
UK
Domestic
Other
Analyzing the similarity of guest mix
Assumption: The comparison (variance) of guest mix shares defines a destination’s exposure to interregional competition
V = 0.193V = 0.364

Market volume and market growth analysis
& Portfolio visualization

A common problem in marketing ...
To find the right (optimal) mix of target markets
Implications for strategic (long-term) decisions and
for the budget allocation process (e.g. where
should we invest?)
2 basic questions:
• What makes a market attractive?
• What are our chances in attracting visitors from a
particular market?

Portfolio analysis
What makes a market attractive?
1. Size/volume
2. Growth/Prospects
• Market volume and market growth indicators
• # of travellers/arrivals/bednights or spendings
• either measured at the country of origin (source market) or
in all destinations (e.g. total bednights in all destinations)
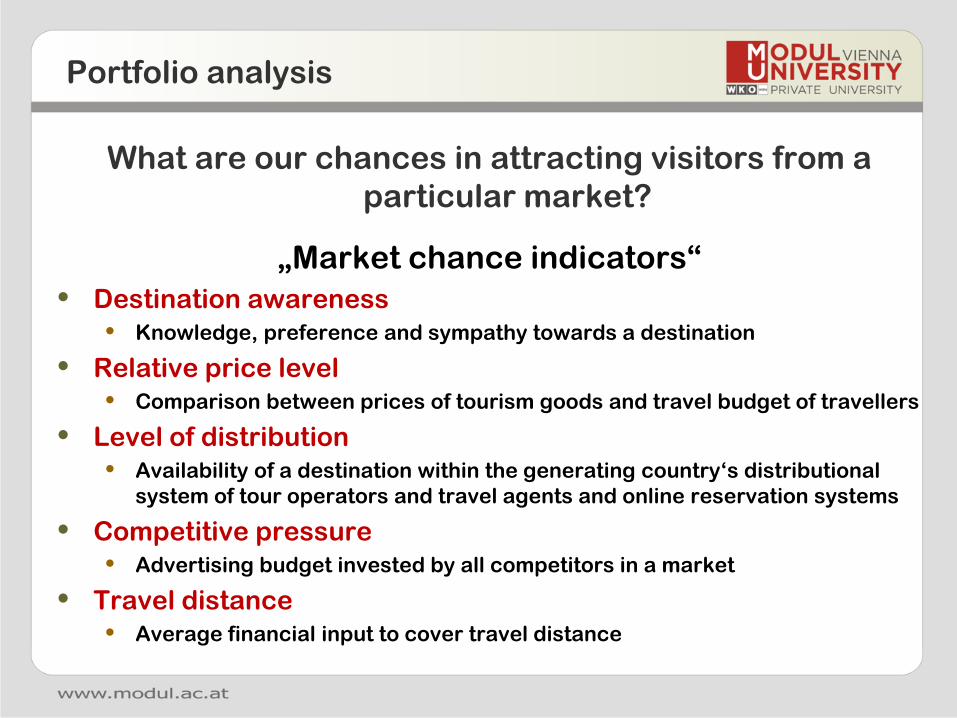
Portfolio analysis
What are our chances in attracting visitors from a
particular market?
„Market chance indicators“
• Destination awareness
• Knowledge, preference and sympathy towards a destination
• Relative price level
• Comparison between prices of tourism goods and travel budget of travellers
• Level of distribution
• Availability of a destination within the generating country‘s distributional
system of tour operators and travel agents and online reservation systems
• Competitive pressure
• Advertising budget invested by all competitors in a market
• Travel distance
• Average financial input to cover travel distance

Portfolio analysis
Strategic Key Performance Indicators
• Market volume is an absolute number describing the volume of
tourism generated by a particular market
• Market growth rate is the percentage change of the market
volume (in %)
• Absolute market share is the ratio when comparing the
performance of a particular destination with the overall
market volume (in %)
• Relative market share is the ratio of the market share of a
particular destination compared to the market share of the
leading destination (or the second best destination if the
destination of evaluation is the market leader)
• Guest mix share (= importance value) is the proportion of
bednights sold of a particular market compared to the overall
number of bednights recorded in a tourism destination (in %)

Market growth-share matrix
Visualization

Portfolio analysis
Examples on TourMIS„Market volumes and shares of selected destinations“
• Regional Level• Portfolio analysis of Austrian provinces
• City Level• Portfolio analysis of cities in Europe
• National Level• Portfolio analysis of countries in Europe
The ECM Shopping Barometer

The ECM shopping barometer
• Objective
• To shed light on the costs differential existing across cities
in Europe, collecting publicly available data for a specific
set of items among those commonly consumed by visitors.
• The final goal of the project is to rank destinations
according to their costliness and to gain a deeper insight
on visitors’ perception of their experience in a city.
• Problems
• What prices to collect?
• Comparability of services and a prices
• Sample size
• 2012: 10; 2013: 38; 2014: 32; 2015: 16; 2016: 8

The ECM shopping barometer
• Guidelines (Manual) – Prices should:
• reflect the final price (i.e. include VAT and eventual tourists
taxes)
• refer to the regular price for individual’s consumption
(discounts for groups or special categories are not
considered)
• are collected from businesses in the city center
• are collected in the local currency (converted into Euro)
• are collected at a specific time of the year, but refer to a
one-year period
• The shopping bundle covers the main service
categories required by tourists at the destination
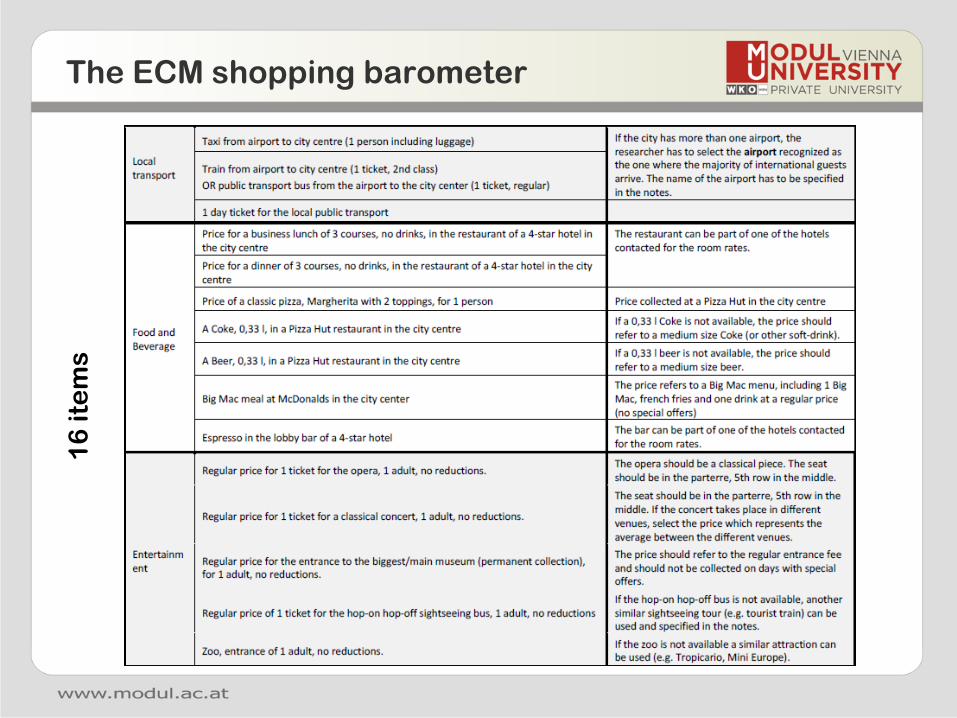
The ECM shopping barometer1
6 i
tem
s

Webanalytics
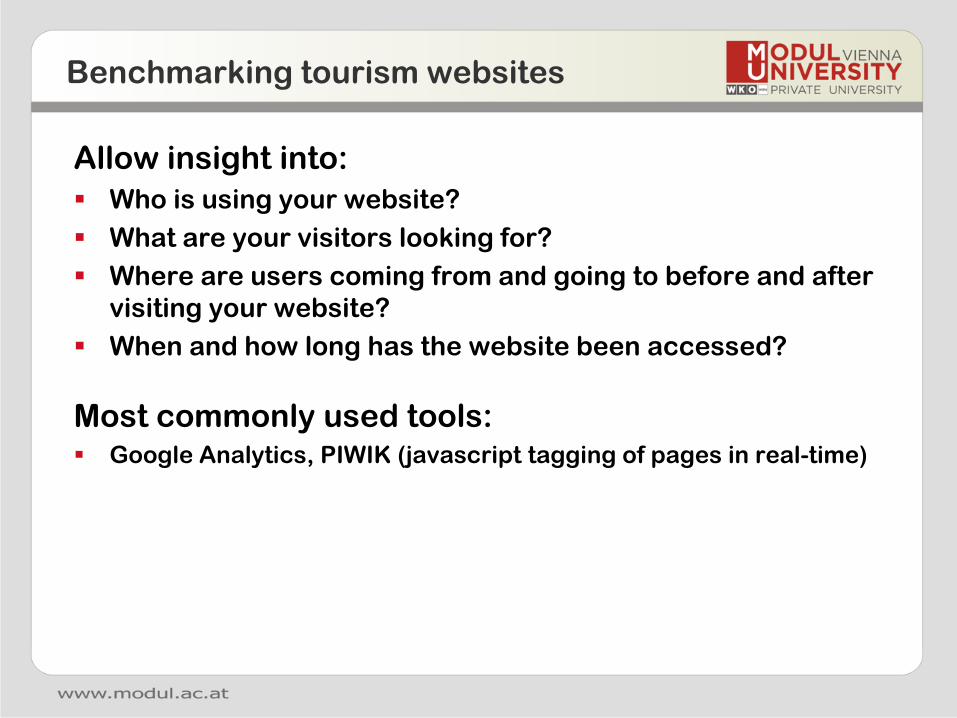
Allow insight into:
Who is using your website?
What are your visitors looking for?
Where are users coming from and going to before and after
visiting your website?
When and how long has the website been accessed?
Most commonly used tools: Google Analytics, PIWIK (javascript tagging of pages in real-time)
Benchmarking tourism websites

<!-- Piwik -->
< script type="text/javascript">
var pkBaseURL = (("https:" == document.location.protocol) ? "https://survey.modul.ac.at/piwikAnalytics/" :
"http://survey.modul.ac.at/piwikAnalytics/");
document.write(unescape("%3Cscript src='" + pkBaseURL + "piwik.js' type='text/javascript'%3E%3C/script%3E"));
< /script><script type="text/javascript">
try {
var piwikTracker = Piwik.getTracker(pkBaseURL + "piwik.php", 3);
piwikTracker.trackPageView();
piwikTracker.enableLinkTracking();
} catch( err ) {}
< /script><noscript><p><img src="http://survey.modul.ac.at/piwikAnalytics/piwik.php?idsite=3" style="border:0" alt="" /></p></noscript>
< !-- End Piwik Tracking Code -->
Example: Vienna tourism website

Number of unique, new, and returning visitors (identified by
IP address)
Number of visits
If a visitor comes to a website for the first time, or if he
visits a page more than 30 minutes after his last page
view, this will be recorded as a new visit
A unique visitor can make multiple visits per day
In the first visit, the visitor is a new visitor
From the second visit (the same day or later), a unique
visitor is a returning visitor
Duration of visit
Number of page views
Web metrics (examples)

Count of visitors by country
“Geolocation” = looking up the visitor’s IP address in one
of the online available GeoIP databases (e.g. MaxMind) or
guessing a visitor’s location based on the language
(browser setting) he/she uses (99.8% accurate at the
country and 90% accurate at the region level)
Number and site that external visitors came from (referrer)
Search engines used to find site
Keywords used in the search engines
Browsers and devices used by visitors
Web metrics: Attributes (examples)

Visit location
city, continent, country, region
Visit
browser, browser version, device type, operating system,
resolution, visitor type (new, returning)
Referrers
Keyword, name, type (direct, search, website, campaign)
Metrics
Days since first/last visit, number of visits/actions/events,
visit duration
Possibilities for segmentation (examples)

Goal: Transforming data into valuable information
Benchmarking
Visits Visitors
(Unique)
Non
bouncing
visitors
Standard
visitors
Highly
engaged
visitors
Time on site Important
for KPIs
> 10 sec > 90 sec > 150 sec
Pages/visit > 1 > 2 > 3Se
gm
en
tati
on
Defining a valuable visitor

Key Performance Indicators
• Number of visits
• Number of actions (page views, outlinks, downloads)
• Average time spent on site (in seconds)
• Number of visits that bounced (viewed one page)
• Maximum number of actions in a visit
• Ratio of visitors leaving the website after landing on the page
• Number of actions per visit

TourMIS Example

TourMIS - Example

Comparison of US Arrivals in Salzburg and
number of visits on www.salzburg.info
Pearson's correlations for various time lags.
The higher the number of enquiries, the
higher are the number of arrivals (for positive
values).
TourMIS - Example

11 Destinations on Webanalytics
1. Bruges
2. Brussels
3. Ghent
4. Helsinki
5. Maribor
6. Salzburg
7. Tallinn
8. Turku
9. Vilnius
10.Czech R.
11.Poland

• www.vienna.info
• 6.6mn visits p.y. (~ 550,000 p.m., 20,000 p.d.)
• Vienna: ~ 3.6GB per year, 300MB per month
• Current project
• 11 destinations: ~70GB of Piwik data
• vs. TourMIS database: 0.7GB
• Vision: 120 destinations, 10 years
• = 3,840GB (+32 GB p.m. or +384 GB p.y.)
• 100mn+ page views per month (~ 200 destinations), Piwik
will start reaching php memory limits or other Mysql or
hardware limitations
Big data!

Costs
• TourMIS webanalytics setup fee (snippet
installation, database initialization, user rights)
EUR 400,- (one time)
• Bandwidth contribution per year: EUR 400,-
(starting on 1.1., initial months until 1.1. = free)

Joining the project
• Karl WöberMODUL University Vienna
Department of Tourism and Service Management
(p) +43-1-3203555-300
karl.woeber[AT]modul.ac.at
• Irem Önder MODUL University Vienna
Department of Tourism and Service Management
(p) +43-1-3203555-420
irem.onder[AT]modul.ac.at
If you are interested, get in touch with us!

Visitors to attractions and sites

MyTourMIS

69 user are currently using MyTourMIS (210 queries)

MyTourMIS: MyQuery
Setting: ‚flexible period‘
Today: September 11, 2014 Some day in the future: e.g. November 2014
Table 1: Juli 2014 September 2014
Table 2: 2001 – 2012 2001 – 2012
Table 3: January 2011 – August 2014 January 2011 – October 2014

Travel Distance Estimator

Extending the travel distance estimator
Objectives:
1. Analysis of market chances
2. Monitoring and comparing different forms of means of
transportation (airline dependency)
3. Estimating CO2 emissions

Additional tables and new features
• New tables
• Capacities: Showing longitudinal data
• Attractions: Add number of opening days to tables that
show visitor numbers
• Attractions: Add additional input table for entering visitor
numbers for multiple years (for one attraction)

Drafting a new table
Example: Average length of stay
Proposing new tables
Submit to [email protected]

Meeting Statistics: Sample 2015
Sample 2015: 61 cities
Sample trend analysis 2014-2015: 45 cities
48
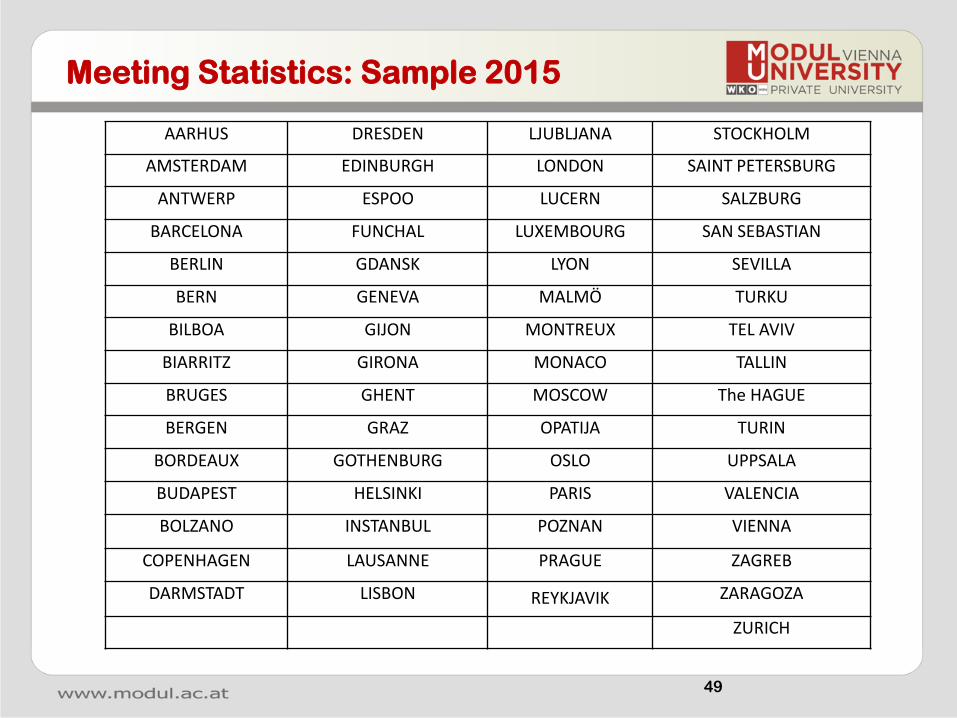
MRS 2015 | Final Sample AARHUS DRESDEN LJUBLJANA STOCKHOLM
AMSTERDAM EDINBURGH LONDON SAINT PETERSBURG
ANTWERP ESPOO LUCERN SALZBURG
BARCELONA FUNCHAL LUXEMBOURG SAN SEBASTIAN
BERLIN GDANSK LYON SEVILLA
BERN GENEVA MALMÖ TURKU
BILBOA GIJON MONTREUX TEL AVIV
BIARRITZ GIRONA MONACO TALLIN
BRUGES GHENT MOSCOW The HAGUE
BERGEN GRAZ OPATIJA TURIN
BORDEAUX GOTHENBURG OSLO UPPSALA
BUDAPEST HELSINKI PARIS VALENCIA
BOLZANO INSTANBUL POZNAN VIENNA
COPENHAGEN LAUSANNE PRAGUE ZAGREB
DARMSTADT LISBON REYKJAVIK ZARAGOZA
ZURICH
49
Meeting Statistics: Sample 2015
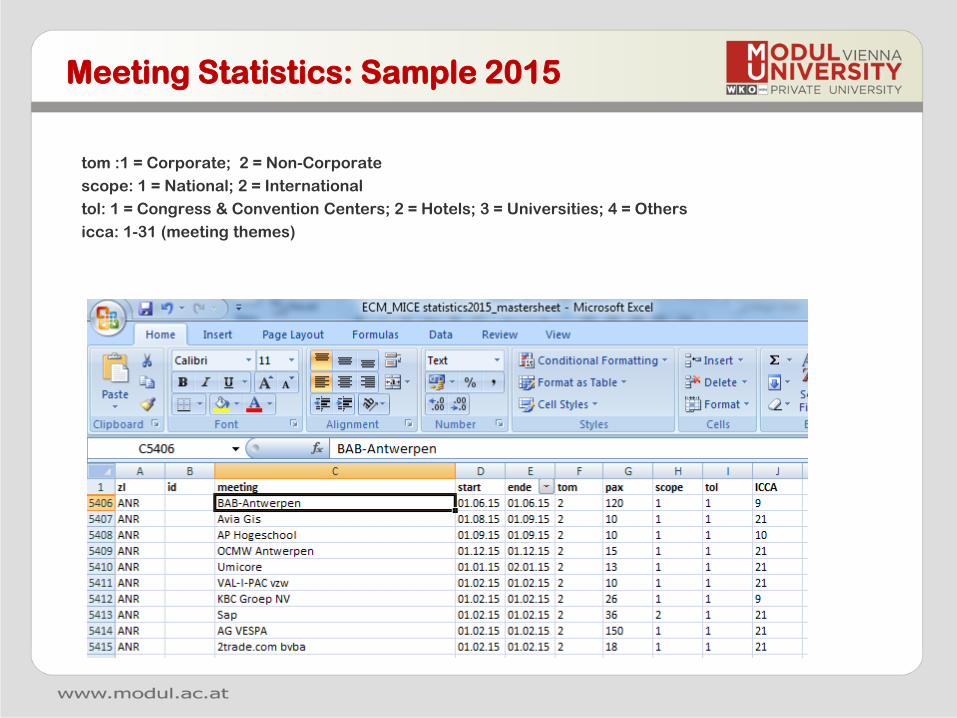
tom :1 = Corporate; 2 = Non-Corporate
scope: 1 = National; 2 = International
tol: 1 = Congress & Convention Centers; 2 = Hotels; 3 = Universities; 4 = Others
icca: 1-31 (meeting themes)
Meeting Statistics: Sample 2015

Collecting data on daily expenditures
Objectives:
1. Monitoring and comparing the daily expenditures of all
and individual markets (domestic plus 59 foreign markets)
for destinations who perform visitor surveys
Focus: Average daily expenditures of tourists (excluding
transportation to the destination) broken down by• accommodation
• food and beverages
• entertainment
• shopping
• local transportation
• other
2. Developing an econometric model which allows to
estimate the direct economic contribution of tourism even
if there is no or only incomplete data available for a
particular destination

Summary and Feedback


![Seasonality PM Group[1]](https://static.fdocuments.in/doc/165x107/577cd3441a28ab9e789703ef/seasonality-pm-group1.jpg)