
Introduction to Security Phil Smithwiki.computing.hct.ac.uk/_media/computing/hnd/l4-u... · Various...
59
Transcript of Introduction to Security Phil Smithwiki.computing.hct.ac.uk/_media/computing/hnd/l4-u... · Various...

Introduction to Security
Phil Smith

Learning outcomesBy the end of this unit you will be able to:
LO1. Use an appropriate design tool to design a relational database system for asubstantial problem.
LO2. Develop a fully functional relational database system, based on an existingsystem design.
LO3. Test the system against user and system requirements.
LO4. Produce technical and user documentation.
More detail on the wiki.
Recap and setting the sceneBefore we get to Normalisation we need to learn some more definitions re-visit the roots of relational database theory.
Approaches We have already looked at the top down approach to
database design achieved using an Entity Relational Model (ERM) along with an Entity relational Diagram (ERD).
We have also looked at how we derive a primary key for every entity. (Recap – candidate keys, composite keys)
We also looked at relationships between entities.

Relationship types There are three main kinds of relationships, and it is
important to determine both directions of the relationship when modelling the relationships between entities:
1-to-1: Both sides of the relationship have a degree of one and only one. (1-to-1 relationships are rare.)
So there is a an enterprise rule here which states
1-to-M: One of the sides has a degree of one or many and the other side has a degree of one and only one.
M-to-N: Both sides of the relationship are one or many relationships.
Yes it really is M-to-N
Relationship types/degree An important property of any relationship is its
degree. This is the enterprise rule which applies to the relationship.
Suppose we have a relationship between a lecturer and a course (We can name this relationship “Teaches”), a lecturer is identified by a lecturername and course identified by courseno.
We already know there are three possible kinds of relationship (degree,) each corresponding to different pairs of enterprise rules for the relationship.
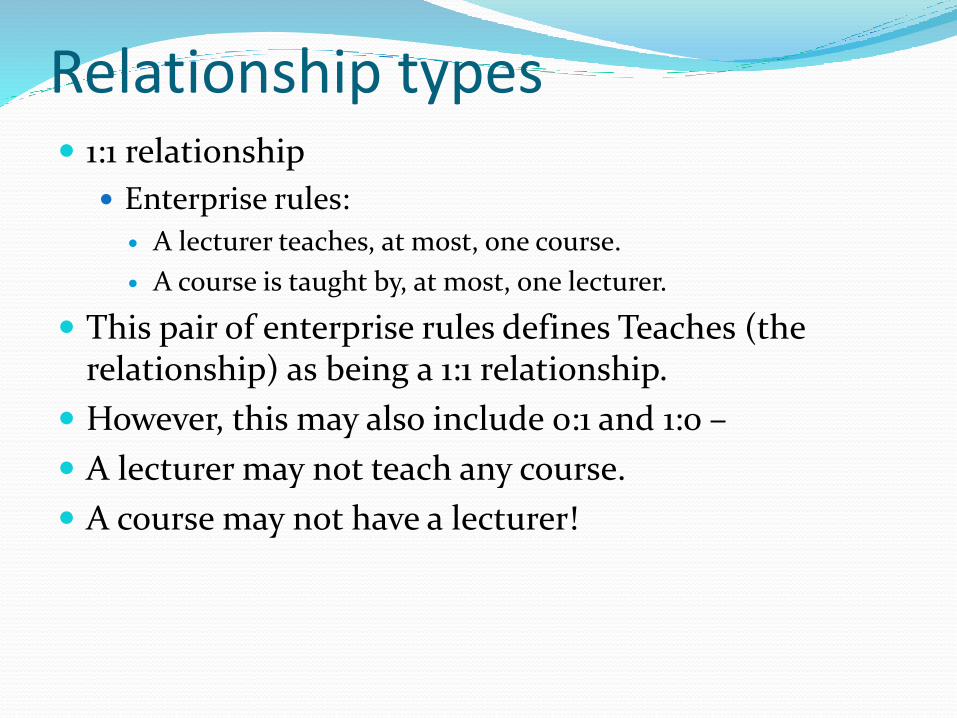
Relationship types 1:1 relationship
Enterprise rules:
A lecturer teaches, at most, one course.
A course is taught by, at most, one lecturer.
This pair of enterprise rules defines Teaches (the relationship) as being a 1:1 relationship.
However, this may also include 0:1 and 1:0 –
A lecturer may not teach any course.
A course may not have a lecturer!
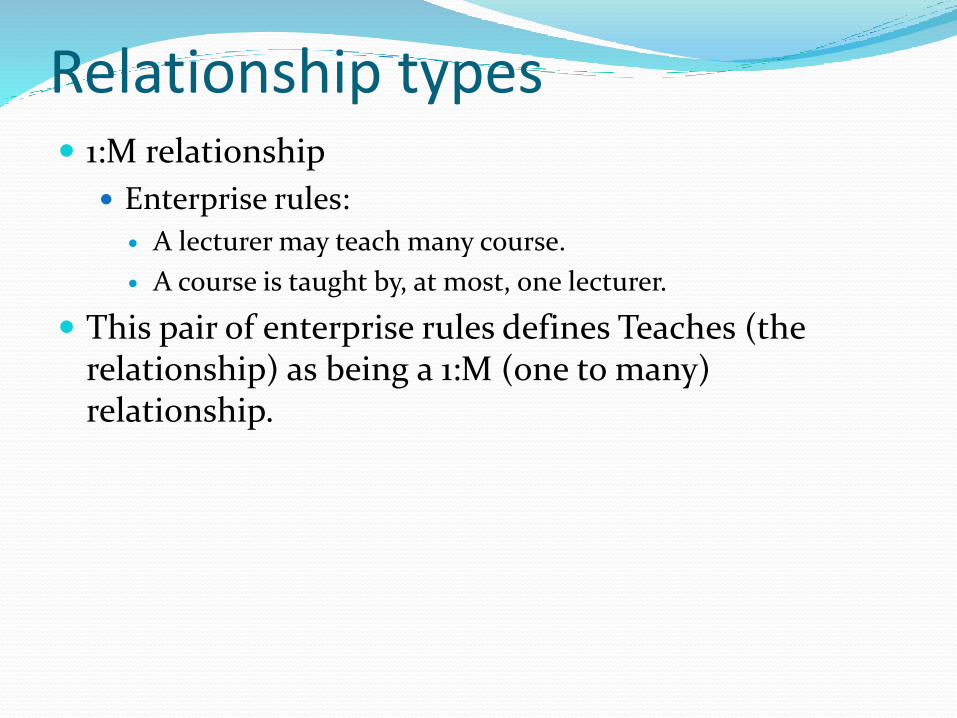
Relationship types 1:M relationship
Enterprise rules:
A lecturer may teach many course.
A course is taught by, at most, one lecturer.
This pair of enterprise rules defines Teaches (the relationship) as being a 1:M (one to many) relationship.

Relationship types M:N relationship
Enterprise rules:
A lecturer may teach many courses.
A course may be taught by many lecturer.
This pair of enterprise rules defines Teaches (the relationship) as being a M:N (many to many) relationship.
We already know that this will need to be corrected.

Relationship types There are three main kinds of relationships.
Can you describe a fourth?
Self-Referencing Relationships: A Special Case.
Self-referencing relationships are a special case of a normal table relationship. The only difference is that in this case, there is only one table involved and it is on both sides of the relationship
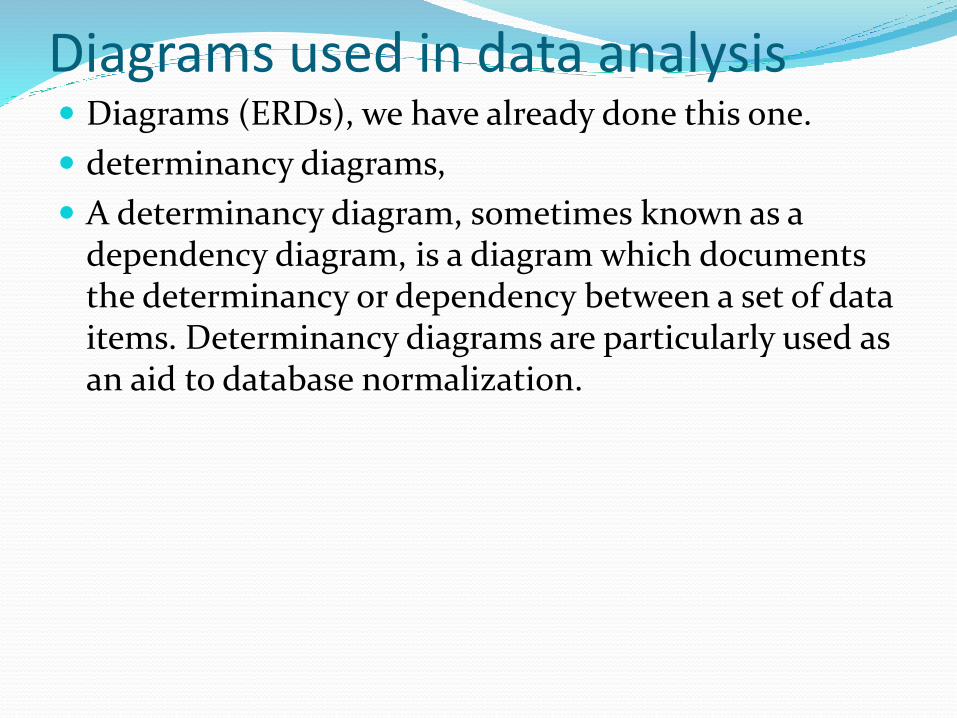
Diagrams used in data analysis Diagrams (ERDs), we have already done this one.
determinancy diagrams,
A determinancy diagram, sometimes known as a dependency diagram, is a diagram which documents the determinancy or dependency between a set of data items. Determinancy diagrams are particularly used as an aid to database normalization.

Diagrams used in data analysis
We are building up a set of tools to help us with Normalisation.
Lets have a look at a dependency diagram.

Diagrams used in data analysis Example dependency diagram.
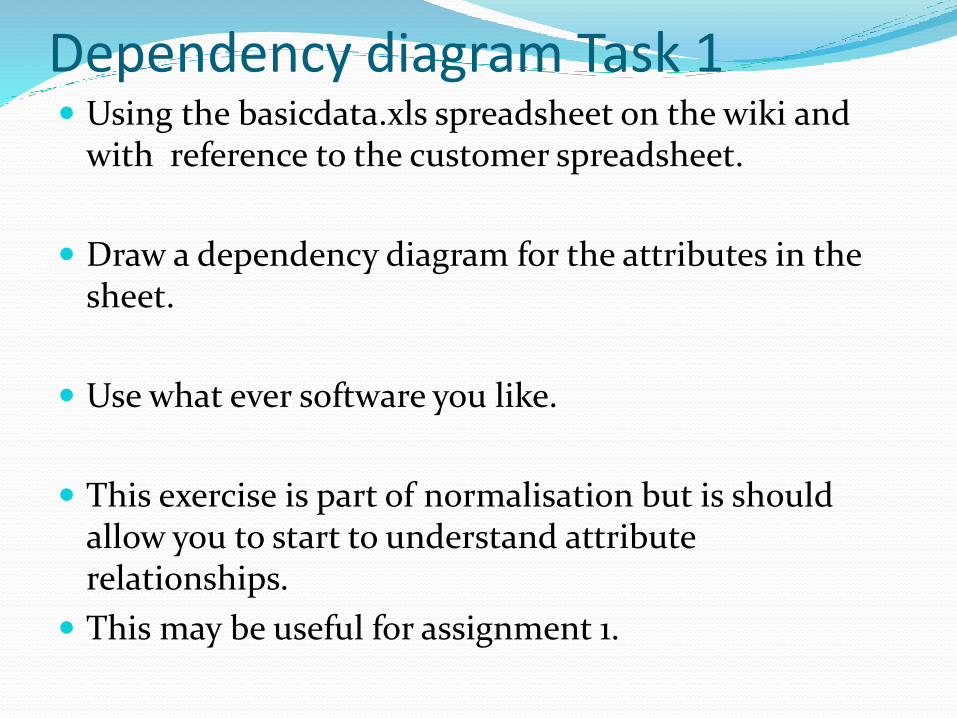
Dependency diagram Task 1 Using the basicdata.xls spreadsheet on the wiki and
with reference to the customer spreadsheet.
Draw a dependency diagram for the attributes in the sheet.
Use what ever software you like.
This exercise is part of normalisation but is should allow you to start to understand attribute relationships.
This may be useful for assignment 1.
Diagrams used in data analysis We shall be looking more at dependency diagrams
later. There is more to them that the exercise we have completed.
Another type of diagram is the data flow diagram.
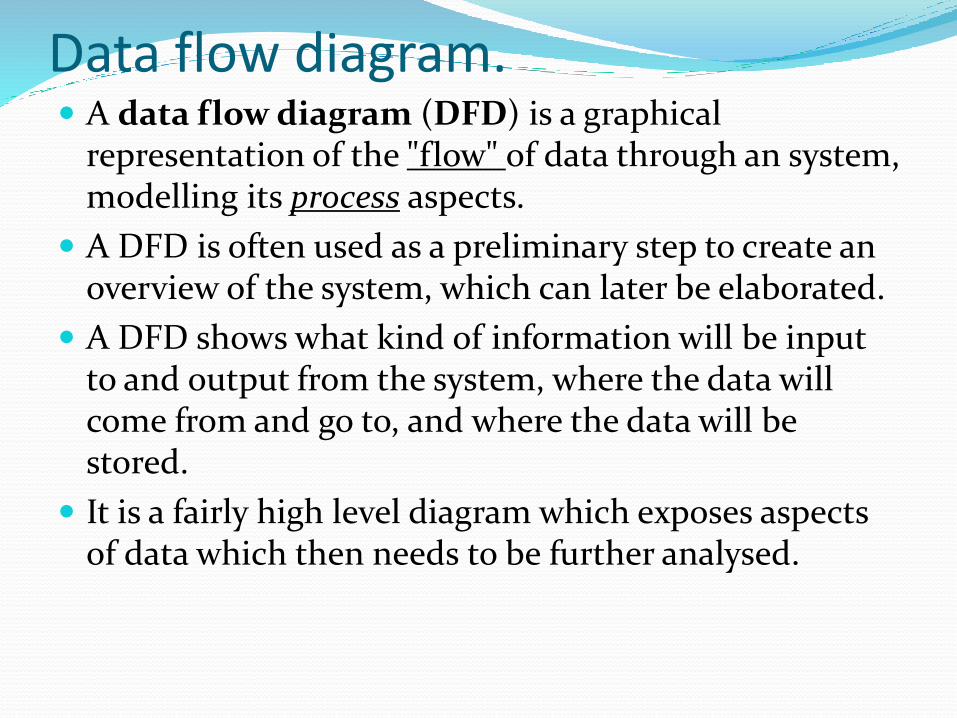
Data flow diagram. A data flow diagram (DFD) is a graphical
representation of the "flow" of data through an system, modelling its process aspects.
A DFD is often used as a preliminary step to create an overview of the system, which can later be elaborated.
A DFD shows what kind of information will be input to and output from the system, where the data will come from and go to, and where the data will be stored.
It is a fairly high level diagram which exposes aspects of data which then needs to be further analysed.

Data flow diagram. Task 2 Research data flow diagrams and then produce a data
flow diagram for an online e-commerce site as created by you in unit 14.

Database Normalization Database normalization is the process of removing
redundant data from your tables to improve storage efficiency, data integrity, and scalability.
In the relational model, methods exist for quantifying how efficient a database is. These classifications are called normal forms (or NF), and there are algorithms for converting a given database between them.
Normalization generally involves splitting existing tables into multiple ones, which must be re-joined or linked each time a query is issued.

History
Edgar F. Codd first proposed the process of normalization and what came to be known as the 1st normal form in his paper A Relational Model of Data for Large Shared Data Banks Codd stated:
“There is, in fact, a very simple elimination procedure which we shall call normalization. Through decomposition nonsimple domains are replaced by ‘domains whose elements are atomic (nondecomposable) values.’”
Normal Form Edgar F. Codd originally established three normal
forms: 1NF, 2NF and 3NF. There are now others that are generally accepted, but 3NF is widely considered to be sufficient for most applications. Most tables when reaching 3NF are also in BCNF (Boyce-Codd Normal Form).
Codd had 13 rules, numbered 0 to 12.

Normalisation is the process which allows you to winnow out redundant data within your database.
This involves restructuring the tables to successively meeting higher forms of Normalization.
A properly normalized database should have the following characteristics
Scalar values in each fields
Absence of redundancy.
Minimal use of null values.
Minimal loss of information.
Definition
Normalisation is a bottom up process.
Definition

Database Tables and Normalization
Normalization
Process for evaluating and correcting table structures to minimize data redundancies
Reduces data anomalies
Works through a series of stages called normal forms:
First normal form (1NF)
Second normal form (2NF)
Third normal form (3NF)
24

Database Tables and Normalization (continued) Normalization (continued)
2NF is better than 1NF; 3NF is better than 2NF
For most business database design purposes, 3NF is as high as we need to go in normalization process
Highest level of normalization is not always most desirable
25

Levels of normalization based on the amount of
redundancy in the database.
Various levels of normalization are: First Normal Form (1NF)
Second Normal Form (2NF)
Third Normal Form (3NF)
Boyce-Codd Normal Form (BCNF)
Fourth Normal Form (4NF)
Fifth Normal Form (5NF)
Domain Key Normal Form (DKNF)
Levels of Normalization
Red
un
dan
cy
Nu
mb
er o
f T
able
s
Most databases should be 3NF or BCNF in order to avoid the database anomalies.
Co
mp
lexi
ty

Levels of Normalization
Each higher level is a subset of the lower level
DKNF
1NF
2NF
3NF
4NF
5NF

data redundancy in databases have a field repeated in two or more tables.
However not all duplicated data is redundant. Foreign key fields will probably have duplicated values.
Redundancy

Dealing with redundant data means that a company has to spend a lot of time, money and energy. Since, as mentioned, these redundant data are unknown to the organization, they can crawl into the system and give the system unwanted and unexpected results such as slowing down the entire system process, giving inaccurate data output and affecting data integrity very negatively. Redundant data can also create a risk to information quality if the different databases are not updated concurrently.
Redundancy – why?

Data redundancy is costly to address as it requires additional storage, synchronization between databases, and design work to align the information represented by different presentation of the same data.
The problems associated with redundant data can be addressed by data normalization.
Normalized tables generally can contain no redundant data because each attribute only appears in one table. Also, normalized tables do not contain derived data and instead, the data contained can be computed from existing attributes which has been selected as an expression based on the said attributes.
Redundancy – why?

A worked example
Normalisation

Table 1
Title Author1 Author
2
ISBN Subject Pages Publisher
Database
System
Concepts
Abraham
Silberschatz
Henry F.
Korth
0072958863 MySQL,
Computers
1168 McGraw-Hill
Operating
System
Concepts
Abraham
Silberschatz
Henry F.
Korth
0471694665 Computers 944 McGraw-Hill
Not Atomic
Repeating groups
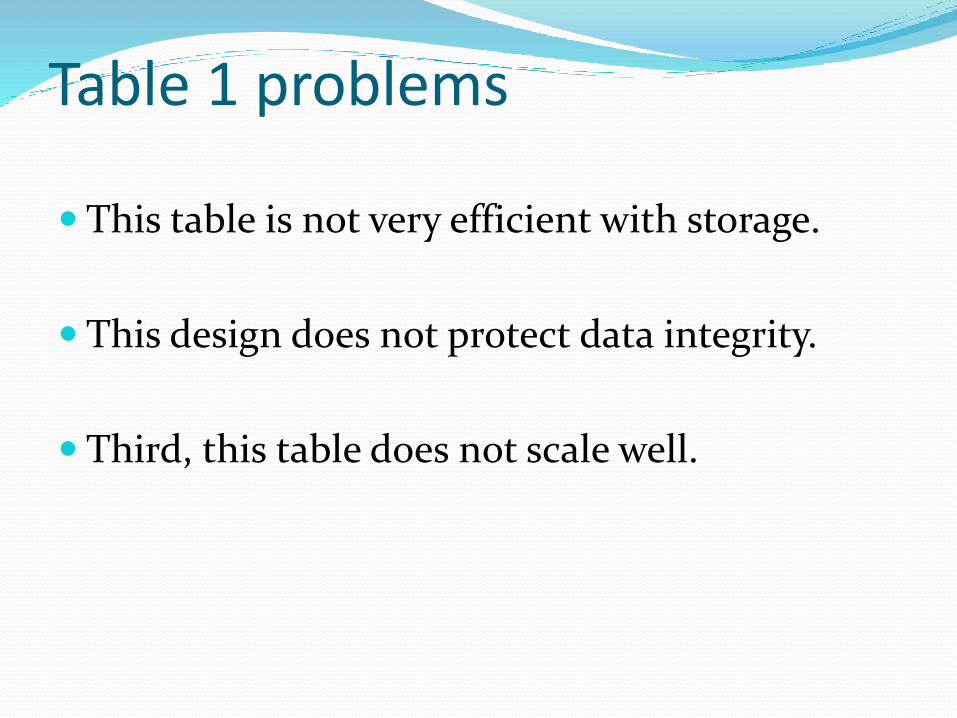
Table 1 problems
This table is not very efficient with storage.
This design does not protect data integrity.
Third, this table does not scale well.
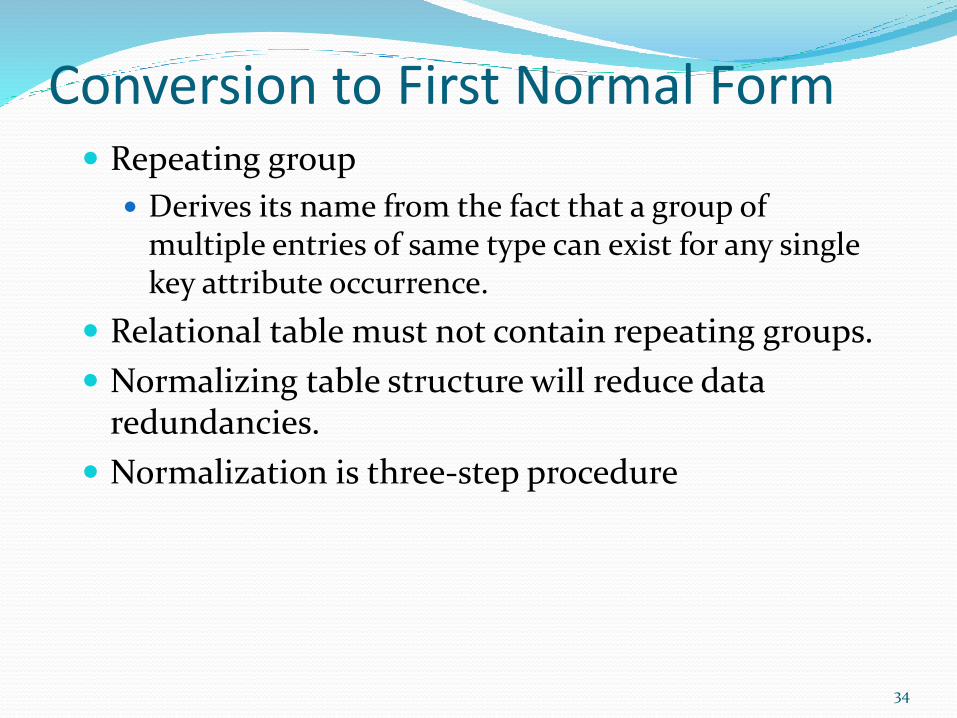
Conversion to First Normal Form Repeating group
Derives its name from the fact that a group of multiple entries of same type can exist for any single key attribute occurrence.
Relational table must not contain repeating groups.
Normalizing table structure will reduce data redundancies.
Normalization is three-step procedure
34

Conversion to First Normal Form (continued) Step 1: Eliminate the Repeating Groups
Present data in tabular format, where each cell has single value and there are no repeating groups
Eliminate repeating groups, eliminate nulls by making sure that each repeating group attribute contains an appropriate data value
Make data atomic in the table.
This means only 1 type of data in each attribute.
Care needed here to ensure that atomicity is only applied when needed or logical to do so.
35
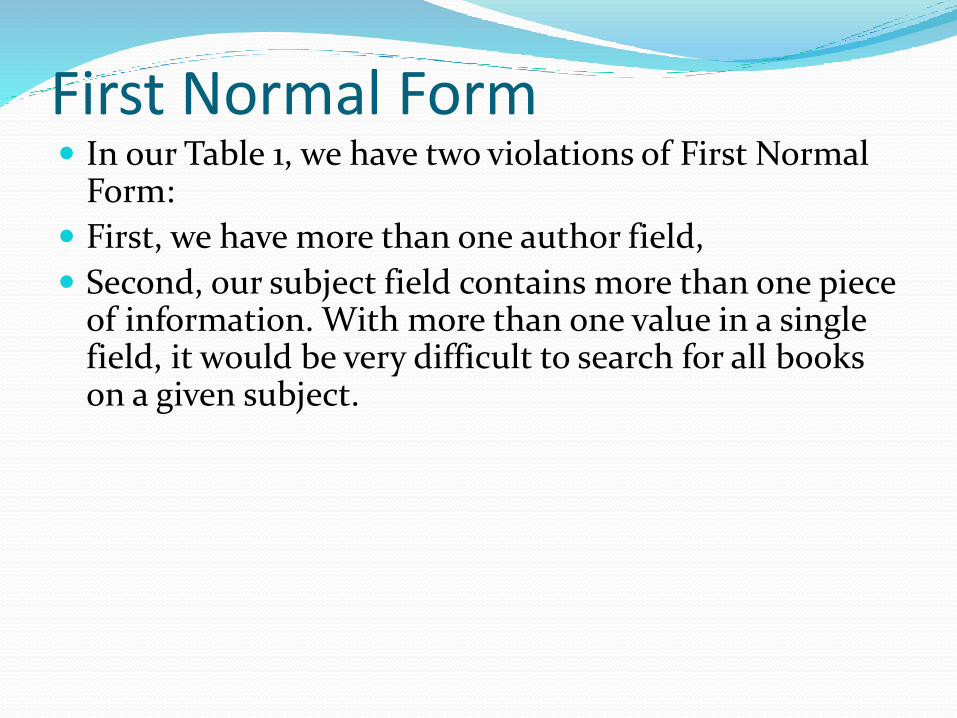
First Normal Form In our Table 1, we have two violations of First Normal
Form:
First, we have more than one author field,
Second, our subject field contains more than one piece of information. With more than one value in a single field, it would be very difficult to search for all books on a given subject.
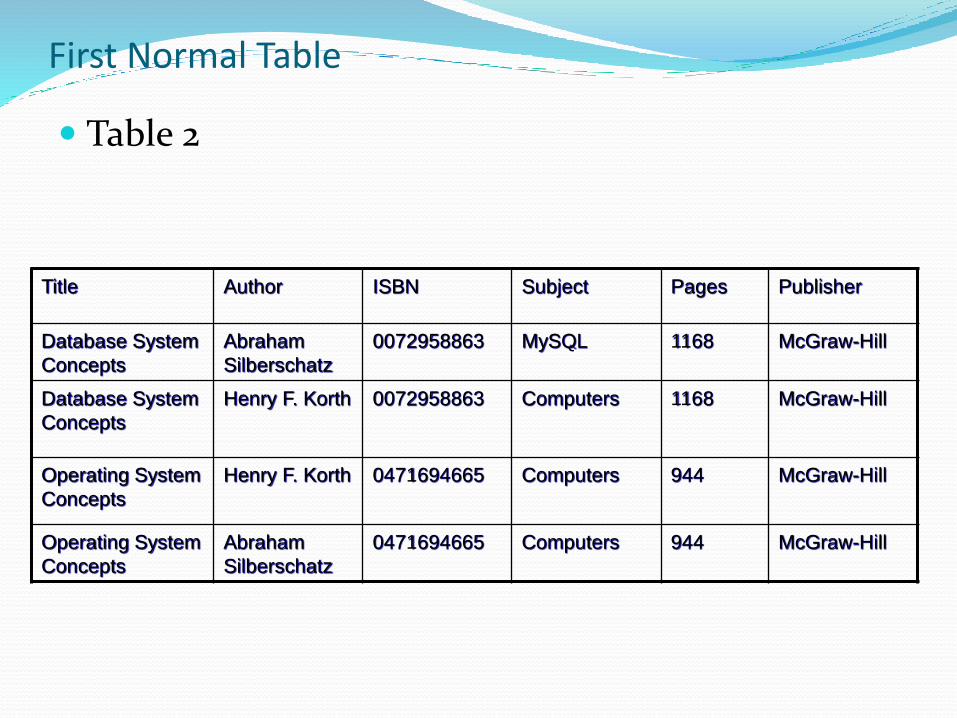
First Normal Table
Table 2
Title Author ISBN Subject Pages Publisher
Database System
Concepts
Abraham
Silberschatz
0072958863 MySQL 1168 McGraw-Hill
Database System
Concepts
Henry F. Korth 0072958863 Computers 1168 McGraw-Hill
Operating System
Concepts
Henry F. Korth 0471694665 Computers 944 McGraw-Hill
Operating System
Concepts
Abraham
Silberschatz
0471694665 Computers 944 McGraw-Hill

Second Normal Table We now have two rows for a single book.
But we would be violating the Second Normal Form…
A better solution to our problem would be to separate the data into separate tables- an Author table and a Subject table to store our information, removing that information from the Book table:

Conversion to First Normal Form (continued) Step 2: Identify the Primary Key
Primary key must uniquely identify attribute value
New key must be composed
39

Subject_ID Subject
1 MySQL
2 Computers
Author_ID Last Name First Name
1 Silberschatz Abraham
2 Korth Henry
ISBN Title Pages Publisher
0072958863 Database System
Concepts
1168 McGraw-Hill
0471694665 Operating System
Concepts
944 McGraw-Hill
Subject Table
Author Table
Book Table

Each table has a primary key, used for joining tables together when querying the data. A primary key value must be unique with in the table (no two books can have the same ISBN number), and a primary key is also an index, which speeds up data retrieval based on the primary key.
Now to define relationships between the tables

Conversion to First Normal Form (continued) Step 3: Identify All Dependencies
Dependencies can be depicted with help of a diagram
Dependency diagram: Depicts all dependencies found within given table structure
Helpful in getting bird’s-eye view of all relationships among table’s attributes
Makes it less likely that will overlook an important dependency
42

Conversion to First Normal Form (continued) Step 3: Identify All Dependencies
43
Title Author1 Author
2
ISBN Subject Pages Publisher
Database
System
Concepts
Abraham
Silberschatz
Henry F.
Korth
0072958863 MySQL,
Computers
1168 McGraw-Hill
Operating
System
Concepts
Abraham
Silberschatz
Henry F.
Korth
0471694665 Computers 944 McGraw-Hill
Functional dependency

Relationships
ISBN Author_ID
0072958863 1
0072958863 2
0471694665 1
0471694665 2
ISBN Subject_ID
0072958863 1
0072958863 2
0471694665 2
Book_Author Table
Book_Subject Table

Second Normal Form As the First Normal Form deals with redundancy
of data across a horizontal row, Second Normal Form (or 2NF) deals with redundancy of data in vertical columns.
As stated earlier, the normal forms are progressive, so to achieve Second Normal Form, the tables must already be in First Normal Form.
The Book Table will be used for the 2NF example

2NF Table
Publisher_ID Publisher Name
1 McGraw-Hill
ISBN Title Pages Publisher_ID
0072958863 Database System
Concepts
1168 1
0471694665 Operating System
Concepts
944 1
Publisher Table
Book Table

2NF
Here we have a one-to-many relationship between the book table and the publisher. A book has only one publisher, and a publisher will publish many books. When we have a one-to-many relationship, we place a foreign key in the Book Table, pointing to the primary key of the Publisher Table.
The other requirement for Second Normal Form is that you cannot have any data in a table with a composite key that does not relate to all portions of the composite key.
Third Normal Form Third normal form (3NF) requires that there are no
functional dependencies of non-key attributes on something other than a candidate key.
A table is in 3NF if all of the non-primary key attributes are mutually independent
There should not be transitive dependencies

What is a transitive dependency? In Database Management System, a transitive
dependency is a functional dependency which holds by virtue of transitivity. A transitive dependency can occur only in a relation that has three or more attributes. Let A, B, and C designate three distinct attributes (or distinct collections of attributes) in the relation.
If C depends on B and B depends on A then C has transitive dependency i.e. it is functionally dependent on B (and not A the primary key).
Think of a river with the left bank being A and the right bank being C. In the middle is a stepping stone (B). To get from C to A we would need B.

Boyce-Codd Normal Form BCNF requires that the table is 3NF and only
determinants are the candidate keys.
The Boyce-Codd Normal Form (BCNF) Every determinant in table is a candidate key
Has same characteristics as primary key, but for some reason, not chosen to be primary key
When table contains only one candidate key, the 3NF and the BCNF are equivalent
BCNF can be violated only when table contains more than one candidate key
51

The Boyce-Codd Normal Form (BCNF) (continued) Most designers consider the BCNF as special case of
3NF
Table is in 3NF when it is in 2NF and there are no transitive dependencies
Table can be in 3NF and fails to meet BCNF No partial dependencies, nor does it contain transitive
dependencies
A nonkey attribute is the determinant of a key attribute
52

Fourth Normal Form (4NF)
Table is in fourth normal form (4NF) when both of the following are true:
It is in 3NF
Has no multiple sets of multivalued dependencies
4NF is largely academic if tables conform to following two rules:
All attributes must be dependent on primary key, but independent of each other
No row contains two or more multivalued facts about an entity
53

Denormalization Creation of normalized relations is important database
design goal
Processing requirements should also be a goal
If tables decomposed to conform to normalization requirements:
Number of database tables expands
54

Denormalization (continued) Joining the larger number of tables takes additional
input/output (I/O) operations and processing logic, thereby reducing system speed
Conflicts between design efficiency, information requirements, and processing speed are often resolved through compromises that may include denormalization
55

Denormalization (continued) Unnormalized tables in production database tend to
suffer from these defects:
Data updates are less efficient because programs that read and update tables must deal with larger tables
Indexing is more cumbersome
Unnormalized tables yield no simple strategies for creating virtual tables known as views
56

Denormalization (continued) Use denormalization cautiously
Understand why—under some circumstances—unnormalized tables are better choice
57

What have we learnt today?
Data analysis and design diagrams.
Data flow diagrams.
Dependency diagrams.
Relationship degrees and Enterprise rules.
Normalisation to 4NF.
Denormalisation.
exercise
Using the BasicData spreadsheet.
Use the bottom up process on the customer data up to third normal form.
This will form part of assignment 1.


![Applied Databases - School of Informatics | The … Second Normal Form (2NF) [Codd,1971] A table is in 2NF, if it is in 1NF every non-prime attribute depends on the whole of every](https://static.fdocuments.in/doc/165x107/5aa77e8d7f8b9a294b8c2849/applied-databases-school-of-informatics-the-second-normal-form-2nf-codd1971.jpg)


