Introduction to SAS/GRAPH Softwaresupport.sas.com/publishing/pubcat/chaps/58932.pdfTwo-Dimensional...
22
3 CHAPTER 1 Introduction to SAS/GRAPH Software Overview 4 Generating Graphs 4 Charts 4 Block charts 4 Horizontal bar charts 5 Vertical bar charts 5 Pie charts, 3-D Pie charts, and Donut charts 6 Star charts 6 Two-Dimensional Plots 6 Two-dimensional scatter plots 7 Simple line plots 7 Regression plots 7 High-low plots 8 Bubble plots 8 Three-Dimensional Plots 9 Surface plots 9 Scatter plots 9 Contour plots 10 Maps 11 Block maps 11 Choropleth maps 11 Prism maps 11 Surface maps 12 Creating Text Slide and Presentation Graphics 12 Text Slides 13 Combining Output into One Slide 13 Enhancing Graphics Output (graphs and text slides) 14 SAS/GRAPH Statements 14 The Annotate Facility 14 Creating Custom Graphics 15 The DATA Step Graphics Interface 15 Graph-N-Go 15 About this Book 16 Audience 16 Prerequisites 16 Conventions Used in This Book 16 Syntax Conventions 17 Conventions for Examples and Output 19 Information You Should Know 20 Support Personnel 20 Sample Programs 21
Transcript of Introduction to SAS/GRAPH Softwaresupport.sas.com/publishing/pubcat/chaps/58932.pdfTwo-Dimensional...

3
C H A P T E R
1Introduction to SAS/GRAPHSoftware
Overview 4
Generating Graphs 4Charts 4
Block charts 4
Horizontal bar charts 5Vertical bar charts 5
Pie charts, 3-D Pie charts, and Donut charts 6
Star charts 6Two-Dimensional Plots 6
Two-dimensional scatter plots 7Simple line plots 7
Regression plots 7
High-low plots 8Bubble plots 8
Three-Dimensional Plots 9
Surface plots 9Scatter plots 9
Contour plots 10Maps 11
Block maps 11
Choropleth maps 11Prism maps 11
Surface maps 12
Creating Text Slide and Presentation Graphics 12Text Slides 13
Combining Output into One Slide 13Enhancing Graphics Output (graphs and text slides) 14
SAS/GRAPH Statements 14
The Annotate Facility 14Creating Custom Graphics 15
The DATA Step Graphics Interface 15
Graph-N-Go 15About this Book 16
Audience 16Prerequisites 16
Conventions Used in This Book 16
Syntax Conventions 17Conventions for Examples and Output 19
Information You Should Know 20
Support Personnel 20Sample Programs 21
4 Overview Chapter 1
Map Data Sets 23
Annotate Macros Data Set 23
OverviewSAS/GRAPH software is the data visualization and presentation (graphics)
component of the SAS System. As such, SAS/GRAPH software:� organizes the presentation of your data and visually represents the relationship
between data values as two- and three-dimensional graphs, including charts, plots,and maps.
� enhances the appearance of your output by allowing you to select text fonts, colors,patterns, and line styles, and control the size and position of many graphicselements.
� creates presentation graphics. SAS/GRAPH software can create text slides, displayseveral graphs at one time, combine graphs and text in one display, and createautomated presentations.
� generates a variety of graphics output that you can display on your screen or in aWeb browser, store in catalogs, review, or send to a hardcopy graphics outputdevice such as a laser printer, plotter, or slide camera.
� provides utility procedures and statements to manage the output.
This chapter describes the graphs that are produced by SAS/GRAPH software andexplains some of the parts and features of SAS/GRAPH programs.
Generating GraphsSAS/GRAPH software produces many kinds of charts, plots, and maps in both two-
and three-dimensional versions. In addition to helping you understand the variety ofgraphs that are available to you, these descriptions will also help you choose the correcttype of graph for your data and point you to the appropriate chapter.
ChartsSAS/GRAPH software uses the GCHART procedure to produce charts that
graphically represent the value of a statistic for one or more variables in a SAS dataset. See Chapter 29, “The GCHART Procedure,” on page 773 for a complete description.
Block chartsBlock charts use three-dimensional blocks to graphically represent values of
statistics. Block charts are useful for emphasizing relative magnitudes and differencesamong data values.
Introduction to SAS/GRAPH Software Charts 5
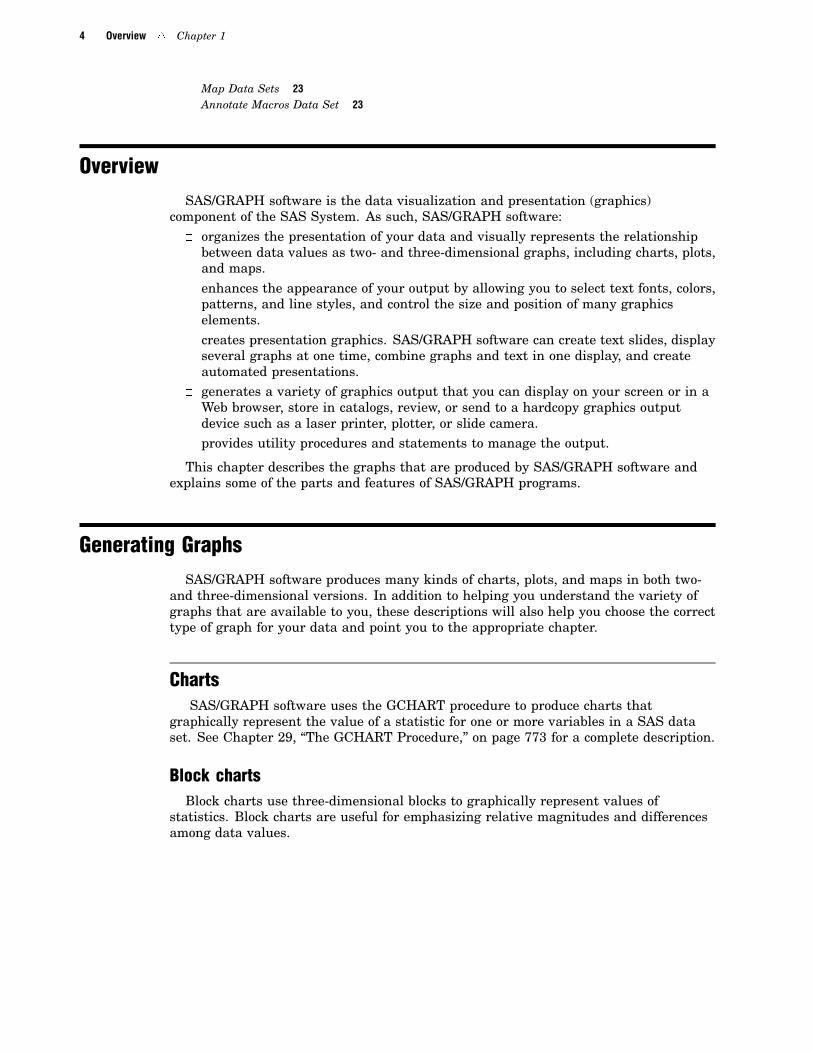
Horizontal bar chartsHorizontal bar charts use horizontal bars to represent statistics based on the values
of one or more variables. Horizontal bar charts can generate a table of chart statisticsand are useful for displaying exact magnitudes and emphasizing differences.
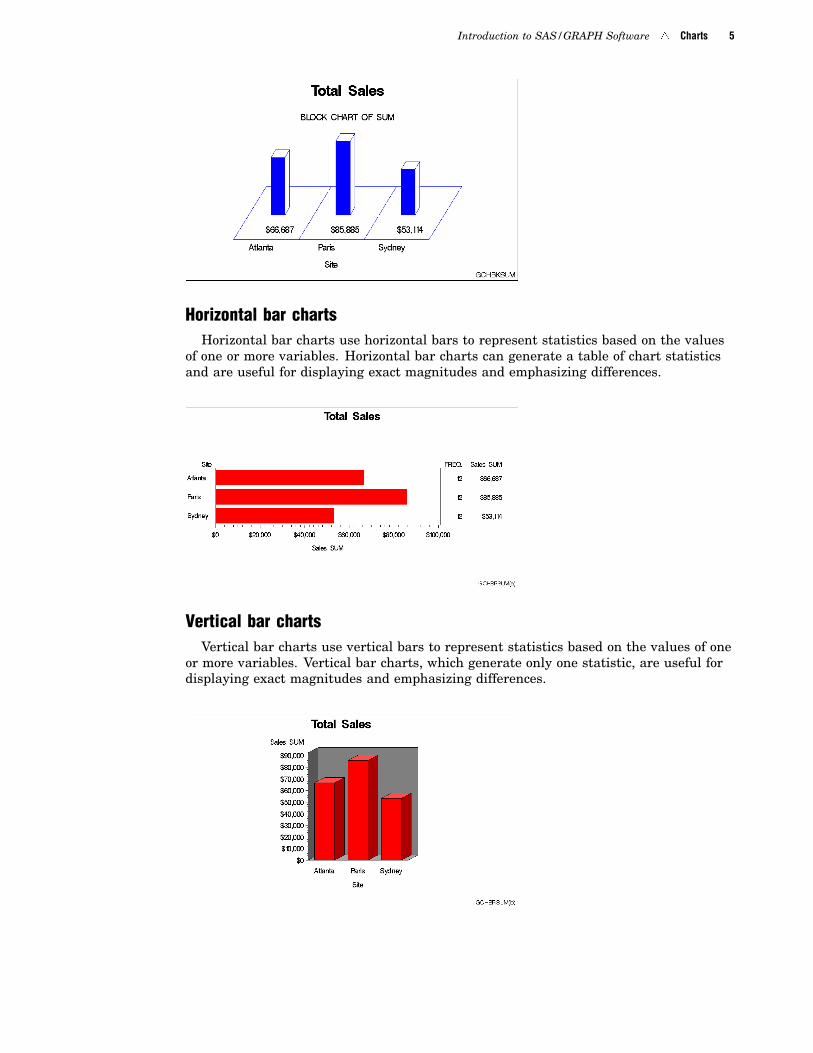
Vertical bar chartsVertical bar charts use vertical bars to represent statistics based on the values of one
or more variables. Vertical bar charts, which generate only one statistic, are useful fordisplaying exact magnitudes and emphasizing differences.

6 Two-Dimensional Plots Chapter 1
Pie charts, 3-D Pie charts, and Donut chartsPie charts, 3-D Pie charts, and Donut charts use the angle of pie slices to graphically
represent the value of a statistic for a data range. Pie charts are useful for examininghow the values of a variable contribute to the whole and for comparing the values ofseveral variables.
Star chartsStar charts use the length of spines to graphically represent the value of a statistic
for a data range. Star charts are useful for analyzing where data are out of balance.
Two-Dimensional PlotsSAS/GRAPH software uses the GPLOT procedure to produce two-dimensional
graphs that plot one or more dependent variables against an independent variablewithin a set of coordinate axes. GPLOT can display the data points as individualsymbols (as in a scatter plot), or use interpolation methods specified by the SYMBOLstatement to join the points, request spline interpolation or regression analysis, producevarious high-low plots, or generate several other types of plots.
GPLOT can also display data as bubble plots in which circles of different sizesrepresent the values of a third variable.
Plots are useful for demonstrating the relationship between two or more variables andfrequently compare trends or data values or depict movements of data values over time.
See Chapter 37, “The GPLOT Procedure,” on page 1081 for a complete description.
Introduction to SAS/GRAPH Software Two-Dimensional Plots 7
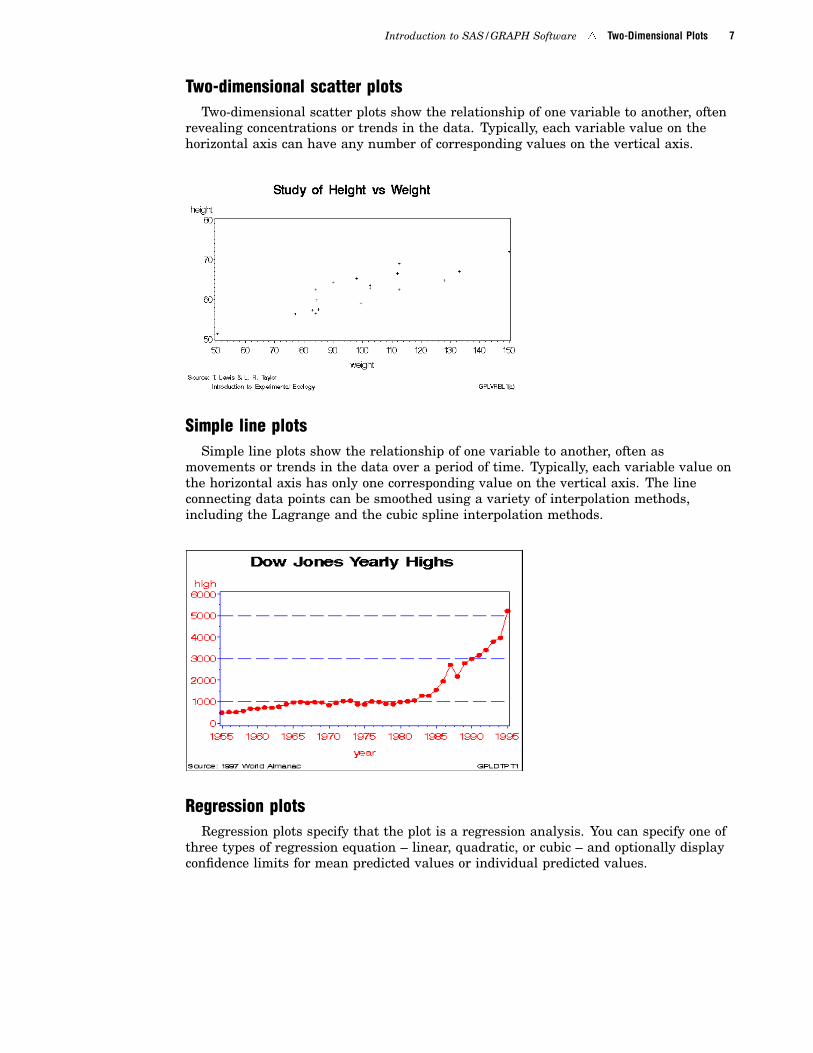
Two-dimensional scatter plotsTwo-dimensional scatter plots show the relationship of one variable to another, often
revealing concentrations or trends in the data. Typically, each variable value on thehorizontal axis can have any number of corresponding values on the vertical axis.
Simple line plotsSimple line plots show the relationship of one variable to another, often as
movements or trends in the data over a period of time. Typically, each variable value onthe horizontal axis has only one corresponding value on the vertical axis. The lineconnecting data points can be smoothed using a variety of interpolation methods,including the Lagrange and the cubic spline interpolation methods.
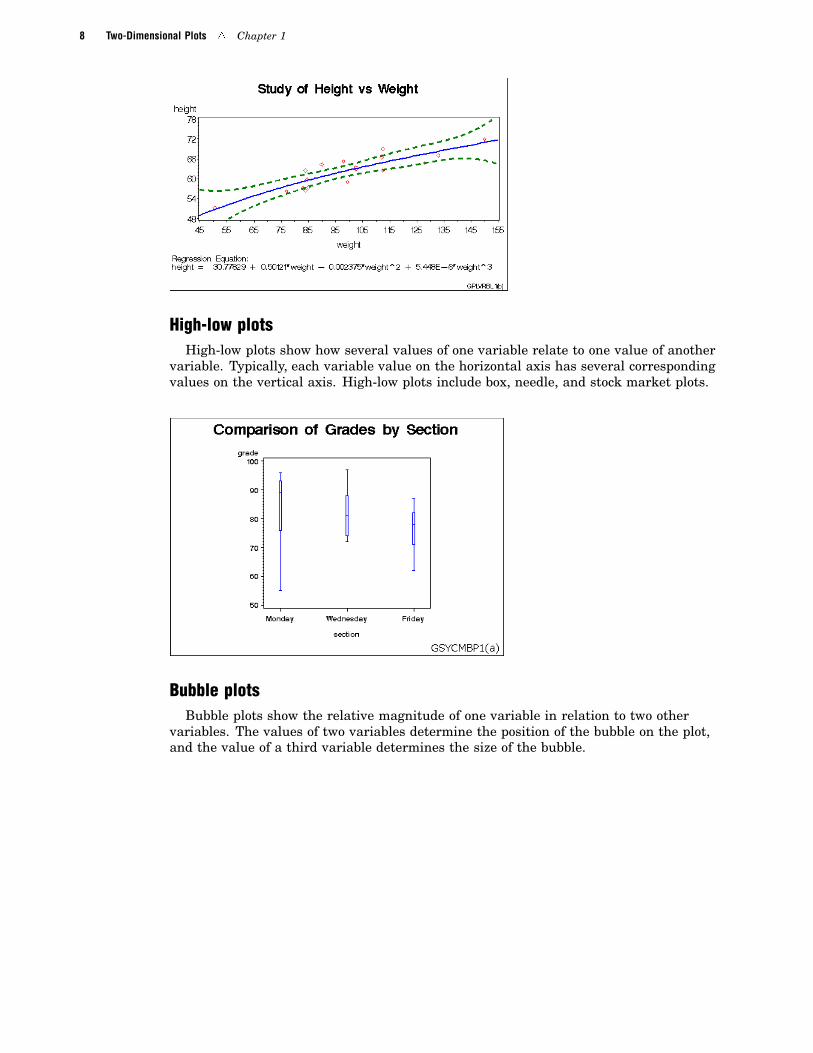
Regression plotsRegression plots specify that the plot is a regression analysis. You can specify one of
three types of regression equation – linear, quadratic, or cubic – and optionally displayconfidence limits for mean predicted values or individual predicted values.
8 Two-Dimensional Plots Chapter 1
High-low plotsHigh-low plots show how several values of one variable relate to one value of another
variable. Typically, each variable value on the horizontal axis has several correspondingvalues on the vertical axis. High-low plots include box, needle, and stock market plots.
Bubble plotsBubble plots show the relative magnitude of one variable in relation to two other
variables. The values of two variables determine the position of the bubble on the plot,and the value of a third variable determines the size of the bubble.

Introduction to SAS/GRAPH Software Three-Dimensional Plots 9
Three-Dimensional PlotsSAS/GRAPH software uses the G3D procedure to produce three-dimensional surface
and scatter plots that examine the relationship among three variables. Variable valuesare plotted on a set of three coordinate axes.
See Chapter 46, “The G3D Procedure,” on page 1295 for a complete description.
Surface plotsSurface plots are three-dimensional plots that display the relationship of three
variables as a continuous surface. Surface plots examine the three-dimensional shapeof data.
Scatter plotsScatter plots enable you to examine three-dimensional data points instead of surfaces
and to classify your data using size, color, shape, or a combination of these features.
10 Three-Dimensional Plots Chapter 1
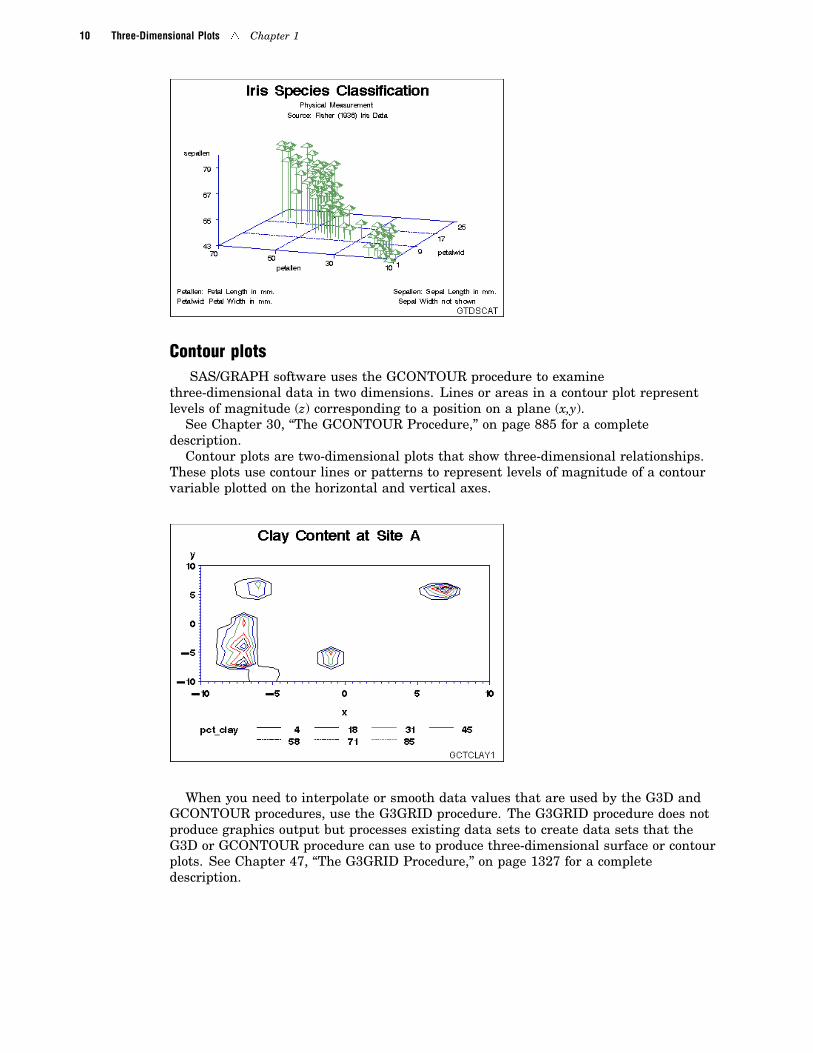
Contour plotsSAS/GRAPH software uses the GCONTOUR procedure to examine
three-dimensional data in two dimensions. Lines or areas in a contour plot representlevels of magnitude (z) corresponding to a position on a plane (x,y).
See Chapter 30, “The GCONTOUR Procedure,” on page 885 for a completedescription.
Contour plots are two-dimensional plots that show three-dimensional relationships.These plots use contour lines or patterns to represent levels of magnitude of a contourvariable plotted on the horizontal and vertical axes.
When you need to interpolate or smooth data values that are used by the G3D andGCONTOUR procedures, use the G3GRID procedure. The G3GRID procedure does notproduce graphics output but processes existing data sets to create data sets that theG3D or GCONTOUR procedure can use to produce three-dimensional surface or contourplots. See Chapter 47, “The G3GRID Procedure,” on page 1327 for a completedescription.

Introduction to SAS/GRAPH Software Maps 11
MapsSAS/GRAPH software uses the GMAP procedure to produce two- and
three-dimensional maps that can show an area or represent values of responsevariables for subareas.
SAS/GRAPH software includes data sets to produce geographic maps. In addition,you can create your own map data sets.
See Chapter 35, “The GMAP Procedure,” on page 995 for a complete description.
Block mapsBlock maps are three-dimensional maps that represent data values as blocks of
varying height rising from the middle of the map areas.
Choropleth mapsChoropleth maps are two-dimensional maps that display data values by filling map
areas with combinations of patterns and color that represent the data values.
Prism mapsPrism maps are three-dimensional maps that display data by raising the map areas
and filling them with combinations of patterns and colors.

12 Creating Text Slide and Presentation Graphics Chapter 1
Surface mapsSurface maps are three-dimensional maps that represent data values as spikes of
varying heights.
SAS/GRAPH software also provides several utility procedures for handling map data.The GPROJECT procedure lets you choose how geographic maps are projected. This
is particularly important for large areas because producing a map of any large area onthe Earth involves distorting some areas in the process of projecting the sphericalsurface of the Earth onto a flat plane. You can use the procedure to select the projectionmethod that least distorts your map.
Map areas are constructed of joined data points. Each data point represents anobservation in a SAS data set. For large maps, the amount of data can be prohibitivelyexpensive (in terms of computing resources or time to process); the GREDUCEprocedure enables you to reduce the number of points in the data set. The GREMOVEprocedure enables you to remove boundary lines within a map.
Creating Text Slide and Presentation GraphicsYou can use SAS/GRAPH software to create slide presentations of your graphs. With
SAS/GRAPH you can
� create text slides with the GSLIDE and GPRINT procedures
� combine several graphs into one output with the GREPLAY procedure
Introduction to SAS/GRAPH Software Creating Text Slide and Presentation Graphics 13
� automatically or manually replay your graphs and text slides with the GREPLAYprocedure.
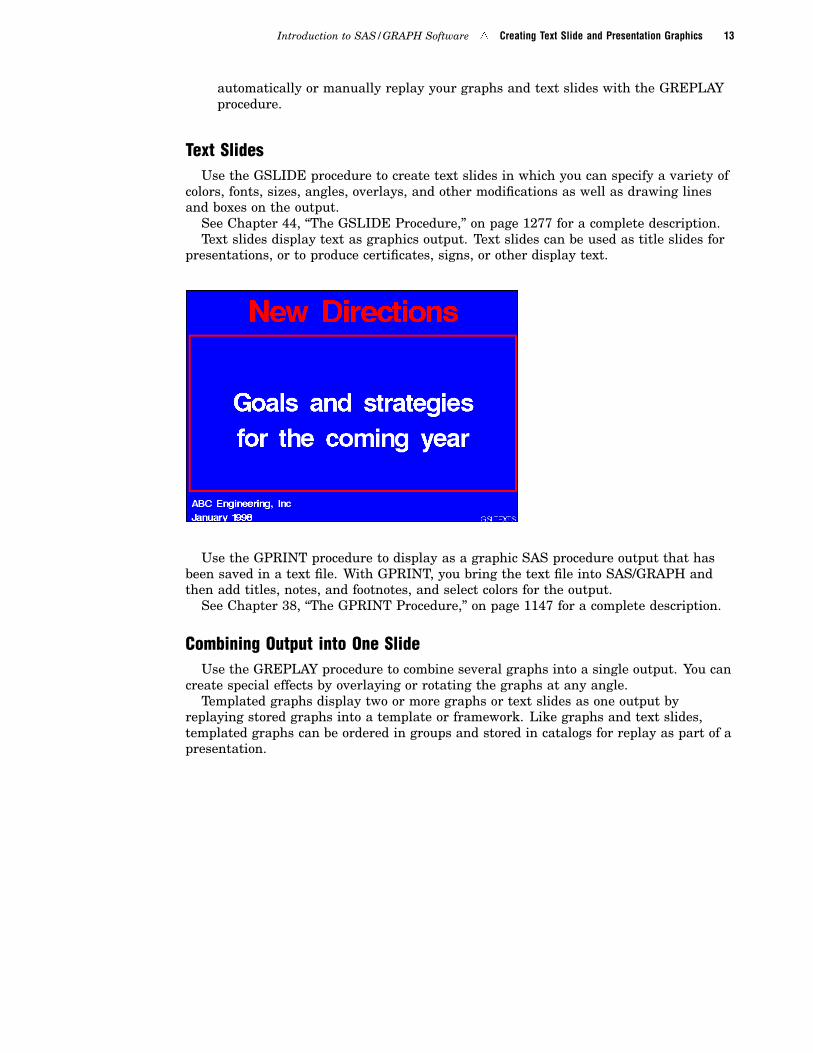
Text SlidesUse the GSLIDE procedure to create text slides in which you can specify a variety of
colors, fonts, sizes, angles, overlays, and other modifications as well as drawing linesand boxes on the output.
See Chapter 44, “The GSLIDE Procedure,” on page 1277 for a complete description.Text slides display text as graphics output. Text slides can be used as title slides for
presentations, or to produce certificates, signs, or other display text.
Use the GPRINT procedure to display as a graphic SAS procedure output that hasbeen saved in a text file. With GPRINT, you bring the text file into SAS/GRAPH andthen add titles, notes, and footnotes, and select colors for the output.
See Chapter 38, “The GPRINT Procedure,” on page 1147 for a complete description.
Combining Output into One SlideUse the GREPLAY procedure to combine several graphs into a single output. You can
create special effects by overlaying or rotating the graphs at any angle.Templated graphs display two or more graphs or text slides as one output by
replaying stored graphs into a template or framework. Like graphs and text slides,templated graphs can be ordered in groups and stored in catalogs for replay as part of apresentation.

14 Enhancing Graphics Output (graphs and text slides) Chapter 1
Figure 1.1 Templated graphs
In addition, you can use the GREPLAY procedure to create an automated oruser-controlled presentation of graphics output. The GREPLAY procedure enables youto name, arrange, and customize the presentation of graphs that are stored in a catalog.
See Chapter 43, “The GREPLAY Procedure,” on page 1237 for a complete description.
Enhancing Graphics Output (graphs and text slides)
SAS/GRAPH StatementsYou also can use global statements and graphics options in SAS/GRAPH programs.
With global statements, you can add titles and footnotes and control the appearance ofaxes, symbols, patterns, and legends. With graphics options, you can control theappearance of graphics elements by specifying default colors, fill patterns, fonts, textheight, and so on.
The Annotate FacilityThe Annotate facility enables you to program graphics by using certain variables in
SAS data sets. It is often used to add text or special elements to the graphics output ofother procedures, although it also can be used to construct custom graphics output.Text and graphics can be placed at coordinates derived from input data, as well ascoordinates expressed as explicit locations on the display.

Introduction to SAS/GRAPH Software Creating Custom Graphics 15
Figure 1.2 Annotated graphs
Creating Custom GraphicsThe Annotate facility can also be used to generate custom graphics without using any
of the SAS/GRAPH graphing procedures.
The DATA Step Graphics InterfaceThe DATA Step Graphics Interface provides functions and calls that produce
graphics output from the DATA step, rather than from a procedure. The functions andcalls are similar in form to those specified by the ISO Graphic Kernal Standard (GKS);however, the interface is not an implementation of the GKS. The form is similar enoughthat many GKS-compliant programs may be converted easily to run as SAS/GRAPHprograms.
Graph-N-GoTo generate presentation graphs without writing any SAS/GRAPH code, you can use
Graph-N-Go (not available on mainframes). You can start Graph-N-Go in several ways:
� from the menus in any SAS window, select
Solutions Reporting Graph-N-Go
� submit either of the following from the SAS command line:
gng
graphngo
� use an Explorer window to directly open a GFORM entry. Double-click (orright-click and choose Open) on a GFORM entry to start a Graph-N-Go sessionusing that entry.
Information on using the application is in Graph–N-Go help, which you can accessfrom the application’s main window in either of two ways:
� select
Help Using This Window

16 About this Book Chapter 1
� press F1 (this may not work in some operating environments).
You can also get help for the application by submitting the following command fromthe SAS command line:
help gng
About this BookThis book provides reference information for all facilities, procedures, statements,
and options that can be used with SAS/GRAPH software. This chapter describes whatyou need to know to use SAS/GRAPH software, and what conventions are used in textand example code. To gain full benefit from using this book, you should familiarizeyourself with the information presented in this chapter, and refer to it as needed.
AudienceThis book is written for users who are experienced in using SAS System software.
You should understand the concepts of programming in the SAS language, and youshould have an idea of the tasks you want to perform with SAS/GRAPH software.
PrerequisitesThe following table summarizes the SAS System concepts that you need to
understand in order to use SAS/GRAPH software:
To learn how to Refer to
invoke the SAS System at your site instructions provided by the SAS SoftwareConsultant at your site
use base SAS software
use the DATA step to create and manipulateSAS data sets
use the SAS Text Editor to enter and edit text
SAS Language Reference: Concepts or SASLanguage Reference: Dictionary
allocate SAS data libraries and assign librefs
create external files and assign filerefs
documentation for using the SAS System underthe operating system for the hardware at yoursite
manipulate SAS data sets using SAS procedures Base SAS Procedures Guide
Conventions Used in This BookThis section explains the conventions this book uses for text, SAS language syntax,
and file and library references. The book uses the following terms in discussing syntax:
keyword is a literal that is a primary part of the SAS language. (A literalmust be spelled exactly as shown, although it can be entered inuppercase or lowercase letters.) Keywords in this book are procedure

Introduction to SAS/GRAPH Software Syntax Conventions 17
names, statement names, macro names, routine names, and functionnames.
argument is an element that follows a keyword. It is either literal, or it isuser-supplied. It has a built-in value (for example, NODISPLAY), orit has a value assigned to it (for example, COLOR=text-color).
Arguments that you must use are required arguments. Otherarguments are optional arguments, or simply options.
value is an element that follows an equal sign. It assigns a value to anargument. It may be a literal, or it may be a user-supplied value.
parameter is a value assigned to an argument that itself takes a value, forexample, the COLOR= parameter of the LABEL= option in aLEGEND statement, as shown in the following statement:
legend label=(color=blue);
Syntax ConventionsType styles have special meanings when used in the presentation of SAS/GRAPH
software syntax in this book. The following list explains the style conventions for thesyntax sections:
UPPERCASE identifies SAS keywords such as the names of statements andprocedures (for example, PROC GCHART). Also identifiesarguments and values that are literals, (for example, NOLEGENDand LABEL=NONE).
italic identifies arguments or values that you supply. Items in italic canrepresent user-supplied values that are either
� nonliteral values assigned to an argument (for example,axis-color in COLOR=axis-color)
� nonliteral arguments (for example, VBAR chart-variable. . . ; ).
In addition, an item in italics can be the generic name for a list ofarguments or parameters from which the user can choose (forexample, appearance-options).
The following symbols are used to indicate other syntax conventions:
< > (anglebrackets)
identify optional arguments. Any argument not enclosed in anglebrackets is required.
| (vertical bar) indicates that you can choose one value from a group. Valuesseparated by bars are mutually exclusive.
. . . (ellipsis) indicates that the argument following the ellipsis can be repeatedany number of times (plot-request <. . . plot-request-n>, forexample). If the ellipsis and the following argument are enclosed inangle brackets, they are optional. In SAS/GRAPH software, anellipsis also indicates a range from which a value is selected(LINE=1 . . . 46, for example).
The following examples illustrate the syntax conventions described in this section.These examples contain selected syntax elements, not complete syntax.
PROC GANNO ANNOTATE=Annotate-data-set<DATASYS>;

18 Syntax Conventions Chapter 1
� PROC GANNO is in uppercase because it is a SAS keyword, the name of astatement. The remaining elements are arguments for the statement.
� ANNOTATE= is not enclosed in angle brackets because it is a required argument.It is in uppercase to indicate that it is a literal and must be spelled as shown.
� Annotate-data-set is in italic because it is a value that you must supply; in thiscase, the value must be a data set name.
� DATASYS is enclosed in angle brackets because it is an optional argument. It is inuppercase to indicate that it is a literal and must be spelled as shown.
� The ending semicolon (;) is required because it is outside the angle brackets for theoption.
SYMBOL <1 . . . 99><COLOR=symbol-color><MODE=EXCLUDE|INCLUDE><appearance-options>;
� SYMBOL is in uppercase because it is a SAS keyword, the name of a statement.The numbers 1 . . . 99 are in angle brackets because they are optional. Theellipsis indicates that you choose one from the range of numbers 1 through 99.The remaining elements are arguments for the statement.
� COLOR= is enclosed in angle brackets because it is an optional argument.
� Symbol-color is in italics because it represents a value that you specify.
� MODE= is enclosed in angle brackets because it is an optional argument.
� EXCLUDE and INCLUDE are in uppercase because they are literal values andmust be spelled exactly as shown. They are separated by a vertical bar (an or bar)because you use one or the other but not both.
� Appearance-options is in italics because it is a generic name for a list of optionsthat can be used in the SYMBOL statement.
HBAR chart-variable< . . . chart-variable-n></ <PATTERNID=BY | GROUP | MIDPOINT | SUBGROUP><statistic-options>>;
� Chart-variable is italic because it is an argument that you supply. It is requiredbecause it is not in angle brackets.
� Chart-variable-n is enclosed in angle brackets because additional user-suppliedarguments are optional. The ellipsis before the argument indicates that it can berepeated as many times as desired.
� PATTERNID= is a literal option. The values BY, GROUP, MIDPOINT, andSUBGROUP are literal values that are mutually exclusive. You can use only one,and it must be spelled as shown.
� Statistic-options is in italics because it is the generic name of a list of options thataffect the chart statistics.
When you are using an option, a statement, or a procedure whose syntax showsarguments or values in italics, you must supply the argument or value. When theargument or value is a font, color, or variable name, SAS/GRAPH software expects valid
Introduction to SAS/GRAPH Software Conventions for Examples and Output 19
font names, color names, and variable names. Consider the following four syntaxsamples:
FONT=font
COLOR=color
COLOR=text-color
PIE chart-variable < . . . chart-variable-n>;
� Font must be a valid SAS font name. (See Chapter 5, “SAS/GRAPH Fonts,” onpage 75 for details.)
� Color and text-color must be valid SAS/GRAPH colors. (See Chapter 6, “SAS/GRAPH Colors and Images,” on page 91 for details.)
� Chart-variable must be a valid SAS variable name. (See SAS Language Reference:Dictionary for details.)
Conventions for Examples and OutputMost of the chapters in this book include examples that illustrate some of the
features of a procedure or its statements. Each example contains
� a description of the highlights of the example
� the program statements that produce the output
� the actual output from the example
� an explanation of the features of the example.
The output that is shown for the examples in this book was generated in an HP-UXoperating environment, using the default XCOLOR display device. If you are using adifferent operating environment or display device, you may need to make some minoradjustments to the example programs.
The dimensions of the graphics output area vary across devices and when using theGRAPH windows. The dimensions may affect aspects of the graphics output – forexample, the appearance of axes or the position of graphics elements that use explicitcoordinates in units other than percent. You may need to adjust the dimensions of yourgraphics output area or the size of graphics elements to correct any differences you see.Most of the examples in this book used a GOPTIONS statement to set the graphicsoutput area to 7 inches by 5 inches, which proved to be a good dimension for generatingoutput displays for this book:
goptions hsize=7in vsize=5in;
These HSIZE= and VSIZE= settings are not shown in the example code and are notnecessary for generating the output, but you may want to use similar settings if youroutput looks different from the output that is shown in the book.
The examples use explicit color specifications, and the example code contains thenames of colors that approximate the colors you see in this book. The colors displayedon your device may differ from those shown in the examples because of differences indevice capabilities.

20 Information You Should Know Chapter 1
The examples in this book do not specify actual names for the file structures used forSAS data libraries or for external files. This is because different operating environmentsand different computing installations use different conventions for naming files anddirectories. Instead, the examples refer to storage locations generically. For example, aLIBNAME statement to assign the libref STORE is shown as
libname store ’SAS-data-library’;
For SAS-data-library, you should supply the complete specification for the storagelocation (for example, directory or z/OS data set) of the data library, using the formrequired by your operating environment.
Similarly, a FILENAME statement to assign the fileref MYFILE is shown as
filename myfile ’external-file’;
For external-file, you should supply a fully qualified filename, using the form requiredfor your operating environment.
If you are unsure of the requirements at your site, see your SAS Software Consultantfor more information.
Some examples explicitly specify the font and height for text, the units, and border inprocedure statements. For those examples that do not include explicit specifications,the following graphics options were used to produce uniform output:
RESET=GLOBAL cancels all currently defined AXIS, LEGEND, FOOTNOTE, TITLE,PATTERN, and SYMBOL definitions.
GUNIT=PCT specifies the unit specification for options is in percent, unlessexplicitly specified in another SAS statement.
FTEXT=SWISSB specifies that all text uses the SWISSB font, unless explicitlyspecified in another SAS statement.
HTITLE=6 specifies that the first title line is 6 percent of the height of thegraphics output area, unless explicitly specified in another SASstatement.
HTEXT=3 specifies that text is 3 percent of the height of the graphics outputarea, unless explicitly specified.
BORDER causes a border to be drawn around the graphics output area. Theborder, which appears in most output, represents the boundaries ofthe graphics output area, whether or not a border is drawn by theprogram.
Note: The way that output is presented on your device depends on the environmentin which you are running SAS/GRAPH software. �
Information You Should KnowThis section outlines information you should know before you attempt to run the
examples in this book.
Support PersonnelMost sites have personnel available to help users learn to run SAS System software.
Record the name of the SAS Software Consultant, SAS Software Representative, and

Introduction to SAS/GRAPH Software Sample Programs 21
system administrator at your site. Also record the names of anyone else you regularlyturn to for help with running SAS/GRAPH software.
Sample ProgramsMost of the chapters in this book provide examples that demonstrate some of the
major features of SAS/GRAPH software. To minimize the typing you must do to run thesample code yourself, the code is delivered to you through the SAS Sample Library.Depending on your operating environment, there are up to three ways that you canaccess the code that is in the sample library:
� if you are viewing the sample code in SAS OnlineDoc, you can copy the code out ofthe OnlineDoc and paste it into the Program Editor in your SAS session. Thisalternative is not available if you do not have access to a Web browser in theoperating environment where you are running your SAS session.
� in most operating environments (excluding mainframe environments), you canaccess the sample code through the SAS Help facility. For example, from a SASwindow’s Help menu, you can choose SAS System Help to enter the help system.You can then choose the link for Sample SAS Programs and Applications, whichtakes you to the help page for the SAS Sample Library.
� in most operating environments (excluding Windows), the SAS Sample Librarymay have been installed in your file system. If the SAS Sample Library has beeninstalled at your site, ask your SAS Software Consultant where it is located.
To access the sample programs through SAS System Help or through your filesystem, you must understand the naming convention used for the samples. The namingconvention for SAS/GRAPH samples is Gpcxxxxx, where pc is the product code andxxxxx is an abbreviation of the example title. For example, the code for the firstexample in the GMAP Procedure chapter, Example 1 on page 1045, is stored in samplemember GMPSIMPL. The sample-library member name is sometimes displayed as afootnote in the output’s lower-right corner.
� In SAS System Help, the sample programs are organized by product. Within eachproduct category, the samples are sorted alphabetically by title. Thus, to accessthe code for the first example in the GMAP Procedure chapter, navigate in thehelp system to the SAS Sample Library page, choose SAS/GRAPH from the list ofproducts, and then scroll to the listing "GMPSIMPL-Producing a Simple BlockMap."
� In your file system, the files that contain the sample code have file names thatmatch the sample member names. For example, in a directory-based system, thecode for sample member GMPSIMPL is located in a file named GMPSIMPL.SAS.
Note: For WebGraph samples the naming convention is GWBxxxxx. �
Note: Some of the examples include LIBNAME and FILENAME statements. Youmust provide the name of the SAS data library or external file before running theexample. �

22 Sample Programs Chapter 1
Table 1.1 Product Codes for SAS/Graph Proceedures
Procedure Code
dsgi DS
ganno AN
gchart CH
gradar GD
gcontour CT
gfont FO
gimport IP
gkeymap KY
gmap MP
goptions OP
gplot PL
gprint PR
gproject PJ
greduce RD
gremove RM
greplay RE
gslide SL
gtestit IT
g3d TD
g3grid TG
Table 1.2 Product Codes for SAS/Graph Statements
Statement Code
axis AX
by BY
footnote FO
goptions ON
legend LG
note NO
pattern PN

Introduction to SAS/GRAPH Software Annotate Macros Data Set 23
Statement Code
symbol SY
title TI
Table 1.3 Product Code for SAS/Graph WebGraphs
Statement Code
WebGraph WB
Map Data SetsTo run the examples that draw maps, you need to know where the map data sets are
stored on your system. Depending on your installation, the map data set mayautomatically be assigned a libref. Ask your SAS Software Consultant or systemadministrator where the map data sets are stored for your site.
Annotate Macros Data SetTo run the examples using Annotate macros, you need to know where the Annotate
macro data set is stored on your system. Depending on your installation, the Annotatemacro data set may automatically be assigned a fileref. Ask your SAS SoftwareConsultant or system administrator where the Annotate macro data set is stored foryour site.

24