Introduction to Sarcopenia and frailty
38
Introduction to sarcopenia and frailty Dr Mary Hickson Research Dietitian, Imperial College Healthcare NHS Trust Adjunct Professor, Imperial College London 1
-
Upload
mary-hickson -
Category
Healthcare
-
view
698 -
download
2
Transcript of Introduction to Sarcopenia and frailty

Introduction to sarcopenia
and frailty
Dr Mary Hickson
Research Dietitian, Imperial College
Healthcare NHS Trust
Adjunct Professor, Imperial College
London
1

Declarations
• Consultancy: Abbott Nutrition, Danone
• Research grants: Abbott Nutrition, Danone
• Speaker Honoraria: Nestlé, Danone
2

How many old people are there?
http://www.statistics.gov.uk/cci/nugget.asp?id=763

Who is affected?

What is the impact on people?
Increased risk of:
• Morbidity
• Disability
• Frailty
• Mortality
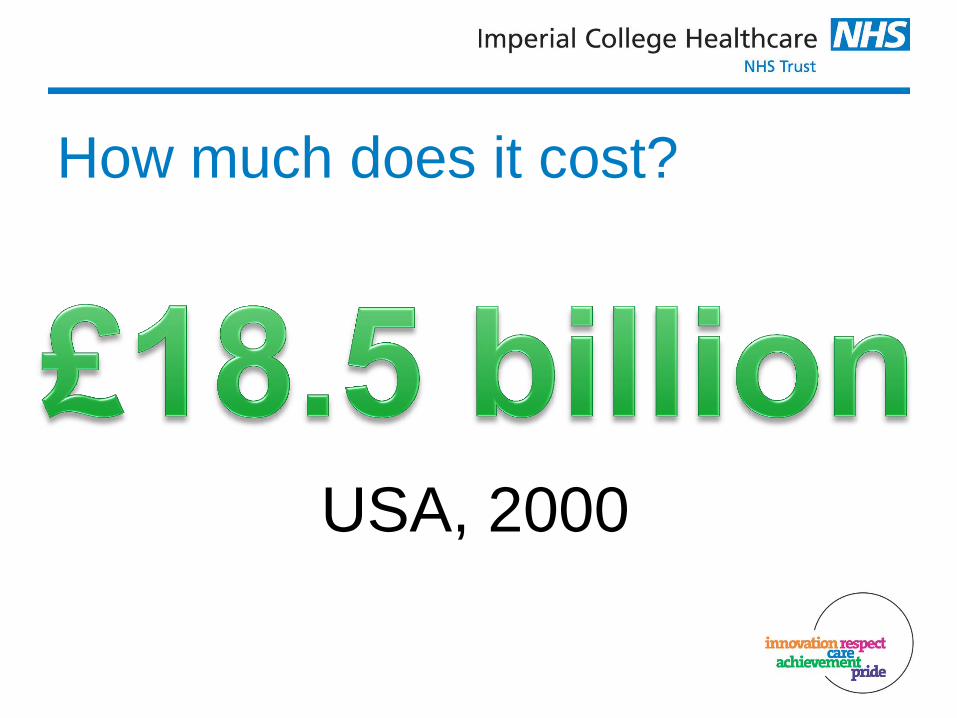
How much does it cost?
USA, 2000

Loss of Mass
7

Loss of strength
8
The Role of Protein and Amino Acids in Sustaining and
Enhancing Performance (1999) Institute of Medicine.

Loss of performance
9

Sarcopenia is the loss of
muscle mass and strength
and corresponding loss of
physical function that
occurs with advancing
age

Table 1 Comparison of sarcopenia definitions
EWGSOP European Working Group of Sarcopenia in Older Persons, SCWD Sarcopenia, Cachexia and Wasting Disorders, IANA International
Association of Nutrition and Aging) 11
Definition Function Muscle mass
SIG: cachexia-anorexia in
chronic wasting disease
Gait speed <0.8 m/s, OR other
physical performance test
Low muscle mass (2SD)
EWGSOP Gait speed <0.8 m/s; grip
strength 30 kg males, 20 kg
females
Low muscle mass (not
defined)
IWGS Sarcopenia Task
Force
Gait speed <1.0 m/s, grip
strength
Low appendicular lean
mass (<7.23 kg/m2 in
men, 5.67 in women)
Sarcopenia with limited
mobility (SCWD)
6 min walk <400 m, OR gait
speed <1.0 m/s
Low appendicular lean
mass/height2
Asian Working Group for
Sarcopenia
Gait speed <0.8 m/s; grip
strength 26 kg males, 18 kg
females
Low appendicular lean
mass/height2
Foundation for the National
Institutes of Health
Gait speed <0.8 m/s; grip
strength 26 kg males, 16 kg
females
Appendicular lean
mass/BMI

A life course model of sarcopenia 12
Disability threshold

• Increases with age
• No difference between men and women
• 1–29% (up to 30% in women) for older adults
living in the community
• 14–33% (up to 68% in men) for those living in
long-term care institutions
• 10% for those in acute hospital care
Prevalence
Cruz-Jentoft, (2014) Prevalence of and interventions for sarcopenia in ageing adults: a
systematic review. Age and Ageing. 43:748-759.

• Lots of inconsistencies in the methods of
prevalence studies
• Not many studies in some settings (acute
hospital and long term care)
• Only 18 studies overall
• Reporting of age was inconsistent
• It is not yet known what is the best cut off to use
to diagnose muscle loss, strength or function.
BUT

Stages of sarcopenia

Diagnosis: strength and function

Diagnosis: Muscle mass


Obesity and sarcopenia

Cachexia • Cytokine-associated wasting
• Loss of muscle (with or
without loss of fat)
• Cannot be fully reversed by
conventional nutritional
support and leads to
progressive functional
impairment
• Associated with chronic
diseases e.g. cancer, COPD,
end-stage renal failure and
congestive cardiac disease

Diagnosis of cachexia
Page 21
Evans et al. Clin Nutr
(2008) 27, 793-799

Mechanisms of muscle wasting
Page 22
Adapted from: Thomas DR Clin Nutr (2007) 26, 389-399
Malnutrition
intake
requirements
Malabsorption

Page 23
Malnutrition
Cachexia Sarcopenia

Frailty

• Frailty varies in severity; you are not frail –
you have frailty
• Frailty is not static; it can be made better
and worse
• Frailty is not an inevitable part of ageing; it
is a long term condition
Frailty

Definition
• Multidimensional geriatric syndrome
• Increased vulnerability to stressors
• Reduced capacity of physiological systems
• Increased risk of adverse health-related outcomes
– Biological abnormalities (e.g. biomarkers of inflammation)
– Falls
– Disability
– Hospitalizations
– Mortality


Epidemiology • Increases with age
• More common in those over 80 years
• Prevalence varies between different populations
– 4.0 to 59.1%
– 8.5% in women and 4.1% in men aged 65 –74 years
(phenotype model)
• Higher in southern Europe compared to northern
Europe
– Use of different operational definitions for frailty
– Use of different inclusion and exclusion criteria

Cycle of frailty
Linda P. Fried et al. J Gerontol A Biol Sci Med Sci
2001;56:M146-M157
The Gerontological Society of America

Diagnosis
• Phenotype model (Fried et al)
– At least three of five signs/symptoms • Poor muscle strength
• Slow gait speed
• Unintentional weight loss
• Exhaustion
• Sedentary behaviour
• Deficit model (Rockwood et al)
– Number of deficits that an individual has
Number of deficits considered (30-100)
– The closer to 1, the more frail the individual


Validated frailty tools • PRISMA 7 Questionnaire: >=3/7 = frailty
• Walking speed (gait speed): <0.8m/s or taking
>5 secs to walk 4m
• Timed up and go test: >=10s to get up from a
chair, walk 3m, turn round and sit down
• FRAIL questionnaire screening tool
• Clinical Frailty Scale
• Gérontopôle Frailty Screening Tool


What can be reversed?
• Personalised interventions
• Evidence is lacking in many areas
• Exercise is key – strength, balance
• Nutrition has a role
• Social, psychological and behavioural all
important too
• Pharmacology
36


Resources
• Fit for Frailty: British Geriatrics Society
guidance on the recognition and
management of older patients with frailty in
community and outpatient settings
• www.acutefrailtynetwork.org.uk: NHS Elect
• Acute medical care for frail older people:
Royal College of Physicians
• www.frailty.net: Implementing frailty into
clinical practice 38


![Quality of Life in Sarcopenia and Frailty · ‘‘sarcopenia’’ is already a fairly well-known term, the introduction of another may lead to confusion [3]. The EWGSOP consensus](https://static.fdocuments.in/doc/165x107/5f6f31e982898415ee0d4301/quality-of-life-in-sarcopenia-and-frailty-aasarcopeniaaa-is-already-a-fairly.jpg)