Introduction to Safe Patient Handling/ Building SPH...
155
SPH Training Series - Session I Introduction to Safe Patient Handling/ Building SPH Ergonomics Teams/Documenting Patient Handling Injuries Western New York Council on Occupational Safety & Health (WNYCOSH) This material was produced under grant number SH-24926-13 from the Occupational Safety and Health Administration, U.S. Dept. of Labor. It does not necessarily reflect the views or policies of the U.S. Dept. of Labor, nor does mention of trade names, commercial products, or organizations imply endorsement by the US Government.
Transcript of Introduction to Safe Patient Handling/ Building SPH...
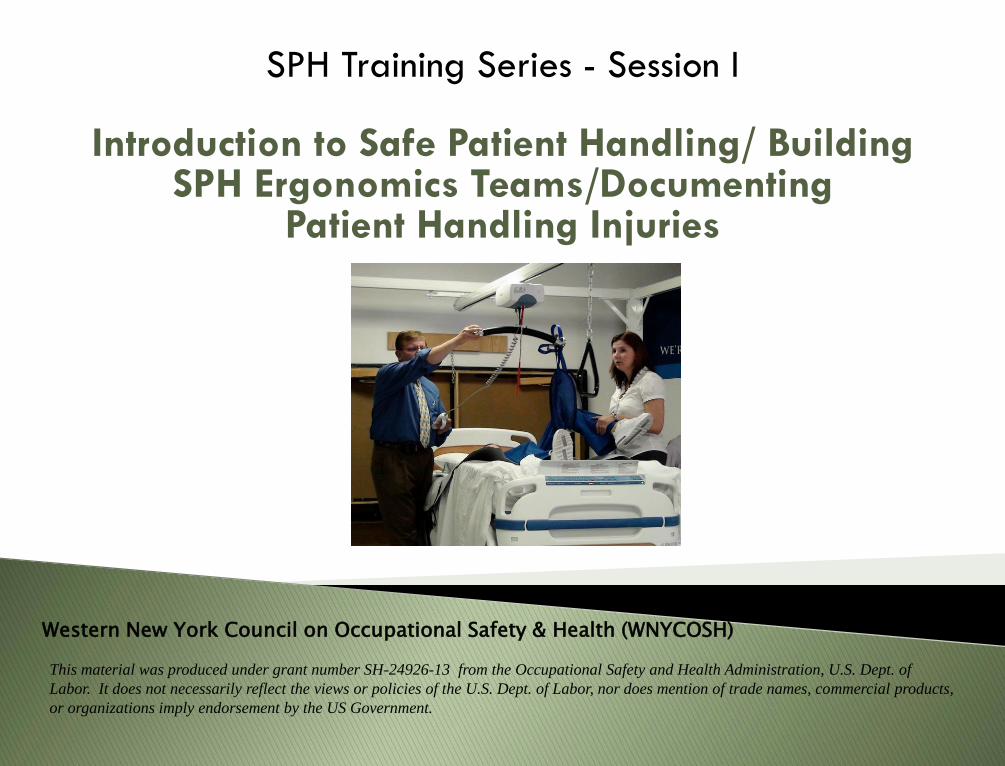
SPH Training Series - Session I
Introduction to Safe Patient Handling/ Building SPH Ergonomics Teams/Documenting
Patient Handling Injuries
Western New York Council on Occupational Safety & Health (WNYCOSH)
This material was produced under grant number SH-24926-13 from the Occupational Safety and Health Administration, U.S. Dept. of
Labor. It does not necessarily reflect the views or policies of the U.S. Dept. of Labor, nor does mention of trade names, commercial products,
or organizations imply endorsement by the US Government.

Introduction to Safe Patient Handling
AGENDA:
An Overview of Safe Patient Handling (SPH)
Body Mechanics and Lifting Limits
Anatomy of an Injury
Controlling Risk Factors
Old vs. New SPH Practices: Changing the Culture
SPH Stakeholders
SPH Ergonomic Team’s Roles in SPH
SPH Implementation Steps/Timeline
Assessing facility injury and compensation rates

Introduction to Safe Patient Handling
OBJECTIVES:
Participants will be able to understand…
what SPH is and who benefits
why body mechanics can’t prevent health care worker injuries
why and how manual handling is injuring us
how our job tasks and work environment put us in risk of injury
SPH is a change in our safety culture
need for SPH Stakeholder’s involvement
the SPH/Ergonomics Team’s role in SPH
SPH implementation/timeline planning
identifying and recording patient injuries

Section 1
An Overview of Safe Patient Handling
Handling s: Myth vs. Fact
Health Care Worker Rates
What Is Safe Patient Handling
Who Benefits?

Section 1: An Overview of Safe Patient Handling
MYTH VS.
FACT
GROUP ACTIVITY 1 Page 3 of Student Workbook Guide

Section 1: An Overview of Safe Patient Handling
WHO IS GETTING HURT?
What job titles have the highest injury rates?
Where do health care workers rank
among these job titles?
Have health care worker injuries been going up, down or staying the same
over time?

Section 1: An Overview of Safe Patient Handling
WHO IS GETTING HURT?
Injury Trends By Occupation
WNYCOSH NYS Safe Patient Handling Demonstration Project NF DOL Conference Oct 2009

Section 1: An Overview of Safe Patient Handling
WHO IS GETTING HURT?
Numbers of Injuries Nationwide
6,090
4,250
3,060
2,050
1,770
1,640
1,560
0 1,000 2,000 3,000 4,000 5,000 6,000 7,000 8,000 9,000
Health Care Professions with Patient Care Duties
Laborers, Freight, Stock and Material Movers
Janitors and Cleaners, except Maids and Housekeepers
Truck Drivers, Heavy and Tractor Trailer
Retail Salespersons
Truck Drivers, Light or Delivery Services
Construction Laborers
Carpenters
Nurses Aids, Orderlies, Attendants 4770 Injuries Home Health Aids 1770 Injuries Registered Nurses 1590 injuries
8130

Section 1: An Overview of Safe Patient Handling
WHO IS GETTING HURT?
29% of all workplace injuries requiring time away from work are MSDs
The MSD rate for nursing aides, orderlies and nursing attendants is 7xs higher that the average of all occupations
Approximately three-fourths of these MSDs are lower back disorders
Sources: Bureau of Labor Statistics, 2008, 2009 E. Langford, RN, 1997

Section 1: An Overview of Safe Patient Handling
WHAT IS Safe Patient Handling?
“A policy and practice that creates a safe work environment for patients [s] and
healthcare workers by eliminating hazardous manual lifting tasks.
Transferring and repositioning patients [and s] is accomplished by using new technologies such as mechanical lifts
and repositioning devices.”
- NYS Zero Lift Task Force

Section 1: An Overview of Safe Patient Handling
HOW DO WE GET TO SPH?
Set-up a SPH Team
Adopt a SPH Policy
Assess Facility Needs
Purchase Equipment
Training Staff on SPH
Mentor/Monitor/Evaluate

Section 1: An Overview of Safe Patient Handling
WHO BENEFITS?

Section 2
Body Mechanics and Lifting Limits
Good Body Mechanics
The Lifting Limit for Unstable Loads
Manual Lifting Using “Good Body Mechanics” Is a Failed Policy

Section 2: Body Mechanics and Lifting Limits
QUESTIONS:
What are good body mechanics?
How many pounds can you safely lift using good body
mechanics?

WHEN YOU LIFT AN OBJECT USE GOOD BODY MECHANICS
Bend at the knees, not the waist
Get close to the object
Keep your back straight and don’t twist
Plant your feet properly
Hold objects close to your body
Push, pull and slide when possible
Section 2: Body Mechanics and Lifting Limits

Section 2: Body Mechanics and Lifting Limits
OSHA Technical manual, Section VII, Chapter 1: Back disorders and Injuries,http://www.osha.gov/dts/osta/otm/otm_vii/otm_vii_1.html
Section 2: Body Mechanics and Lifting Limits
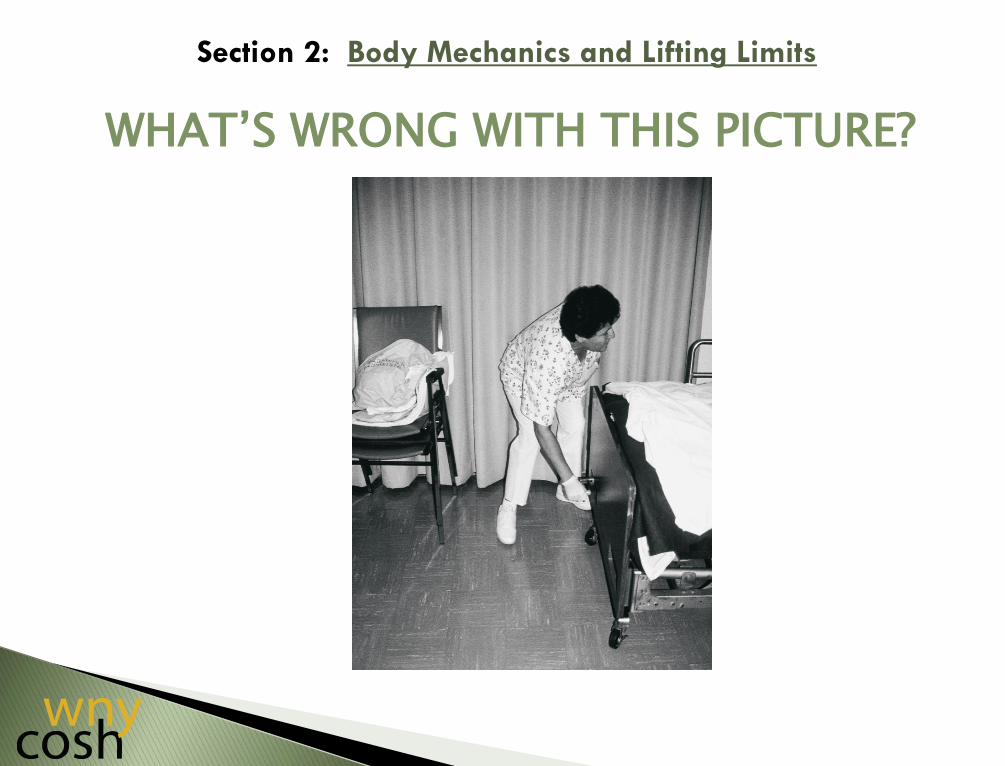
WHAT’S WRONG WITH THIS PICTURE?

Section 2: Body Mechanics and Lifting Limits
WHAT’S WRONG WITH THIS PICTURE?

Section 2: Body Mechanics and Lifting Limits
WHAT’S WRONG WITH THIS PICTURE?

Section 2: Body Mechanics and Lifting Limits
WHAT’S WRONG WITH THIS PICTURE?

Section 2: Body Mechanics and Lifting Limits
Fact: Techniques taught through body mechanics have not reduced back injuries among healthcare workers
Good body mechanics is not enough to prevent injuries
Manual lifting techniques were based on stable loads held close to the body
Manual lifting techniques were based on loads weighing less than typical s
Manual lifting techniques were based on studies that included only men.
Source: NYS Zero-Lift Task Force

Section 2: Body Mechanics and Lifting Limits
NIOSH has determined that the safe lifting limit for a two-handed lift of a box held close to the body
is 51 pounds.
Is lifting a the same as
lifting a box?
WHY? WHY NOT?

Section 2: Body Mechanics and Lifting Limits
The National Institute for Occupational Safety and
Health has determined that healthcare workers should
lift a maximum of 35 pounds when transferring and repositioning patients.

Section 2: Body Mechanics and Lifting Limits
Our healthcare workers are getting older.
THE AVERAGE AGE OF OUR NURSES IS NOW 48+ YEARS
Our patients and residents are
getting heavier.
NEARLY 40 MILLION AMERICAN ADULTS CAN NOW BE CLASSIFIED AS OBESE

Section 2: Body Mechanics and Lifting Limits
In 2005, over 53,000 healthcare workers who were
trained in good body mechanics were injured from
manually lifting patients.
Source: Bureau of Labor Statistics, 2005

Section 2: Body Mechanics and Lifting Limits
HOW MUCH ARE YOU LIFTING?
GROUP ACTIVITY 2
Page 6 of Student Workbook Guide

Section 3
Anatomy of an Injury
The high risks of manual handling
Manual handling and “overexertion”
“Overexertion” and excessive forces on the spinal discs

Section 3: Anatomy of an Injury
Where do you hurt? Why do you hurt?
BODY CHART ACTIVITY

Section 3: Anatomy of an Injury

The average healthcare worker manually lifts 1.8 tons per 8-hour
shift. That is equal to lifting one sedan per shift.
In one year, healthcare workers lift the equivalent of an airplane that is 50% loaded.
The number of manual lifting injuries to healthcare workers in
one year equals the full capacity of the new Yankee Stadium.
HOW MUCH ARE YOU LIFTING?
Section 3: Anatomy of an Injury

Section 1: Industry Injuries
OVEREXERTION = CUMULATIVE TRAUMA
0% 5% 10% 15% 20% 25% 30% 35% 40%
Fall to lower level
Fall on same level
Slips or trips without fall
Total Overexertion
Overexertion in lifting
Nursing and Residential Care Facilities

YOUR BACK: THE SPINAL COLUMN
Section 3: Anatomy of an Injury
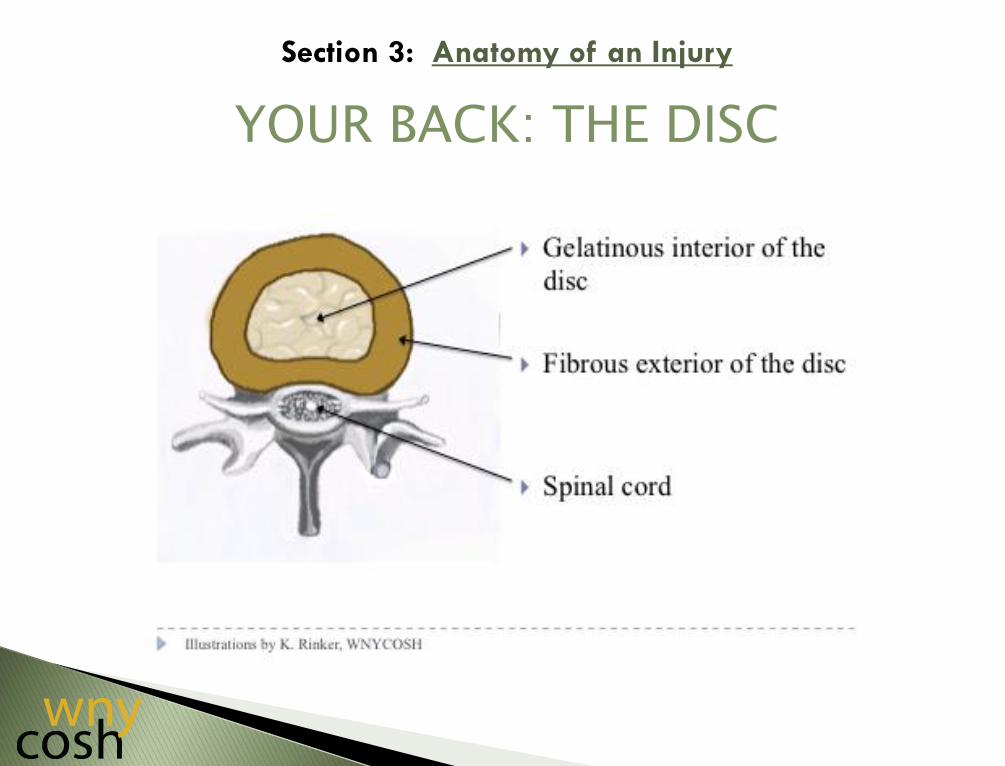
YOUR BACK: THE DISC
Section 3: Anatomy of an Injury

ACUTE BACK PAIN
“Acute” due to temporary overexertion/trauma
Temporary “backache”
Muscle spasm, strain, sprain
Section 3: Anatomy of an Injury

CHRONIC BACK PAIN
Due to long-term overexertion
Bulging, ruptured or degenerated discs
Excruciating pain
Potentially career-ending
Section 3: Anatomy of an Injury

OVEREXERTING YOUR DISCS
Section 3: Anatomy of an Injury

RUPTURED DISCS
Normal Spinal Disc Spinal Disc w/ A Ruptured Disc
Illustrations by K. Rinker, WNYCOSH
Section 3: Anatomy of an Injury

DISC DEGENERATION
Section 3: Anatomy of an Injury

DISC DISORDERS
Illustrations by K. Rinker, WNYCOSH
Section 3: Anatomy of an Injury

Back injuries are most common: 73% of MSDs reported by nurses 70% are of the Lumbar Spine 57% are due to lumbar disc problems
Other chronic MSDs: Rotator cuff (shoulder) Thoracic outlet syndrome (neck area) Epicondylitis (elbows) Cartilage deterioration (knees) Carpal tunnel (wrist/hand)
Section 3: Anatomy of an Injury
MSDs AMONG HEALTHCARE WORKERS

Section 4
Controlling Risk Factors
“Fitting the Worker to the Job”
“Fitting the Job to the Worker”

Old Philosophy – “Fit the Worker to the Job” Body Mechanics Physical Fitness Personal Protection
New Philosophy – “Fit the Job to the Worker” Ergonomics Engineering the risk factors (hazards) out
of the job
Section 4: Controlling Risk Factors
ERGONOMICS: THE LAWS OF WORK
HANDLING: RISK FACTORS (HAZARDS)
What are some risks about your job tasks that can hurt you?
What are some risks about your work environment that can hurt you?
Section 4: Controlling Risk Factors

ERGONOMIC IDENTIFIES JOB TASK RISKS
Heavy lifting Applying force Awkward postures Frequent bending, twisting, stretching,
reaching Prolonged static posture Overexertion/no rest = cumulative trauma
Section 4: Controlling Risk Factors

THE OSHA “HIERARCHY OF CONTROLS”
TO “FIX THE JOB”
Section 4: Controlling Risk Factors

FIXING THE JOB: EQUIPMENT
Section 4: Controlling Risk Factors
FULL MECHANICAL LIFT

FIXING THE JOB: EQUIPMENT
Section 4: Controlling Risk Factors
Sit-to-Stand Lift (Bariatric Patient)

FIXING THE JOB: EQUIPMENT
Section 4: Controlling Risk Factors
Ceiling Lift (Bariatric Patient)

FIXING THE JOB: EQUIPMENT
Section 4: Controlling Risk Factors
Ceiling Lift with Leg Strap

FIXING THE JOB: TRANSFER DEVICES
Section 4: Controlling Risk Factors
Lateral Transfer Devices

FIXING THE JOB: OTHER ASSISTIVE DEVICES
Section 4: Controlling Risk Factors
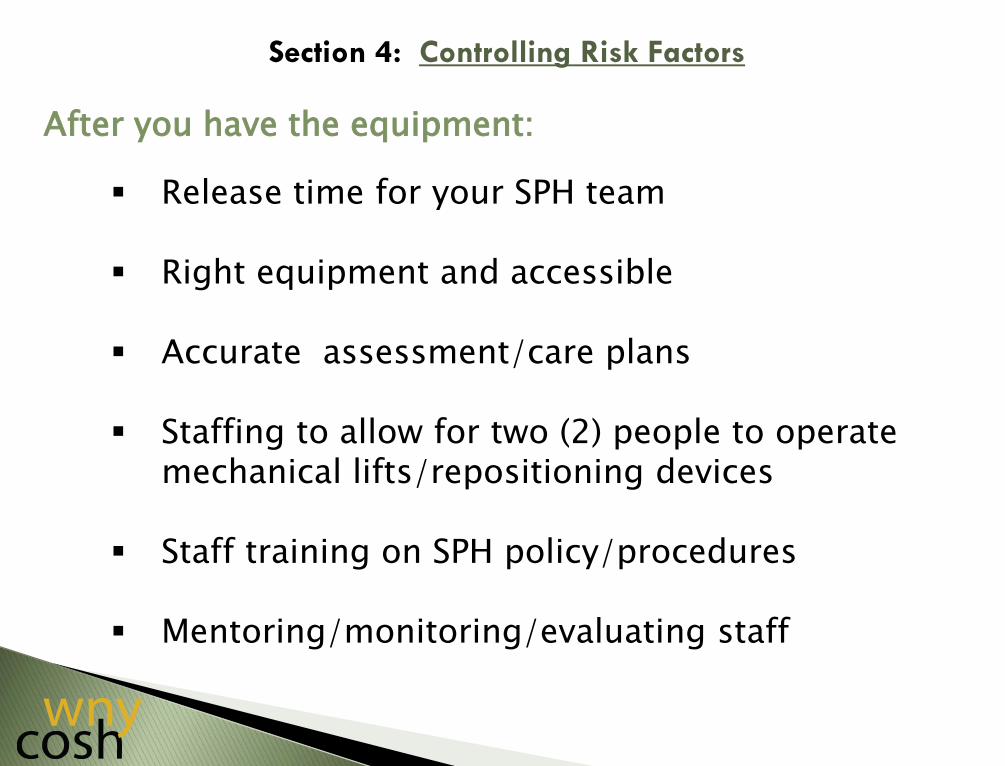
After you have the equipment:
Release time for your SPH team Right equipment and accessible Accurate assessment/care plans Staffing to allow for two (2) people to operate
mechanical lifts/repositioning devices Staff training on SPH policy/procedures
Mentoring/monitoring/evaluating staff
Section 4: Controlling Risk Factors

Section 4: Controlling Risk Factors
FIXING THE WORK ENVIRONMENT
Room Layout Small Room/Clutter
Uneven Work Surfaces
Beds, Chairs and Toilets w/ Different Heights
Lifting Devices Equipment Poorly-
Maintained, Inaccessible, Wrong or Inadequate
** Beware Slips, Trips & Fall Hazards

Section 5
Old vs. New Practices: Changing the Culture
Moving From an “Old” Manual Lifting Culture to a “New” Safe Patient Handling Culture
How Do We Get There?

The “Old” Handling Culture:
“Blame and Shame” Injuries are due to carelessness Reward good behavior Punish bad behavior Body mechanics = safe lifts/transfers Non-manual handling is impractical
Section 5: Old Vs. New Practices: Changing the Culture

The “New Safe Patient Handling Culture”
The way to create a safer workplace is to “Fit the Job Task” and “Work Environment” to the worker
Eliminate the need to manually handle s
through the purchase and use of equipment will create a safer workplace
Train and mentor direct care workers on the
proper use of equipment will move us toward a “Culture of Safety”
Section 5: Old Vs. New Practices: Changing the Culture

Moving to a New Culture of Safety:
Commitment of leadership to safety Safety valued as much as efficiency/productivity
through investments in equipment
Shift away from “Shame and Blame” to looking at root causes
Training, mentoring and monitoring
Organizational learning from errors and near misses
Section 5: Old Vs. New Practices: Changing the Culture

Section 6:
Safe Patient Handling Stakeholders
Identifying SPH Stakeholders
Stakeholder Benefits

Anyone Who:
Has a stake in the project working
Can stop the SPH project
Is directly impacted
Will feel threatened
Stands to benefit
Can support the budget
Section 6: Safe Patient Handling Stakeholders

The Stakeholders:
Management/Administration
HR, Fiscal Administrator, Comptroller
Frontline Staff (CNAs, PCAs, LPNs, RNs
Occupational and Physical Therapists
s and Family Members
Environmental/Laundry/Plant Operations
Clinical Engineers
Social Workers, Admissions and Unit Clerks
Purchasing
Students, New Hires, Potential New Hires
Section 6: Safe Patient Handling Stakeholders

Section 6
Safe Patient Handling Programs
GROUP ACTIVITY 3
Page 8 of Student Workbook Guide
• Stakeholders
• SPH Ergonomic Teams
• Achieving “Buy-in”
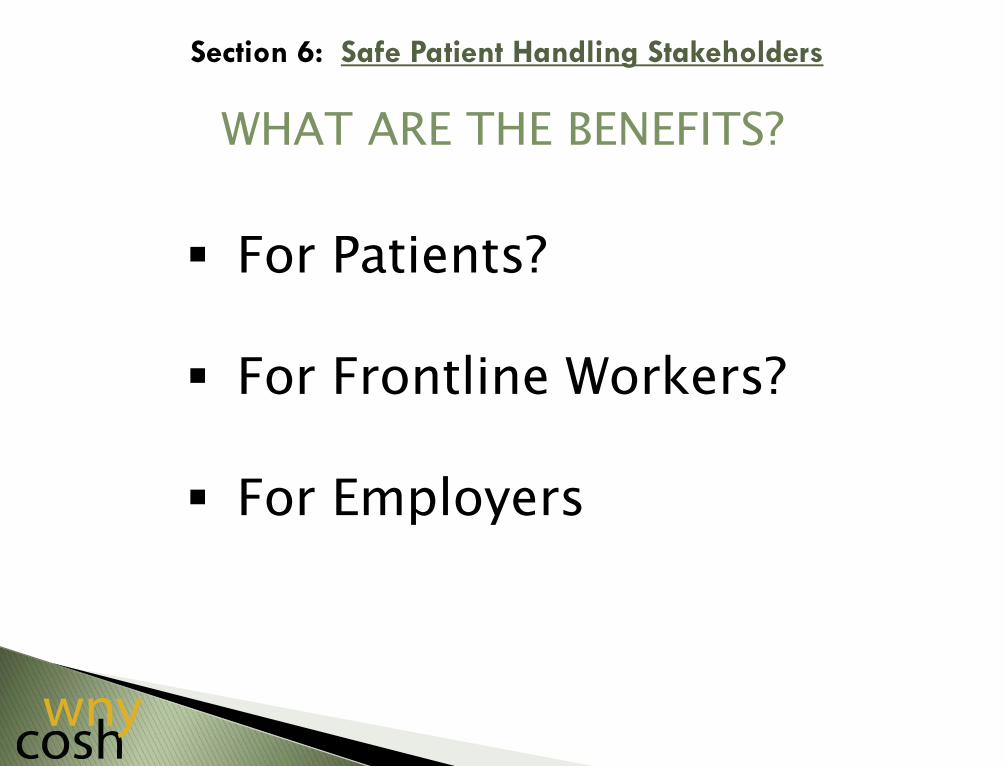
WHAT ARE THE BENEFITS?
For Patients?
For Frontline Workers?
For Employers
Section 6: Safe Patient Handling Stakeholders

Benefits for Patients:
Improved quality of care
Improved safety and comfort
Improved satisfaction
Reduced risk of falls, being dropped and friction burns
Reduced skin tears and bruises
Section 6: Safe Patient Handling Stakeholders

Benefits for Health Care Workers:
Reduced risk of injury
Improved morale
Less pain and muscle fatigue
Re-injury less likely for injured workers
Pregnant workers can work longer
Staff can work at an older age
More energy at work shift’s end
Section 6: Safe Patient Handling Stakeholders

Benefits for Employers:
Reduced number and severity of staff injuries
Improved safety
Reduced restricted work days
Reduced overtime and sick leave
Improved recruitment/retention of direct care staff
Fewer resources needed to replace injured staff
Section 6: Safe Patient Handling Stakeholders

Section 7:
Safe Patient Handling Ergonomic Teams
SPH Team Structure
SPH Team Functions

Section 7: Safe Patient Handling/Ergonomic Team Structure
SPH/ERGONOMIC TEAM STRUCTURE

Direct Care Staff Members:
Care Staff (All Shifts)
Registered Nurses
Licensed Practical Nurses
Certified Nursing Assistants
Transport Staff
Maintenance
Environmental Services (Including Laundry)
Physical/Occupational Therapy Staff
Infection Control
Section 7: Safe Patient Handling/Ergonomic Team Structure

Administrative Members:
Administration
Business/Budget Department
Human Resources
Trainers/Educators
Supervisors
Third-Party Administrators, Benefit
Coordinators, Workers Comp Case Managers
Occupational Health/Employee Health
Personnel
Section 7: Safe Patient Handling/Ergonomic Team Structure

Section 7: Safe Patient Handling/Ergonomic Team Structure
FUNCTIONS: SPH TEAM DUTIES/RESPONSIBILITIES

Section 8:
Timeline
Developing Your SPH Program Implementation Timeline

Developing a Timeline for the Following Elements of Your SPH Programs:
Needs Assessment
Equipment Purchases
SPH/Ergonomics Team Up and Running
SPH Policy and Procedures Development
Stakeholders “Buy-In”
SPH Program “Rolled Out” Onto Units
SPH Training for All Direct Care Workers
System for Mentoring, Evaluating Direct
Care Workers Established
Section 8: Timeline

Section 9:
Making the Case
For Safe Patient Handling
Ergonomics Programs:
Documenting Patient
Handling Injuries
Section 9: Making the Case:
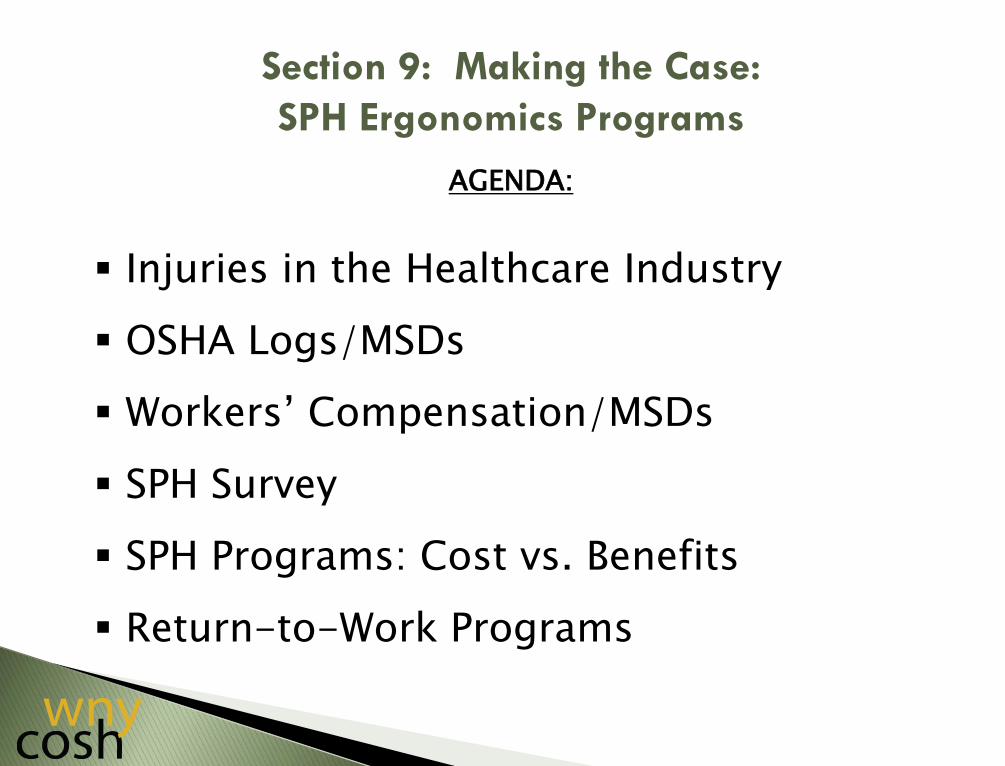
SPH Ergonomics Programs
AGENDA:
Injuries in the Healthcare Industry
OSHA Logs/MSDs
Workers’ Compensation/MSDs
SPH Survey
SPH Programs: Cost vs. Benefits
Return-to-Work Programs

OBJECTIVES:
Participants will be able to understand…
How the OSHA 300 Log can be used to assess the incidence of handling-related injuries at this facility
How the Workers’ Compensation C-2s and Loss – Run
reports can be used to analyze the cost of injuries at this facility
Section 9: Making the Case: SPH Ergonomics Programs

OBJECTIVES (Continued):
Participants will be able to understand…
How your team can use the OSHA 300 Logs, Workers’ Comp C2s/Loss – Run reports, direct observations and staff interviews to determine where/why -handling injuries are occurring at your facility
What -handling equipment can be targeted to your high-injury
work area and the costs of doing nothing vs. the benefits of a SPH program
The benefits of a SPH program on having an effective claims
Return to Work program
Section 9: Making the Case:
SRH Ergonomics Programs

Section 9: Health Care Industry Injuries
Where does our industry rank?
Injury rates in nursing homes
Lost Work Days among our CNAs
MSDs and CNAs
Overexertion and injuries
Job task/work environment hazards
Broader issues increasing job hazards

Section 9: Health Care Industry Injuries
WHERE DOES OUR INDUSTRY RANK?
Which industries rank at the Top 5 with respect to work-related injury rates?
What injuries are most common?
How do most employees get hurt?
What’s the number one injury at our facility?
What’s the cause?

Section 9: Health Care Industry Injuries
WHERE DOES OUR INDUSTRY RANK?
Which industries rank at the Top 5 with respect to work-related injury rates?
What injuries are most common?
How do most employees get hurt?
What’s the number one injury at our facility?
What’s the cause?

Section 9: Industry Injuries
Source: Bureau of Labor Statistics, US Department of Labor, October 2009
Highest non-fatal occupational injury and illness incidence rates among 3-digit NAICS industries,
private industry, 2008

Section 9: Health Care Industry Injuries

Section 9: Health Care Industry Injuries

Section 9: Health Care Industry Injuries

Section 9: Health Care Industry Injuries
THE HIGH COST OF WORK-RELATED MSDS: UNDERREPORTING
“. . .the number of MSD injuries reported by healthcare workers is probably low because many injuries are underreported. In fact, it is estimated that as many as 50 percent may go unreported.” Source: Lynda Enos. SPH. A Summary of the Issues and Solutions. 2009l A. Nelson, et al., Int. Journal of Nursing Studies. 2005. B. Owen. Int. Journal of Nursing Studies. 2002. N. Menzel. AAOHN Journal. 2008.

Section 9: Health Care Industry Injuries
OVEREXERTION
0% 5% 10% 15% 20% 25% 30% 35% 40%
Fall to lower level
Fall on same level
Slips or trips without fall
Total Overexertion
Overexertion in lifting
Nursing and Residential Care Facilities

Section 9: Health Care Industry Injuries
WHY IS MANUAL HANDLING HAZARDOUS?
The work exceeds the physical capacity of the worker: 130+lbs vs. 35lbs
Patients movement and transfer involves awkward positioning
Patients represent an unstable load that may shift
Patients are difficult to handle and don’t come with handles which increase the force needed to move them
Daily repetitive handling, lifting and transfers

Section 9: Health Care Industry Injuries
APPROXIMATELY HOW MUCH WEIGHT IS HANDLED DURING A DAY SHIFT?
Daily Handling, Lifting, & Transfers
EXAMPLE
5 case load (dependent) 2 transfers – out of bed, into bed
2 transfers for toileting 3 transfers for dining
5 patients x 7 transfers = 35 transfer events in an 8 hour shift
(which suggests one each 14 minutes)
Add 3 repositionings for each patient each day 5 patients x 3 repositions = 15
That makes approximately 50 handlings during a shift

Section 9: Health Care Industry Injuries
APPROXIMATELY HOW MUCH WEIGHT IS HANDLED DURING A DAY SHIFT?
On average a ‘handling’ means providing 40 pounds of assistance.
(Not unlike moving or repositioning the
equivalent of a bag of topsoil or of mulch)
THEREFORE:
50 handlings x 40 pounds =
2000 pounds or
Source: Fragala 2003

Section 9: Health Care Industry Injuries
EQUIPMENT AND FACILITY DESIGN THAT PUTS EMPLOYEES & PATIENTS IN AWKWARD POSITIONS
Beds not conducive to reposition patient or transfer to/from bed.
Rooms that are cluttered or do
not allow appropriate access to beds, chairs, etc.
Bathing and toileting facilities
that promote sustained and/or awkward employee positioning.
Section 9: Health Care Industry Injuries
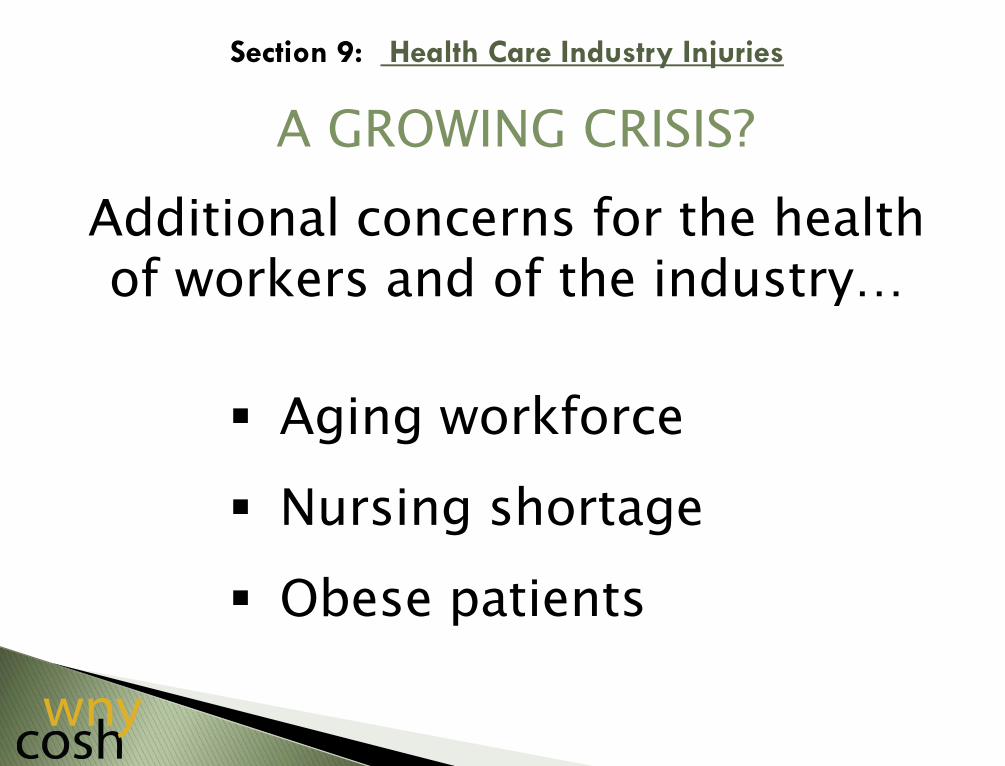
A GROWING CRISIS?
Additional concerns for the health of workers and of the industry…
Aging workforce
Nursing shortage
Obese patients

Section 9: Health Care Industry Injuries
AGING WORKFORCE
An aging workforce in nursing is creating significant problems for the healthcare industry.
With an average age of nurses of 46.8 years, an older workforce brings knowledge and experience to the job, but:
• Can fatigue easily • Have more chronic health issues • May be less physically fit

Section 9: Health Care Industry Injuries
NURSING SHORTAGE
100,000 vacant nursing positions in the US & expected to reach 340,000 by 2020
Increased overtime and mandatory overtime Higher workloads for individual workers Increased stress on workers Potential for more errors
From: Thomas R. Waters, Ph.D., N.I.O.S.H.

Section 9: Health Care Industry Injuries
THE OBESITY EPIDEMIC
Will an obesity epidemic create yet more MSDs among our direct care workers?
More than 30% for the population is considered to be obese More than 66% of the population is overweight In the last 5 years, 50% increase of those 100 lbs. overweight,
75% increase in those more than 100lbs overweight
It is common for healthcare providers to see patients weighting more than 400lbs
Bariatric care is of increasing importance

Section 9: Health Care Industry Injuries
THE OBESITY EPIDEMIC

Section 9: Health Care Industry Injuries
THE OBESITY EPIDEMIC

Section 9: Health Care Industry Injuries
THE OBESITY EPIDEMIC

Section 9: Health Care Industry Injuries
THE HIGH COST OF HEALTH CARE WORK-RELATED MSDS: THE HUMAN TOLL
Work-related MSDs in health care can cause situations for direct caregivers that are:
Life altering
Career ending
Disabling
Chronic (persistent/permanent pain)
Back injury MSDs due to manual handling are the
#1 injury reported in health care.
Lynda Enos. SPH: A Summary of the Issue and Solutions. 2009

Section 9: Health Care Industry Injuries
31% of nurses reported experiencing back pain while working as a nurse
52% complain of chronic (persistent/permanent) back pain
12% of nurses “leaving for good” cite lower back pain as the main reason
Another 12% considered leaving the profession
38% suffered work-related back pain severe enough to require leave from work
Source: D. Stubbs, et al. International Journal of Nursing Studies. 1986. American Nurses Association “Fact Sheet.” 2005
THE HIGH COST OF HEALTH CARE WORK-RELATED MSDS: THE HUMAN TOLL

Section 9: Health Care Industry Injuries
WORKERS’ COMPENSATION COSTS
The direct cost of an average back injury case is $19,000.
Serious cases involving surgery average $85,000 in direct costs.
Indirect costs to health care facilities average between four and ten times
the direct costs.
Fact Sheet #5: Investing in Safe Patient Handling and Movement is Money in the Bank; NYS Zero Lift Task Force Website, Last visited March 31, 2011.

Using the OSHA 300 Log and Forms
OSHA 300 Log – recording incidents
OSHA Form 300A – annual total incident summary
Work-related injuries and exceptions
Injury reporting process
Calculating facility injury rates
Comparing your facility rate to other facilities/national average rates
Calculating Lost Work Day costs from work-related illness/injuries
Workers’ Compensation “Loss Run”
Using the OSHA 300 Log and Forms
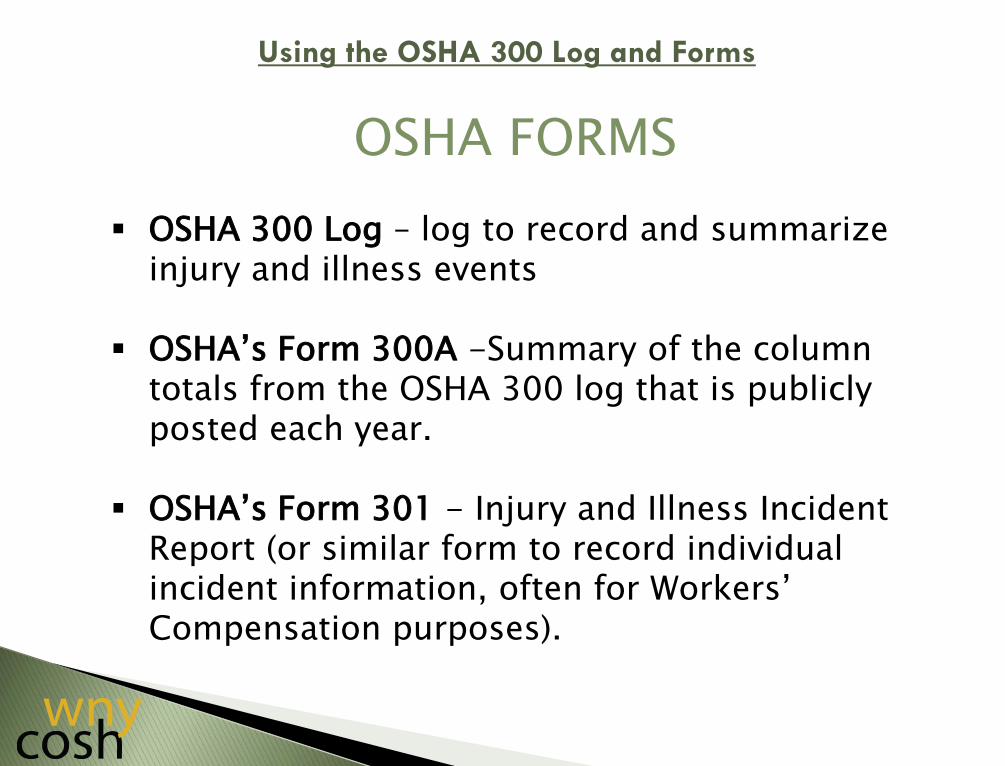
OSHA FORMS
OSHA 300 Log – log to record and summarize injury and illness events
OSHA’s Form 300A -Summary of the column totals from the OSHA 300 log that is publicly posted each year.
OSHA’s Form 301 - Injury and Illness Incident Report (or similar form to record individual incident information, often for Workers’ Compensation purposes).

Using the OSHA 300 Log and Forms
OSHA 300 LOG

Using the OSHA 300 Log and Forms
OSHA’S FORM 300A

Using the OSHA 300 Log and Forms
OSHA’S FORM 300A

Using the OSHA 300 Log and Forms
THE OSHA LOG OF WORK-RELATED INJURIES & ILLNESSES
A summary is mandated by OSHA to be posted annually for employees to see
It is NOT meant to indicate blame
It is NOT an indication of a violation
It is meant as a tool to:
Help eliminate hazards, Create a safe work environment, and Keep employees healthy

Using the OSHA 300 Log and Forms
WORK RELATED INJURIES THAT NEED TO BE RECORDED:
Death Loss of consciousness Days away from work Restricted work activity, or job transfer Medical treatment beyond first aid
Additional Criteria:
Needle sticks Any case that requires the employee to be
medically removed Tuberculosis infection Employees hearing test that has shown a
Standard Threshold Shift (STS)

Using the OSHA 300 Log and Forms
WORK RELATED INJURIES THAT NEED TO BE RECORDED:
Work-related injuries and illnesses
that are significant must be recorded. Any significant work-related injury or illness that
is diagnosed by a physician or other licensed health care professional.
Any work-related case involving cancer, chronic irreversible disease, a fractured or cracked bone, or a punctured eardrum.
See 29 CFR 1904.7.

Using the OSHA 300 Log and Forms
WORK-RELATEDNESS
Cases are work-related if:
An event or exposure in the work environment either caused or contributed to the resulting condition
An event or exposure in the work
environment significantly aggravated a pre-existing injury or illness
CFR. 1904.5

Using the OSHA 300 Log and Forms
WORK-RELATEDNESS
Work-relatedness is presumed for injuries and illness resulting from events or exposures occurring in the work environment.
A case is presumed work-related if, and only if, an
event or exposure in the work environment is a discernible cause of the injury or illness or of a significant aggravation to a pre-existing condition. The work event or exposure need only be one of the discernible causes; it need not be the sole or predominant cause.
CFR. 1904.5

Using the OSHA 300 Log and Forms
WORK-RELATED EXCEPTIONS
Adds additional exceptions to the definition of work relationship to limit recording of cases involving:
Eating, drinking, or preparing food or drink for personal consumption
Common colds and flu
Voluntary participation in wellness or fitness programs
Personal grooming or self-medication
1904.5(b)(2)

Using the OSHA 300 Log and Forms
OSHA FORM 301 INCIDENT REPORT (OR COMPARABLE W.C. STATE FORM)
One of the first pieces of paperwork completed when an employee is injured and is brought to the attention of a facility’s management.
Provides a place to record basic information about who, when, and where the injury occurred.
Also records details of the injury and treatments provided.
May provide place to record details of salary pertinent to compensation for the injured employee.

Using the OSHA 300 Log and Forms
OSHA’S FORM 301
Using the OSHA 300 Log and Forms
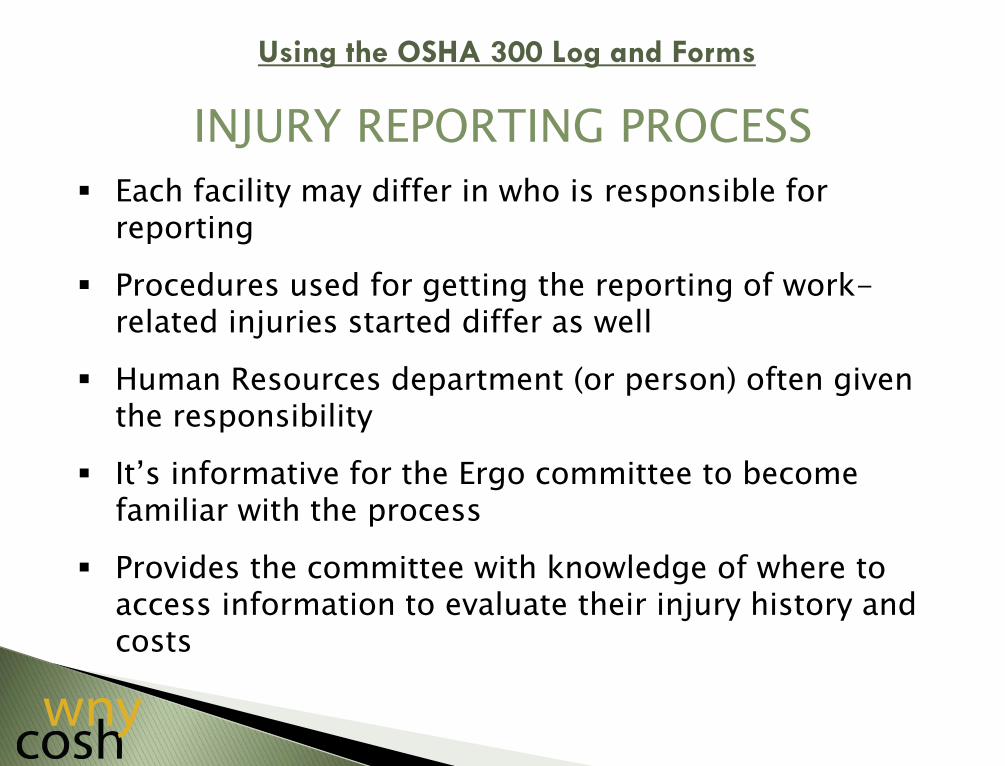
INJURY REPORTING PROCESS
Each facility may differ in who is responsible for reporting
Procedures used for getting the reporting of work-related injuries started differ as well
Human Resources department (or person) often given the responsibility
It’s informative for the Ergo committee to become familiar with the process
Provides the committee with knowledge of where to access information to evaluate their injury history and costs

Using the OSHA 300 Log and Forms
INJURY REPORTING PROCESS, Continued
An incident report is required within 7 days after receipt of information that a work-related injury or illness has occurred.
Forms are available from OSHA, a state’s worker’s compensation department or made individually by a facility.

Using the OSHA 300 Log and Forms
EXAMPLE OF PART OF A NYS WORKER’S COMPENSATION C-3 EMPLOYEE CLAIM FORM

Using the OSHA 300 Log and Forms
EXAMPLE OF PART OF A NYS WORKER’S COMPENSATION C-3 EMPLOYEE CLAIM FORM

Using the OSHA 300 Log and Forms
PROBLEMS WITH CLAIMS CAN INVOLVE:
The medical report submitted on behalf of the claimant fails to reference an injury
That the alleged accident is barred, excluded, or not covered
For example, the accident is:
An exacerbation of prior injury (no new accident);
Intoxication or off-duty athletic activity, or intentionally causing harm to self or others.
That the employer received no notice; that there was improper notice (e.g. To co-workers not supervisor); or that the notice was not timely (beyond 30 days).

Using the OSHA 300 Log and Forms
The employee was transferring a that needed assistance from her bed to a chair. The employee assisted the by steadying her with her arm around her back and holding her arm with her other hand. During the transfer the ’s legs buckled and she began to sink to the floor. The employee maintained contact with the slowing her fall to the floor. As the was lowered to the ground, the employees right knee and back were twisted in an awkward manner.
As the employee lowered the to the ground, her foot was under the falling and the weight of the (225lbs.) collapsed onto the employee’s right leg. The right leg twisted while supporting the and pain was felt in her knee. She also experienced pain in her lower (left) back as she lowered the to the ground.
The employee experienced immediate pain in her right knee and lower back (left side). Later in the day, the right knee showed signs of swelling and the employee was unable to complete her shift due to painful cramping in her back.

Using the OSHA 300 Log and Forms
OSHA 300 LOG

Using the OSHA 300 Log and Forms
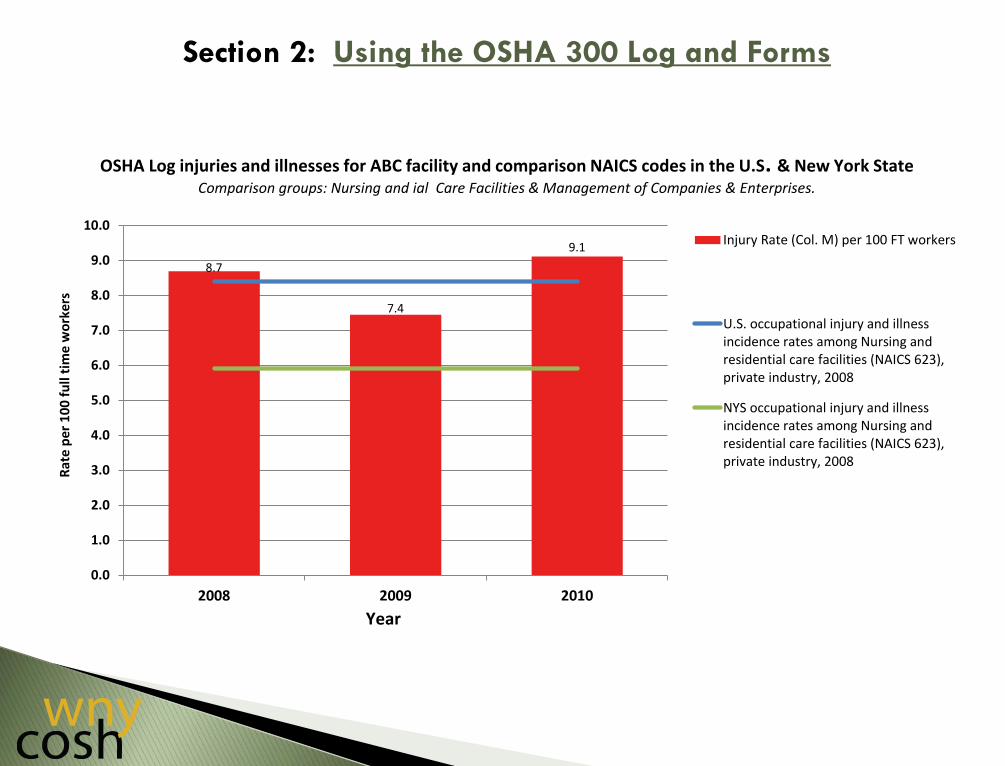
SUMMARIZING YOUR FACILITY’S INJURIES OVER TIME
Collect OSHA form 300A summaries from the previous three to five years
Provides a quick indicator of the size and scope of the injury situation at your facility
You can determine if your rates are increasing or decreasing by dividing the number of injuries by the average number of full time workers (then multiply by 100 to get the rate per 100 FT workers).

Using the OSHA 300 Log and Forms
CALCULATING YOUR RATE
# of injuries/year from col. M of 300 log
13
# of full time workers/year
140 × 100
# to make it comparable to 100 full time workers/year
= 9.3
# injury rate per 100 full time workers/year
Note: Due to the issue of part time workers, the estimates of Full Time Workers at a facility will differ from the number of
people working at the facility. Using hours will result in a more precise figure, but the above number will serve as a
rough number for illustration purposes.

Using the OSHA 300 Log and Forms
CALCULATING INJURY RATES OSHA FORM 300 A:
SUMMARY OF WORK-RELATED INJURIES AND ILLNESSES
A place to find info quickly
Summarizes from the previous 3 - 5 years, providing a quick indicator of the size and scope of your injury situation
Indicates if rates are increasing or decreasing
Includes number of days lost, costs of injuries, rough estimate of overall costs of injuries

Using the OSHA 300 Log and Forms
8.7
7.4
9.1
0.0
1.0
2.0
3.0
4.0
5.0
6.0
7.0
8.0
9.0
10.0
2008 2009 2010
Injury Rate (Col. M) per 100 FT workers
OSHA Log injuries and illnesses for ABC facility and comparison NAICS codes in the U.S. & New York State Comparison groups: Nursing and ial Care Facilities & Management of Companies & Enterprises.
Rat
e p
er 1
00
fu
ll ti
me
wo
rker
s
Year

Section 2: Using the OSHA 300 Log and Forms
8.7
7.4
9.1
0.0
1.0
2.0
3.0
4.0
5.0
6.0
7.0
8.0
9.0
10.0
2008 2009 2010
Injury Rate (Col. M) per 100 FT workers
U.S. occupational injury and illnessincidence rates among Nursing andresidential care facilities (NAICS 623),private industry, 2008
OSHA Log injuries and illnesses for ABC facility and comparison NAICS codes in the U.S. & New York State Comparison groups: Nursing and ial Care Facilities & Management of Companies & Enterprises.
Rat
e p
er 1
00
fu
ll ti
me
wo
rker
s
Year
Section 2: Using the OSHA 300 Log and Forms
8.7
7.4
9.1
0.0
1.0
2.0
3.0
4.0
5.0
6.0
7.0
8.0
9.0
10.0
2008 2009 2010
Injury Rate (Col. M) per 100 FT workers
U.S. occupational injury and illnessincidence rates among Nursing andresidential care facilities (NAICS 623),private industry, 2008
NYS occupational injury and illnessincidence rates among Nursing andresidential care facilities (NAICS 623),private industry, 2008
OSHA Log injuries and illnesses for ABC facility and comparison NAICS codes in the U.S. & New York State Comparison groups: Nursing and ial Care Facilities & Management of Companies & Enterprises.
Rat
e p
er 1
00
fu
ll ti
me
wo
rker
s
Year

Using the OSHA 300 Log and Forms
Nursing and Residential Care Facility Injury & Illness Rates are high compared to
many other industries in the U.S.
Injury & Illness Rates may be different for your state.
IF THEY ARE LOWER FOR YOUR STATE, IS YOUR FACILITY LAGGING IN BEING ABLE
TO REDUCE INJURIES?
IS IT POSSIBLE THAT SPH PROGRAMS ARE RESPONSIBLE FOR LOWERING RATES IN YOUR STATE?

Using the OSHA 300 Log and Forms
0
5
10
15
20
25
30
35
1994 1995 1996 1997 1998 1999 2000 2001 2002 2003 2004 2005 2006 2007 2008 2009
Manufacturing
Motor vehicles & equip
Hospitals
Motor vehicles and car bodies
Nursing & personal care facilities
Injury & Illness incidence rates for selected industry groups , U.S. 1994-2009. Bureau of Labor Statistics: Incidence rates represent the number of injuries and illnesses per 100 full-time workers

Using the OSHA 300 Log and Forms

Using the OSHA 300 Log and Forms
DETERMINE A REASONABLE ESTIMATE OF AVERAGE SALARY FOR THE
WORKFORCE AT THE FACILITY
Human Resources:
Use an average salary If unsure, be conservative so that subsequent
estimates aren’t considered to be inflated. ($10 per hour, $80 per day, $20,000 per
year*).
* From www.payscale.com, for Certified Nurse Assistant (CNA), U.S. average salary $10.13)

Using the OSHA 300 Log and Forms
$48,240
$17,280
$30,160
$0
$10,000
$20,000
$30,000
$40,000
$50,000
$60,000
2008 2009 2010
ABC Rehab
Co
st o
f Lo
st W
ork
day
s
'Cost' of Lost Work Days from Work Related Illness & Injuries

Using the OSHA 300 Log and Forms
WHAT DOES WORKERS’ COMPENSATION INSURANCE COVER?
Direct Costs Only Medical costs include:
Medical treatment of injuries Drug costs Indemnity costs include:
Time loss costs Temporary & permanent disability payments Fatality costs/awards Vocational assistance costs Settlement costs Claim expense costs
Source: OR OSHA

SPH Programs – Costs vs. Benefits
SUMMARY
Studies of facilities that adopt SPH programs show huge reductions in:
Injuries Workers’ Comp costs Medical costs Indemnity costs Lost Work Days Absenteeism Staff turnover Mandatory overtime Increased morale/productivity
STUDIES ALSO SHOW A RETURN ON INVESTMENT
IN APPROXIMATELY THREE (3) YEARS.

SRH Programs – Costs vs. Benefits
RESEARCH HAS SHOWN THAT FOR PATIENTS SPH PROGRAMS:
A decrease in combativeness (with use of lifting equipment)
Patients report feeling more comfortable/secure
Reduced shearing injuries in patients
Reduction in falls
Increase in physical functioning & activity level
Source: Lynda Enos, 2009.

GROUP ACTIVITY 4
Page 21 of Student Workbook Guide

Return to Work (RTW) Programs
in a SPH Environment
Benefits of RTW programs for injured workers
Benefits of RTW programs for employers
Medical Managements programs
Obstacles to RTW programs
Overcoming obstacles

Return-to-Work Programs in a SRH Environment
COMP: THE UPSIDE/DOWNSIDE
Workers’ Comp = wage replacement
Wage replacement is only partial
The compensation process is adversarial
Needed medical treatment is delayed
Some injured healthcare workers end up on disability

Return-to-Work Programs in a SPH Environment
SPH: A Philosophy and Practice for
Returning Injured Workers to Their Health Care Careers?

Return-to-Work Programs in a SPH Environment
“Return to Work programs are a proven, cost-effective way to control the effects of
disability and absenteeism in the workplace, and work in the interests of the employer and the employee. The goal of any good Return to Work program is the safe and
timely return of employees to transitional or regular employment.”
NYS Return to Work Task Force, 2009
ARE RTW PROGRAMS EFFECTIVE?

Return-to-Work Programs in a SPH Environment
WHY INJURED WORKERS CAN BENEFIT
After 6 month absence from work, the odds of returning to full employment drops to 50%
After a year’s absence it drops to 25%
After 2 year’s absence it drops to near zero
Compensation rates in total or partial disability cases never match real earnings at the pre-injury level.
Source: Steve Levin, MD, RTW Advisory Council
Return-to-Work Programs in a SPH Environment
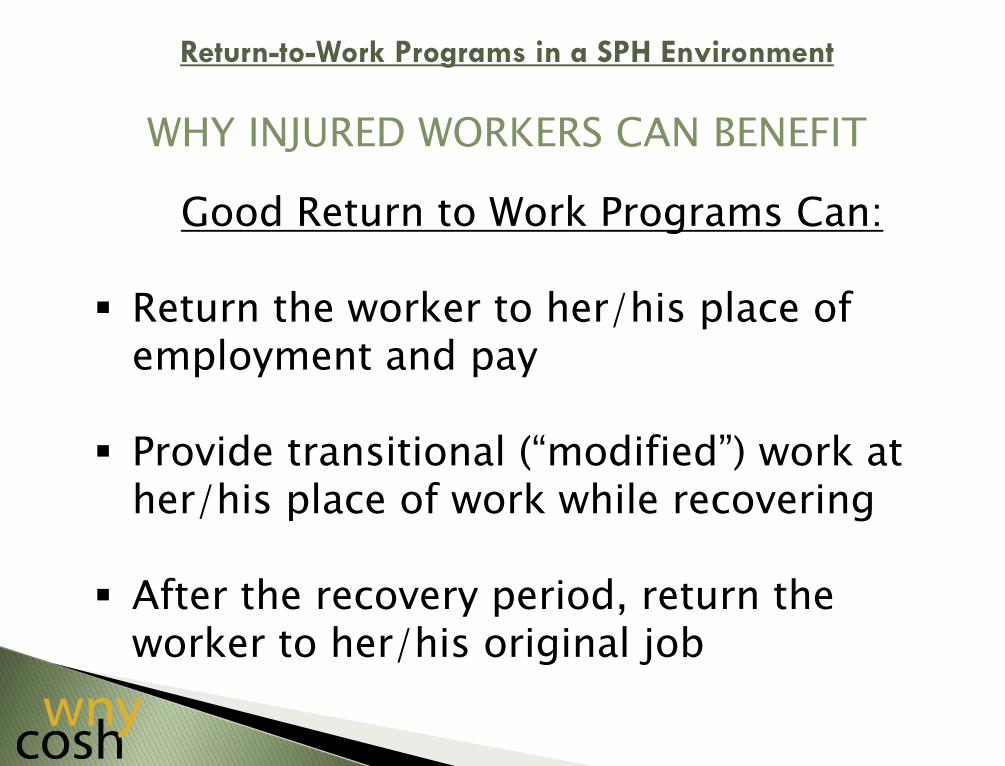
WHY INJURED WORKERS CAN BENEFIT
Good Return to Work Programs Can:
Return the worker to her/his place of employment and pay
Provide transitional (“modified”) work at her/his place of work while recovering
After the recovery period, return the worker to her/his original job

Return-to-Work Programs in a SPH Environment
WHY EMPLOYERS CAN BENEFIT
Return to Work Programs Have Been Shown to Reduce:
Frequency and duration of lost time
Workers’ Compensation costs
Medical and indemnity costs
Litigation
Wage replacement costs
Use of short/long-term disability benefits
Productivity loss
Return-to-Work Programs in a SPH Environment
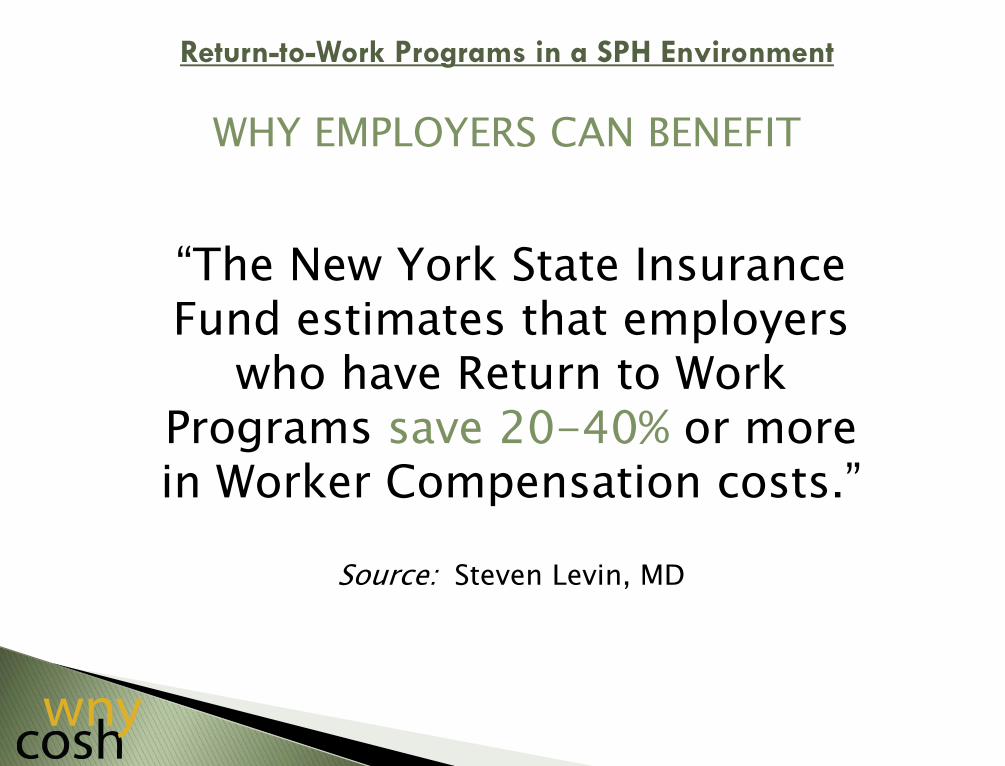
“The New York State Insurance Fund estimates that employers
who have Return to Work Programs save 20-40% or more in Worker Compensation costs.”
Source: Steven Levin, MD
WHY EMPLOYERS CAN BENEFIT
Return-to-Work Programs in a SPH Environment
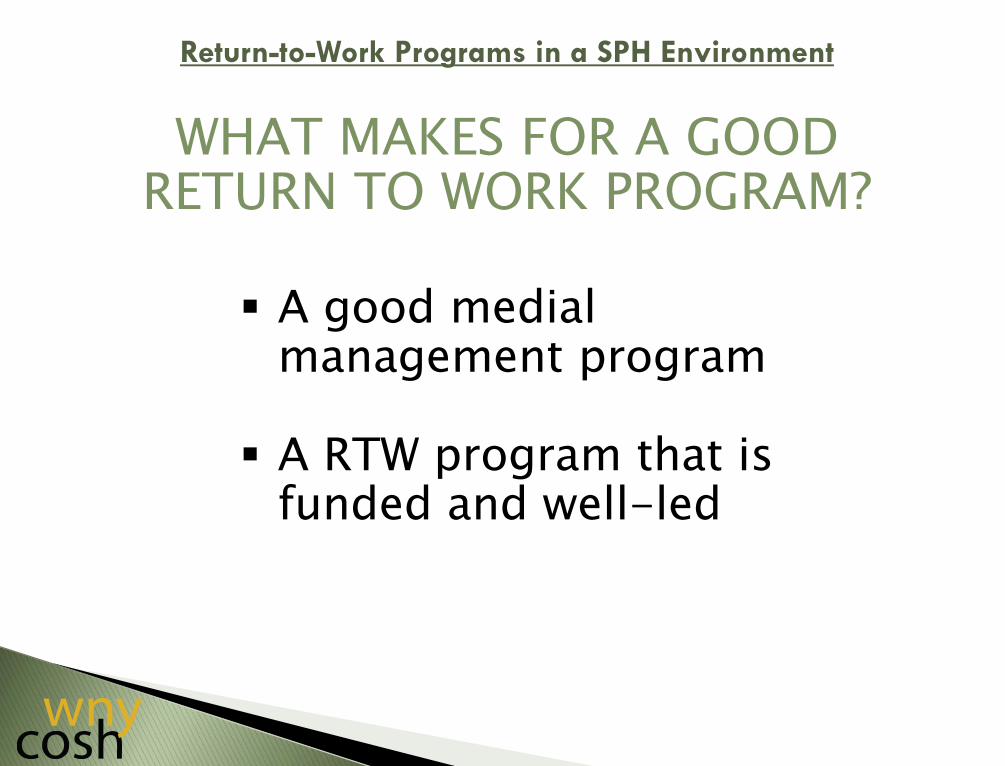
WHAT MAKES FOR A GOOD RETURN TO WORK PROGRAM?
A good medial management program
A RTW program that is funded and well-led
Return-to-Work Programs in a SPH Environment
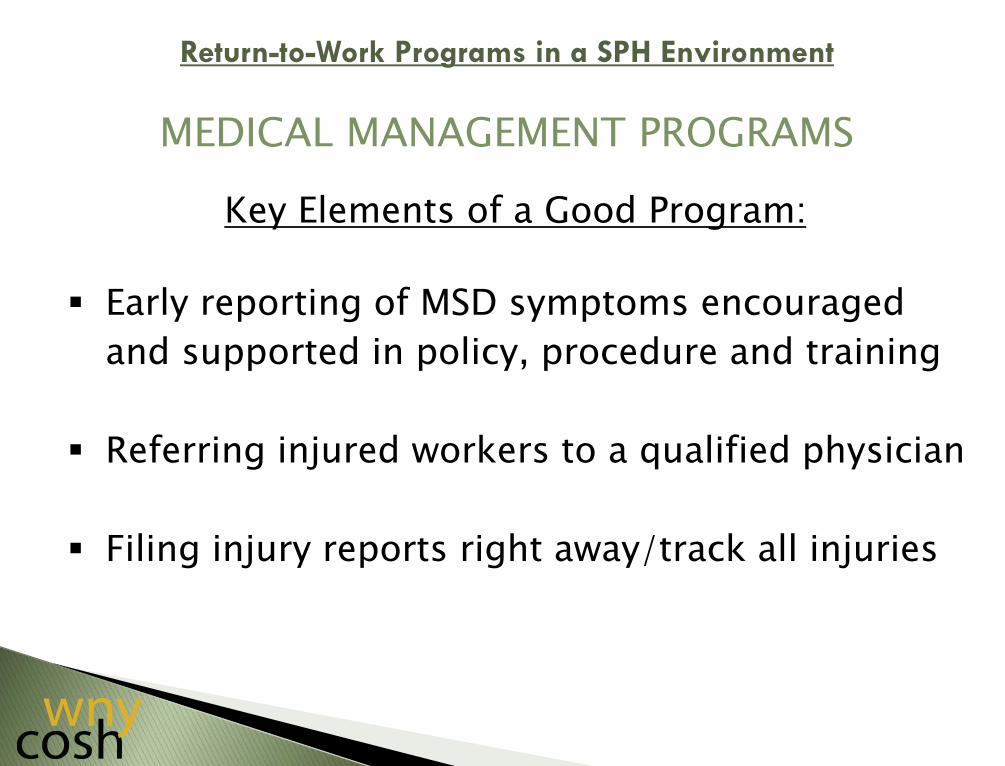
MEDICAL MANAGEMENT PROGRAMS
Key Elements of a Good Program:
Early reporting of MSD symptoms encouraged
and supported in policy, procedure and training
Referring injured workers to a qualified physician
Filing injury reports right away/track all injuries

Return-to-Work Programs in a SPH Environment
MEDICAL MANAGEMENT PROGRAMS
Key Elements of a Good Program:
Ensure Workers’ Comp forms filled out Set up a Return to Work program with modified work
provisions and coordination
Learn from injury – advise SPH/Ergo Team
Team gets at root causes of injuries – when, where and frequency of occurrence

Return-to-Work Programs in a SPH Environment
7 PRINCIPLES FOR SUCCESSFUL RETURN TO WORK PROGRAMS
1) Workplace has a strong commitment to SPH
2) Employer makes an offer of modified work for injured/ill employee
3) RTW planners ensure a plan that supports returning the worker to her/his regular job
4) Supervisors trained in disability prevention

Return-to-Work Programs in a SPH Environment
7 PRINCIPLES FOR SUCCESSFUL RETURN TO WORK PROGRAMS
5) Employer makes an early and considerate contact with injured workers
6) Someone is designated to coordinate the RTW program
7) Employers and health care providers communicate with each other
NYS Return to Work Advisory Council, 2009

Return-to-Work Programs in a SPH Environment
“My own real experience taking care of injured or ill workers is that only in rare
occasions have I been successful at getting them back to work in their pre-injury
workplace. The most frequent response to inquiries regarding availability of modified duty to accommodate a worker’s temporary
(or permanent) functional limitations has been: ‘They need to be able to do their old
job or I can’t take them back’.”
Source: Steve Levin, MD, RTW Advisory Council
OBSTACLES

Return-to-Work Programs in a SPH Environment
OBSTACLE: THE INJURED WORKER
The Injured Worker May Be an Obstacle Due to:
Resentment – modified work is often menial
Fear of exacerbating the injury
Fear of hostility from co-workers

Return-to-Work Programs in a SPH Environment
“In unionized workplaces, collective bargaining solutions, or statutory ADR
(alternative dispute resolution) remedies for issues involving and related to return to work, re-employment and job protection
should be honored or approved solutions for compliance with this program.”
Source: NYS Return to Work Advisory Council, 20009
OVERCOMING OBSTACLES: THE INJURED WORKER

Return-to-Work Programs in a SPH Environment
OVERCOMING OBSTACLES: THE INJURED WORKER
RTW Program Should Emphasize the Positive (Not Stigmatize)
Relevant/safe modified work
Look at what work a worker can/can’t do
Work with physician – ascertain level of restriction
Accommodate worker – regular schedule
Non-punitive approach – injuries happen

Return-to-Work Programs in a SPH Environment
OBSTACLE: CO-WORKERS
Resentment that injured worker is fully salaried
Resentment she/he isn’t pulling full weight
Resentment that co-worker got injured

Return-to-Work Programs in a SPH Environment
OVERCOMING OBSTACLES: CO-WORKERS
RTW Program Should Emphasize the Value of the Injured Worker in the Unit
Remind All: Many healthcare workers are
“working injured”
Accidents can happen, even with A SPH program
Modified work duty can help the unit
Transition back to old job benefits us all

Return-to-Work Programs in a SRH Environment
OBSTACLE: MANAGEMENT
Resentment worker got injured
Resentment worker is costing the facility
Resentment the worker is a malingerer
Too difficult to find worker useful, modified work duty

Return-to-Work Programs in a SPH Environment
OVERCOMING OBSTACLES: MANAGEMENT RTW Program Should Emphasize Value of
Injured Worker to Your Facility:
$$ spent transitioning vested, experienced worker to old job vs. $$ training new hire
Can remain closer to being fully staffed
Shorter amount of time paying overtime/replacement worker
Transitioning worker can perform valuable tasks in the SPH environment
Reduce Workers’ Comp costs