Introduction to RPC Group/media/Files/R/RPC-Group/documents... · Introduction to RPC Group ......
29
Introduction to RPC Group September 2017 101 THE ESSENTIAL INGREDIENT RPC Group Plc Introduction to RPC Group September 2017
Transcript of Introduction to RPC Group/media/Files/R/RPC-Group/documents... · Introduction to RPC Group ......
Introduction to RPC GroupSeptember 2017
101
THE ESSENTIAL INGREDIENT
RPC Group PlcIntroduction to RPC Group
September 2017

Introduction to RPC GroupSeptember 2017
102
The Group, markets and strategySetting the scene 3Brexit impact? 8RPC Group Strategy: Vision 2020 10Back up 23

Introduction to RPC GroupSeptember 2017
103Setting the scene

Introduction to RPC GroupSeptember 2017
104
A leading global plastic product design and engineering company for packaging and selected non-packaging markets
Europe 75%North America 17%Asia 4%Rest of World 4%
RPC Sales 2016/17 – by destination*
Food 29%Non-Food 26%Personal Care 12%Beverage 11%Healthcare 5%Technical Components 17%
RPC Sales 2016/17 – by end market*
£1.7bn*by end market by region
£1.7bn*
*Pro forma to include a full year of completed acquisitions
€4bn+sales
194+operations
34+countries
32+innovation
centres
24,900+employees
€4bn*By end market
€4bn*By region
Introduction to RPC GroupSeptember 2017
105
Global footprint
RPC Group is well placed to support its customers globallywith leading design and engineering capabilities
• Over 194 operations in 34 countries and 32 design & engineering centres
• Over 24,900 employees
• Major European plastic converter
• Industry leading innovator
• Listed on London StockExchange - 1993
• Member of the FTSE 250
Where we manufactureWhere we sell

Introduction to RPC GroupSeptember 2017
106
Corporate history
0
50
100
150
200
250
£0
£500
£1,000
£1,500
£2,000
£2,500
£3,000
£3,500
£4,000
91 92 93 94 95 96 97 98 99 00 01 02 03 04 05 06 07 08 09 10 11 12 13 14 15 16 17 18 19
UK growth phase Mainland European growth phase Consolidation Selective growth
Turnover (£m) Operating sites
Promens and Pet Power acquisitions
FlotationMBO
Acquisition of Wiko division
M&H acquisition
Superfos acquisitionAcquisition of 11 sites from Rexam / Nampak
Various smaller acquisitions
Ace acquisition
Turnover: ReportedTurnover: Analyst expectations*Number of operating sites
GCS and BPI acquisitionsAcquisition of Schmalbach-Lubeca’s plastics division
Impact of Letica
* Based on 9 analysts at 19 July 2017
Introduction to RPC GroupSeptember 2017
107
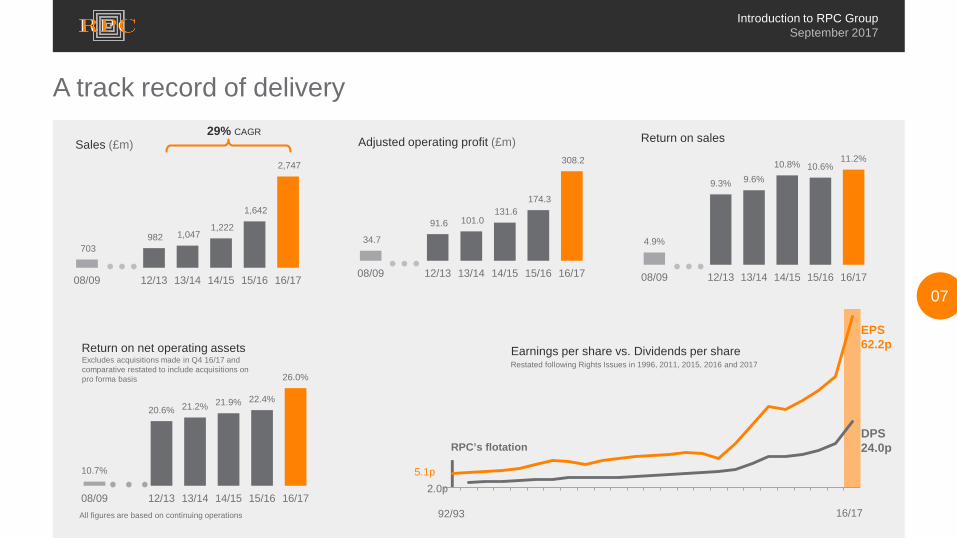
10.7%
20.6% 21.2% 21.9% 22.4%
26.0%
08/09 12/13 13/14 14/15 15/16 16/17
A track record of delivery
703 982 1,047
1,222
1,642
2,747
08/09 12/13 13/14 14/15 15/16 16/17
Sales (£m)
4.9%
9.3% 9.6%10.8% 10.6%
11.2%
08/09 12/13 13/14 14/15 15/16 16/17
34.7
91.6 101.0 131.6
174.3
308.2
08/09 12/13 13/14 14/15 15/16 16/17
Return on salesAdjusted operating profit (£m)29% CAGR
Earnings per share vs. Dividends per share
EPS62.2p
DPS24.0pRPC’s flotation
2.0p
16/17
Restated following Rights Issues in 1996, 2011, 2015, 2016 and 2017
5.1p
• • • • • • • • •
92/93
Return on net operating assets
All figures are based on continuing operations
Excludes acquisitions made in Q4 16/17 and comparative restated to include acquisitions on pro forma basis
Introduction to RPC GroupSeptember 2017
108Brexit impact?
Introduction to RPC GroupSeptember 2017
109
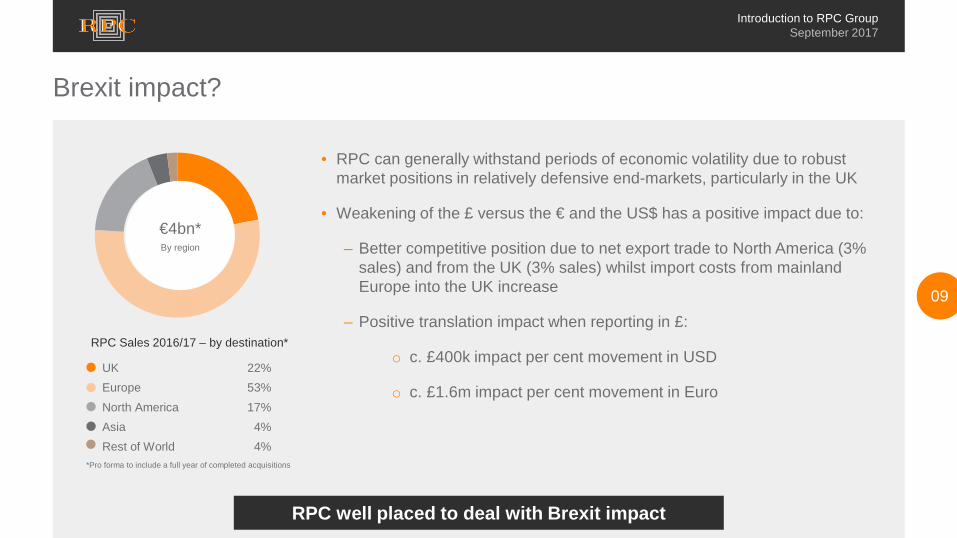
Brexit impact?
UK 22%Europe 53%North America 17%Asia 4%Rest of World 4%
RPC Sales 2016/17 – by destination*
€4bn*By region
• RPC can generally withstand periods of economic volatility due to robust market positions in relatively defensive end-markets, particularly in the UK
• Weakening of the £ versus the € and the US$ has a positive impact due to:
– Better competitive position due to net export trade to North America (3% sales) and from the UK (3% sales) whilst import costs from mainland Europe into the UK increase
– Positive translation impact when reporting in £:
o c. £400k impact per cent movement in USD
o c. £1.6m impact per cent movement in Euro
RPC well placed to deal with Brexit impact
*Pro forma to include a full year of completed acquisitions
Introduction to RPC GroupSeptember 2017
110RPC Group Strategy: Vision 2020

Introduction to RPC GroupSeptember 2017
111
High added value niche strategy outside Europe
Plastic packaging is forecast to grow by 5.1% outside Europe whilst 75% of RPC’s sales are currently in Europe
Plastic packaging - whilst concentrated in selective niches -remains a largely segmented market
Plastic packaging market forecast to grow by 4.4% globally in the next five years with 2.3% growth in Europe
Vision 2020: focused growth
Source: Smithers Pira, 2015
Innovative design and engineering company
Leading consolidatorin Europe
FOC
USE
D G
RO
WTH
Continuing focus on organic growth
Selective consolidationin Europe
Creating a meaningful presence outside Europe
Pursuing added value opportunities in nonpackaging markets
Growing high value added products
A strategic extension of RPC’s core competencies – focus on selected niches where opportunities exist to add value

Introduction to RPC GroupSeptember 2017
112
Opportunities for organic growth
Paper Paper
Metal MetalGlass Glass
Rigid plastic
Rigid plastic
2015 2020
Rigid packaging market projections
Source: Smithers Pira, 2015
$ Billions, based on constant prices and exchange rates
Plastic continues to advance at the expense of competing materials
Europeby packaging type
Rest of
World
Rest of
World
2015 2020
EuropeEurope
CAGR
1.7%
4.4%
3.5%
Globalby region
CAGR
1.4%
2.3%
1.9%
(0.5)%
1.7%
$630
$755
$177$193
FOC
USE
D G
RO
WTH
Selective consolidationin Europe
Creating a meaningful presence outside Europe
Continuing focuson organic growth
Pursuing added value opportunities in nonpackaging markets
Introduction to RPC GroupSeptember 2017
113
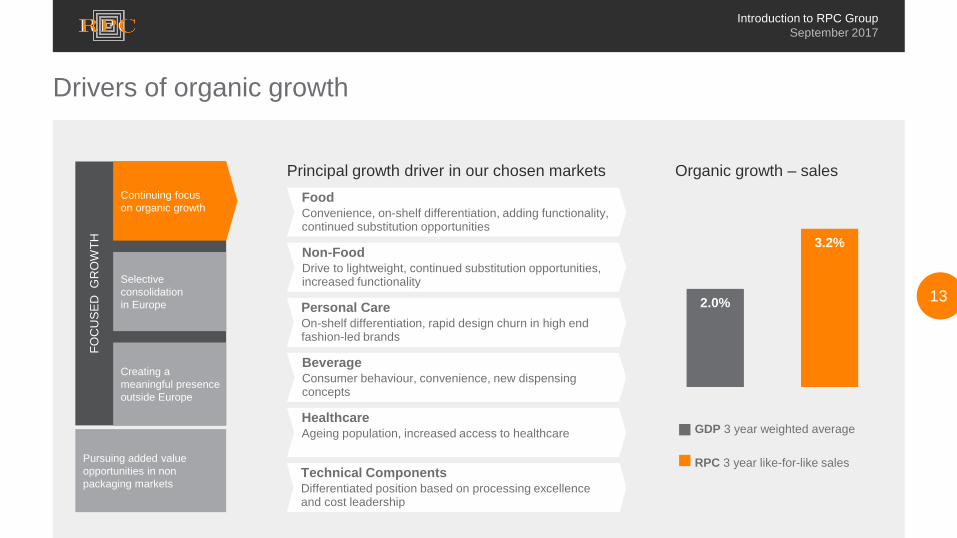
Drivers of organic growthFO
CU
SED
GR
OW
TH
Selective consolidationin Europe
Creating a meaningful presence outside Europe
Continuing focuson organic growth
Pursuing added value opportunities in nonpackaging markets
Organic growth – sales
GDP 3 year weighted average
RPC 3 year like-for-like sales
Non-FoodDrive to lightweight, continued substitution opportunities, increased functionality
Personal CareOn-shelf differentiation, rapid design churn in high end fashion-led brands
BeverageConsumer behaviour, convenience, new dispensing concepts
HealthcareAgeing population, increased access to healthcare
Technical ComponentsDifferentiated position based on processing excellence and cost leadership
FoodConvenience, on-shelf differentiation, adding functionality, continued substitution opportunities
Principal growth driver in our chosen markets
2.0%
3.2%

Introduction to RPC GroupSeptember 2017
114
Leveraging our key strengths
Strong market positionsin selected segments
FOC
USE
D G
RO
WTH
Selective consolidationin Europe
Creating a meaningful presence outside Europe
Continuing focuson organic growth
Driven byindustry leading
management teamsProcess and operational excellencein addition to cost leadership– conversion cost and polymer buying
Leading design and innovation capabilitiesacross all conversion technologies
Blue chip customer basePursuing added value opportunities in nonpackaging markets
Introduction to RPC GroupSeptember 2017
115
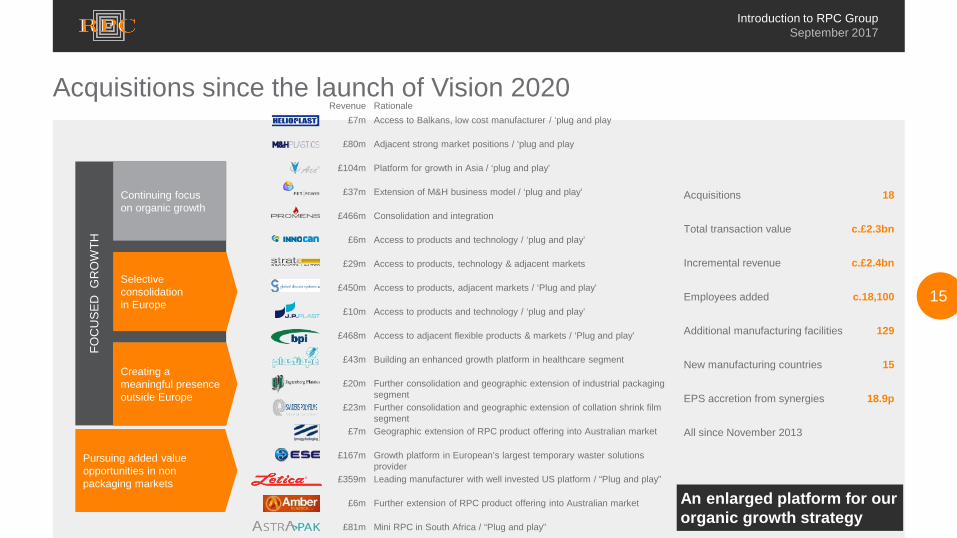
Revenue Rationale£7m Access to Balkans, low cost manufacturer / ‘plug and play
£80m Adjacent strong market positions / ‘plug and play
£104m Platform for growth in Asia / ‘plug and play’
£37m Extension of M&H business model / ‘plug and play’
£466m Consolidation and integration
£6m Access to products and technology / ‘plug and play’
£29m Access to products, technology & adjacent markets
£450m Access to products, adjacent markets / ‘Plug and play’
£10m Access to products and technology / ‘plug and play’
£468m Access to adjacent flexible products & markets / ‘Plug and play’
£43m Building an enhanced growth platform in healthcare segment
£20m Further consolidation and geographic extension of industrial packaging segment
£23m Further consolidation and geographic extension of collation shrink film segment
£7m Geographic extension of RPC product offering into Australian market
£167m Growth platform in European’s largest temporary waster solutions provider
£359m Leading manufacturer with well invested US platform / “Plug and play”
£6m Further extension of RPC product offering into Australian market
£81m Mini RPC in South Africa / “Plug and play”
FOC
USE
D G
RO
WTH
Selective consolidationin Europe
Creating a meaningful presence outside Europe
Continuing focuson organic growth
An enlarged platform for ourorganic growth strategy
Acquisitions since the launch of Vision 2020
Creating a meaningful presence outside Europe
Pursuing added value opportunities in nonpackaging markets
Acquisitions 18
Total transaction value c.£2.3bn
Incremental revenue c.£2.4bn
Employees added c.18,100
Additional manufacturing facilities 129
New manufacturing countries 15
EPS accretion from synergies 18.9p
All since November 2013
Introduction to RPC GroupSeptember 2017
116
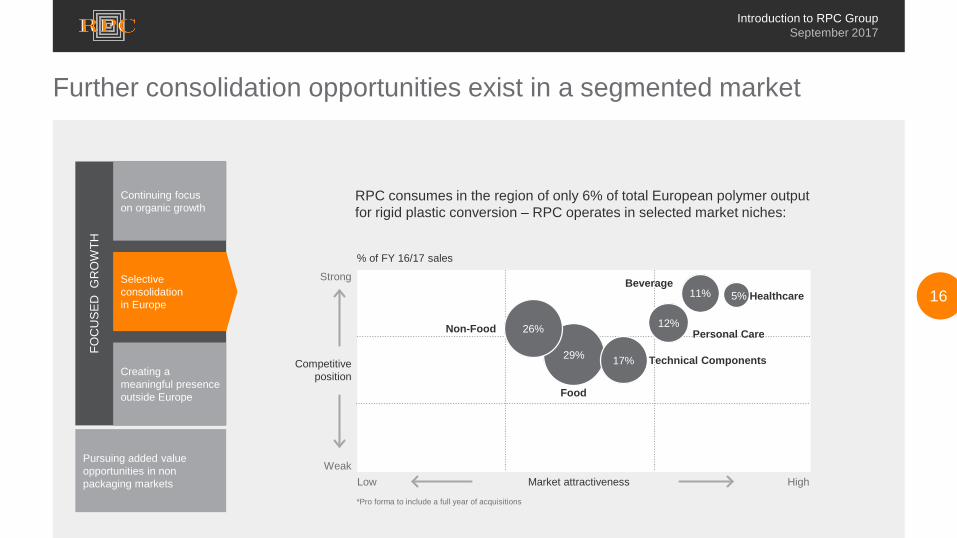
29%
26% 12%
11% 5%
17%
HighLow Market attractiveness
Competitiveposition
Weak
Strong
% of FY 16/17 sales
Further consolidation opportunities exist in a segmented market
RPC consumes in the region of only 6% of total European polymer output for rigid plastic conversion – RPC operates in selected market niches:
FOC
USE
D G
RO
WTH
Selective consolidationin Europe
Creating a meaningful presence outside Europe
Continuing focuson organic growth
Pursuing added value opportunities in nonpackaging markets
Food
Non-Food Personal Care
BeverageHealthcare
Technical Components
*Pro forma to include a full year of acquisitions
Introduction to RPC GroupSeptember 2017
117
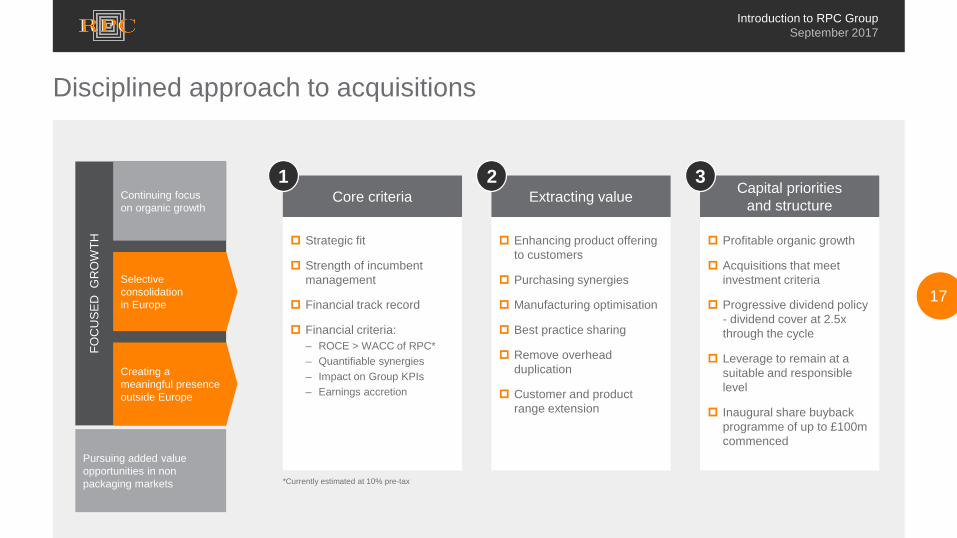
Disciplined approach to acquisitions
Enhancing product offering to customers
Purchasing synergies
Manufacturing optimisation
Best practice sharing
Remove overhead duplication
Customer and product range extension
Profitable organic growth
Acquisitions that meet investment criteria
Progressive dividend policy - dividend cover at 2.5x through the cycle
Leverage to remain at a suitable and responsible level
Inaugural share buyback programme of up to £100m commenced
*Currently estimated at 10% pre-tax
Strategic fit
Strength of incumbent management
Financial track record
Financial criteria:– ROCE > WACC of RPC*– Quantifiable synergies– Impact on Group KPIs– Earnings accretion
Capital prioritiesand structure
3Extracting valueCore criteria
21
FOC
USE
D G
RO
WTH
Selective consolidationin Europe
Creating a meaningful presence outside Europe
Continuing focuson organic growth
Pursuing added value opportunities in nonpackaging markets
Introduction to RPC GroupSeptember 2017
118
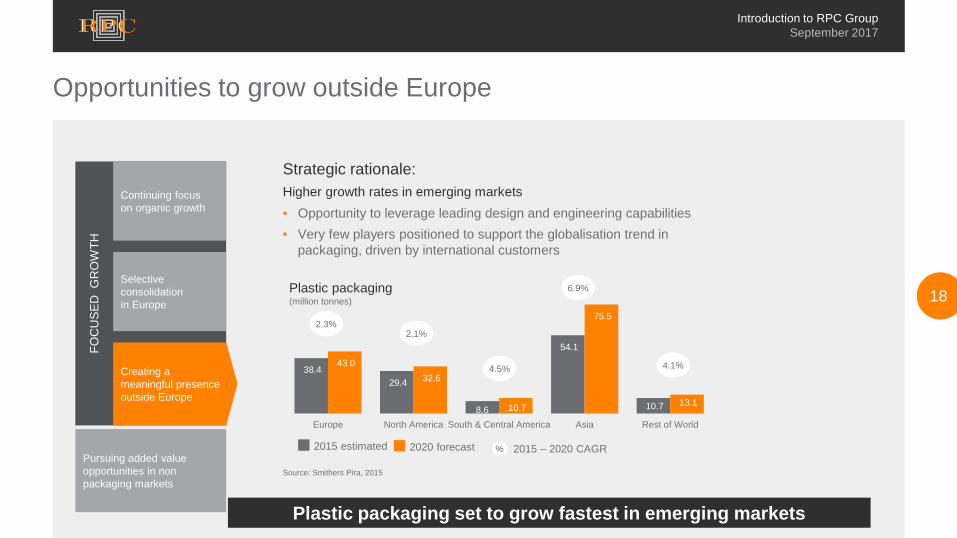
38.4 29.4
8.6
54.1
10.7
43.0 32.6
10.7
75.5
13.1
Europe North America South & Central America Asia Rest of World
Opportunities to grow outside Europe
Strategic rationale:Higher growth rates in emerging markets
Plastic packaging set to grow fastest in emerging markets
FOC
USE
D G
RO
WTH
Selective consolidationin Europe
Creating a meaningful presence outside Europe
Continuing focuson organic growth
Pursuing added value opportunities in nonpackaging markets
Source: Smithers Pira, 2015
• Opportunity to leverage leading design and engineering capabilities• Very few players positioned to support the globalisation trend in
packaging, driven by international customers
Plastic packaging(million tonnes)
2015 estimated 2020 forecast % 2015 – 2020 CAGR
2.3%2.1%
4.5%
6.9%
4.1%

Introduction to RPC GroupSeptember 2017
119
Approach to growth outside Europe
• Follow our customers globally utilising design and engineering capabilities
FOC
USE
D G
RO
WTH
Selective consolidationin Europe
Creating a meaningful presence outside Europe
Continuing focuson organic growth
Pursuing added value opportunities in nonpackaging markets
• Looking for solid platforms or greenfield where appropriate
• Continued investment in existing operations
• Export processing excellence across enlarged footprint

Introduction to RPC GroupSeptember 2017
120
Moulds£67m11 sites
Roto moulding£120m10 sites
Speciality vehicles£92m3 sites
Asian precision engineering platform£109m5 sites
Extracting value from core competences
Industry leading engineering capabilities
Strategy:
Continue to build world class mould making capacity for internal and external customers
Build on leading European position and leverage branded products worldwide
Continue to create value in selective niches
Focus on growing high added value co-engineered products, packaging and non-packaging
Industry leading technical capabilities
Leading position in Europe, scale in polymer purchasing
Design and engineering excellence, scale in polymer purchasingFO
CU
SED
GR
OW
TH
Selective consolidationin Europe
Creating a meaningful presence outside Europe
Continuing focuson organic growth
Key source ofcompetitive advantage:
Technical Components
RPC Sales*2016/1717%
*Pro forma to include a full year of acquisitions
Pursuing added value opportunities in nonpackaging markets
Temporary waste solutions£173m3 sites
Largest “pure play” temporary waste storage provider in Europe
Build on leading European position and brands
Flexible construction products£53m4 sites
Market leader in water proofing and other construction materials
Build on leading market position and brands

Introduction to RPC GroupSeptember 2017
121
Pursuing added value opportunities in non-packaging marketsRPC can leverage its core competences of design and engineering of plastic products together with a competitive buying position of the main raw materials used, in a number of selected non-packaging markets. World class in-house mould-making allows RPC to deliver technically challenging projects for its customers
Summary Vision 2020 strategy
Selective consolidation in EuropeWith a limited number of consolidators, further acquisition opportunities exist in a segmented market place. RPC continues to seek opportunities that either enhance and strengthen its presence in existing markets or represent attractive complementary markets
Creating a meaningful presence outside Europe Packaging markets outside Europe are forecast to grow faster with multi-national customers indicating an increasing demand for RPC’s leading design and engineering capabilities
Continuing focus on organic growthPlastic continues to advance at the expense of competing materials. Innovative solutions built on excellence in design and engineering, positions RPC for above GDP organic growth
3 year weighted average GDP 3 year RPC like-for-like sales
38.4 29.4
8.6
54.1
10.7
43.0 32.6
10.7
75.5
13.1
Europe North America South & Central America Asia Rest of World
Plastic packaging(million tonnes)
6%RPC’s consumption of total Western European polymer output for rigid plastic packaging
Moulds 11%Roto moulding 20%Speciality vehicles 15%Asian precision engineering platform 18%Temporary waste solutions 28%Flexible construction products 8%
2015 estimated 2020 forecast % 2015 – 2020 CAGR
2.3%2.1%
4.5%
6.9%
4.1%
£614m*Technical
Components
*Pro forma to include a full year of acquisitions
2.0%
3.2%

Introduction to RPC GroupSeptember 2017
122
Why RPC GroupLeading design and engineering business in a growing and globalising market
• Strong market shares in chosen product market segments
• Cost leadership in both conversion cost and raw material buying
Creating value through consolidating fragmented market in Europe
• Leading industry consolidator in a highly segmented market
• Strong track record of delivery
• Strict acquisition criteria in placeAcquisitions
Total transaction value
Incremental revenue
Employees added
18
c.£2.3n
c.£2.4bn
c. 18,100
129
15
18.9p
Additional manufacturing facilities
New manufacturing countries
EPS accretion from synergies
All since November 2013Where we manufactureWhere we sell
Organic growth opportunities• Innovation, design and engineering capabilities across all
plastic conversion technologies
• Increasing demand for higher added value products in fast growing emerging markets
Attractive dividend streams• Progressive dividend policy since flotation in 1993
• Dividend cover targeted at 2.5x earnings through the cycle
Introduction to RPC GroupSeptember 2017
123Back up

Introduction to RPC GroupSeptember 2017
124
The plastic packaging market
MetalRigid
Plastic
Flexible
Glass
Paper
EuropeValue: $839bnCAGR: 3.5%
2015-20
Global Packaging Market(1)
PlasticsPackaging Market(2)
Source: Smithers Pira(1) 2015 - Global packaging market, materials, by value(2) 2015 - Global packaging market, materials & regions, by value

Introduction to RPC GroupSeptember 2017
125
Conversion processes
Our competitors tend to specialise in only one technology. Thanks to our strategic acquisitions over the years we have expertise, R&D and production facilities, that allows RPC to offer the widest range of options to customers.
ThermoformingBlow mouldingInjection moulding
High volumeLow cost
Barrier applications
Re-closableNarrow neck
Pourable
Complex designsHigh level decoration
High added value
Rotational moulding Blown film extrusion
Multilayer co-extruded filmsFilm, tube & sheet productsPlain, printed or converted
Extremely versatileLow tooling costsSmaller volumes

Introduction to RPC GroupSeptember 2017
126
Award winning design and innovation
UK Packaging
Awards
ScanStarAwards
Winner2016
FPA Awards
WinnerProcessor of the Year 2014Training and Development
Programme of the Year 2014Apprentice of the Year 2015
Plastic Industry Awards
Continue to focus on organic growth built on innovationOver 50 award winners and finalists since 2012
Winner & Finalist2016
PLC Awards
Winner2015
World Food Innovation
Awards
Winner2015
WorldStarAwards
Winner2014, 2015 & 2016
Winner2013, 2014, 2015
& 2016
WinnerCompany of the Year
2014 & 2015 Product Categories: Winners & Finalists
2013, 2014, 2015 & 2016
WinnerCompany of the Year
2015
Hong Kong Innovative
Technologies & Manufacturing
UK Stock Market Awards
WinnerBest Industrial Goods, Services
& Automobiles PLC2016
Norwegian Award for
Design Excellence
Introduction to RPC GroupSeptember 2017
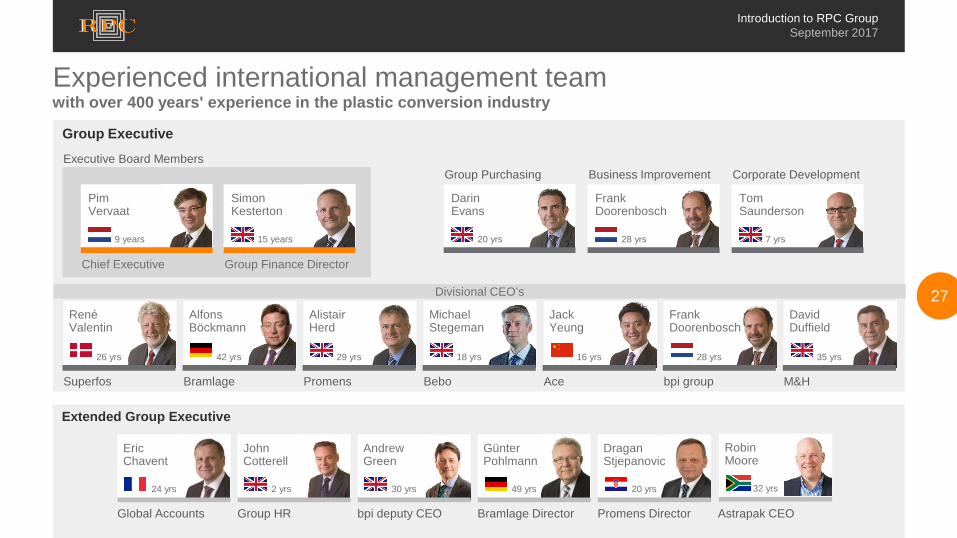
127Divisional CEO’s
Chief Executive
Executive Board Members
Group Finance Director
Group Purchasing Business Improvement Corporate Development
Superfos Bramlage Promens Bebo Ace
Pim Vervaat
Simon Kesterton
9 years 15 years
Darin Evans
Frank Doorenbosch
Tom Saunderson
7 yrs28 yrs20 yrs
Group Executive
Extended Group Executive
bpi group
Frank Doorenbosch
RenéValentin
Alfons Böckmann
Alistair Herd
Michael Stegeman
JackYeung
David Duffield
26 yrs 29 yrs 16 yrs42 yrs 18 yrs 28 yrs 35 yrs
M&H
Eric Chavent
John Cotterell
Andrew Green
Günter Pohlmann
Dragan Stjepanovic
24 yrs 2 yrs 30 yrs 49 yrs 20 yrs
Global Accounts Group HR bpi deputy CEO Bramlage Director Promens Director
Experienced international management teamwith over 400 years' experience in the plastic conversion industry
RobinMoore
32 yrs
Astrapak CEO
Introduction to RPC GroupSeptember 2017
128
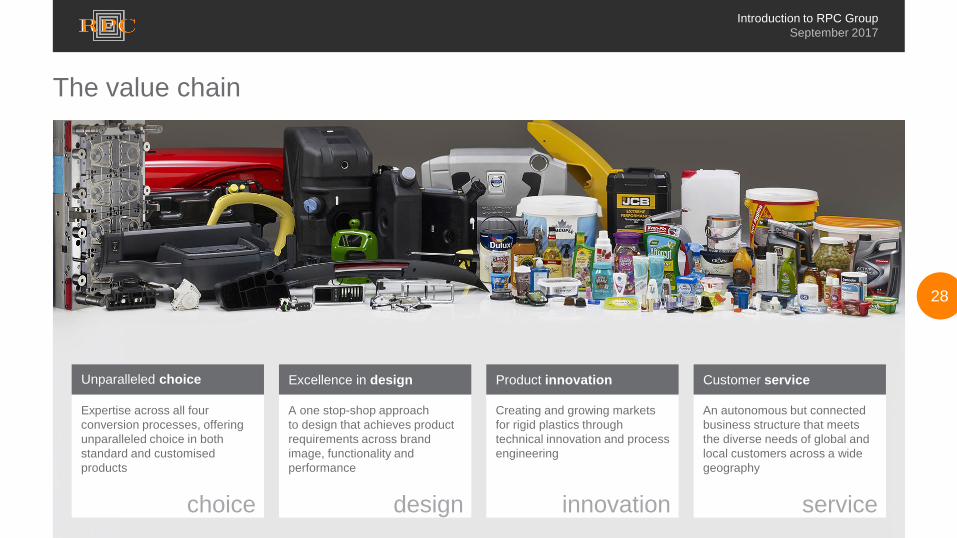
The value chain
Expertise across all four conversion processes, offering unparalleled choice in both standard and customised products
A one stop-shop approach to design that achieves product requirements across brand image, functionality and performance
Creating and growing markets for rigid plastics through technical innovation and process engineering
An autonomous but connected business structure that meets the diverse needs of global and local customers across a wide geography
Unparalleled choice Excellence in design Product innovation Customer service
choice design innovation service

Introduction to RPC GroupSeptember 2017
129Forward looking statements
This presentation contains forward-looking statements, which:have been made by the directors in good faith based on the information available to them up to the time of their approval of this presentation; and should be treated with caution due to the inherent uncertainties, including both economic and business risk factors, underlying such forward-looking information.The Group undertakes no obligation to update these forward-looking statements and nothing in this presentation should be construed as a profit forecast.