INTRODUCTION TO RICKY - B2B Marketingmrkto.b2bmarketing.net/rs/085-VAB-435/images/13.40...report on...
37
1 INTRODUCTION TO RICKY Pictures and bio
Transcript of INTRODUCTION TO RICKY - B2B Marketingmrkto.b2bmarketing.net/rs/085-VAB-435/images/13.40...report on...

1
INTRODUCTION TO RICKY
Pictures and bio
2
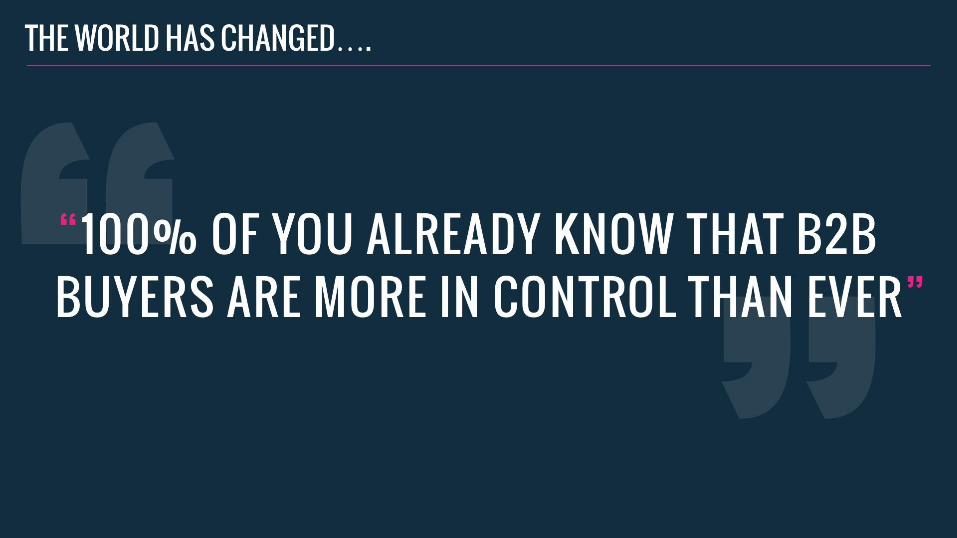
THE WORLD HAS CHANGED….
Buyers are more in control than
ever.
Statistic about how much
research an average decision
maker is taking before they buy
Put copy on screen saying
‘Interesting stat to show how in
control the buyer is’ need it to
be tongue in cheek
3
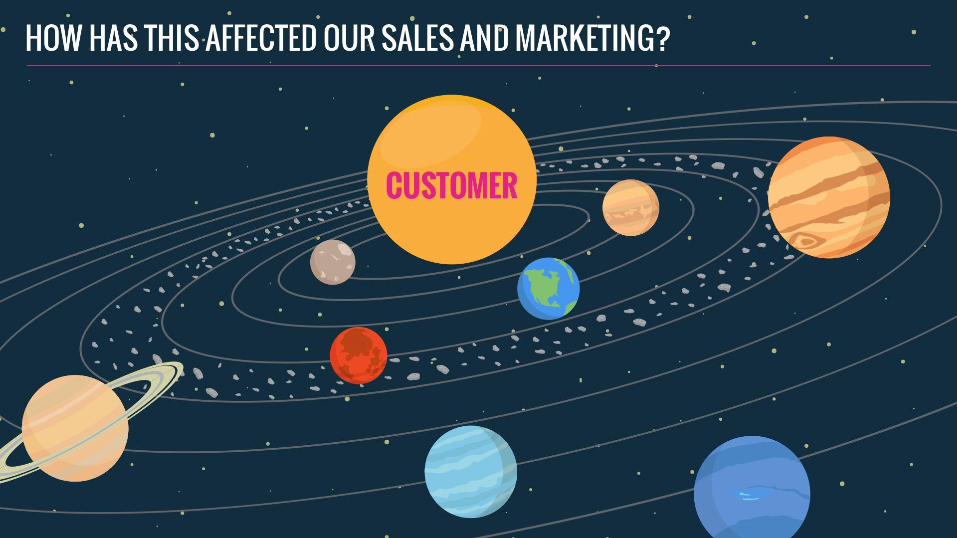
HOW HAS THIS AFFECTED OUR SALES AND MARKETING?
We are now being driven to be
more customer centric
A picture of a customer in the
middle, us showing how we are
adapting to their needs.
Maybe us praying at their feet
or something to show how
we’re being more customer
centric

4
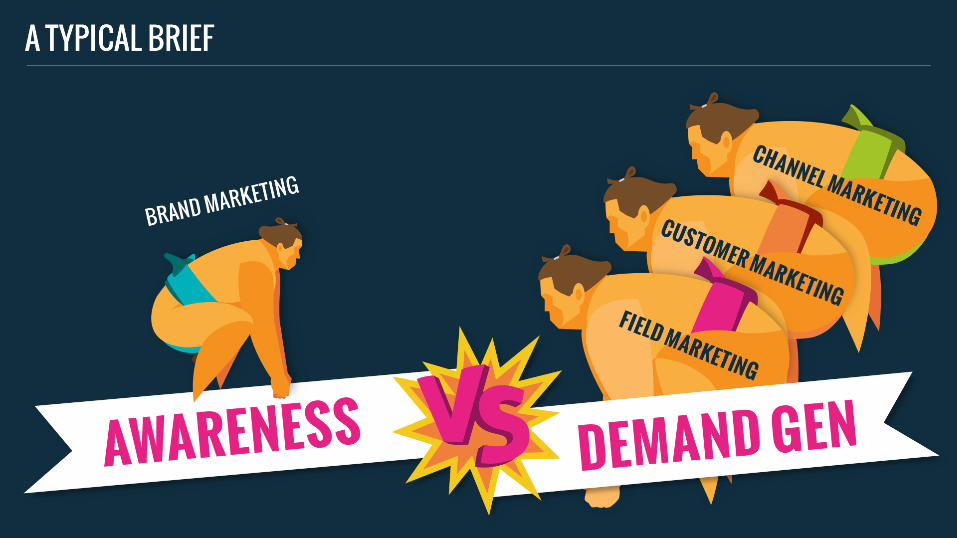
IS THAT THE REALITY OF WHAT WE DO THOUGH?
No, we still think in silo’s because it’s a hang-up of a day gone by.
At Pulse, we are still getting briefs every day which are:
I want to drive awareness but actually I’ll measure the success on number of leads
OR
Can you help with a ATL or BTL campaign?
Divide this into two slides, one slide shows four silos ‘field marketing’ ‘brand marketing’ ‘customer marketing’ ‘channel
marketing’ ‘communications’ etc.
Second slide shows in big writing ‘awareness vs. demand generation’ and also ‘ATL vs. BTL’
5

6
WHY IS THIS?
Well it’s because marketers used to be focused on awareness
(fluffy pictures and colouring in), then there was the era of
lead generation (everything was about the number of leads
generated) and now it’s moving to revenue (how much
pipeline did marketing attribute). What’s next, profit?
It means that we are often short circuiting the entire buyer
journey and going straight to tactics and whatever will drive
revenue.
Show a timeline and show ‘clouds’ first, then show ‘business
cards’ and then show ‘££’ show how we’re migrating from
fluffy metrics to more demand. Have an animation which then
shows an email, event icons come up to highlight the need to
go tactical

7
REVENUE IS IMPACTED BY REPUTATION AND RELATIONSHIP
Put up the three R’s, without reputation and relationship you
cannot drive revenue.
A three sided triangle with Revenue, Reputation and
Relationship

8
ENTER ABM
Just a slide with the above
writing on it

9
ABM IS ABOUT TAKING THE CUSTOMER THROUGH A JOURNEY
Show a customer journey and how ABM is a discipline and affects all stages of the journey
Put up a customer journey showing ad, get an email, watch a webinar, see another ad, read
an article on the register, see a social post from a sales person at that company, speak to some
peers, go to an event on subject x, read an article about the subject in the economist, get a
piece of DM, see an airport ad, get served a search ad, a social ad, email from the sales
person, engage etc.
Basically we are showing the buyer journey is not a linear process and actually they’ve gone
from ‘awareness’ into ‘demand’ back to ‘awareness’ and then back to demand. If done
correctly, ABM effects all of these. Have an ABM icon appear next to all tactics.
10
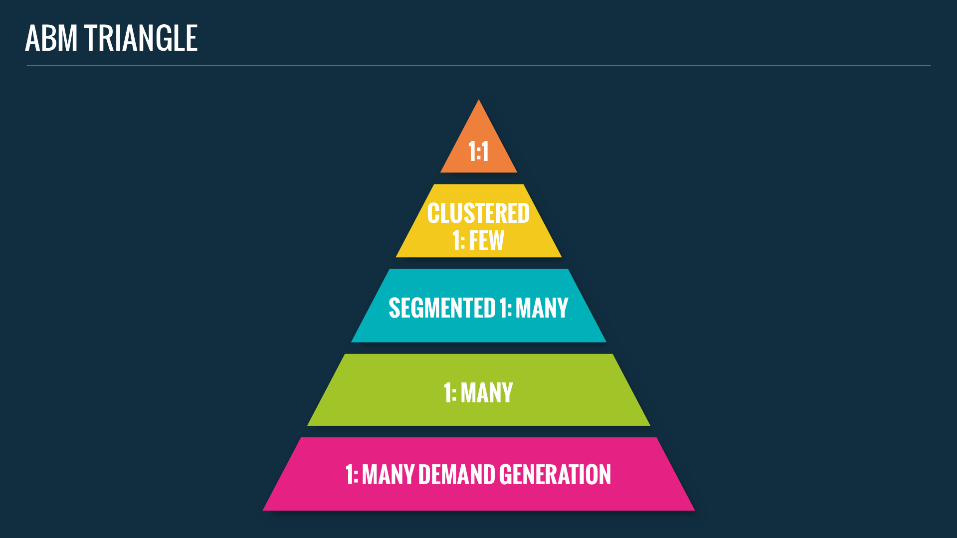
ABM TRIANGLE
Don’t spend long on this, put
the variations of ABM up but
not the descriptions
Don’t show the demand
generation and brand
awareness layers

11
WHERE DOES DATA HELP
Show the triangle but this time
1’s and 0’s in every layer of
ABM

12
SO LET’S LOOK AT ANY ABM PROGRAM
Put four main headings:
1. Strategy and Insight
2. Content and Creative
3. Activation
4. Reporting
Probably need to put some examples of ABM items under each of these so. Write as many different things that sit under each
heading and then animate the slide so then highlight all of the items:
- Strategy and Insight: TAM & Account Segmentation, Persona creation, stakeholder maps, audience insight, account profiles,
buyer behaviour research, vertical analysis
- Content and Creative: Creative propositions, content research, content audits, value propositions/messaging frameworks,
creative proposition, campaign theme, content creation/repurposing, asset creation, web/mobile dev
- Activation: strategic activation plans, customer journey maps, campaign orchestration, nurture stream builds,
tagging/trafficking, community creation, media plans, database build
- Reporting: reporting framework, KPI setting, sales insight, campaign reporting, strategic ABM reporting
State afterwards that we have might have used data as part of a project e.g. looking at our CRM data and that is a great first
step but actually leveraging some of the big data platforms is the way forward.

13
FOR TODAY, WE WILL FOCUS ON A FEW ELEMENTS
We’ll focus on these main four and the use of data for todays session
- Strategy and Insight: Account Segmentation
- Content and Creative: content research
- Activation: strategic activation plans, customer journey maps
- Reporting: strategic ABM reporting

OUR CLIENTS
STRATEGY AND INSIGHTS

15
WHAT’S THE CURRENT LANDSCAPE
Sales and marketing create an
account list using existing CRM
wins and/or recent use cases
Need to visually show these two
examples on screen
16
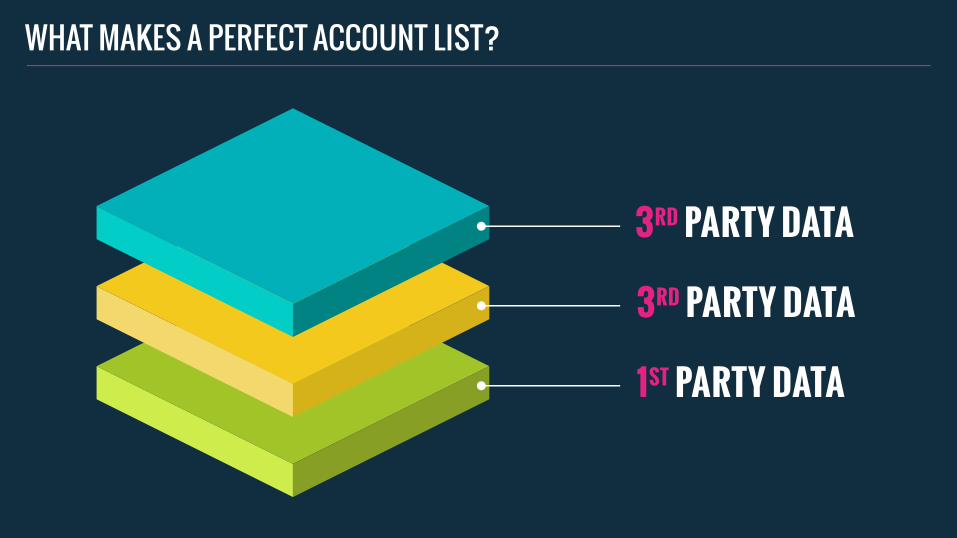
WHAT MAKES A PERFECT ACCOUNT LIST
Understanding account
behaviours outside your own
data and by looking at other
data factors as to why a
customer became a customer

17
ENTER INTENT AND PREDICTIVE ANALYTICS

18
IF USED CORRECTLY, YOU CAN
• Tell which accounts are in market
• What audiences within those accounts are
interested in
• Audience watering holes
• The message to hit them with
• Ideal upsell/cross sell opportunities
• Potential retention worries
• Pain points of customers
Create a table with two columns, audience and
account and put all of the above under those two
headings
This can then show how it can be used for content,
personas/stakeholders, activation, reporting
Audience Account
What audiences within those
accounts are interested in Which accounts are in market
Where audiences go to consume
information Ideal upsell/cross sell opportunities
The message to hit them with Potential retention worries

19
WHAT THIS COULD LOOK LIKE
Vodafone are showing a high
propensity because we can see
their CIO has been actively
looking at security topics
relevant to us and it is because
they have had a recent breach.

OUR CLIENTS
CONTENT & CREATIVE
21
WHAT’S THE CURRENT LANDSCAPE?
Most content is created based
on ‘gut’ feel

22
WHAT MAKES PERFECT CONTENT
Authorship
Relevance
Engagement
Tone
Format
We can make sure we cover authorship, engagement and even tone but relevance and tone is
tougher. Up to date, we make assumptions then hope these are correct.
In an ABM world, data can be used to ensure you are hitting the account and individual with
content they actually care about.
23
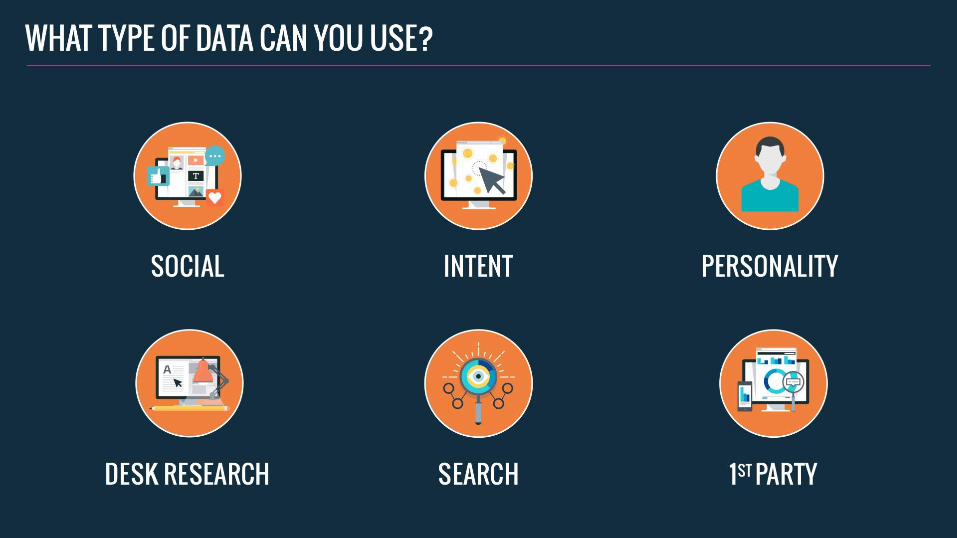
WHAT TYPE OF DATA CAN YOU USE?
Social
Intent
Personality
Desk research
Search
1st party

24
WHAT THIS COULD LOOK LIKE?
Vodafone at specifically looking
at content around cyber
security, the CIO cares about
security breaches and is
consuming video content mostly
sent from his peers, they are
mostly talking about AI and
effect on security. There are a
host of trending topics related
to this that would be beneficial
to use as well.
We need to show how this can
be used:
Content
Activation
Reporting

OUR CLIENTS
ACTIVATION

26
WHAT’S THE CURRENT LANDSCAPE?
• Insight based data is old by
the time we activate
• It’s usually an afterthought
• Very rarely orchestrated to
report on true ABM success
On the last point, need to talk
about how I’ve seen some ABM
kpi’s from other agencies and
they are a joke. They are
basically high level metrics that
are almost immeasurable
because the foundations e.g.
nitty gritty data around
campaign activation hasn’t
been sorted out properly
27
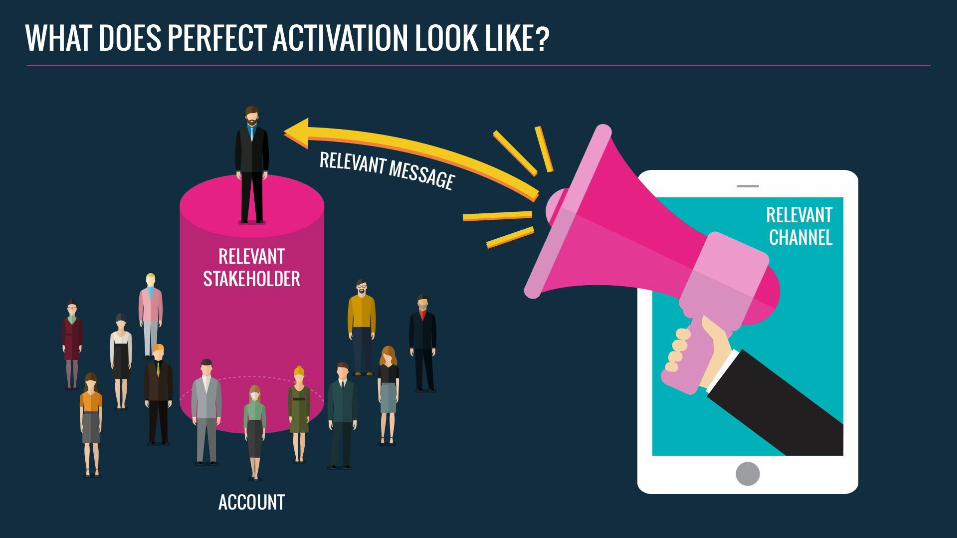
WHAT DOES PERFECT ACTIVATION LOOK LIKE?
Engaging suitable account(s)
with a relevant message to a
specific persona/stakeholder at
the right buying stage with the
right content on the most
relevant channel

28
HOW CAN DATA HELP?
It knits together the whole
journey, perhaps show one
spider diagram without
everything linked and then
show the below
This leads to better:
Reporting
Optimisation
Customer Experience


30
WHAT’S THE CURRENT LANDSCAPE
We have spent too long:
• Focusing on tactics (talk
about content)
• Without the full picture
• Influenced by sales
• Unable to prove how we’ve
influenced opportunities

31
WHAT MAKES PERFECT ABM REPORTING?
Ensuring we are satisfying the
needs of three audiences:
• Sales
• Marketing
• Board
Put ticks next to each of them

32
HOW DATA CAN HELP?
If you’ve orchestrated
correctly, you can know show
how each tactic is working, via
the message at an account
level.
Show another layer of boxes
outside with reporting, gray
everything out in the middle.
33
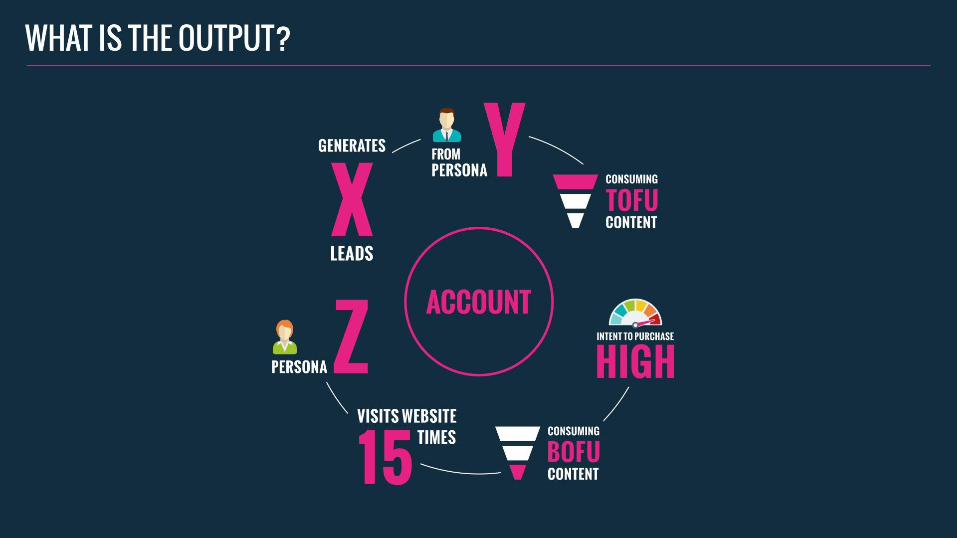
WHAT IS THE OUTPUT
Reports that can tell you the
following:
This account has generated x
number of leads from Persona
Y, X consuming top of funnel
content. The account has also
come to the website 15 times
specifically reading bottom of
funnel content and we think
this is persona z and the
account has showed a high level
of intent to purchase.
Next actions are x, y and z

34
IMPORTANTLY…..
Influenced vs. sourced vs.
engaged.

35
AGILE METHODOLOGY
Talk about how agile
methodology is key for an ABM
deployment because it’s
multiple stakeholders that are
key!


www.pulsecomms.com
Thank you