Introduction to Quantitative Geology
32
Intro to Quantitative Geology www.helsinki.fi/yliopisto Introduction to Quantitative Geology Advection of the Earth’s surface: Fluvial incision and rock uplift Lecturer: David Whipp david.whipp@helsinki.fi 20.11.2017 3
Transcript of Introduction to Quantitative Geology

Intro to Quantitative Geology www.helsinki.fi/yliopisto
Introduction to Quantitative Geology
Advection of the Earth’s surface:Fluvial incision and rock uplift
Lecturer: David [email protected]
20.11.2017
3
www.helsinki.fi/yliopistoIntro to Quantitative Geology
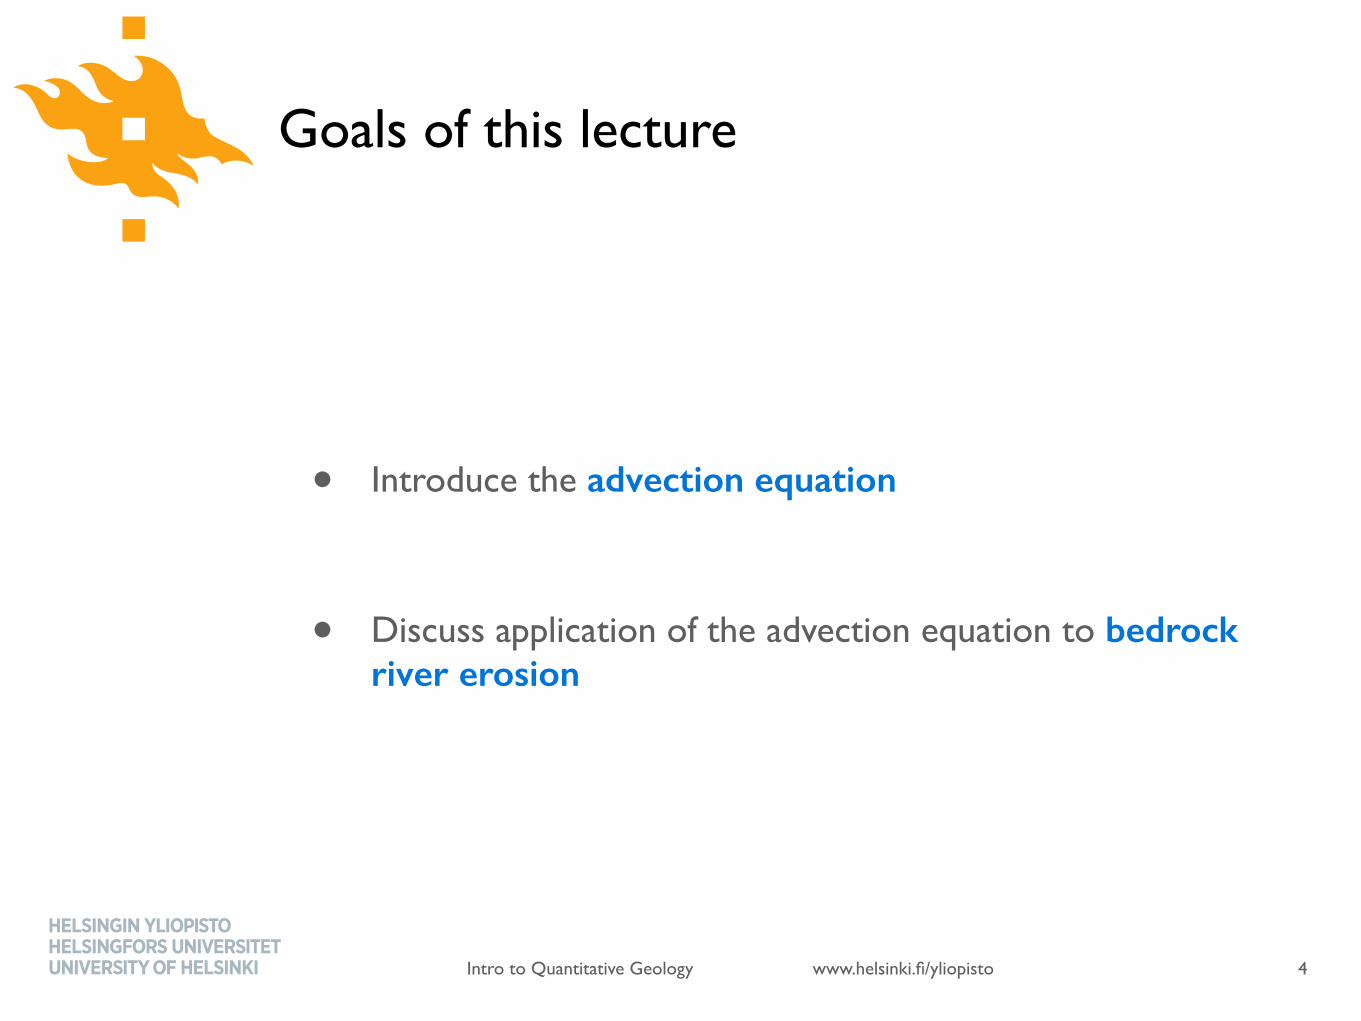
Goals of this lecture
• Introduce the advection equation
• Discuss application of the advection equation to bedrock river erosion
4
www.helsinki.fi/yliopistoIntro to Quantitative Geology
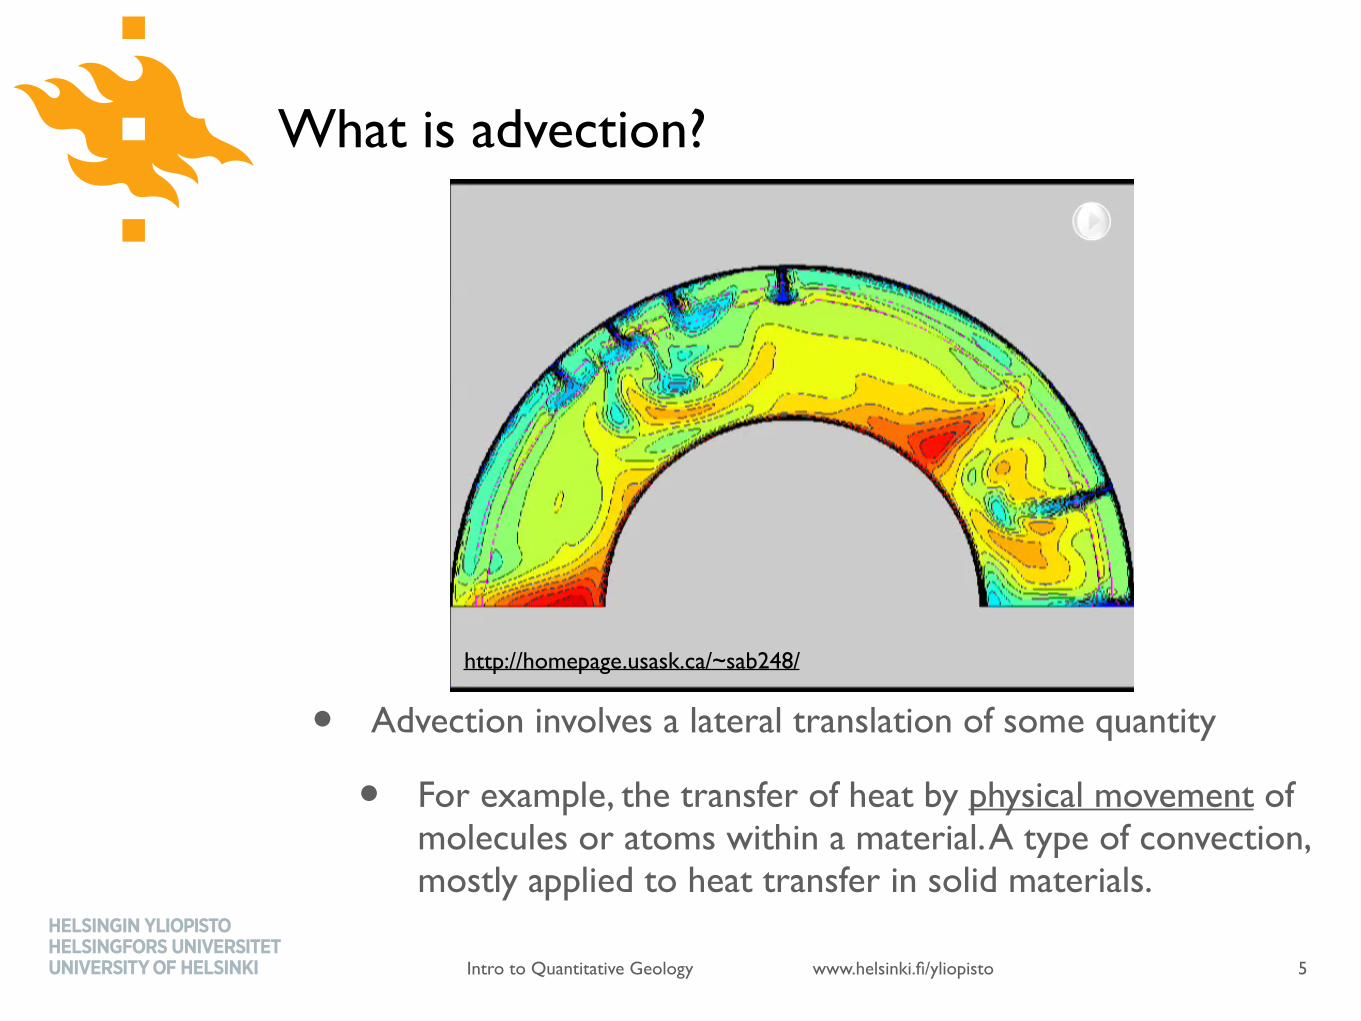
What is advection?
• Advection involves a lateral translation of some quantity
• For example, the transfer of heat by physical movement of molecules or atoms within a material. A type of convection, mostly applied to heat transfer in solid materials.
5
PICTURE HERE
http://homepage.usask.ca/~sab248/

www.helsinki.fi/yliopistoIntro to Quantitative Geology
@h
@t
= �1
⇢
@q
@x
q = �⇢
@h
@x
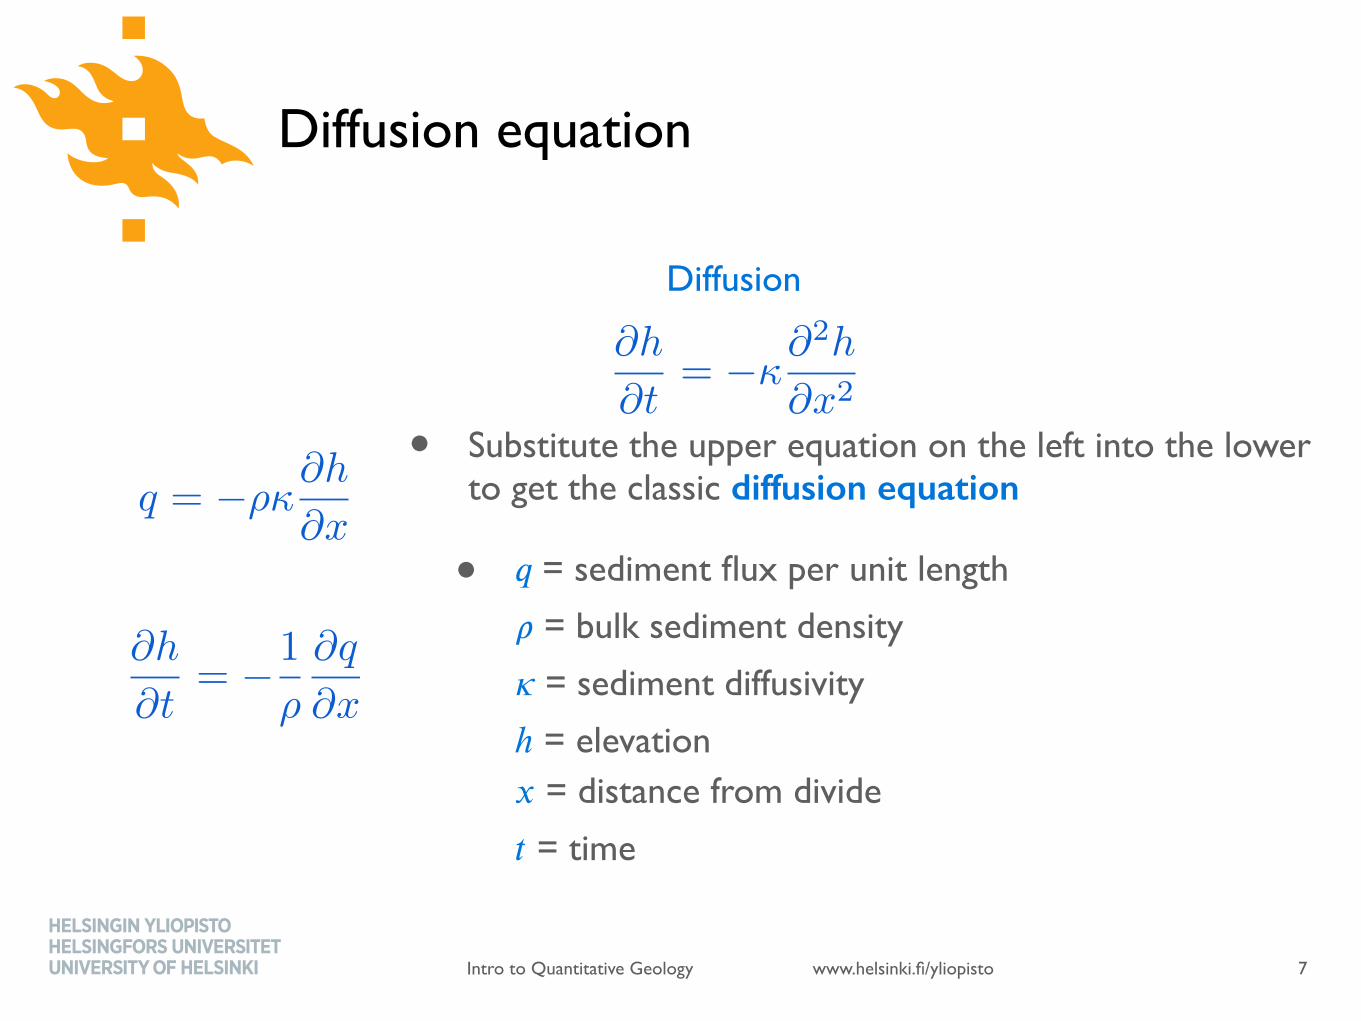
Diffusion equation
• Last week we were introduced to the diffusion equation
• Flux (transport of mass or transfer of energy) proportional to a gradient
• Conservation of mass: Any change in flux results in a change in mass/energy
6
www.helsinki.fi/yliopistoIntro to Quantitative Geology
• Substitute the upper equation on the left into the lower to get the classic diffusion equation
• ! = sediment flux per unit length " = bulk sediment density # = sediment diffusivity ℎ = elevation $ = distance from divide% = time
@h
@t
= �
@
2h
@x
2
Diffusion equation
7
Diffusion
@h
@t
= �1
⇢
@q
@x
q = �⇢
@h
@x
www.helsinki.fi/yliopistoIntro to Quantitative Geology
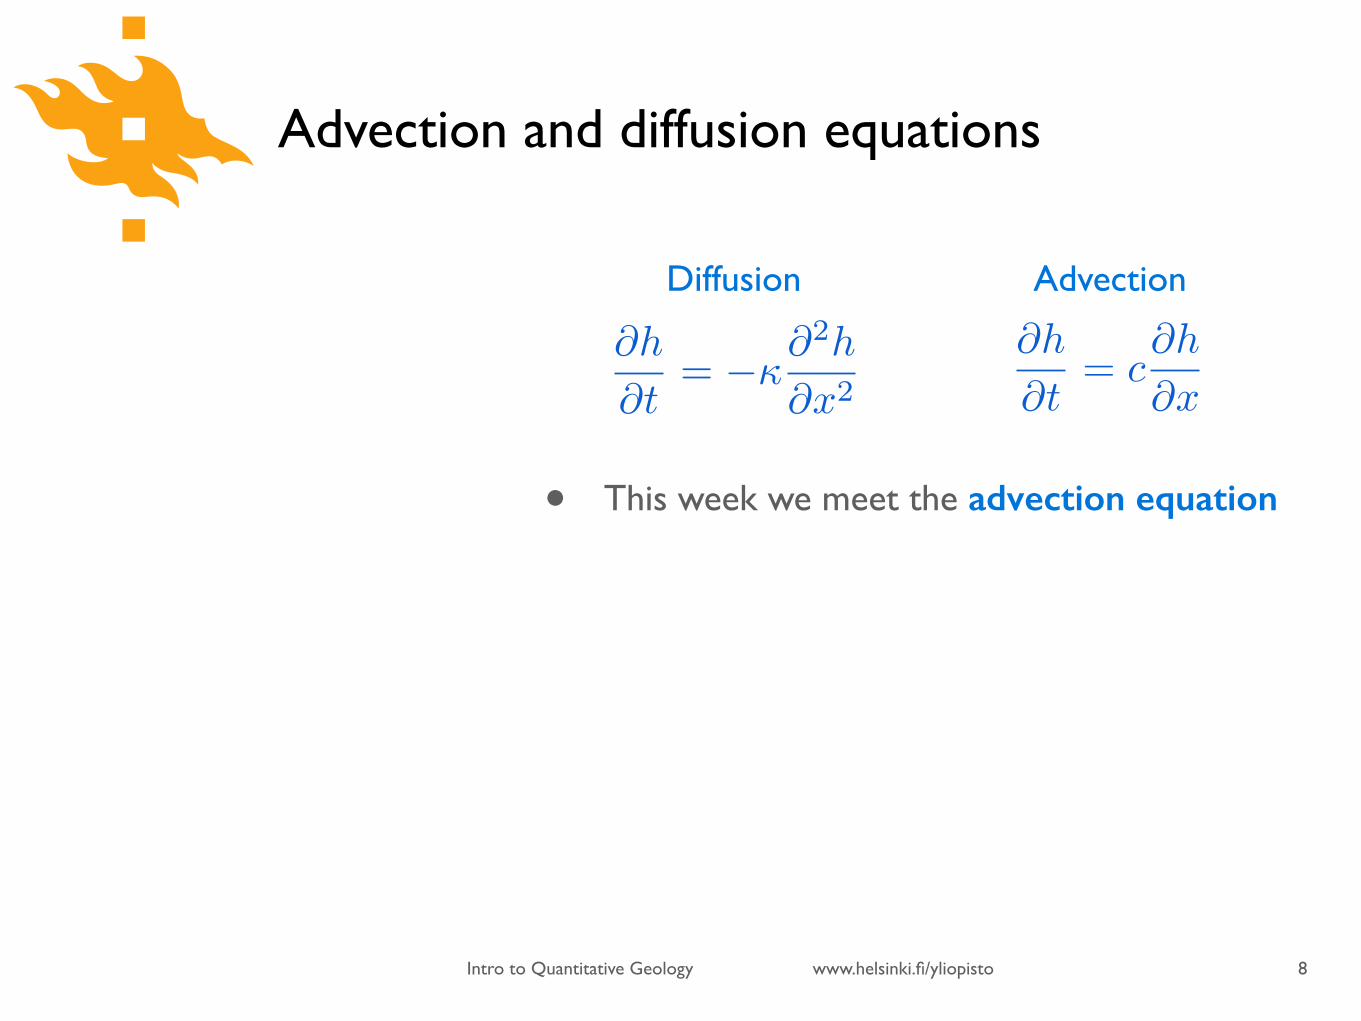
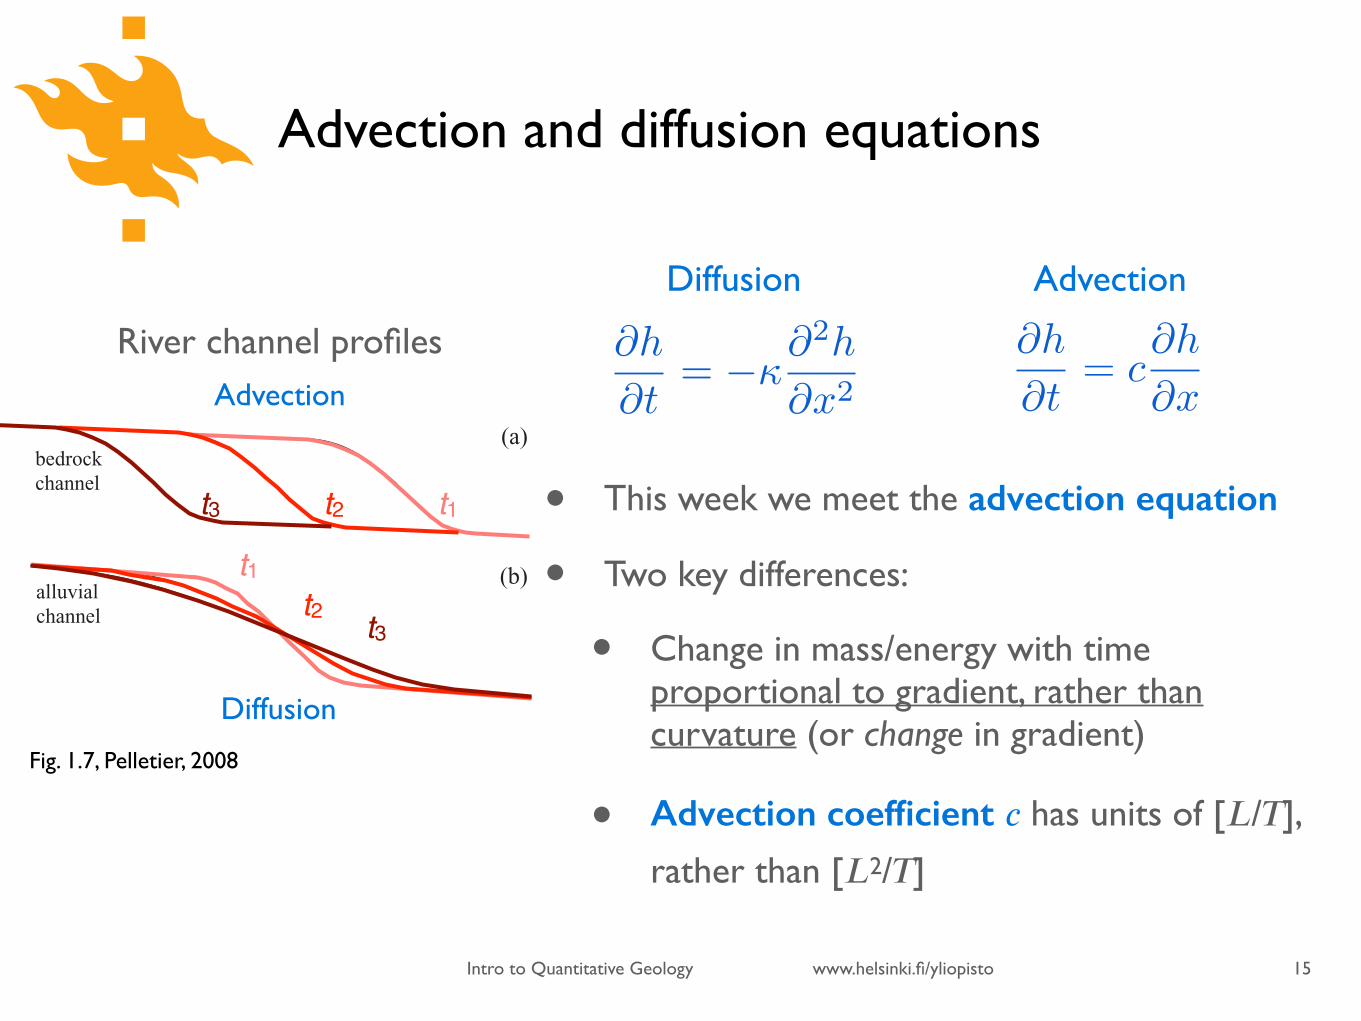
• This week we meet the advection equation
• Two key differences:
• Change in mass/energy with time proportional to gradient, rather than curvature (or change in gradient)
• Advection coefficient & has units of
['/(], rather than ['2/(]
@h
@t
= c
@h
@x
Advection and diffusion equations
8
Diffusion Advection
@h
@t
= �
@
2h
@x
2

www.helsinki.fi/yliopistoIntro to Quantitative Geology
• This week we meet the advection equation
• Two key differences:
• Change in mass/energy with time proportional to gradient, rather than curvature (or change in gradient)
• Advection coefficient & has units of ['/(],
rather than ['2/(]
Advection and diffusion equations
9
@h
@t
= c
@h
@x
Diffusion Advection
@h
@t
= �
@
2h
@x
2
www.helsinki.fi/yliopistoIntro to Quantitative Geology
6 INTRODUCTION
(a)
h (k
m)
0
1
2
3
0 5 10 15 20x (km)
(b)
model fit
longitudinal profile
bedrock alluvial
Fig 1.6 (a) Shaded-relief image of the Hanaupah Canyondrainage network and alluvial fan. Location of longitudinalprofile shown as white curve. (b) Longitudinal profile of mainHanaupah Canyon channel, together with best-fit to Eq. (1.8).
(a)
(b)
bedrock channel
alluvial channel
t1t2t3
t1 t2 t3
Fig 1.7 Schematic diagrams of the evolution of (a) bedrockand (b) alluvial channels through time, illustrating theadvective behavior of bedrock channels and the diffusivebehavior of alluvial channels.
throughout the reach. If drainage area is uni-form and n = 1 is assumed, the erosion rateis proportional to the channel slope accordingto the stream-power model. Accordingly, steeperportions of the bed will erode faster, result-
ing in the propagation of knickpoints upstreamas topographic waves. The rate of knickpointpropagation is equal to K w Am, i.e. knickpointspropagate faster in larger channels, wetter cli-mates, and areas of more easily-eroded bedrock.The stream-power model will serve as the typeexample of the advection/wave equation studiedin Chapter 4.
The Kern River (Figures 1.8 and 1.9) pro-vides a nice example of knickpoint propaga-tion in action. Two distinct topographic surfaceshave long been recognized in the landscape ofthe southern Sierra Nevada (Webb, 1946) (Figure1.8). The Boreal surface is a high-elevation, low-relief plateau that dips to the west at 1◦ (Fig-ure 1.8b). The Chagoopa Plateau is an interme-diate topographic ‘‘bench’’ that is restricted tothe major river canyons and inset into the Bo-real Plateau (Webb, 1946; Jones, 1987). Figure 1.8bmaps the maximum extents of the Chagoopaand Boreal Plateaux based on elevation rangesof 1750--2250 m (Chagoopa) and 2250--3500 m a.s.l.(Boreal). Associated with each surface are promi-nent knickpoints along major rivers. Knickpointsalong the North Fork Kern River, for example(Figure 1.9b), occur at elevations of 1600--2100 mand 2500--3300 m a.s.l. The stepped nature of theSierra Nevada topography is generally consideredto be the result of two pulses of Cenozoic and/orlate Cretaceous uplift (Clark et al., 2005; Pelletier,2007c). According to this model, two major knick-points were created during uplift, each initiatinga wave of incision that is still propagating head-ward towards the range crest.
Recent work has highlighted the importanceof abrasion in controlling bedrock channel evo-lution. In the abrasion process it is sediment, notwater, that acts as the primary erosional agent.In the stream-power model, the erosive power isassumed to be a power function of drainage area.Although sediment flux increases with drainagearea, upstream relief also plays an important rolein controlling sediment flux. As such, the stream-power model does not adequately represent theabrasion process. Sklar and Dietrich (2001, 2004)developed a saltation-abrasion model to quan-tify this process of bedrock channel erosion. In-sights into their model can be gained by re-placing drainage area with sediment flux in the
Fig. 1.7, Pelletier, 2008
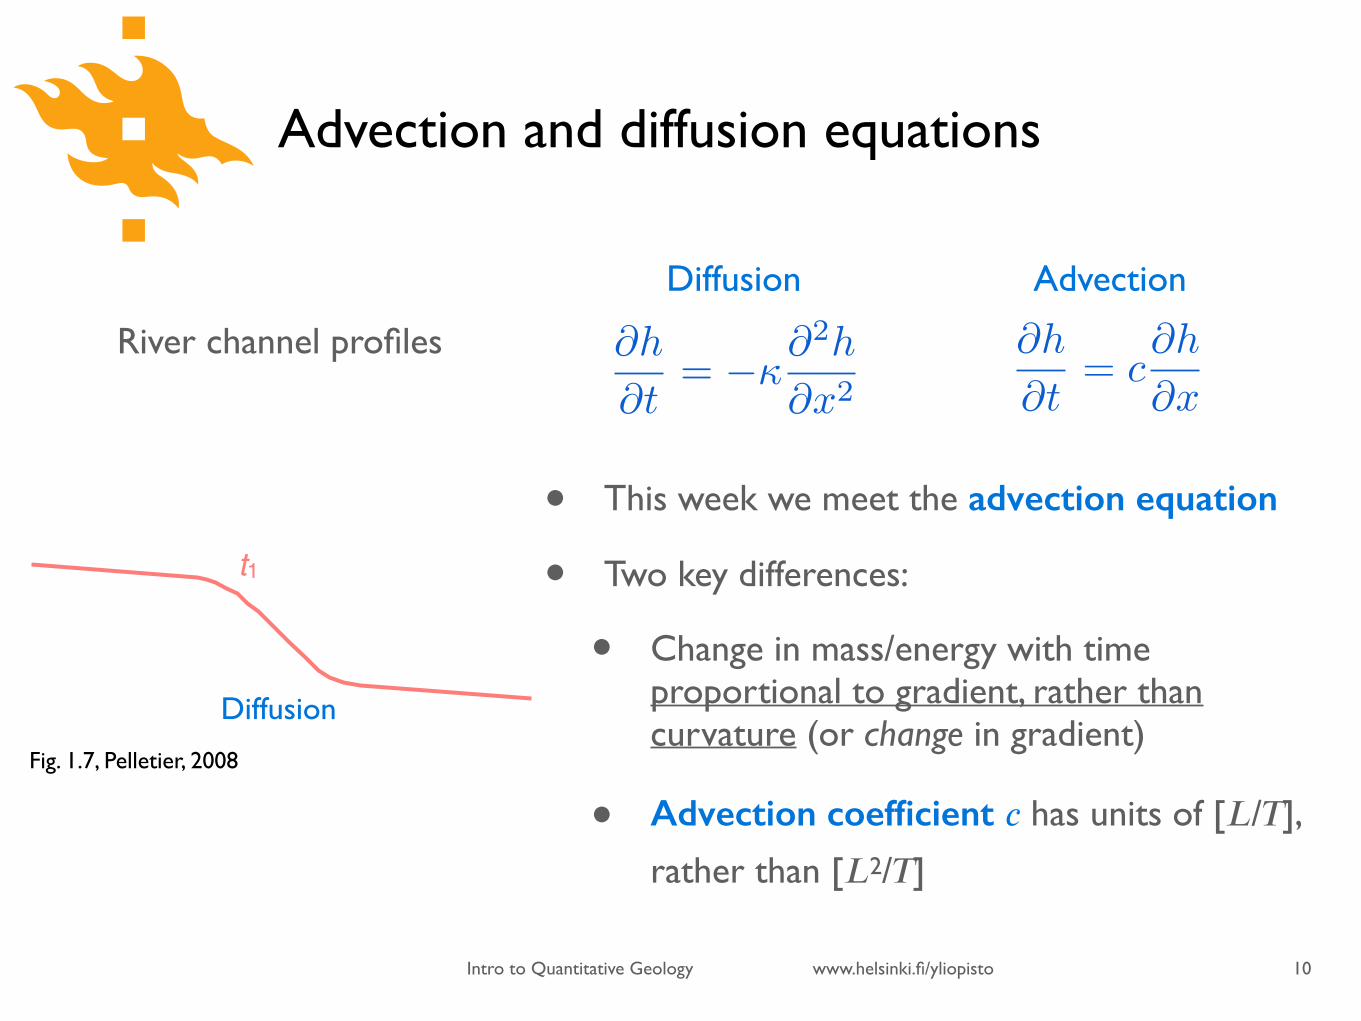
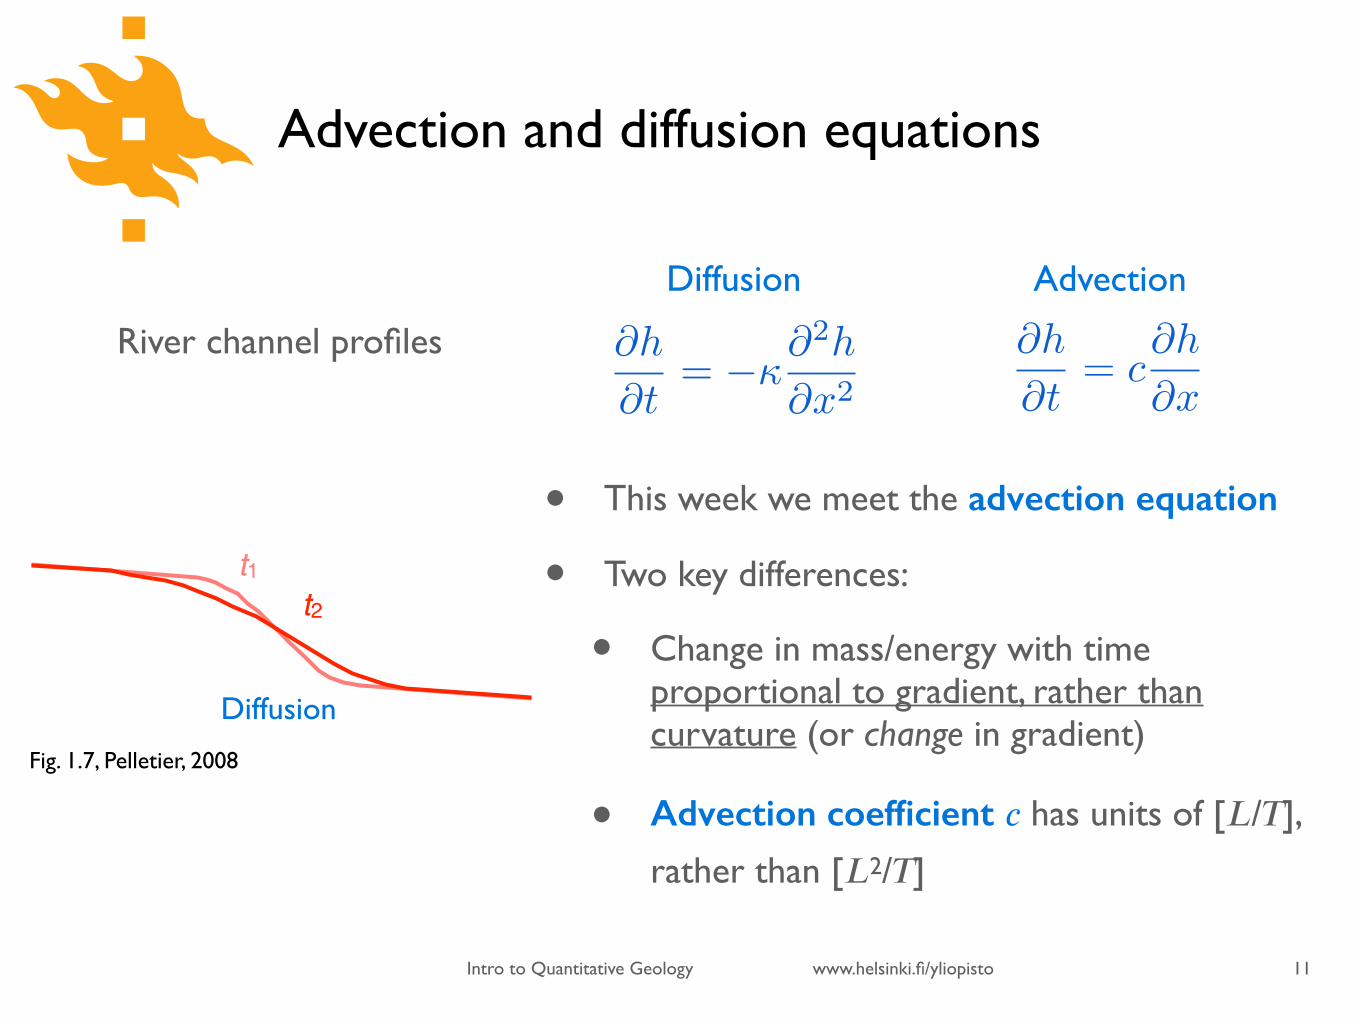
• This week we meet the advection equation
• Two key differences:
• Change in mass/energy with time proportional to gradient, rather than curvature (or change in gradient)
• Advection coefficient & has units of ['/(],
rather than ['2/(]
Advection and diffusion equations
10
Advection
Diffusion
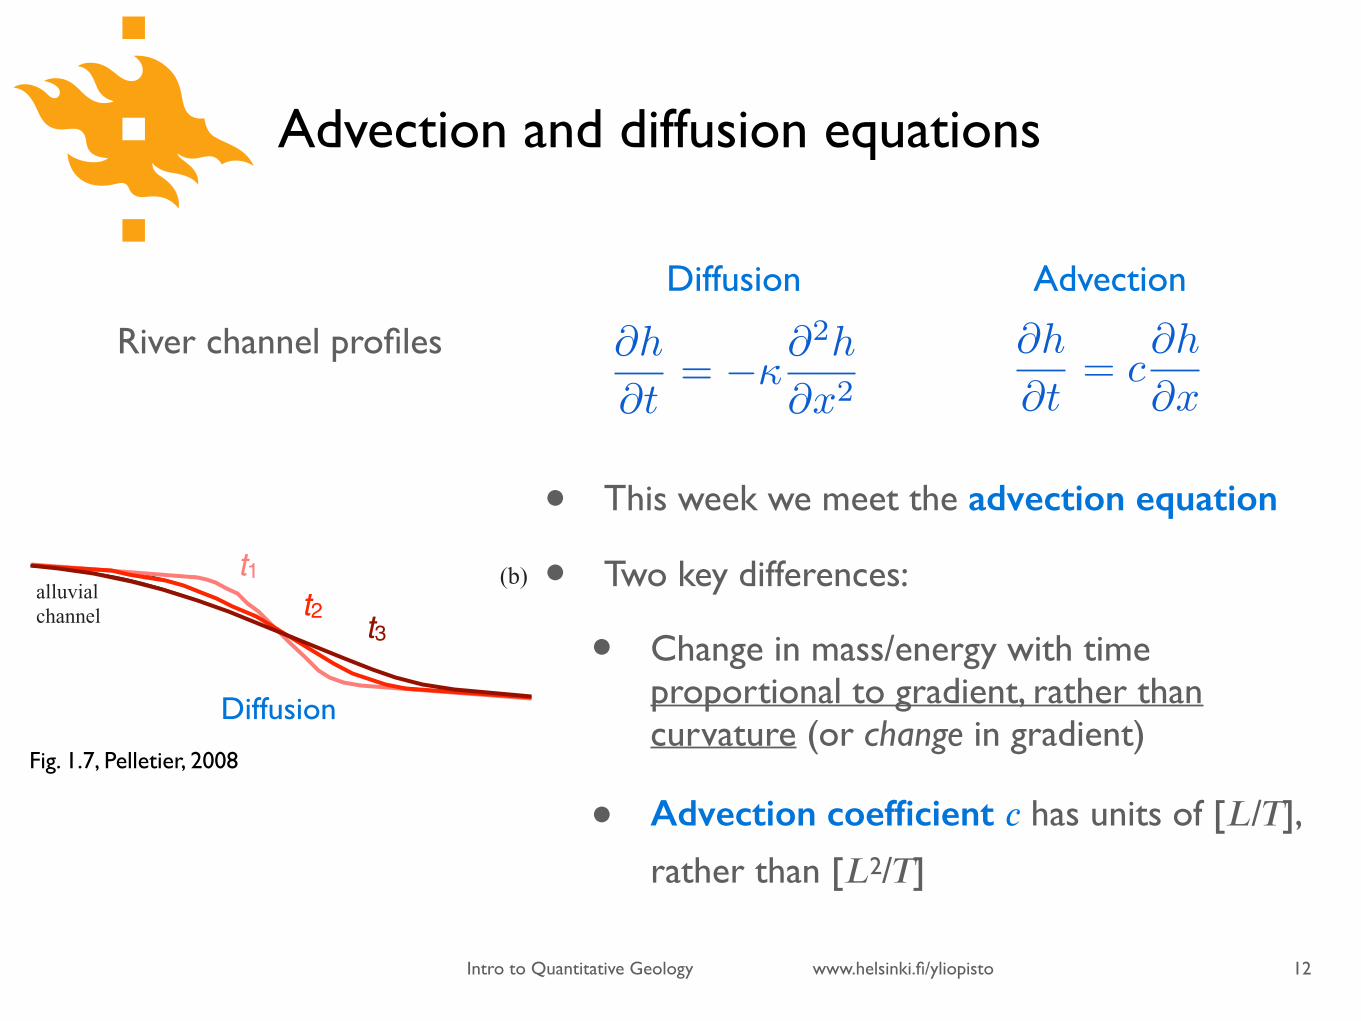
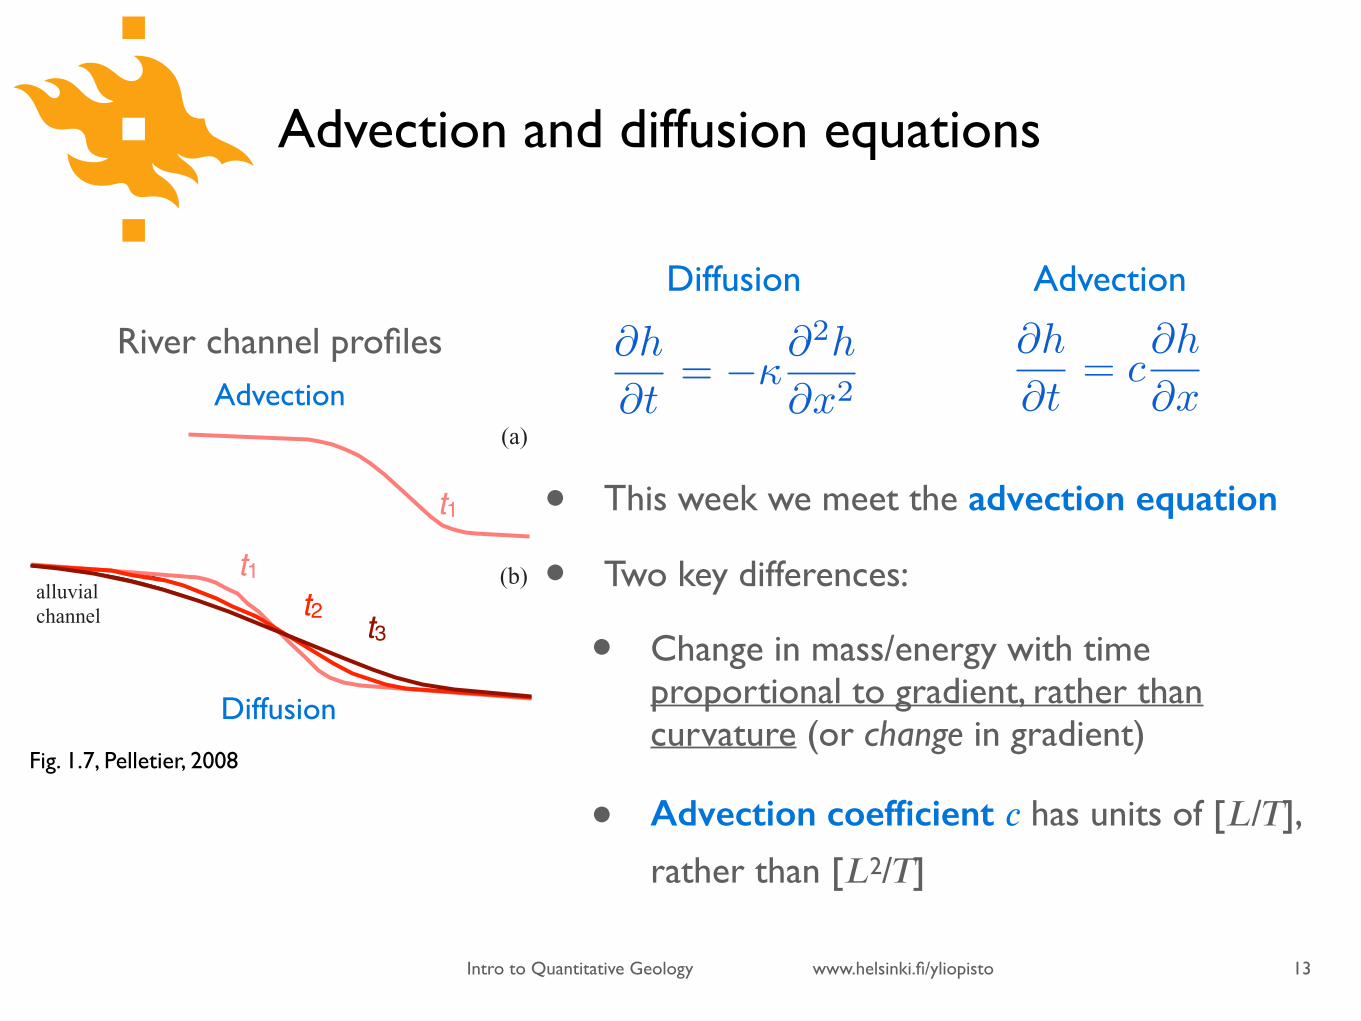
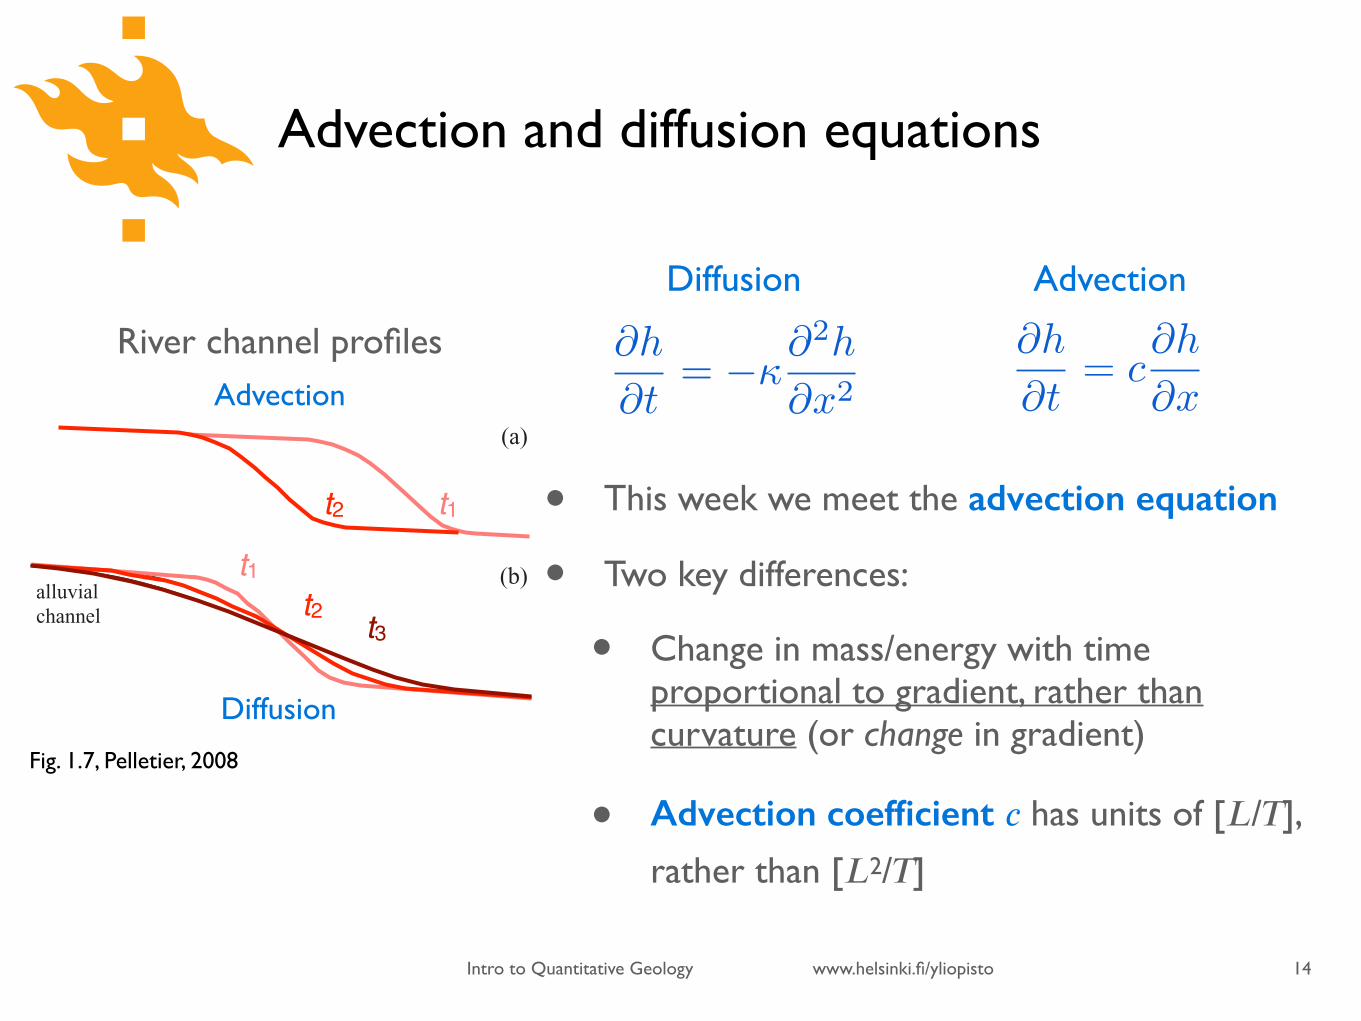
River channel profiles
t1t2t3
t1
@h
@t
= c
@h
@x
Diffusion Advection
@h
@t
= �
@
2h
@x
2
www.helsinki.fi/yliopistoIntro to Quantitative Geology
6 INTRODUCTION
(a)
h (k
m)
0
1
2
3
0 5 10 15 20x (km)
(b)
model fit
longitudinal profile
bedrock alluvial
Fig 1.6 (a) Shaded-relief image of the Hanaupah Canyondrainage network and alluvial fan. Location of longitudinalprofile shown as white curve. (b) Longitudinal profile of mainHanaupah Canyon channel, together with best-fit to Eq. (1.8).
(a)
(b)
bedrock channel
alluvial channel
t1t2t3
t1 t2 t3
Fig 1.7 Schematic diagrams of the evolution of (a) bedrockand (b) alluvial channels through time, illustrating theadvective behavior of bedrock channels and the diffusivebehavior of alluvial channels.
throughout the reach. If drainage area is uni-form and n = 1 is assumed, the erosion rateis proportional to the channel slope accordingto the stream-power model. Accordingly, steeperportions of the bed will erode faster, result-
ing in the propagation of knickpoints upstreamas topographic waves. The rate of knickpointpropagation is equal to K w Am, i.e. knickpointspropagate faster in larger channels, wetter cli-mates, and areas of more easily-eroded bedrock.The stream-power model will serve as the typeexample of the advection/wave equation studiedin Chapter 4.
The Kern River (Figures 1.8 and 1.9) pro-vides a nice example of knickpoint propaga-tion in action. Two distinct topographic surfaceshave long been recognized in the landscape ofthe southern Sierra Nevada (Webb, 1946) (Figure1.8). The Boreal surface is a high-elevation, low-relief plateau that dips to the west at 1◦ (Fig-ure 1.8b). The Chagoopa Plateau is an interme-diate topographic ‘‘bench’’ that is restricted tothe major river canyons and inset into the Bo-real Plateau (Webb, 1946; Jones, 1987). Figure 1.8bmaps the maximum extents of the Chagoopaand Boreal Plateaux based on elevation rangesof 1750--2250 m (Chagoopa) and 2250--3500 m a.s.l.(Boreal). Associated with each surface are promi-nent knickpoints along major rivers. Knickpointsalong the North Fork Kern River, for example(Figure 1.9b), occur at elevations of 1600--2100 mand 2500--3300 m a.s.l. The stepped nature of theSierra Nevada topography is generally consideredto be the result of two pulses of Cenozoic and/orlate Cretaceous uplift (Clark et al., 2005; Pelletier,2007c). According to this model, two major knick-points were created during uplift, each initiatinga wave of incision that is still propagating head-ward towards the range crest.
Recent work has highlighted the importanceof abrasion in controlling bedrock channel evo-lution. In the abrasion process it is sediment, notwater, that acts as the primary erosional agent.In the stream-power model, the erosive power isassumed to be a power function of drainage area.Although sediment flux increases with drainagearea, upstream relief also plays an important rolein controlling sediment flux. As such, the stream-power model does not adequately represent theabrasion process. Sklar and Dietrich (2001, 2004)developed a saltation-abrasion model to quan-tify this process of bedrock channel erosion. In-sights into their model can be gained by re-placing drainage area with sediment flux in the
Fig. 1.7, Pelletier, 2008
• This week we meet the advection equation
• Two key differences:
• Change in mass/energy with time proportional to gradient, rather than curvature (or change in gradient)
• Advection coefficient & has units of ['/(],
rather than ['2/(]
Advection and diffusion equations
11
Advection
Diffusion
t1t2t3
t1t2
River channel profiles @h
@t
= c
@h
@x
Diffusion Advection
@h
@t
= �
@
2h
@x
2
www.helsinki.fi/yliopistoIntro to Quantitative Geology
6 INTRODUCTION
(a)
h (k
m)
0
1
2
3
0 5 10 15 20x (km)
(b)
model fit
longitudinal profile
bedrock alluvial
Fig 1.6 (a) Shaded-relief image of the Hanaupah Canyondrainage network and alluvial fan. Location of longitudinalprofile shown as white curve. (b) Longitudinal profile of mainHanaupah Canyon channel, together with best-fit to Eq. (1.8).
(a)
(b)
bedrock channel
alluvial channel
t1t2t3
t1 t2 t3
Fig 1.7 Schematic diagrams of the evolution of (a) bedrockand (b) alluvial channels through time, illustrating theadvective behavior of bedrock channels and the diffusivebehavior of alluvial channels.
throughout the reach. If drainage area is uni-form and n = 1 is assumed, the erosion rateis proportional to the channel slope accordingto the stream-power model. Accordingly, steeperportions of the bed will erode faster, result-
ing in the propagation of knickpoints upstreamas topographic waves. The rate of knickpointpropagation is equal to K w Am, i.e. knickpointspropagate faster in larger channels, wetter cli-mates, and areas of more easily-eroded bedrock.The stream-power model will serve as the typeexample of the advection/wave equation studiedin Chapter 4.
The Kern River (Figures 1.8 and 1.9) pro-vides a nice example of knickpoint propaga-tion in action. Two distinct topographic surfaceshave long been recognized in the landscape ofthe southern Sierra Nevada (Webb, 1946) (Figure1.8). The Boreal surface is a high-elevation, low-relief plateau that dips to the west at 1◦ (Fig-ure 1.8b). The Chagoopa Plateau is an interme-diate topographic ‘‘bench’’ that is restricted tothe major river canyons and inset into the Bo-real Plateau (Webb, 1946; Jones, 1987). Figure 1.8bmaps the maximum extents of the Chagoopaand Boreal Plateaux based on elevation rangesof 1750--2250 m (Chagoopa) and 2250--3500 m a.s.l.(Boreal). Associated with each surface are promi-nent knickpoints along major rivers. Knickpointsalong the North Fork Kern River, for example(Figure 1.9b), occur at elevations of 1600--2100 mand 2500--3300 m a.s.l. The stepped nature of theSierra Nevada topography is generally consideredto be the result of two pulses of Cenozoic and/orlate Cretaceous uplift (Clark et al., 2005; Pelletier,2007c). According to this model, two major knick-points were created during uplift, each initiatinga wave of incision that is still propagating head-ward towards the range crest.
Recent work has highlighted the importanceof abrasion in controlling bedrock channel evo-lution. In the abrasion process it is sediment, notwater, that acts as the primary erosional agent.In the stream-power model, the erosive power isassumed to be a power function of drainage area.Although sediment flux increases with drainagearea, upstream relief also plays an important rolein controlling sediment flux. As such, the stream-power model does not adequately represent theabrasion process. Sklar and Dietrich (2001, 2004)developed a saltation-abrasion model to quan-tify this process of bedrock channel erosion. In-sights into their model can be gained by re-placing drainage area with sediment flux in the
Fig. 1.7, Pelletier, 2008
• This week we meet the advection equation
• Two key differences:
• Change in mass/energy with time proportional to gradient, rather than curvature (or change in gradient)
• Advection coefficient & has units of ['/(],
rather than ['2/(]
Advection and diffusion equations
12
Advection
Diffusion
t1t2t3
t1t2 t3
River channel profiles @h
@t
= c
@h
@x
Diffusion Advection
@h
@t
= �
@
2h
@x
2
www.helsinki.fi/yliopistoIntro to Quantitative Geology
6 INTRODUCTION
(a)
h (k
m)
0
1
2
3
0 5 10 15 20x (km)
(b)
model fit
longitudinal profile
bedrock alluvial
Fig 1.6 (a) Shaded-relief image of the Hanaupah Canyondrainage network and alluvial fan. Location of longitudinalprofile shown as white curve. (b) Longitudinal profile of mainHanaupah Canyon channel, together with best-fit to Eq. (1.8).
(a)
(b)
bedrock channel
alluvial channel
t1t2t3
t1 t2 t3
Fig 1.7 Schematic diagrams of the evolution of (a) bedrockand (b) alluvial channels through time, illustrating theadvective behavior of bedrock channels and the diffusivebehavior of alluvial channels.
throughout the reach. If drainage area is uni-form and n = 1 is assumed, the erosion rateis proportional to the channel slope accordingto the stream-power model. Accordingly, steeperportions of the bed will erode faster, result-
ing in the propagation of knickpoints upstreamas topographic waves. The rate of knickpointpropagation is equal to K w Am, i.e. knickpointspropagate faster in larger channels, wetter cli-mates, and areas of more easily-eroded bedrock.The stream-power model will serve as the typeexample of the advection/wave equation studiedin Chapter 4.
The Kern River (Figures 1.8 and 1.9) pro-vides a nice example of knickpoint propaga-tion in action. Two distinct topographic surfaceshave long been recognized in the landscape ofthe southern Sierra Nevada (Webb, 1946) (Figure1.8). The Boreal surface is a high-elevation, low-relief plateau that dips to the west at 1◦ (Fig-ure 1.8b). The Chagoopa Plateau is an interme-diate topographic ‘‘bench’’ that is restricted tothe major river canyons and inset into the Bo-real Plateau (Webb, 1946; Jones, 1987). Figure 1.8bmaps the maximum extents of the Chagoopaand Boreal Plateaux based on elevation rangesof 1750--2250 m (Chagoopa) and 2250--3500 m a.s.l.(Boreal). Associated with each surface are promi-nent knickpoints along major rivers. Knickpointsalong the North Fork Kern River, for example(Figure 1.9b), occur at elevations of 1600--2100 mand 2500--3300 m a.s.l. The stepped nature of theSierra Nevada topography is generally consideredto be the result of two pulses of Cenozoic and/orlate Cretaceous uplift (Clark et al., 2005; Pelletier,2007c). According to this model, two major knick-points were created during uplift, each initiatinga wave of incision that is still propagating head-ward towards the range crest.
Recent work has highlighted the importanceof abrasion in controlling bedrock channel evo-lution. In the abrasion process it is sediment, notwater, that acts as the primary erosional agent.In the stream-power model, the erosive power isassumed to be a power function of drainage area.Although sediment flux increases with drainagearea, upstream relief also plays an important rolein controlling sediment flux. As such, the stream-power model does not adequately represent theabrasion process. Sklar and Dietrich (2001, 2004)developed a saltation-abrasion model to quan-tify this process of bedrock channel erosion. In-sights into their model can be gained by re-placing drainage area with sediment flux in the
Fig. 1.7, Pelletier, 2008
• This week we meet the advection equation
• Two key differences:
• Change in mass/energy with time proportional to gradient, rather than curvature (or change in gradient)
• Advection coefficient & has units of ['/(],
rather than ['2/(]
Advection and diffusion equations
13
t1
t1t2 t3
Advection
Diffusion
River channel profiles @h
@t
= c
@h
@x
Diffusion Advection
@h
@t
= �
@
2h
@x
2
www.helsinki.fi/yliopistoIntro to Quantitative Geology
6 INTRODUCTION
(a)
h (k
m)
0
1
2
3
0 5 10 15 20x (km)
(b)
model fit
longitudinal profile
bedrock alluvial
Fig 1.6 (a) Shaded-relief image of the Hanaupah Canyondrainage network and alluvial fan. Location of longitudinalprofile shown as white curve. (b) Longitudinal profile of mainHanaupah Canyon channel, together with best-fit to Eq. (1.8).
(a)
(b)
bedrock channel
alluvial channel
t1t2t3
t1 t2 t3
Fig 1.7 Schematic diagrams of the evolution of (a) bedrockand (b) alluvial channels through time, illustrating theadvective behavior of bedrock channels and the diffusivebehavior of alluvial channels.
throughout the reach. If drainage area is uni-form and n = 1 is assumed, the erosion rateis proportional to the channel slope accordingto the stream-power model. Accordingly, steeperportions of the bed will erode faster, result-
ing in the propagation of knickpoints upstreamas topographic waves. The rate of knickpointpropagation is equal to K w Am, i.e. knickpointspropagate faster in larger channels, wetter cli-mates, and areas of more easily-eroded bedrock.The stream-power model will serve as the typeexample of the advection/wave equation studiedin Chapter 4.
The Kern River (Figures 1.8 and 1.9) pro-vides a nice example of knickpoint propaga-tion in action. Two distinct topographic surfaceshave long been recognized in the landscape ofthe southern Sierra Nevada (Webb, 1946) (Figure1.8). The Boreal surface is a high-elevation, low-relief plateau that dips to the west at 1◦ (Fig-ure 1.8b). The Chagoopa Plateau is an interme-diate topographic ‘‘bench’’ that is restricted tothe major river canyons and inset into the Bo-real Plateau (Webb, 1946; Jones, 1987). Figure 1.8bmaps the maximum extents of the Chagoopaand Boreal Plateaux based on elevation rangesof 1750--2250 m (Chagoopa) and 2250--3500 m a.s.l.(Boreal). Associated with each surface are promi-nent knickpoints along major rivers. Knickpointsalong the North Fork Kern River, for example(Figure 1.9b), occur at elevations of 1600--2100 mand 2500--3300 m a.s.l. The stepped nature of theSierra Nevada topography is generally consideredto be the result of two pulses of Cenozoic and/orlate Cretaceous uplift (Clark et al., 2005; Pelletier,2007c). According to this model, two major knick-points were created during uplift, each initiatinga wave of incision that is still propagating head-ward towards the range crest.
Recent work has highlighted the importanceof abrasion in controlling bedrock channel evo-lution. In the abrasion process it is sediment, notwater, that acts as the primary erosional agent.In the stream-power model, the erosive power isassumed to be a power function of drainage area.Although sediment flux increases with drainagearea, upstream relief also plays an important rolein controlling sediment flux. As such, the stream-power model does not adequately represent theabrasion process. Sklar and Dietrich (2001, 2004)developed a saltation-abrasion model to quan-tify this process of bedrock channel erosion. In-sights into their model can be gained by re-placing drainage area with sediment flux in the
Fig. 1.7, Pelletier, 2008
• This week we meet the advection equation
• Two key differences:
• Change in mass/energy with time proportional to gradient, rather than curvature (or change in gradient)
• Advection coefficient & has units of ['/(],
rather than ['2/(]
Advection and diffusion equations
14
Advection
Diffusion
t1t2
t1t2 t3
River channel profiles @h
@t
= c
@h
@x
Diffusion Advection
@h
@t
= �
@
2h
@x
2
www.helsinki.fi/yliopistoIntro to Quantitative Geology
6 INTRODUCTION
(a)
h (k
m)
0
1
2
3
0 5 10 15 20x (km)
(b)
model fit
longitudinal profile
bedrock alluvial
Fig 1.6 (a) Shaded-relief image of the Hanaupah Canyondrainage network and alluvial fan. Location of longitudinalprofile shown as white curve. (b) Longitudinal profile of mainHanaupah Canyon channel, together with best-fit to Eq. (1.8).
(a)
(b)
bedrock channel
alluvial channel
t1t2t3
t1 t2 t3
Fig 1.7 Schematic diagrams of the evolution of (a) bedrockand (b) alluvial channels through time, illustrating theadvective behavior of bedrock channels and the diffusivebehavior of alluvial channels.
throughout the reach. If drainage area is uni-form and n = 1 is assumed, the erosion rateis proportional to the channel slope accordingto the stream-power model. Accordingly, steeperportions of the bed will erode faster, result-
ing in the propagation of knickpoints upstreamas topographic waves. The rate of knickpointpropagation is equal to K w Am, i.e. knickpointspropagate faster in larger channels, wetter cli-mates, and areas of more easily-eroded bedrock.The stream-power model will serve as the typeexample of the advection/wave equation studiedin Chapter 4.
The Kern River (Figures 1.8 and 1.9) pro-vides a nice example of knickpoint propaga-tion in action. Two distinct topographic surfaceshave long been recognized in the landscape ofthe southern Sierra Nevada (Webb, 1946) (Figure1.8). The Boreal surface is a high-elevation, low-relief plateau that dips to the west at 1◦ (Fig-ure 1.8b). The Chagoopa Plateau is an interme-diate topographic ‘‘bench’’ that is restricted tothe major river canyons and inset into the Bo-real Plateau (Webb, 1946; Jones, 1987). Figure 1.8bmaps the maximum extents of the Chagoopaand Boreal Plateaux based on elevation rangesof 1750--2250 m (Chagoopa) and 2250--3500 m a.s.l.(Boreal). Associated with each surface are promi-nent knickpoints along major rivers. Knickpointsalong the North Fork Kern River, for example(Figure 1.9b), occur at elevations of 1600--2100 mand 2500--3300 m a.s.l. The stepped nature of theSierra Nevada topography is generally consideredto be the result of two pulses of Cenozoic and/orlate Cretaceous uplift (Clark et al., 2005; Pelletier,2007c). According to this model, two major knick-points were created during uplift, each initiatinga wave of incision that is still propagating head-ward towards the range crest.
Recent work has highlighted the importanceof abrasion in controlling bedrock channel evo-lution. In the abrasion process it is sediment, notwater, that acts as the primary erosional agent.In the stream-power model, the erosive power isassumed to be a power function of drainage area.Although sediment flux increases with drainagearea, upstream relief also plays an important rolein controlling sediment flux. As such, the stream-power model does not adequately represent theabrasion process. Sklar and Dietrich (2001, 2004)developed a saltation-abrasion model to quan-tify this process of bedrock channel erosion. In-sights into their model can be gained by re-placing drainage area with sediment flux in the
Fig. 1.7, Pelletier, 2008
• This week we meet the advection equation
• Two key differences:
• Change in mass/energy with time proportional to gradient, rather than curvature (or change in gradient)
• Advection coefficient & has units of ['/(],
rather than ['2/(]
Advection and diffusion equations
15
Advection
Diffusion
t1t2t3
t1t2 t3
River channel profiles @h
@t
= c
@h
@x
Diffusion Advection
@h
@t
= �
@
2h
@x
2

www.helsinki.fi/yliopistoIntro to Quantitative Geology
6 INTRODUCTION
(a)
h (k
m)
0
1
2
3
0 5 10 15 20x (km)
(b)
model fit
longitudinal profile
bedrock alluvial
Fig 1.6 (a) Shaded-relief image of the Hanaupah Canyondrainage network and alluvial fan. Location of longitudinalprofile shown as white curve. (b) Longitudinal profile of mainHanaupah Canyon channel, together with best-fit to Eq. (1.8).
(a)
(b)
bedrock channel
alluvial channel
t1t2t3
t1 t2 t3
Fig 1.7 Schematic diagrams of the evolution of (a) bedrockand (b) alluvial channels through time, illustrating theadvective behavior of bedrock channels and the diffusivebehavior of alluvial channels.
throughout the reach. If drainage area is uni-form and n = 1 is assumed, the erosion rateis proportional to the channel slope accordingto the stream-power model. Accordingly, steeperportions of the bed will erode faster, result-
ing in the propagation of knickpoints upstreamas topographic waves. The rate of knickpointpropagation is equal to K w Am, i.e. knickpointspropagate faster in larger channels, wetter cli-mates, and areas of more easily-eroded bedrock.The stream-power model will serve as the typeexample of the advection/wave equation studiedin Chapter 4.
The Kern River (Figures 1.8 and 1.9) pro-vides a nice example of knickpoint propaga-tion in action. Two distinct topographic surfaceshave long been recognized in the landscape ofthe southern Sierra Nevada (Webb, 1946) (Figure1.8). The Boreal surface is a high-elevation, low-relief plateau that dips to the west at 1◦ (Fig-ure 1.8b). The Chagoopa Plateau is an interme-diate topographic ‘‘bench’’ that is restricted tothe major river canyons and inset into the Bo-real Plateau (Webb, 1946; Jones, 1987). Figure 1.8bmaps the maximum extents of the Chagoopaand Boreal Plateaux based on elevation rangesof 1750--2250 m (Chagoopa) and 2250--3500 m a.s.l.(Boreal). Associated with each surface are promi-nent knickpoints along major rivers. Knickpointsalong the North Fork Kern River, for example(Figure 1.9b), occur at elevations of 1600--2100 mand 2500--3300 m a.s.l. The stepped nature of theSierra Nevada topography is generally consideredto be the result of two pulses of Cenozoic and/orlate Cretaceous uplift (Clark et al., 2005; Pelletier,2007c). According to this model, two major knick-points were created during uplift, each initiatinga wave of incision that is still propagating head-ward towards the range crest.
Recent work has highlighted the importanceof abrasion in controlling bedrock channel evo-lution. In the abrasion process it is sediment, notwater, that acts as the primary erosional agent.In the stream-power model, the erosive power isassumed to be a power function of drainage area.Although sediment flux increases with drainagearea, upstream relief also plays an important rolein controlling sediment flux. As such, the stream-power model does not adequately represent theabrasion process. Sklar and Dietrich (2001, 2004)developed a saltation-abrasion model to quan-tify this process of bedrock channel erosion. In-sights into their model can be gained by re-placing drainage area with sediment flux in the
Fig. 1.7, Pelletier, 2008
• Diffusion: Rate of erosion depends on change in hillslope gradient (curvature)
• Advection: Rate of erosion is directly proportional to hillslope gradient
• Also, no conservation of mass (deposition)
Advection and diffusion equations
16
Advection
Diffusion
t1t2t3
t1t2 t3
River channel profiles @h
@t
= c
@h
@x
Diffusion Advection
@h
@t
= �
@
2h
@x
2

www.helsinki.fi/yliopistoIntro to Quantitative Geology
@h
@t
c @t
@h
@t
= c
@h
@x
Advection at a constant rate &
• Surface elevation changes in direct proportion to surface slope
• Result is lateral propagation of the topography or river channel profile
• Although this is interesting, it is not that common in nature
17
&Elevation change
Displacement
River channel profile
www.helsinki.fi/yliopistoIntro to Quantitative Geology
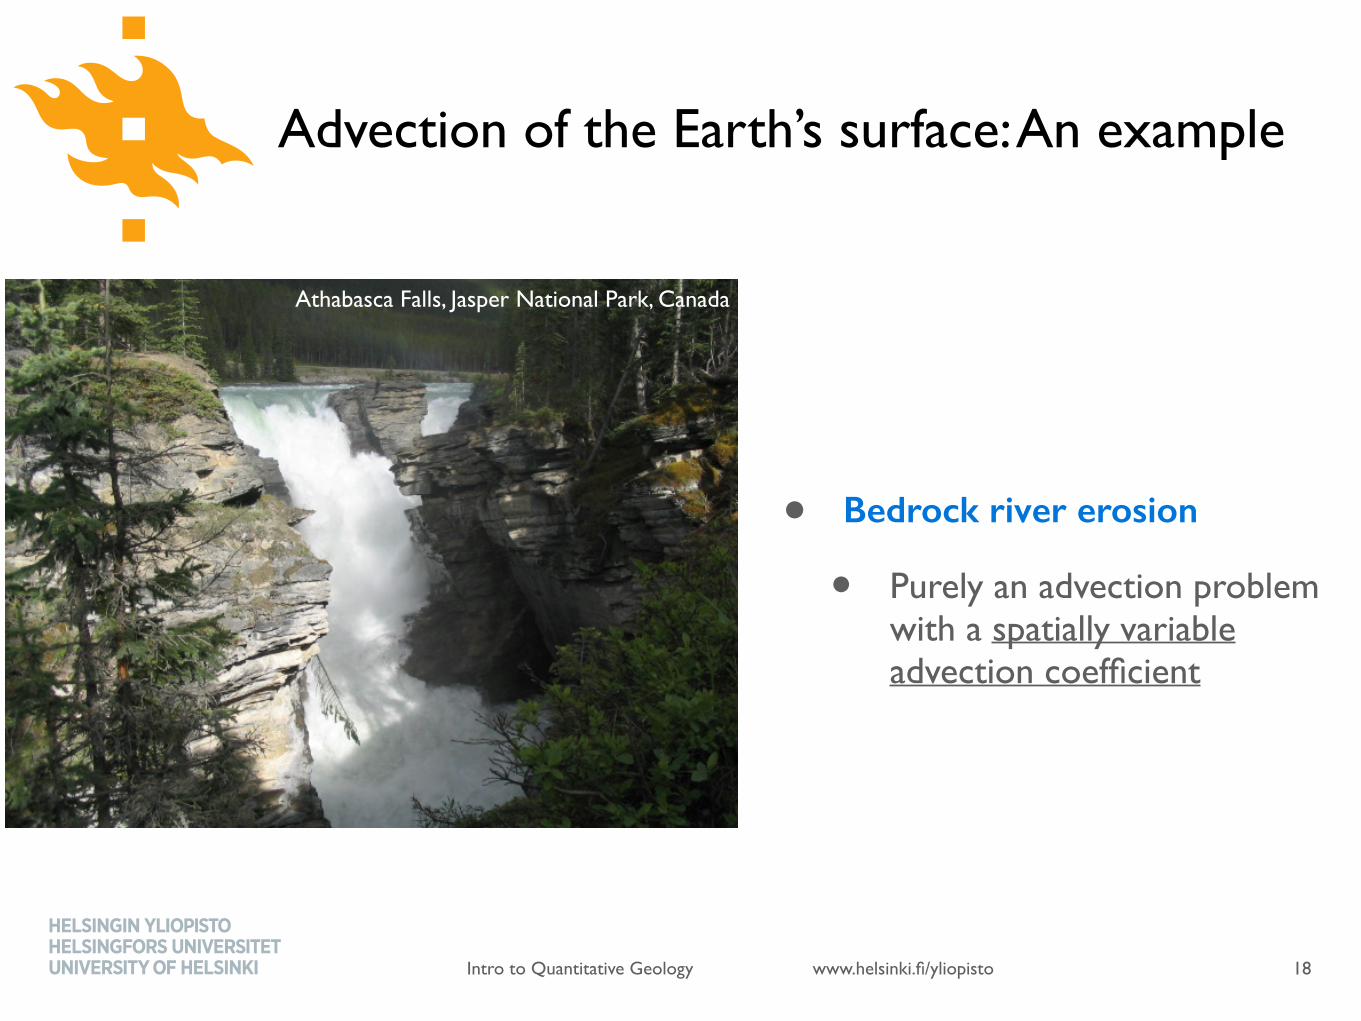
Advection of the Earth’s surface: An example
• Bedrock river erosion
• Purely an advection problem with a spatially variable advection coefficient
18
Athabasca Falls, Jasper National Park, Canada

www.helsinki.fi/yliopistoIntro to Quantitative Geology
Bedrock river erosion
• Not much bedrock being eroded here…
19
Cooling Age
Prob
abilit
y
0
No landslides
Drainage basin
www.helsinki.fi/yliopistoIntro to Quantitative Geology
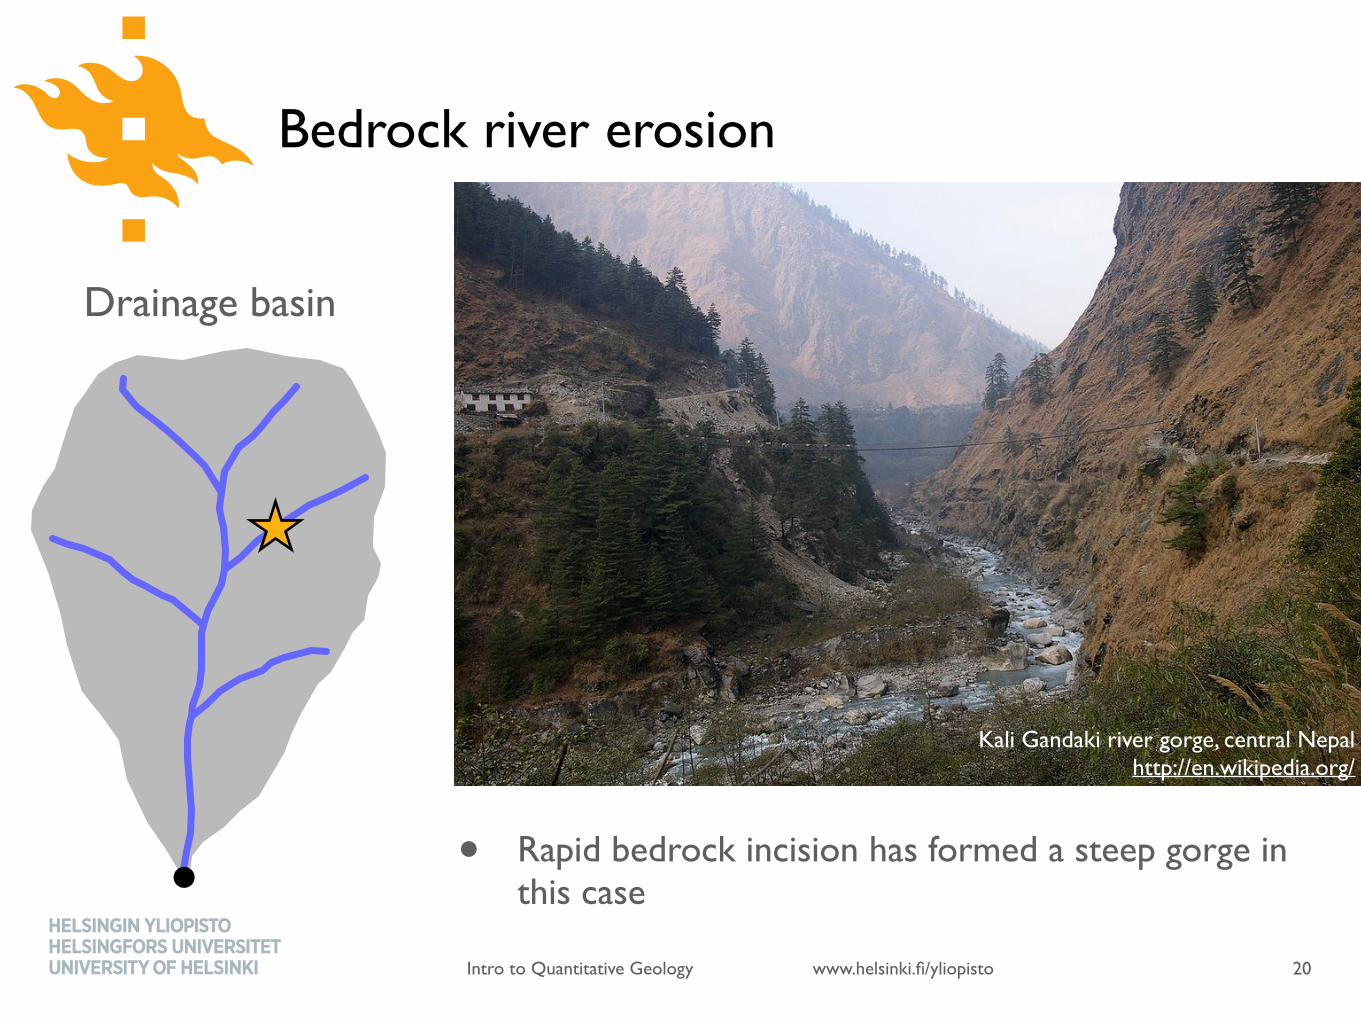
Bedrock river erosion
• Rapid bedrock incision has formed a steep gorge in this case
20
Cooling Age
Prob
abilit
y
0
No landslides
Drainage basin
Kali Gandaki river gorge, central Nepalhttp://en.wikipedia.org/
www.helsinki.fi/yliopistoIntro to Quantitative Geology
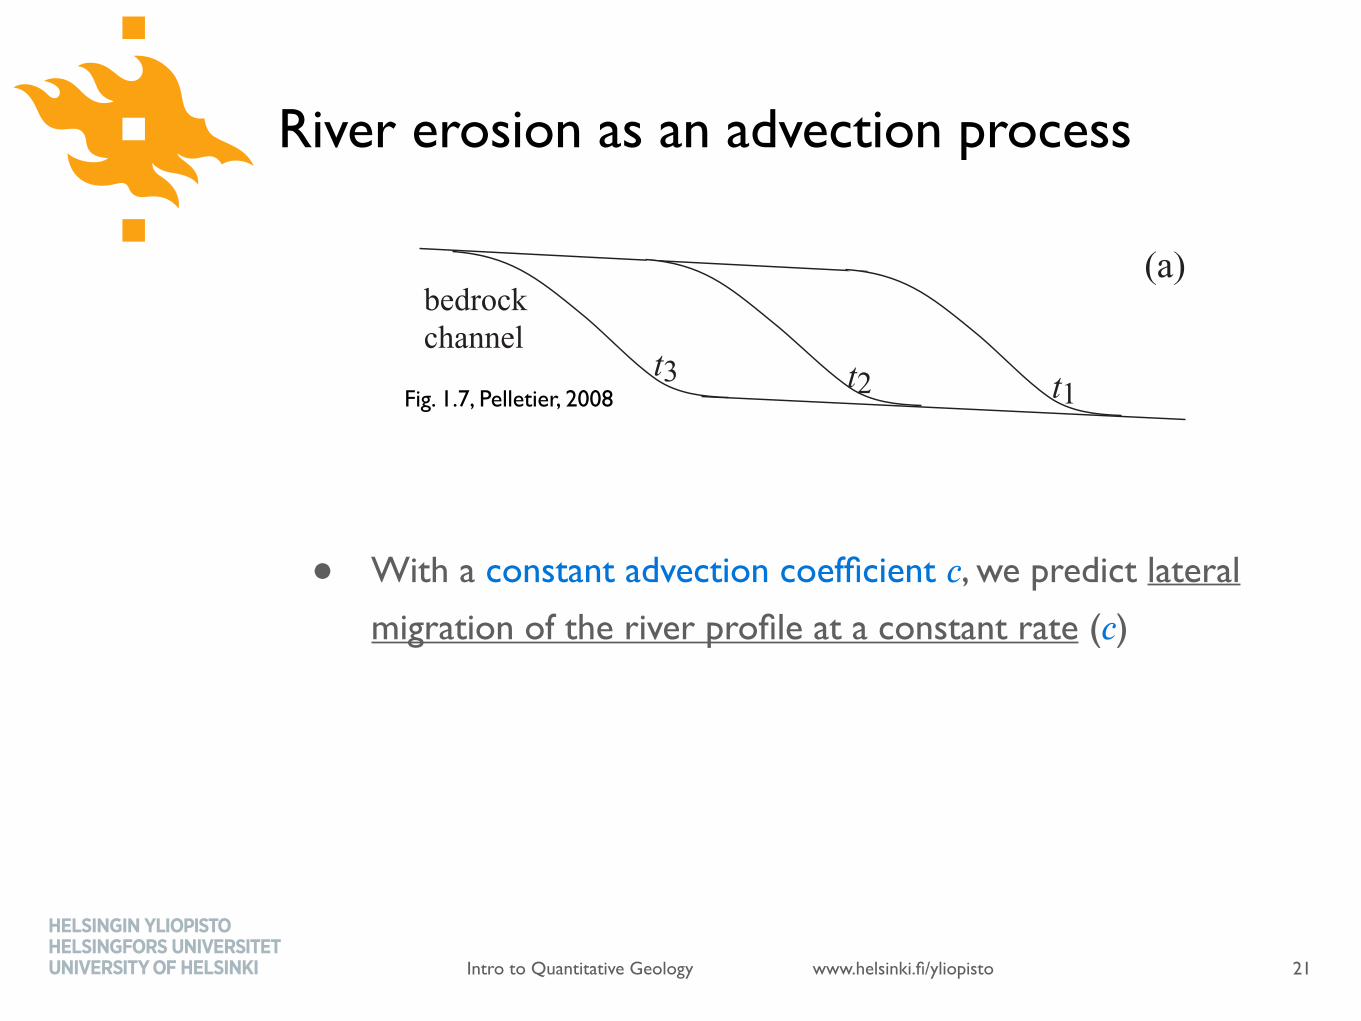
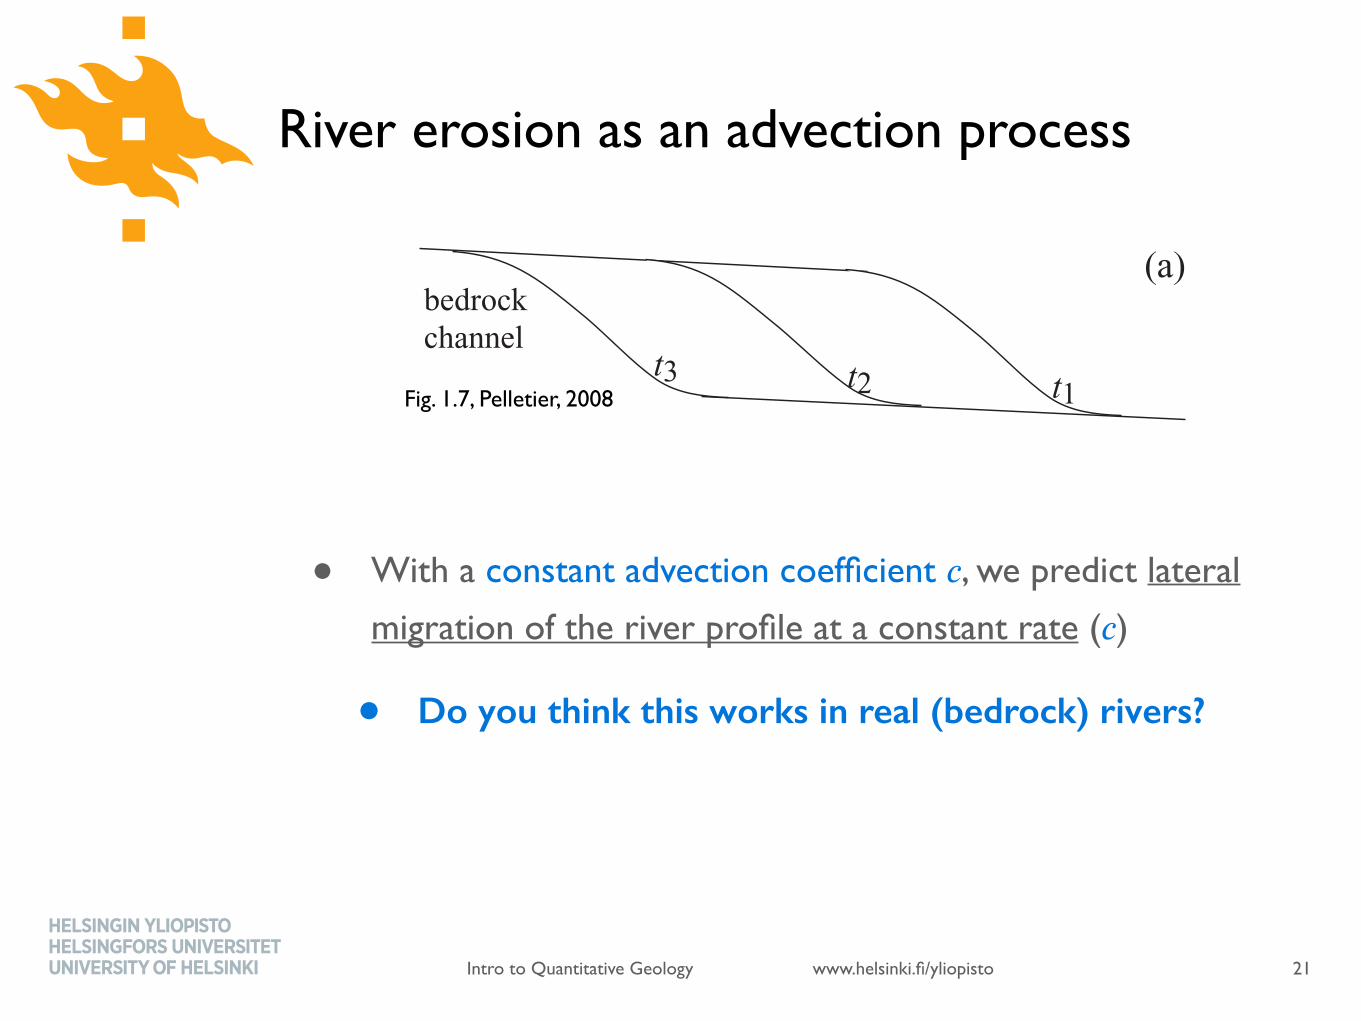
River erosion as an advection process
• With a constant advection coefficient &, we predict lateral
migration of the river profile at a constant rate (&)
21
6 INTRODUCTION
(a)
h (k
m)
0
1
2
3
0 5 10 15 20x (km)
(b)
model fit
longitudinal profile
bedrock alluvial
Fig 1.6 (a) Shaded-relief image of the Hanaupah Canyondrainage network and alluvial fan. Location of longitudinalprofile shown as white curve. (b) Longitudinal profile of mainHanaupah Canyon channel, together with best-fit to Eq. (1.8).
(a)
(b)
bedrock channel
alluvial channel
t1t2t3
t1 t2 t3
Fig 1.7 Schematic diagrams of the evolution of (a) bedrockand (b) alluvial channels through time, illustrating theadvective behavior of bedrock channels and the diffusivebehavior of alluvial channels.
throughout the reach. If drainage area is uni-form and n = 1 is assumed, the erosion rateis proportional to the channel slope accordingto the stream-power model. Accordingly, steeperportions of the bed will erode faster, result-
ing in the propagation of knickpoints upstreamas topographic waves. The rate of knickpointpropagation is equal to K w Am, i.e. knickpointspropagate faster in larger channels, wetter cli-mates, and areas of more easily-eroded bedrock.The stream-power model will serve as the typeexample of the advection/wave equation studiedin Chapter 4.
The Kern River (Figures 1.8 and 1.9) pro-vides a nice example of knickpoint propaga-tion in action. Two distinct topographic surfaceshave long been recognized in the landscape ofthe southern Sierra Nevada (Webb, 1946) (Figure1.8). The Boreal surface is a high-elevation, low-relief plateau that dips to the west at 1◦ (Fig-ure 1.8b). The Chagoopa Plateau is an interme-diate topographic ‘‘bench’’ that is restricted tothe major river canyons and inset into the Bo-real Plateau (Webb, 1946; Jones, 1987). Figure 1.8bmaps the maximum extents of the Chagoopaand Boreal Plateaux based on elevation rangesof 1750--2250 m (Chagoopa) and 2250--3500 m a.s.l.(Boreal). Associated with each surface are promi-nent knickpoints along major rivers. Knickpointsalong the North Fork Kern River, for example(Figure 1.9b), occur at elevations of 1600--2100 mand 2500--3300 m a.s.l. The stepped nature of theSierra Nevada topography is generally consideredto be the result of two pulses of Cenozoic and/orlate Cretaceous uplift (Clark et al., 2005; Pelletier,2007c). According to this model, two major knick-points were created during uplift, each initiatinga wave of incision that is still propagating head-ward towards the range crest.
Recent work has highlighted the importanceof abrasion in controlling bedrock channel evo-lution. In the abrasion process it is sediment, notwater, that acts as the primary erosional agent.In the stream-power model, the erosive power isassumed to be a power function of drainage area.Although sediment flux increases with drainagearea, upstream relief also plays an important rolein controlling sediment flux. As such, the stream-power model does not adequately represent theabrasion process. Sklar and Dietrich (2001, 2004)developed a saltation-abrasion model to quan-tify this process of bedrock channel erosion. In-sights into their model can be gained by re-placing drainage area with sediment flux in the
Fig. 1.7, Pelletier, 2008
www.helsinki.fi/yliopistoIntro to Quantitative Geology
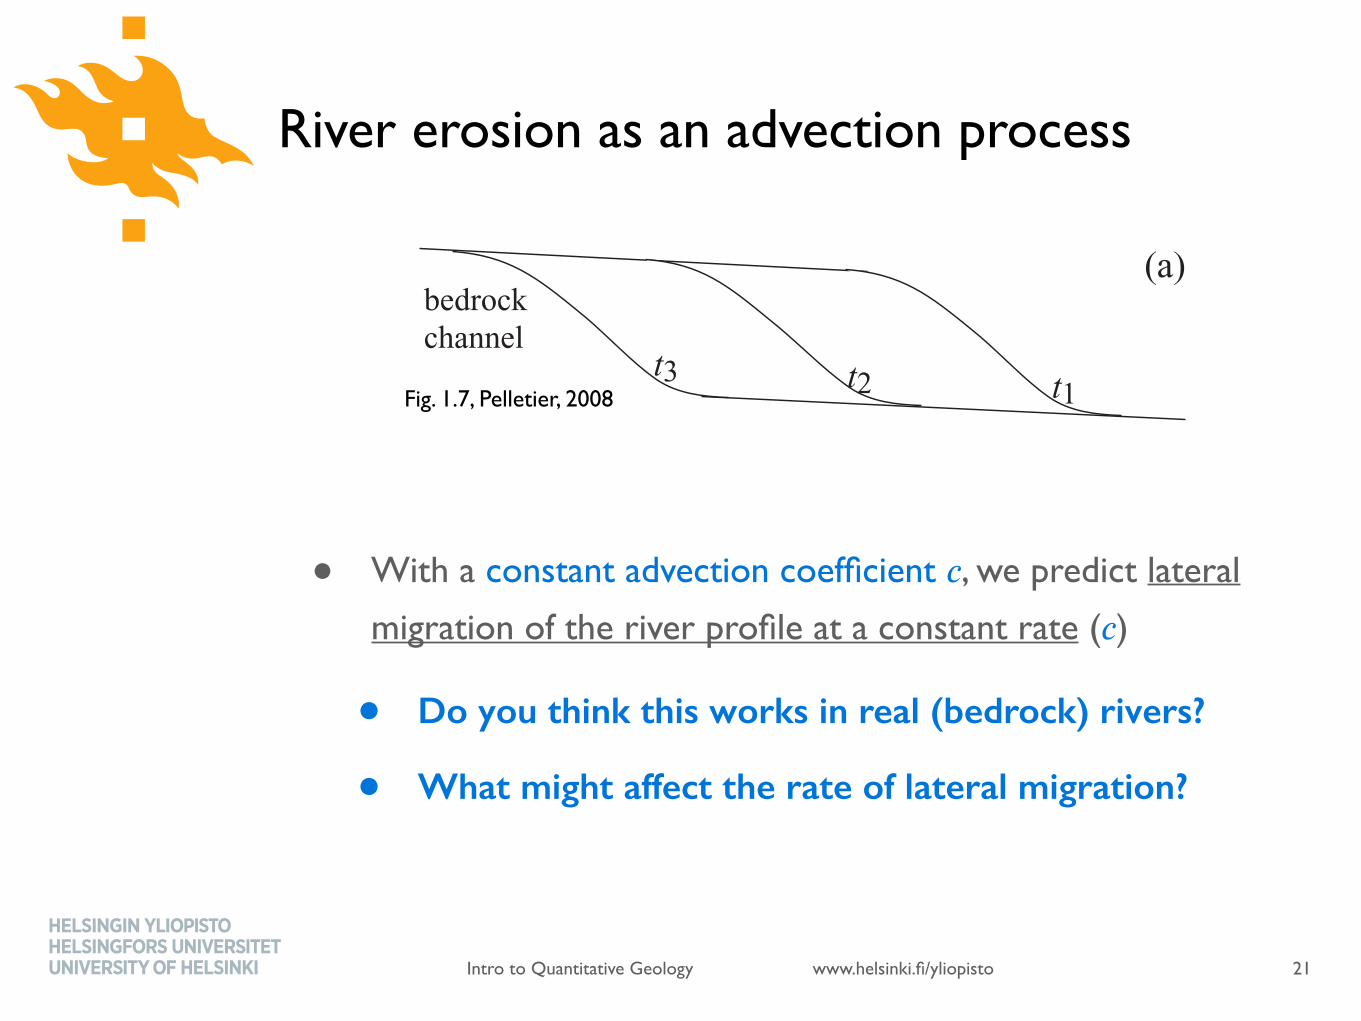
River erosion as an advection process
• With a constant advection coefficient &, we predict lateral
migration of the river profile at a constant rate (&)
• Do you think this works in real (bedrock) rivers?
21
6 INTRODUCTION
(a)
h (k
m)
0
1
2
3
0 5 10 15 20x (km)
(b)
model fit
longitudinal profile
bedrock alluvial
Fig 1.6 (a) Shaded-relief image of the Hanaupah Canyondrainage network and alluvial fan. Location of longitudinalprofile shown as white curve. (b) Longitudinal profile of mainHanaupah Canyon channel, together with best-fit to Eq. (1.8).
(a)
(b)
bedrock channel
alluvial channel
t1t2t3
t1 t2 t3
Fig 1.7 Schematic diagrams of the evolution of (a) bedrockand (b) alluvial channels through time, illustrating theadvective behavior of bedrock channels and the diffusivebehavior of alluvial channels.
throughout the reach. If drainage area is uni-form and n = 1 is assumed, the erosion rateis proportional to the channel slope accordingto the stream-power model. Accordingly, steeperportions of the bed will erode faster, result-
ing in the propagation of knickpoints upstreamas topographic waves. The rate of knickpointpropagation is equal to K w Am, i.e. knickpointspropagate faster in larger channels, wetter cli-mates, and areas of more easily-eroded bedrock.The stream-power model will serve as the typeexample of the advection/wave equation studiedin Chapter 4.
The Kern River (Figures 1.8 and 1.9) pro-vides a nice example of knickpoint propaga-tion in action. Two distinct topographic surfaceshave long been recognized in the landscape ofthe southern Sierra Nevada (Webb, 1946) (Figure1.8). The Boreal surface is a high-elevation, low-relief plateau that dips to the west at 1◦ (Fig-ure 1.8b). The Chagoopa Plateau is an interme-diate topographic ‘‘bench’’ that is restricted tothe major river canyons and inset into the Bo-real Plateau (Webb, 1946; Jones, 1987). Figure 1.8bmaps the maximum extents of the Chagoopaand Boreal Plateaux based on elevation rangesof 1750--2250 m (Chagoopa) and 2250--3500 m a.s.l.(Boreal). Associated with each surface are promi-nent knickpoints along major rivers. Knickpointsalong the North Fork Kern River, for example(Figure 1.9b), occur at elevations of 1600--2100 mand 2500--3300 m a.s.l. The stepped nature of theSierra Nevada topography is generally consideredto be the result of two pulses of Cenozoic and/orlate Cretaceous uplift (Clark et al., 2005; Pelletier,2007c). According to this model, two major knick-points were created during uplift, each initiatinga wave of incision that is still propagating head-ward towards the range crest.
Recent work has highlighted the importanceof abrasion in controlling bedrock channel evo-lution. In the abrasion process it is sediment, notwater, that acts as the primary erosional agent.In the stream-power model, the erosive power isassumed to be a power function of drainage area.Although sediment flux increases with drainagearea, upstream relief also plays an important rolein controlling sediment flux. As such, the stream-power model does not adequately represent theabrasion process. Sklar and Dietrich (2001, 2004)developed a saltation-abrasion model to quan-tify this process of bedrock channel erosion. In-sights into their model can be gained by re-placing drainage area with sediment flux in the
Fig. 1.7, Pelletier, 2008
www.helsinki.fi/yliopistoIntro to Quantitative Geology
River erosion as an advection process
• With a constant advection coefficient &, we predict lateral
migration of the river profile at a constant rate (&)
• Do you think this works in real (bedrock) rivers?
• What might affect the rate of lateral migration?
21
6 INTRODUCTION
(a)
h (k
m)
0
1
2
3
0 5 10 15 20x (km)
(b)
model fit
longitudinal profile
bedrock alluvial
Fig 1.6 (a) Shaded-relief image of the Hanaupah Canyondrainage network and alluvial fan. Location of longitudinalprofile shown as white curve. (b) Longitudinal profile of mainHanaupah Canyon channel, together with best-fit to Eq. (1.8).
(a)
(b)
bedrock channel
alluvial channel
t1t2t3
t1 t2 t3
Fig 1.7 Schematic diagrams of the evolution of (a) bedrockand (b) alluvial channels through time, illustrating theadvective behavior of bedrock channels and the diffusivebehavior of alluvial channels.
throughout the reach. If drainage area is uni-form and n = 1 is assumed, the erosion rateis proportional to the channel slope accordingto the stream-power model. Accordingly, steeperportions of the bed will erode faster, result-
ing in the propagation of knickpoints upstreamas topographic waves. The rate of knickpointpropagation is equal to K w Am, i.e. knickpointspropagate faster in larger channels, wetter cli-mates, and areas of more easily-eroded bedrock.The stream-power model will serve as the typeexample of the advection/wave equation studiedin Chapter 4.
The Kern River (Figures 1.8 and 1.9) pro-vides a nice example of knickpoint propaga-tion in action. Two distinct topographic surfaceshave long been recognized in the landscape ofthe southern Sierra Nevada (Webb, 1946) (Figure1.8). The Boreal surface is a high-elevation, low-relief plateau that dips to the west at 1◦ (Fig-ure 1.8b). The Chagoopa Plateau is an interme-diate topographic ‘‘bench’’ that is restricted tothe major river canyons and inset into the Bo-real Plateau (Webb, 1946; Jones, 1987). Figure 1.8bmaps the maximum extents of the Chagoopaand Boreal Plateaux based on elevation rangesof 1750--2250 m (Chagoopa) and 2250--3500 m a.s.l.(Boreal). Associated with each surface are promi-nent knickpoints along major rivers. Knickpointsalong the North Fork Kern River, for example(Figure 1.9b), occur at elevations of 1600--2100 mand 2500--3300 m a.s.l. The stepped nature of theSierra Nevada topography is generally consideredto be the result of two pulses of Cenozoic and/orlate Cretaceous uplift (Clark et al., 2005; Pelletier,2007c). According to this model, two major knick-points were created during uplift, each initiatinga wave of incision that is still propagating head-ward towards the range crest.
Recent work has highlighted the importanceof abrasion in controlling bedrock channel evo-lution. In the abrasion process it is sediment, notwater, that acts as the primary erosional agent.In the stream-power model, the erosive power isassumed to be a power function of drainage area.Although sediment flux increases with drainagearea, upstream relief also plays an important rolein controlling sediment flux. As such, the stream-power model does not adequately represent theabrasion process. Sklar and Dietrich (2001, 2004)developed a saltation-abrasion model to quan-tify this process of bedrock channel erosion. In-sights into their model can be gained by re-placing drainage area with sediment flux in the
Fig. 1.7, Pelletier, 2008

www.helsinki.fi/yliopistoIntro to Quantitative Geology
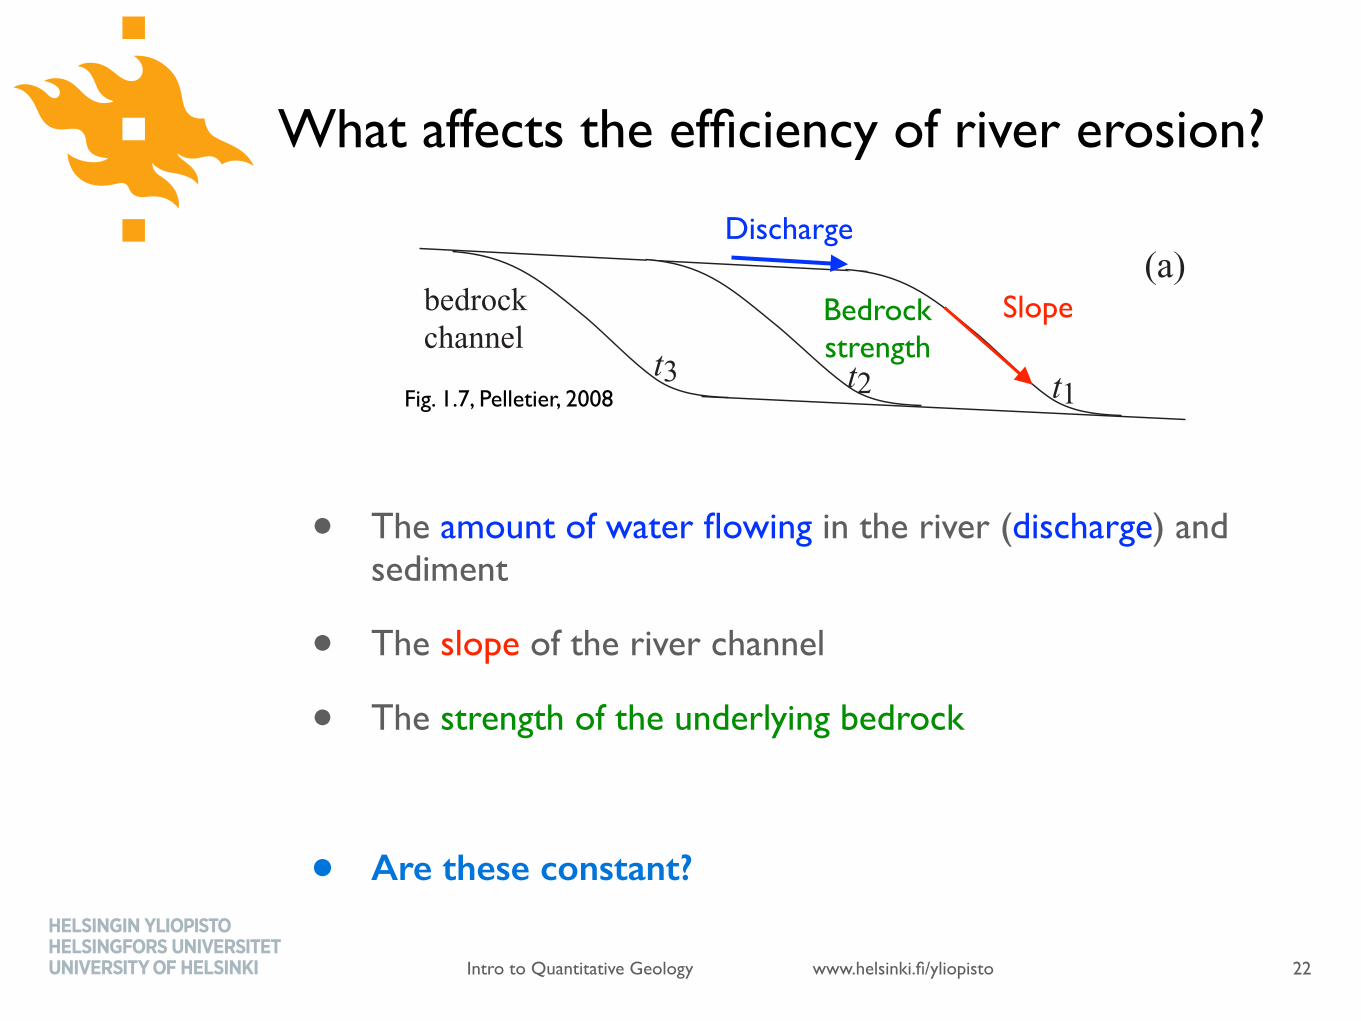
What affects the efficiency of river erosion?
• The amount of water flowing in the river (discharge) and sediment
• The slope of the river channel
• The strength of the underlying bedrock
22
6 INTRODUCTION
(a)
h (k
m)
0
1
2
3
0 5 10 15 20x (km)
(b)
model fit
longitudinal profile
bedrock alluvial
Fig 1.6 (a) Shaded-relief image of the Hanaupah Canyondrainage network and alluvial fan. Location of longitudinalprofile shown as white curve. (b) Longitudinal profile of mainHanaupah Canyon channel, together with best-fit to Eq. (1.8).
(a)
(b)
bedrock channel
alluvial channel
t1t2t3
t1 t2 t3
Fig 1.7 Schematic diagrams of the evolution of (a) bedrockand (b) alluvial channels through time, illustrating theadvective behavior of bedrock channels and the diffusivebehavior of alluvial channels.
throughout the reach. If drainage area is uni-form and n = 1 is assumed, the erosion rateis proportional to the channel slope accordingto the stream-power model. Accordingly, steeperportions of the bed will erode faster, result-
ing in the propagation of knickpoints upstreamas topographic waves. The rate of knickpointpropagation is equal to K w Am, i.e. knickpointspropagate faster in larger channels, wetter cli-mates, and areas of more easily-eroded bedrock.The stream-power model will serve as the typeexample of the advection/wave equation studiedin Chapter 4.
The Kern River (Figures 1.8 and 1.9) pro-vides a nice example of knickpoint propaga-tion in action. Two distinct topographic surfaceshave long been recognized in the landscape ofthe southern Sierra Nevada (Webb, 1946) (Figure1.8). The Boreal surface is a high-elevation, low-relief plateau that dips to the west at 1◦ (Fig-ure 1.8b). The Chagoopa Plateau is an interme-diate topographic ‘‘bench’’ that is restricted tothe major river canyons and inset into the Bo-real Plateau (Webb, 1946; Jones, 1987). Figure 1.8bmaps the maximum extents of the Chagoopaand Boreal Plateaux based on elevation rangesof 1750--2250 m (Chagoopa) and 2250--3500 m a.s.l.(Boreal). Associated with each surface are promi-nent knickpoints along major rivers. Knickpointsalong the North Fork Kern River, for example(Figure 1.9b), occur at elevations of 1600--2100 mand 2500--3300 m a.s.l. The stepped nature of theSierra Nevada topography is generally consideredto be the result of two pulses of Cenozoic and/orlate Cretaceous uplift (Clark et al., 2005; Pelletier,2007c). According to this model, two major knick-points were created during uplift, each initiatinga wave of incision that is still propagating head-ward towards the range crest.
Recent work has highlighted the importanceof abrasion in controlling bedrock channel evo-lution. In the abrasion process it is sediment, notwater, that acts as the primary erosional agent.In the stream-power model, the erosive power isassumed to be a power function of drainage area.Although sediment flux increases with drainagearea, upstream relief also plays an important rolein controlling sediment flux. As such, the stream-power model does not adequately represent theabrasion process. Sklar and Dietrich (2001, 2004)developed a saltation-abrasion model to quan-tify this process of bedrock channel erosion. In-sights into their model can be gained by re-placing drainage area with sediment flux in the
Fig. 1.7, Pelletier, 2008
Discharge
SlopeBedrockstrength
www.helsinki.fi/yliopistoIntro to Quantitative Geology
What affects the efficiency of river erosion?
• The amount of water flowing in the river (discharge) and sediment
• The slope of the river channel
• The strength of the underlying bedrock
• Are these constant?
22
6 INTRODUCTION
(a)
h (k
m)
0
1
2
3
0 5 10 15 20x (km)
(b)
model fit
longitudinal profile
bedrock alluvial
Fig 1.6 (a) Shaded-relief image of the Hanaupah Canyondrainage network and alluvial fan. Location of longitudinalprofile shown as white curve. (b) Longitudinal profile of mainHanaupah Canyon channel, together with best-fit to Eq. (1.8).
(a)
(b)
bedrock channel
alluvial channel
t1t2t3
t1 t2 t3
Fig 1.7 Schematic diagrams of the evolution of (a) bedrockand (b) alluvial channels through time, illustrating theadvective behavior of bedrock channels and the diffusivebehavior of alluvial channels.
throughout the reach. If drainage area is uni-form and n = 1 is assumed, the erosion rateis proportional to the channel slope accordingto the stream-power model. Accordingly, steeperportions of the bed will erode faster, result-
ing in the propagation of knickpoints upstreamas topographic waves. The rate of knickpointpropagation is equal to K w Am, i.e. knickpointspropagate faster in larger channels, wetter cli-mates, and areas of more easily-eroded bedrock.The stream-power model will serve as the typeexample of the advection/wave equation studiedin Chapter 4.
The Kern River (Figures 1.8 and 1.9) pro-vides a nice example of knickpoint propaga-tion in action. Two distinct topographic surfaceshave long been recognized in the landscape ofthe southern Sierra Nevada (Webb, 1946) (Figure1.8). The Boreal surface is a high-elevation, low-relief plateau that dips to the west at 1◦ (Fig-ure 1.8b). The Chagoopa Plateau is an interme-diate topographic ‘‘bench’’ that is restricted tothe major river canyons and inset into the Bo-real Plateau (Webb, 1946; Jones, 1987). Figure 1.8bmaps the maximum extents of the Chagoopaand Boreal Plateaux based on elevation rangesof 1750--2250 m (Chagoopa) and 2250--3500 m a.s.l.(Boreal). Associated with each surface are promi-nent knickpoints along major rivers. Knickpointsalong the North Fork Kern River, for example(Figure 1.9b), occur at elevations of 1600--2100 mand 2500--3300 m a.s.l. The stepped nature of theSierra Nevada topography is generally consideredto be the result of two pulses of Cenozoic and/orlate Cretaceous uplift (Clark et al., 2005; Pelletier,2007c). According to this model, two major knick-points were created during uplift, each initiatinga wave of incision that is still propagating head-ward towards the range crest.
Recent work has highlighted the importanceof abrasion in controlling bedrock channel evo-lution. In the abrasion process it is sediment, notwater, that acts as the primary erosional agent.In the stream-power model, the erosive power isassumed to be a power function of drainage area.Although sediment flux increases with drainagearea, upstream relief also plays an important rolein controlling sediment flux. As such, the stream-power model does not adequately represent theabrasion process. Sklar and Dietrich (2001, 2004)developed a saltation-abrasion model to quan-tify this process of bedrock channel erosion. In-sights into their model can be gained by re-placing drainage area with sediment flux in the
Fig. 1.7, Pelletier, 2008
Discharge
SlopeBedrockstrength
www.helsinki.fi/yliopistoIntro to Quantitative Geology
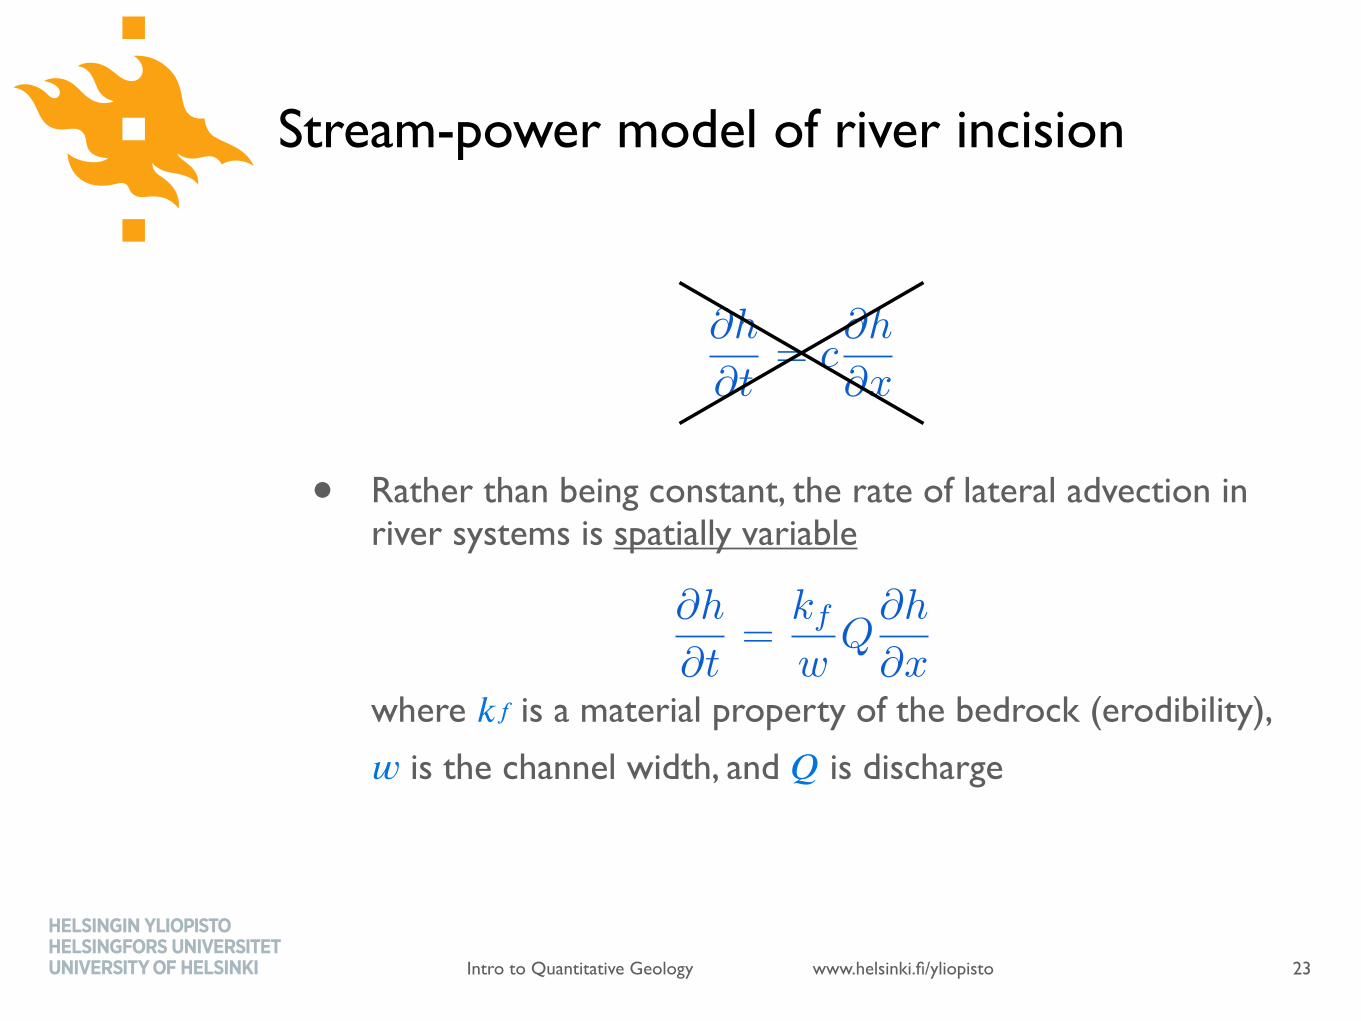
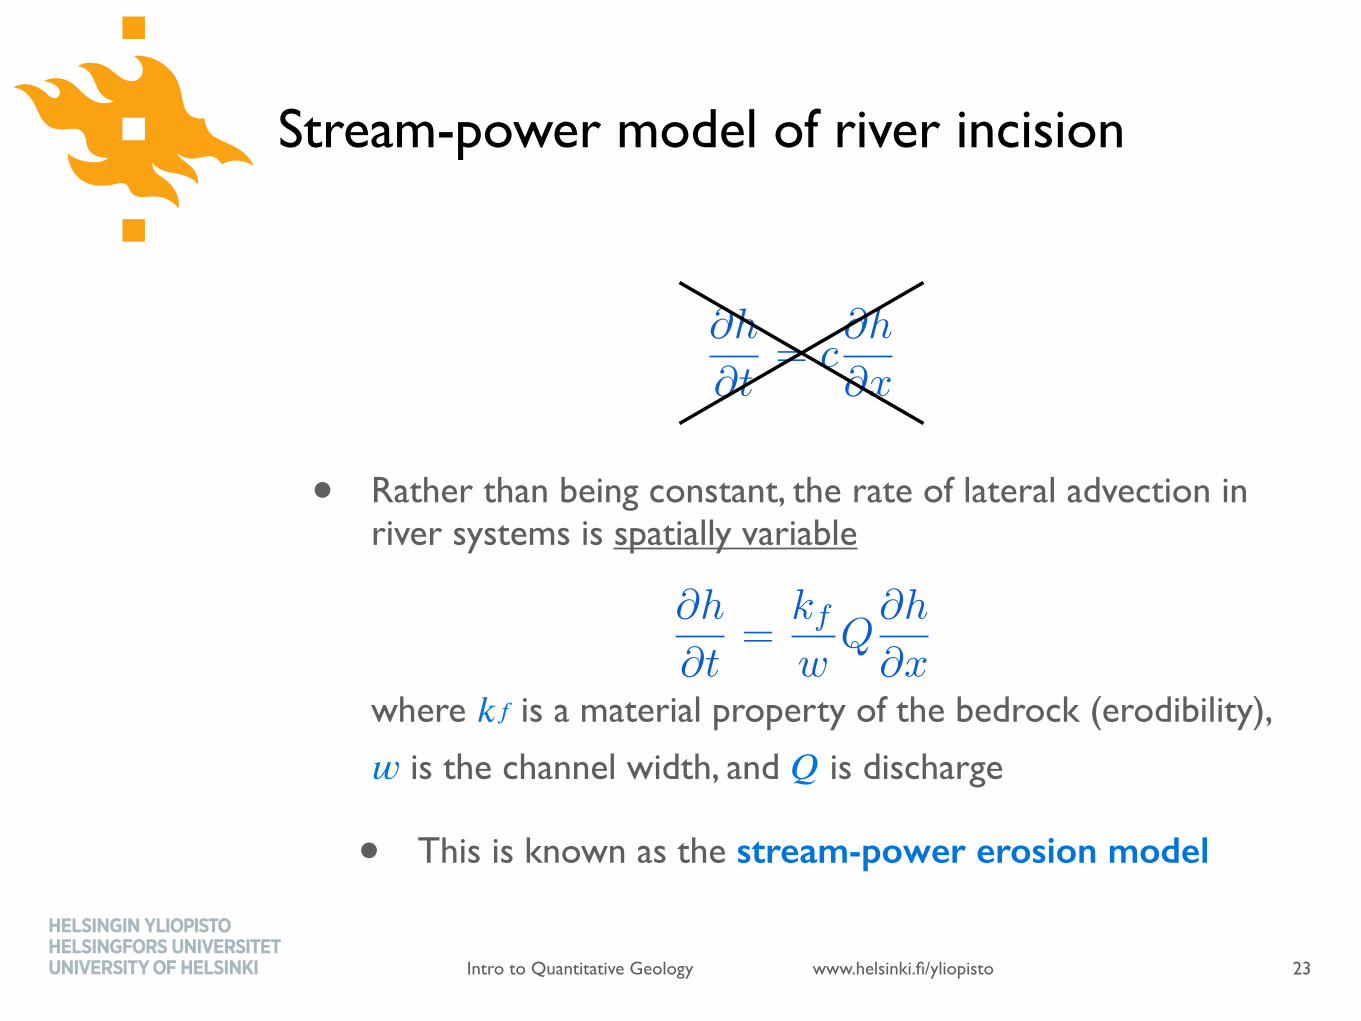
• Rather than being constant, the rate of lateral advection in river systems is spatially variablewhere )* is a material property of the bedrock (erodibility), + is the channel width, and , is discharge
@h
@t
= c
@h
@x
@h
@t
=kf
w
Q
@h
@x
Stream-power model of river incision
23
www.helsinki.fi/yliopistoIntro to Quantitative Geology
• Rather than being constant, the rate of lateral advection in river systems is spatially variablewhere )* is a material property of the bedrock (erodibility), + is the channel width, and , is discharge
• This is known as the stream-power erosion model
@h
@t
= c
@h
@x
@h
@t
=kf
w
Q
@h
@x
Stream-power model of river incision
23

www.helsinki.fi/yliopistoIntro to Quantitative Geology
@h
@t= KAmSn@h
@t
=kf
w
Q
@h
@x
Stream-power model of river incision
• If we assume precipitation is uniform in the drainage basin, discharge , will scale with drainage basin area, so we can modify our equation to readwhere - is an erosional efficiency factor (accounts for lithology, climate, channel geometry, sediment supply, etc. (!)), . is upstream drainage area, / is channel slope, and 0 and 1 are area and slope exponents
• If we assume the drainage basin area increases with distance from the drainage divide $, we can replace the area with an
estimate . = $5/3
24

www.helsinki.fi/yliopistoIntro to Quantitative Geology
Test your might
• Based on our stream-power erosion equation, what general form would a channel profile take?
• If we assume we have reached a steady state (2h/2t = 0) and
1 = 1, erosion must balance uplift U everywhere
• If we further assume precipitation is constant, bedrock erodibility is constant and . = $5/3, how would the channel steepness vary as you move downstream from the divide?
• Think about how S would change as x increases25
h
x
Initial geometry
U@h
@t= U �KAmSn
www.helsinki.fi/yliopistoIntro to Quantitative Geology
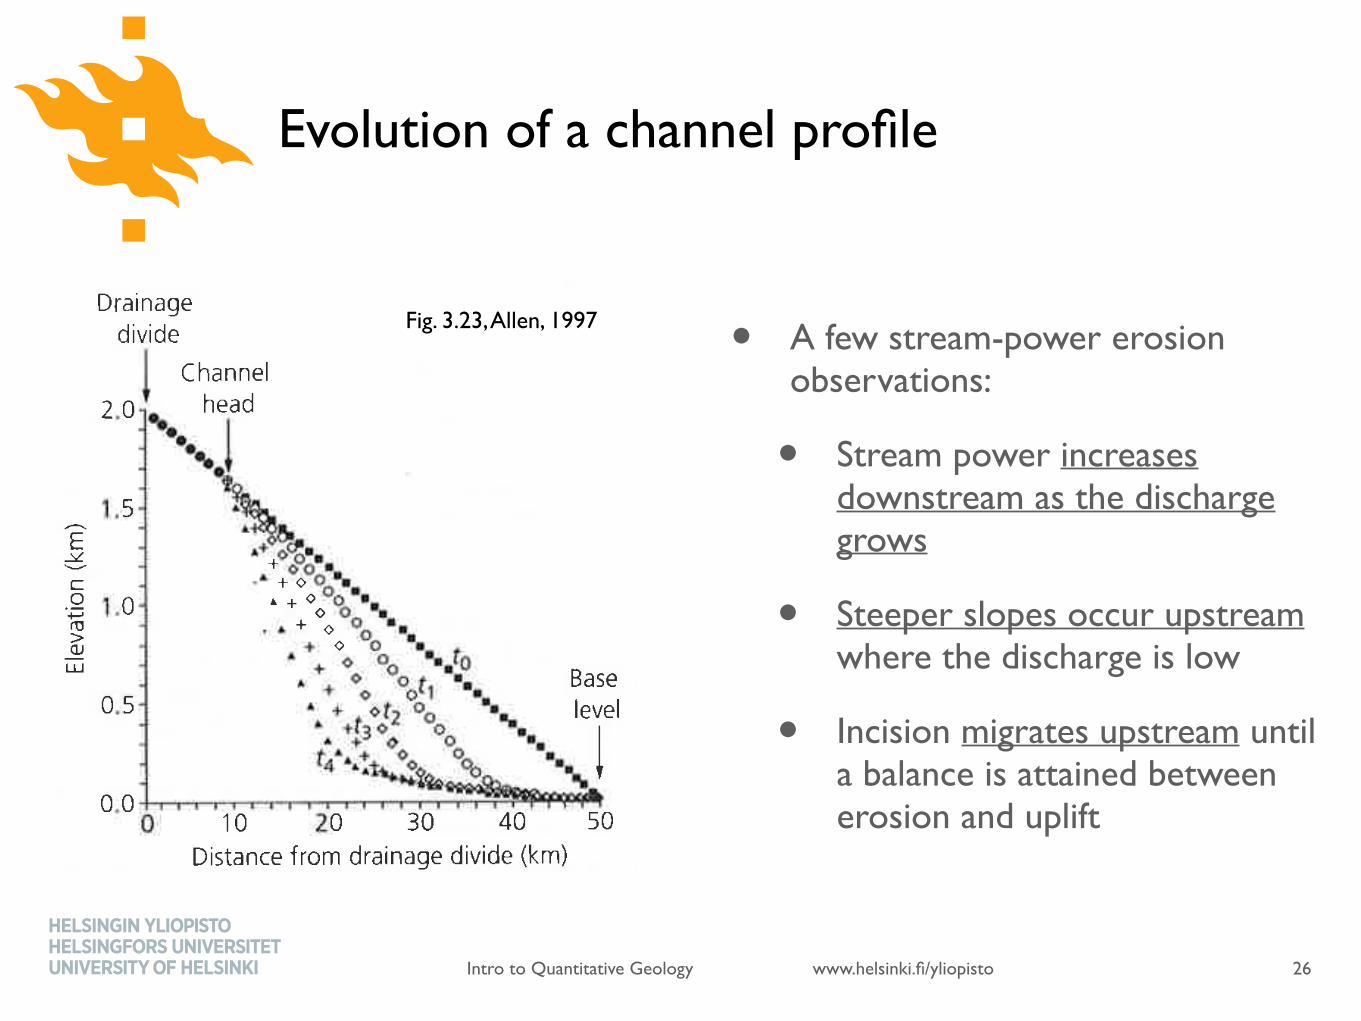
Evolution of a channel profile
• A few stream-power erosion observations:
• Stream power increases downstream as the discharge grows
• Steeper slopes occur upstream where the discharge is low
• Incision migrates upstream until a balance is attained between erosion and uplift
26
Fig. 3.23, Allen, 1997

www.helsinki.fi/yliopistoIntro to Quantitative Geology
Recap
• What is the main difference between the advection and diffusion equations?
• What is special about the stream power erosion model compared to the general advection equation?
27
www.helsinki.fi/yliopistoIntro to Quantitative Geology
Recap
• What is the main difference between the advection and diffusion equations?
• What is special about the stream power erosion model compared to the general advection equation?
28

www.helsinki.fi/yliopistoIntro to Quantitative Geology
References
Allen, P. A. (1997). Earth Surface Processes (First edition.). Wiley-Blackwell.
Pelletier, J. D. (2008). Quantitative modeling of earth surface processes (Vol. 304). Cambridge University Press.
29