Introduction to QSAR Methodology
28
An Introduction to QSAR Methodology Allen B. Richon Network Science Corporation 1116 Miller Mountain Road Saluda, NC 28773-8677 Stanley S. Young Glaxo Wellcome Research Five Moore Drive Research Tri angle Park, NC 27709 http://www.net sci.org/Science/Compchem/ feature19.html Introduction Drug design is an iterative process which begins with a compound that displays an interesting biological profile and ends with optimizing both the activity profile for the molecule and its chemical synthesis. The process is initiated when the chemist conceives a hypothesis which relates the chemical features of the molec ule (or series of mole cules ) to the biol ogica l acti vity . Withou t a detai led under stand ing of the biochemical process(es) responsible for activity , the hypothesis generally is refined by examining structural similarities and differences for active and inactive molecules. Compounds are selected for synthesis which maximize the presence of functional groups or features believed to be responsible for activity . The combinatorial possibilities of this strategy for even simple systems can be explosive. As an example, the number of compounds required for synthesis in order to place 10 substituents on the four open positions of an asymmetrically disubstituted benzene ring system is approximately 10,000. The alternative to this labor intensi ve appro ach to compo und opti miza tion is to devel op a theo ry that quantit ative ly relat es variations in biological activity to changes in molecular descriptors which can easily be obtained for each compound. A Quantitative Structure Activity Relationship (QSAR) can then be utilized to help guide chemical synthesis. This chapter develops the concepts used to derive a QSAR and reviews the application of these techniques to medicinal research. Statistical Concepts Compu tati onal chemi stry represen ts mole cular structur es as a numerical models and simu late s thei r behavior with the equations of quantum and classical physics. A vailable programs enable scientists to easily generate and present molecular data including geometries, energies and associated properties (electronic, spectroscopic and bulk). The usual paradigm for displaying and manipulating these data is a table in which compounds are defined by individual rows and molecular properties (or descriptors) are defined by the associated columns. A QSAR attempts to find consistent relationships between the variations in the values
Transcript of Introduction to QSAR Methodology
8/14/2019 Introduction to QSAR Methodology
http://slidepdf.com/reader/full/introduction-to-qsar-methodology 1/28
An Introduction to QSAR Methodology
Allen B. Richon
Network Science Corporation
1116 Miller Mountain Road Saluda, NC 28773-8677
Stanley S. Young
Glaxo Wellcome Research Five Moore Drive Research Triangle Park, NC 27709
http://www.netsci.org/Science/Compchem/feature19.html
Introduction
Drug design is an iterative process which begins with a compound that displays an interesting biological profile and ends with optimizing both the activity profile for the molecule and its chemical synthesis. The process is initiated when the chemist conceives a hypothesis which relates the chemical features of themolecule (or series of molecules) to the biological activity. Without a detailed understanding of the
biochemical process(es) responsible for activity, the hypothesis generally is refined by examining structuralsimilarities and differences for active and inactive molecules. Compounds are selected for synthesis whichmaximize the presence of functional groups or features believed to be responsible for activity.
The combinatorial possibilities of this strategy for even simple systems can be explosive. As an example,the number of compounds required for synthesis in order to place 10 substituents on the four open positionsof an asymmetrically disubstituted benzene ring system is approximately 10,000. The alternative to thislabor intensive approach to compound optimization is to develop a theory that quantitatively relatesvariations in biological activity to changes in molecular descriptors which can easily be obtained for eachcompound. A Quantitative Structure Activity Relationship (QSAR) can then be utilized to help guidechemical synthesis. This chapter develops the concepts used to derive a QSAR and reviews the applicationof these techniques to medicinal research.
Statistical Concepts
Computational chemistry represents molecular structures as a numerical models and simulates their behavior with the equations of quantum and classical physics. Available programs enable scientists to easilygenerate and present molecular data including geometries, energies and associated properties (electronic,spectroscopic and bulk). The usual paradigm for displaying and manipulating these data is a table in whichcompounds are defined by individual rows and molecular properties (or descriptors) are defined by theassociated columns. A QSAR attempts to find consistent relationships between the variations in the values

8/14/2019 Introduction to QSAR Methodology
http://slidepdf.com/reader/full/introduction-to-qsar-methodology 2/28
of molecular properties and the biological activity for a series of compounds so that these "rules" can beused to evaluate new chemical entities.
A QSAR generally takes the form of a linear equation
Biological Activity = Const + (C 1 P1) + (C 2 P2) + (C 3 P3) + ...
where the parameters P 1 through P n are computed for each molecule in the series and the coefficients C 1
through C n are calculated by fitting variations in the parameters and the biological activity. Since theserelationships are generally discovered through the application of statistical techniques, a brief introductionto the principles behind the derivation of a QSAR follows.
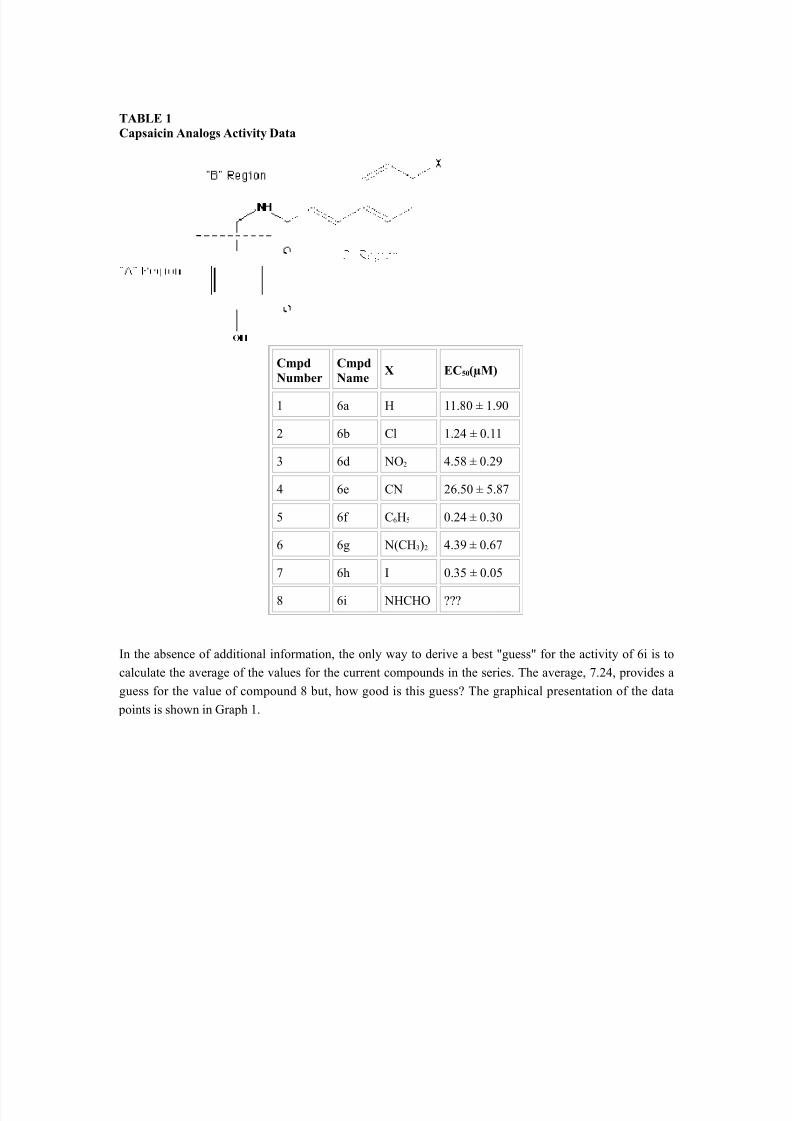
The work reported from The Sandoz Institute for Medical Research on the development of novel analgesicagents 1 can be used as an example of a simple QSAR. In this study, vanillylamides and vanillylthioureasrelated to capsaicin were prepared and their activity was tested in an in vitro assay which measured 45Ca2+
influx into dorsal root ganglia neurons. The data, which was reported as the EC 50 (µM), is shown in Table 1(note that compound 6f is the most active of the series).
8/14/2019 Introduction to QSAR Methodology
http://slidepdf.com/reader/full/introduction-to-qsar-methodology 3/28
TABLE 1Capsaicin Analogs Activity Data
CmpdNumber
CmpdName
X EC 50(µM)
1 6a H 11.80 ± 1.90
2 6b Cl 1.24 ± 0.11
3 6d NO 2 4.58 ± 0.29
4 6e CN 26.50 ± 5.87
5 6f C 6H5 0.24 ± 0.30
6 6g N(CH 3)2 4.39 ± 0.67
7 6h I 0.35 ± 0.05
8 6i NHCHO ???
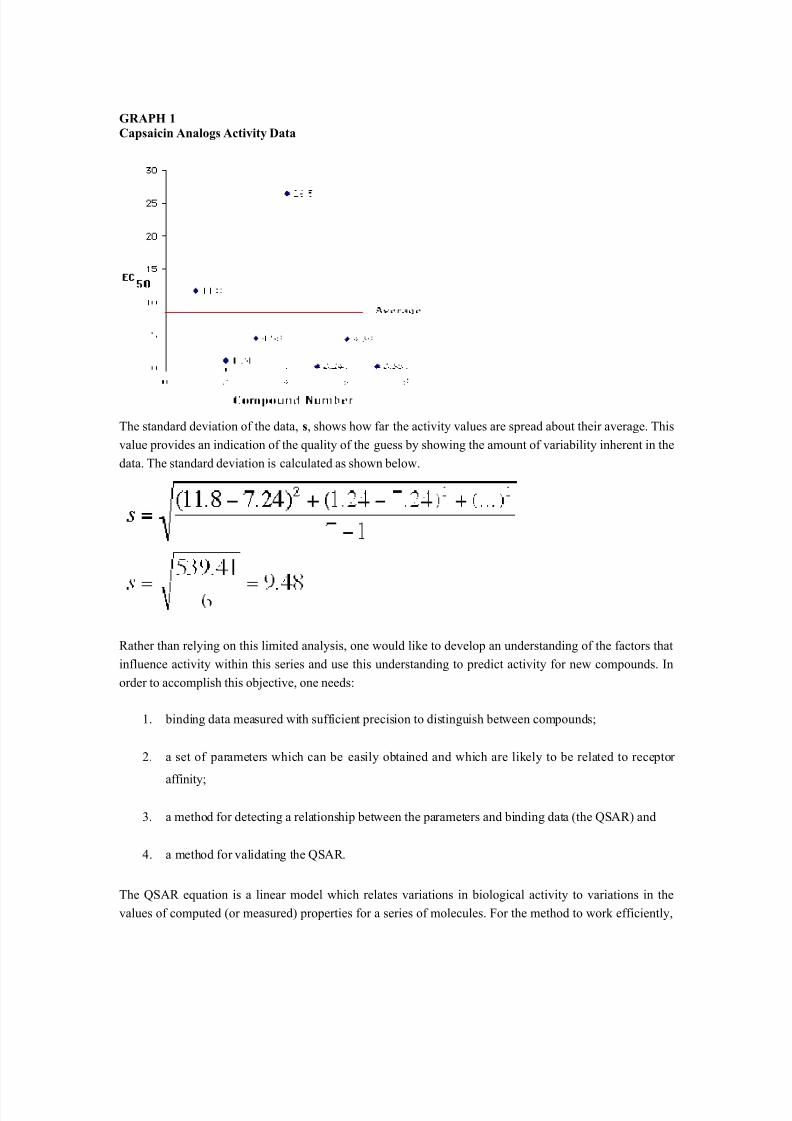
In the absence of additional information, the only way to derive a best "guess" for the activity of 6i is tocalculate the average of the values for the current compounds in the series. The average, 7.24, provides aguess for the value of compound 8 but, how good is this guess? The graphical presentation of the data
points is shown in Graph 1.
8/14/2019 Introduction to QSAR Methodology
http://slidepdf.com/reader/full/introduction-to-qsar-methodology 4/28
GRAPH 1Capsaicin Analogs Activity Data
The standard deviation of the data, s, shows how far the activity values are spread about their average. Thisvalue provides an indication of the quality of the guess by showing the amount of variability inherent in thedata. The standard deviation is calculated as shown below.
Rather than relying on this limited analysis, one would like to develop an understanding of the factors thatinfluence activity within this series and use this understanding to predict activity for new compounds. Inorder to accomplish this objective, one needs:
1. binding data measured with sufficient precision to distinguish between compounds;
2. a set of parameters which can be easily obtained and which are likely to be related to receptor
affinity;
3. a method for detecting a relationship between the parameters and binding data (the QSAR) and
4. a method for validating the QSAR.
The QSAR equation is a linear model which relates variations in biological activity to variations in thevalues of computed (or measured) properties for a series of molecules. For the method to work efficiently,
8/14/2019 Introduction to QSAR Methodology
http://slidepdf.com/reader/full/introduction-to-qsar-methodology 5/28
the compounds selected to describe the "chemical space" of the experiments (the training set) should bediverse. In many synthesis campaigns, compounds are prepared which are structurally similar to the leadstructure. Not surprisingly, the activity values for this series of compounds will frequently span a limitedrange as well. In these cases, additional compounds must be made and tested to fill out the training set.
The quality of any QSAR will only be as good as the quality of the data which is used to derive the model.Dose-response curves need to be smooth, contain enough points to assure accuracy and should span two or more orders of magnitude. Multiple readings for a given observation should be reproducible and haverelatively smaller errors. The issue being addressed is the signal-to-noise ratio. The variation of thereadings obtained by repeatedly testing the same compound should be much smaller than the variation over the series. In cases where the data collected from biological experiments do not follow these guidelines,other methods of data analysis should be utilized since the QSAR models derived from the data will bequestionable.
Once biological data has been collected, it is often found that the data is expressed in terms which cannot be used in a QSAR analysis. Since QSAR is based on the relationship of free energy to equilibrium
constants, the data for a QSAR study must be expressed in terms of the free energy changes that occur during the biological response. When examining the potency of a drug (the dosage required to produce a
biological effect), the change in free energy can be calculated to be proportional to the inverse logarithm of the concentration of the compound.
G0 = - 2.3RTlogK = log 1/[S]
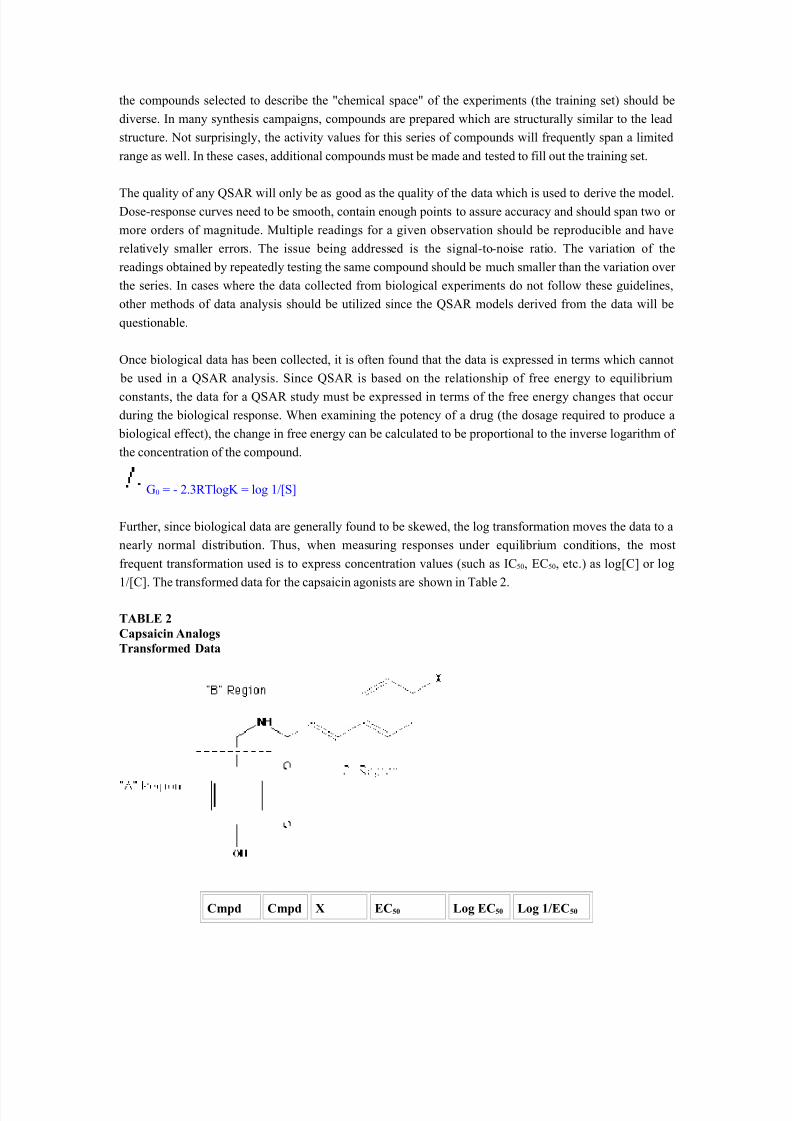
Further, since biological data are generally found to be skewed, the log transformation moves the data to anearly normal distribution. Thus, when measuring responses under equilibrium conditions, the mostfrequent transformation used is to express concentration values (such as IC 50, EC 50, etc.) as log[C] or log1/[C]. The transformed data for the capsaicin agonists are shown in Table 2.
TABLE 2Capsaicin AnalogsTransformed Data
Cmpd Cmpd X EC 50 Log EC 50 Log 1/EC 50
8/14/2019 Introduction to QSAR Methodology
http://slidepdf.com/reader/full/introduction-to-qsar-methodology 6/28
Number Name
1 6a H 11.80 ± 1.90 1.07 -1.07
2 6b Cl 1.24 ± 0.11 0.09 -0.09
3 6d NO 2 4.58 ± 0.29 0.66 -0.664 6e CN 26.50 ± 5.87 1.42 -1.42
5 6f C 6H5 0.24 ± 0.30 - 0.62 0.62
6 6g N(CH 3)2 4.39 ± 0.67 0.64 -0.64
7 6h I 0.35 ± 0.05 - 0.46 0.46
8 6i NHCHO ?? ± ?? ?? ??
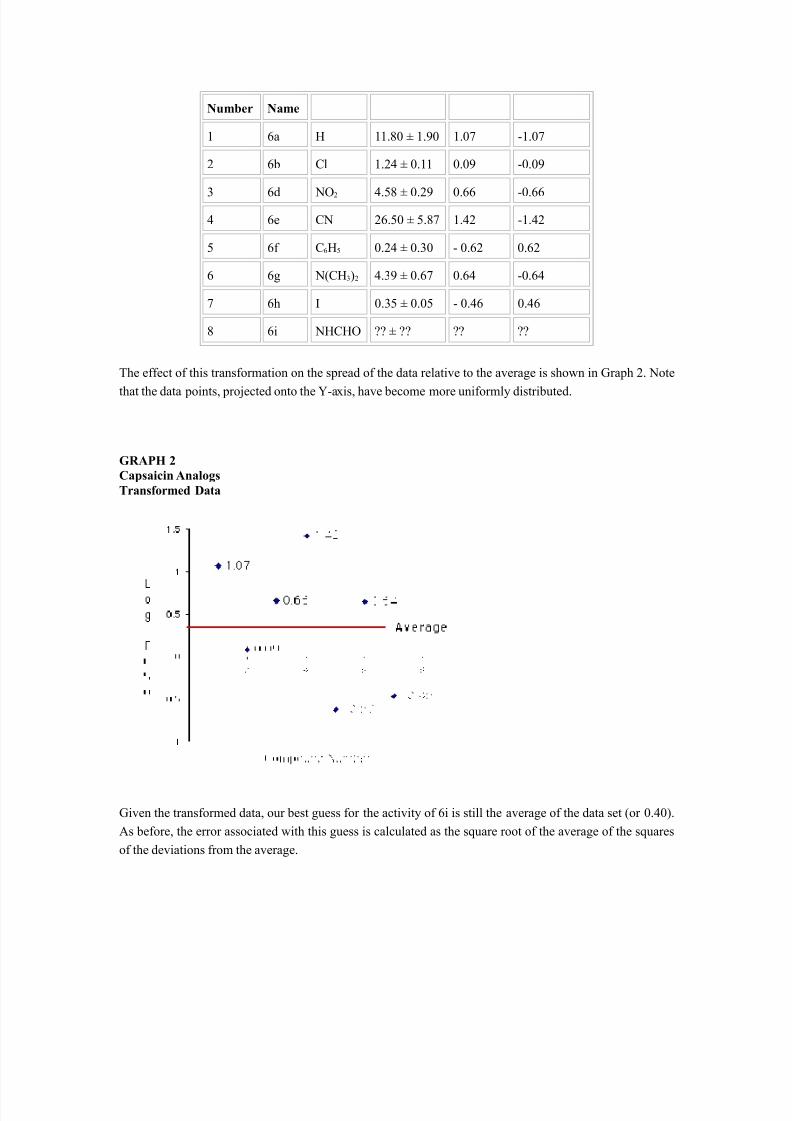
The effect of this transformation on the spread of the data relative to the average is shown in Graph 2. Note
that the data points, projected onto the Y-axis, have become more uniformly distributed.
GRAPH 2Capsaicin AnalogsTransformed Data
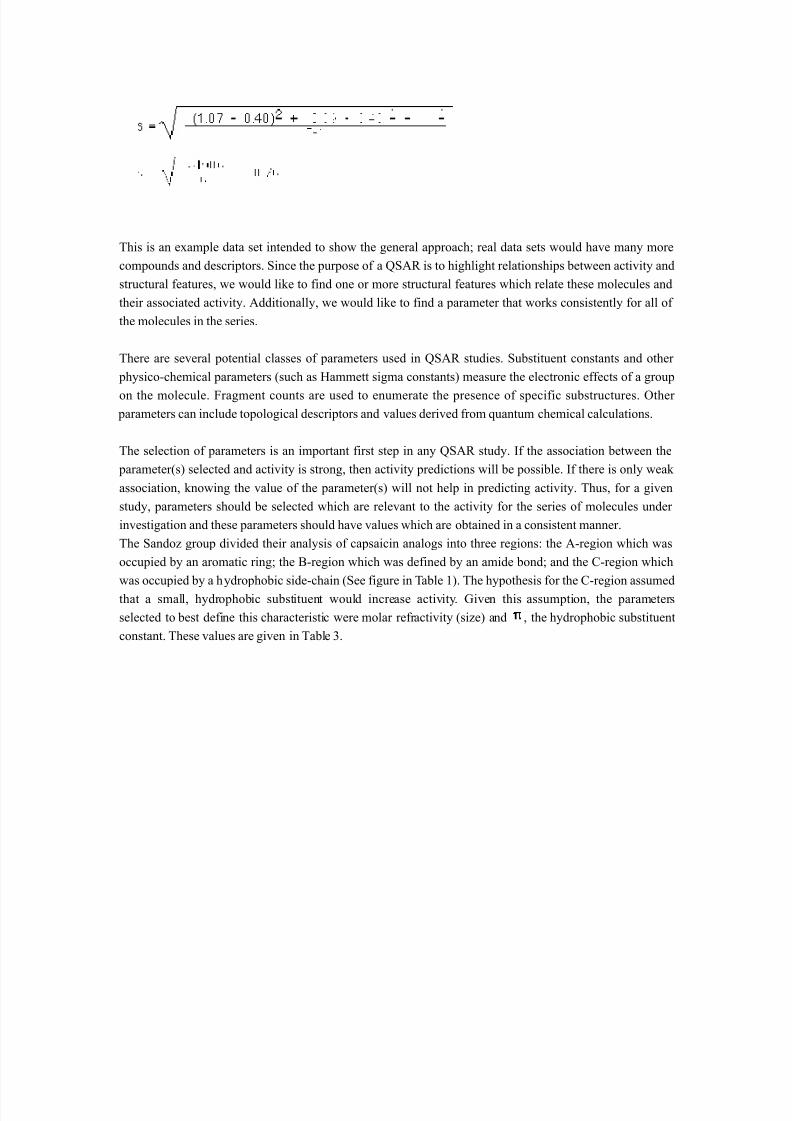
Given the transformed data, our best guess for the activity of 6i is still the average of the data set (or 0.40).As before, the error associated with this guess is calculated as the square root of the average of the squaresof the deviations from the average.
8/14/2019 Introduction to QSAR Methodology
http://slidepdf.com/reader/full/introduction-to-qsar-methodology 7/28
This is an example data set intended to show the general approach; real data sets would have many morecompounds and descriptors. Since the purpose of a QSAR is to highlight relationships between activity andstructural features, we would like to find one or more structural features which relate these molecules andtheir associated activity. Additionally, we would like to find a parameter that works consistently for all of the molecules in the series.
There are several potential classes of parameters used in QSAR studies. Substituent constants and other physico-chemical parameters (such as Hammett sigma constants) measure the electronic effects of a group
on the molecule. Fragment counts are used to enumerate the presence of specific substructures. Other parameters can include topological descriptors and values derived from quantum chemical calculations.
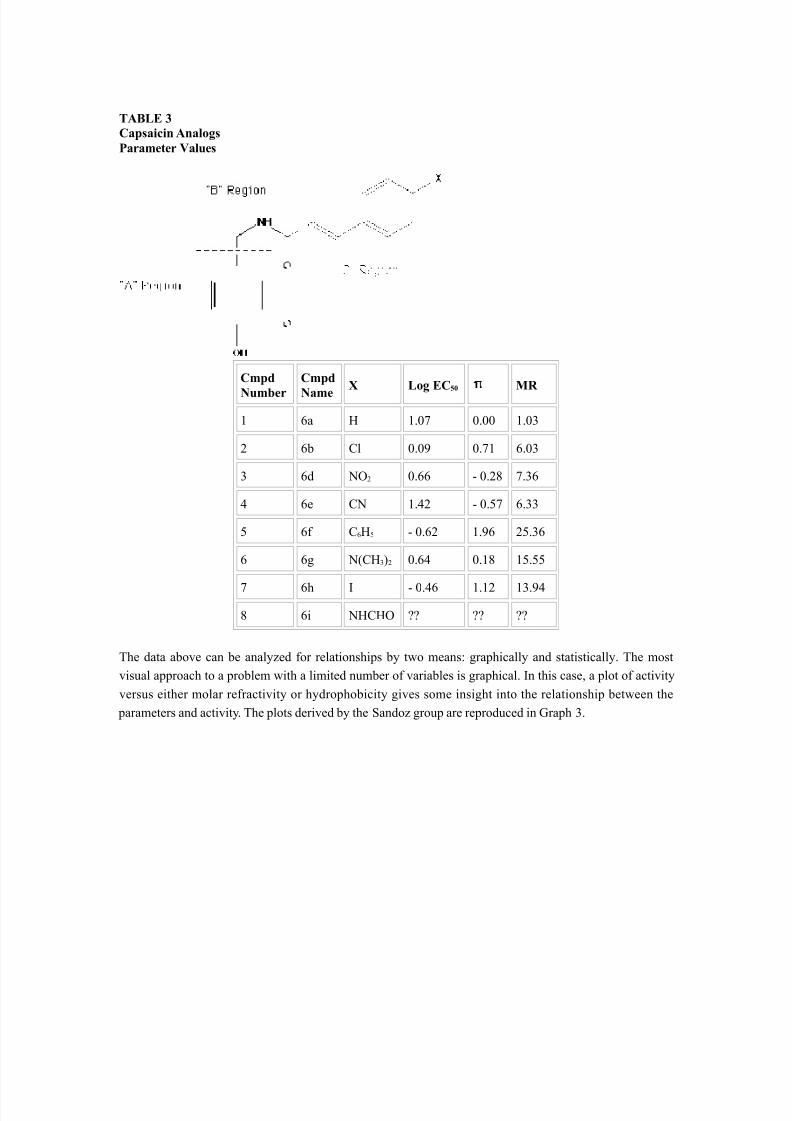
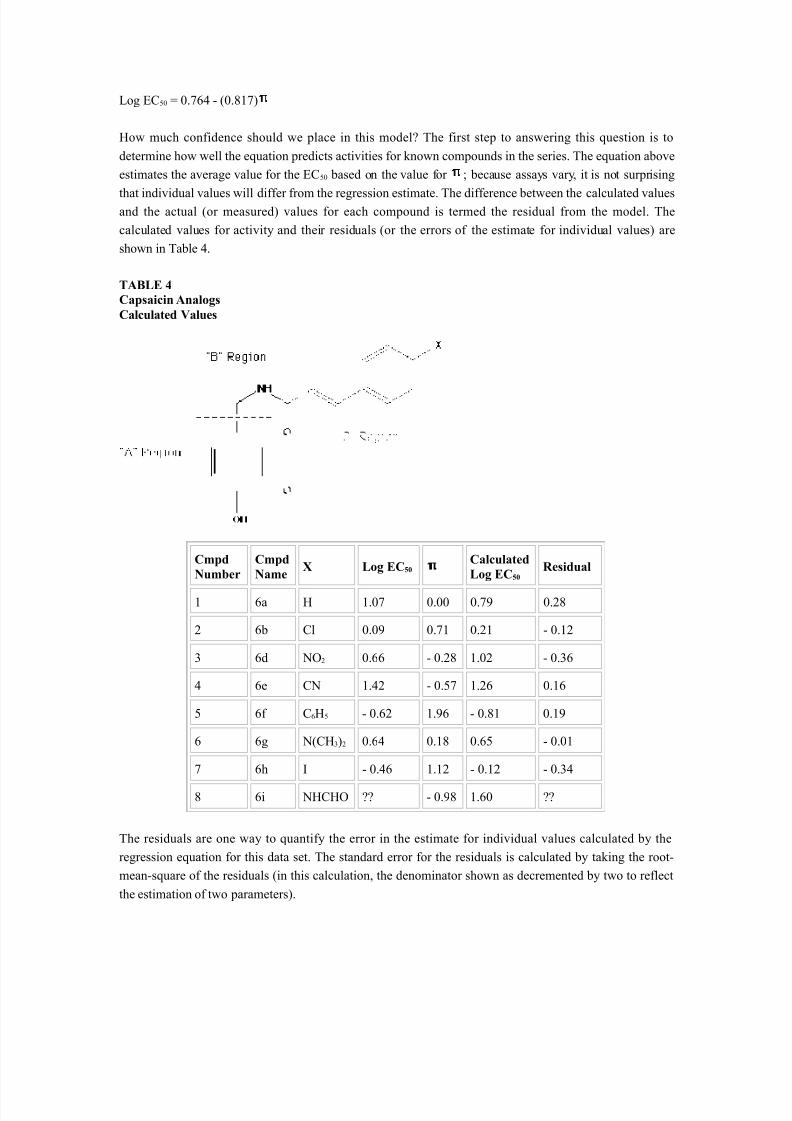
The selection of parameters is an important first step in any QSAR study. If the association between the parameter(s) selected and activity is strong, then activity predictions will be possible. If there is only weak association, knowing the value of the parameter(s) will not help in predicting activity. Thus, for a givenstudy, parameters should be selected which are relevant to the activity for the series of molecules under investigation and these parameters should have values which are obtained in a consistent manner.The Sandoz group divided their analysis of capsaicin analogs into three regions: the A-region which wasoccupied by an aromatic ring; the B-region which was defined by an amide bond; and the C-region whichwas occupied by a hydrophobic side-chain (See figure in Table 1). The hypothesis for the C-region assumedthat a small, hydrophobic substituent would increase activity. Given this assumption, the parametersselected to best define this characteristic were molar refractivity (size) and , the hydrophobic substituentconstant. These values are given in Table 3.
8/14/2019 Introduction to QSAR Methodology
http://slidepdf.com/reader/full/introduction-to-qsar-methodology 8/28
8/14/2019 Introduction to QSAR Methodology
http://slidepdf.com/reader/full/introduction-to-qsar-methodology 9/28
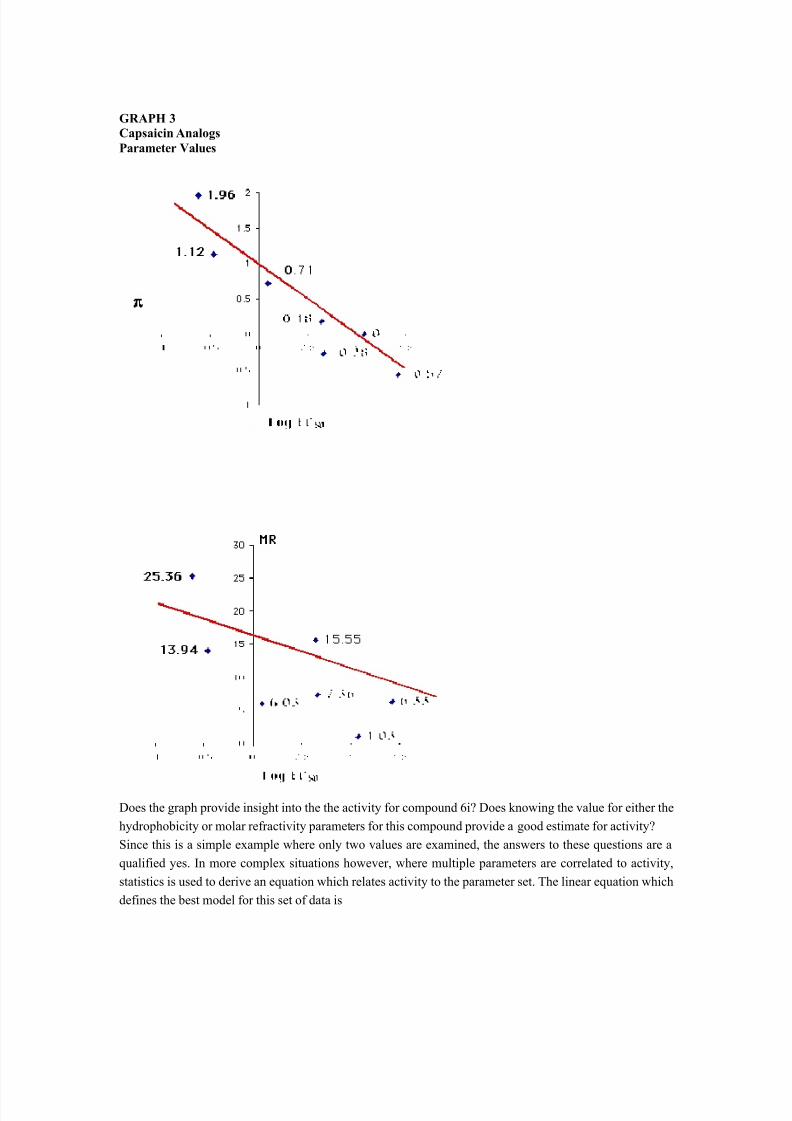
GRAPH 3Capsaicin AnalogsParameter Values
Does the graph provide insight into the the activity for compound 6i? Does knowing the value for either thehydrophobicity or molar refractivity parameters for this compound provide a good estimate for activity?Since this is a simple example where only two values are examined, the answers to these questions are aqualified yes. In more complex situations however, where multiple parameters are correlated to activity,statistics is used to derive an equation which relates activity to the parameter set. The linear equation whichdefines the best model for this set of data is
8/14/2019 Introduction to QSAR Methodology
http://slidepdf.com/reader/full/introduction-to-qsar-methodology 10/28
Log EC 50 = 0.764 - (0.817)
How much confidence should we place in this model? The first step to answering this question is todetermine how well the equation predicts activities for known compounds in the series. The equation aboveestimates the average value for the EC 50 based on the value for ; because assays vary, it is not surprising
that individual values will differ from the regression estimate. The difference between the calculated valuesand the actual (or measured) values for each compound is termed the residual from the model. Thecalculated values for activity and their residuals (or the errors of the estimate for individual values) areshown in Table 4.
TABLE 4Capsaicin AnalogsCalculated Values
CmpdNumber
CmpdName
X Log EC 50CalculatedLog EC 50
Residual
1 6a H 1.07 0.00 0.79 0.28
2 6b Cl 0.09 0.71 0.21 - 0.12
3 6d NO 2 0.66 - 0.28 1.02 - 0.36
4 6e CN 1.42 - 0.57 1.26 0.16
5 6f C 6H5 - 0.62 1.96 - 0.81 0.19
6 6g N(CH 3)2 0.64 0.18 0.65 - 0.01
7 6h I - 0.46 1.12 - 0.12 - 0.34
8 6i NHCHO ?? - 0.98 1.60 ??
The residuals are one way to quantify the error in the estimate for individual values calculated by theregression equation for this data set. The standard error for the residuals is calculated by taking the root-mean-square of the residuals (in this calculation, the denominator shown as decremented by two to reflectthe estimation of two parameters).
8/14/2019 Introduction to QSAR Methodology
http://slidepdf.com/reader/full/introduction-to-qsar-methodology 11/28
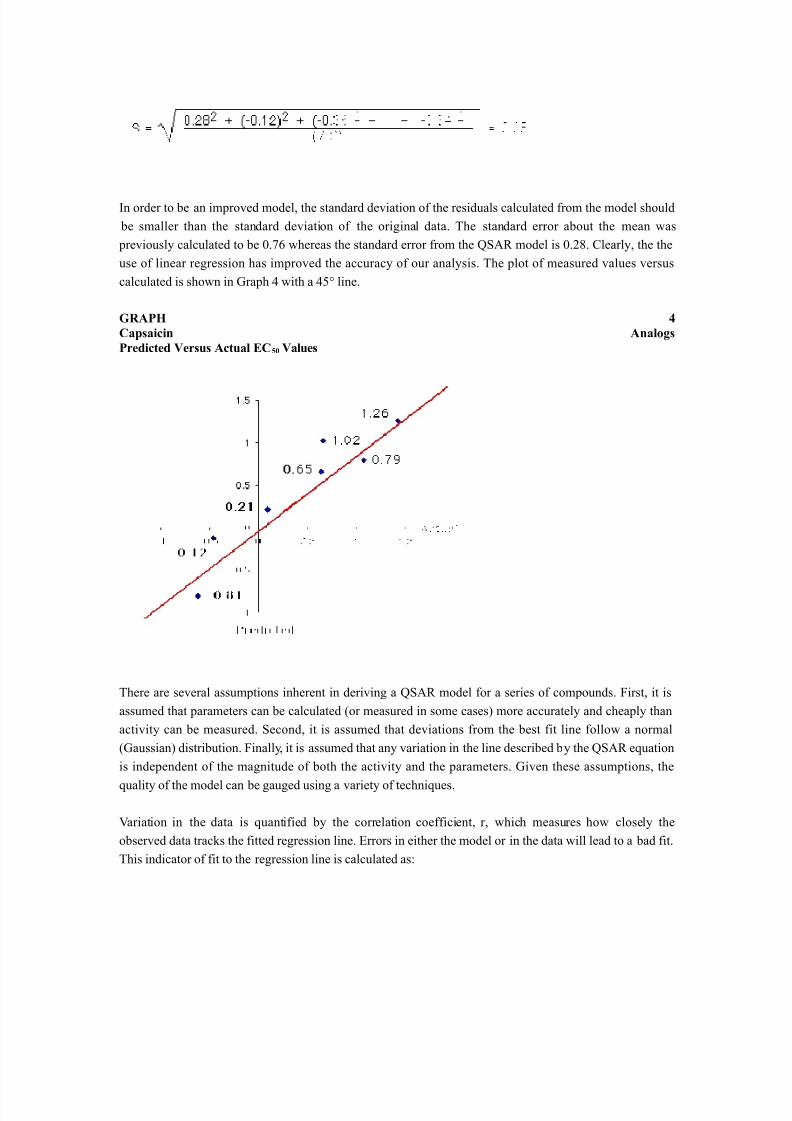
In order to be an improved model, the standard deviation of the residuals calculated from the model should be smaller than the standard deviation of the original data. The standard error about the mean was previously calculated to be 0.76 whereas the standard error from the QSAR model is 0.28. Clearly, the theuse of linear regression has improved the accuracy of our analysis. The plot of measured values versuscalculated is shown in Graph 4 with a 45° line.
GRAPH 4Capsaicin AnalogsPredicted Versus Actual EC 50 Values
There are several assumptions inherent in deriving a QSAR model for a series of compounds. First, it isassumed that parameters can be calculated (or measured in some cases) more accurately and cheaply thanactivity can be measured. Second, it is assumed that deviations from the best fit line follow a normal(Gaussian) distribution. Finally, it is assumed that any variation in the line described by the QSAR equationis independent of the magnitude of both the activity and the parameters. Given these assumptions, the
quality of the model can be gauged using a variety of techniques.
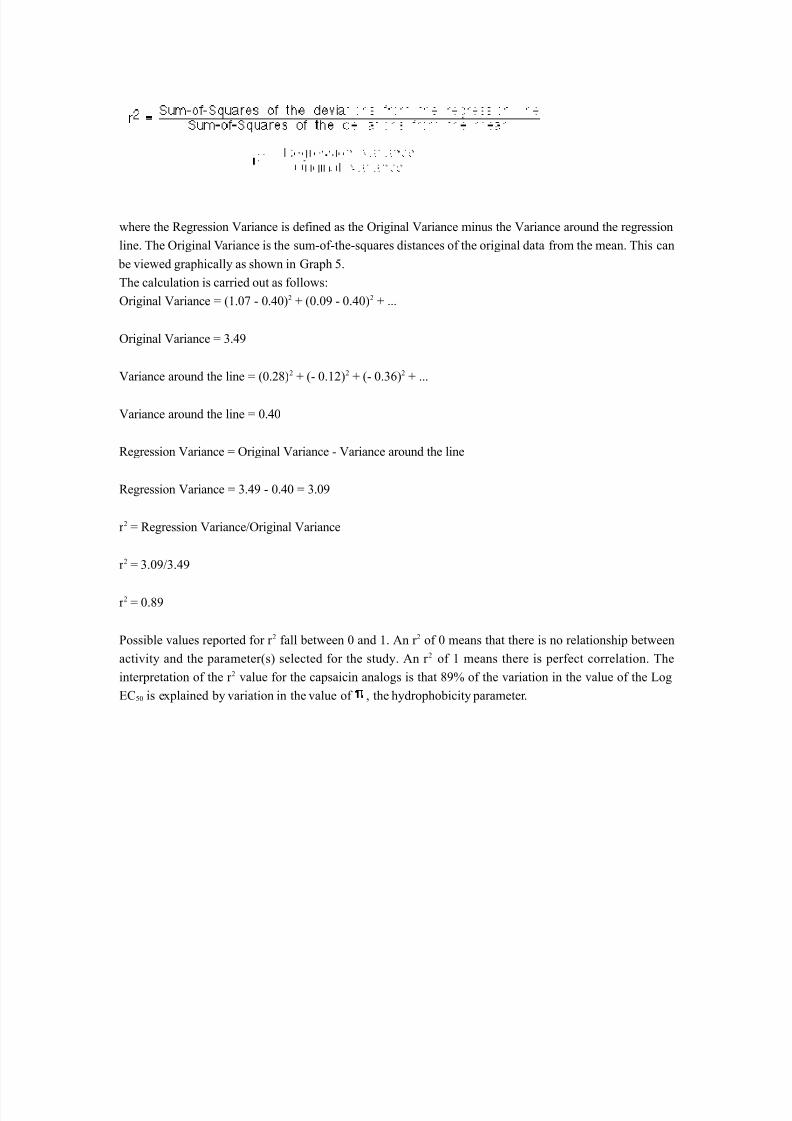
Variation in the data is quantified by the correlation coefficient, r, which measures how closely theobserved data tracks the fitted regression line. Errors in either the model or in the data will lead to a bad fit.This indicator of fit to the regression line is calculated as:
8/14/2019 Introduction to QSAR Methodology
http://slidepdf.com/reader/full/introduction-to-qsar-methodology 12/28
where the Regression Variance is defined as the Original Variance minus the Variance around the regressionline. The Original Variance is the sum-of-the-squares distances of the original data from the mean. This can
be viewed graphically as shown in Graph 5.The calculation is carried out as follows:Original Variance = (1.07 - 0.40) 2 + (0.09 - 0.40) 2 + ...
Original Variance = 3.49
Variance around the line = (0.28) 2 + (- 0.12) 2 + (- 0.36) 2 + ...
Variance around the line = 0.40
Regression Variance = Original Variance - Variance around the line
Regression Variance = 3.49 - 0.40 = 3.09
r 2 = Regression Variance/Original Variance
r 2 = 3.09/3.49
r 2 = 0.89
Possible values reported for r 2 fall between 0 and 1. An r 2 of 0 means that there is no relationship betweenactivity and the parameter(s) selected for the study. An r 2 of 1 means there is perfect correlation. Theinterpretation of the r 2 value for the capsaicin analogs is that 89% of the variation in the value of the LogEC 50 is explained by variation in the value of , the hydrophobicity parameter.
8/14/2019 Introduction to QSAR Methodology
http://slidepdf.com/reader/full/introduction-to-qsar-methodology 13/28
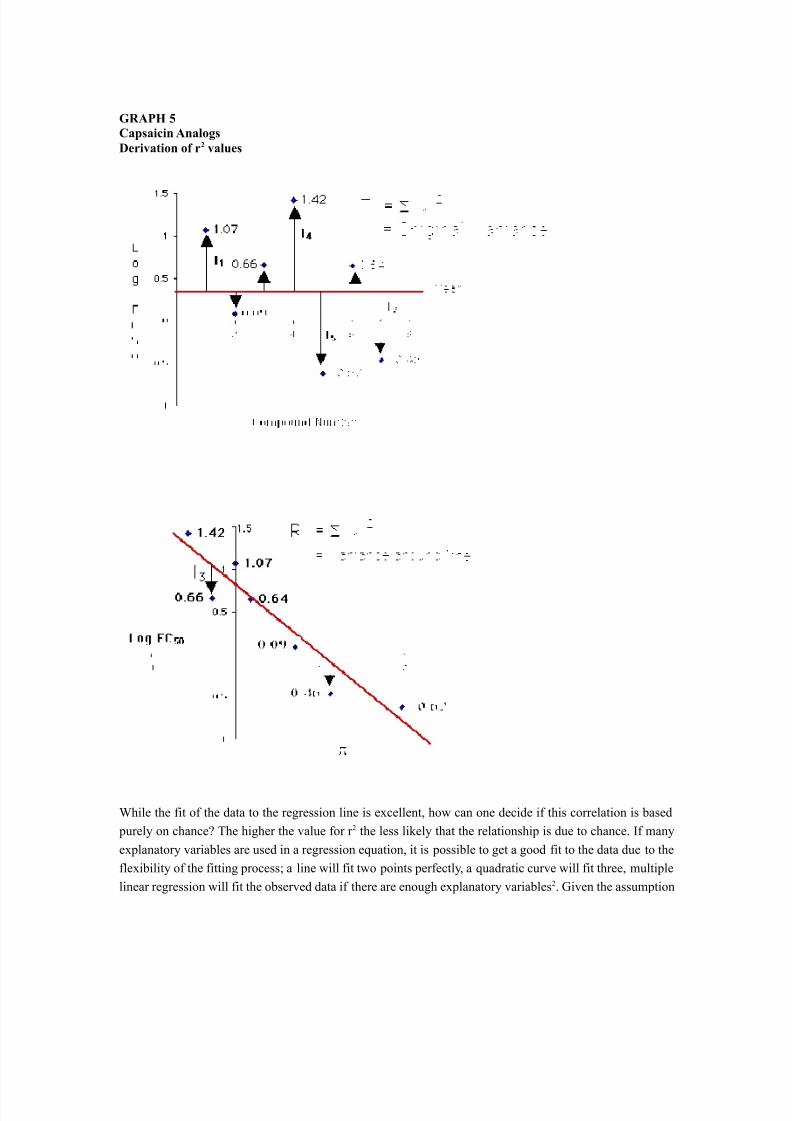
GRAPH 5Capsaicin AnalogsDerivation of r 2 values
While the fit of the data to the regression line is excellent, how can one decide if this correlation is based purely on chance? The higher the value for r 2 the less likely that the relationship is due to chance. If manyexplanatory variables are used in a regression equation, it is possible to get a good fit to the data due to theflexibility of the fitting process; a line will fit two points perfectly, a quadratic curve will fit three, multiplelinear regression will fit the observed data if there are enough explanatory variables 2. Given the assumption
8/14/2019 Introduction to QSAR Methodology
http://slidepdf.com/reader/full/introduction-to-qsar-methodology 14/28
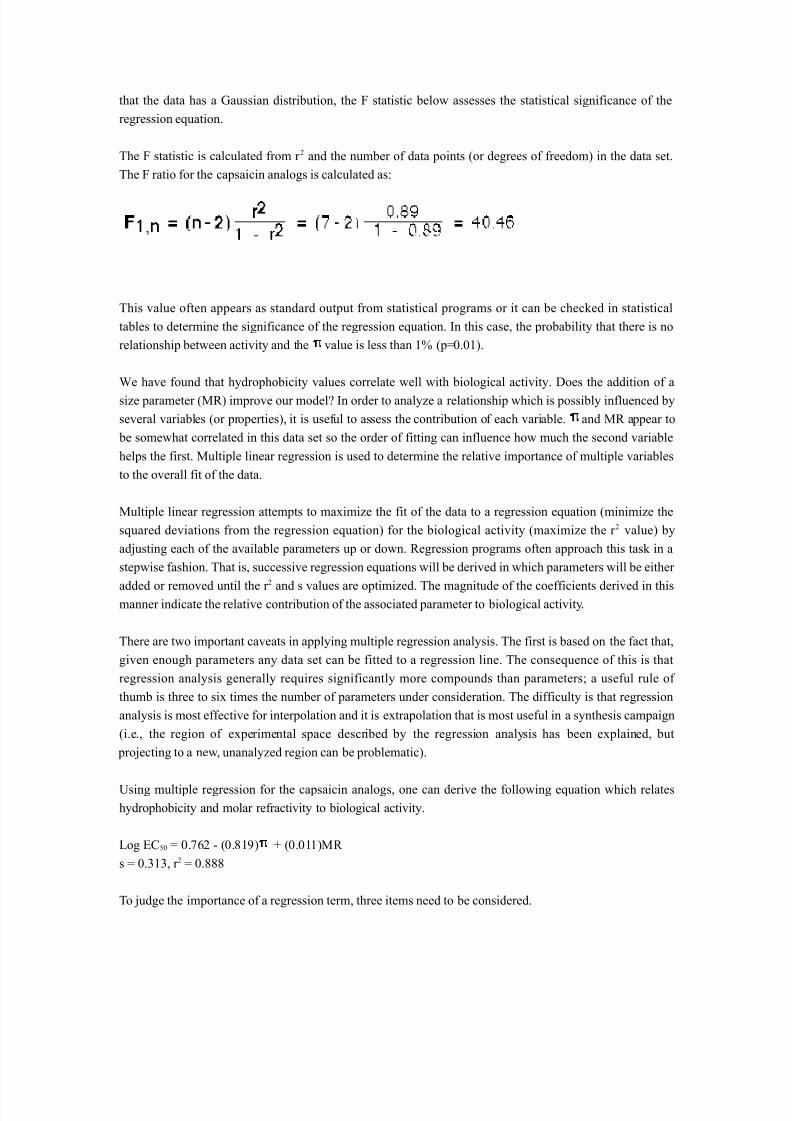
that the data has a Gaussian distribution, the F statistic below assesses the statistical significance of theregression equation.
The F statistic is calculated from r 2 and the number of data points (or degrees of freedom) in the data set.The F ratio for the capsaicin analogs is calculated as:
This value often appears as standard output from statistical programs or it can be checked in statisticaltables to determine the significance of the regression equation. In this case, the probability that there is norelationship between activity and the value is less than 1% (p=0.01).
We have found that hydrophobicity values correlate well with biological activity. Does the addition of asize parameter (MR) improve our model? In order to analyze a relationship which is possibly influenced byseveral variables (or properties), it is useful to assess the contribution of each variable. and MR appear to
be somewhat correlated in this data set so the order of fitting can influence how much the second variablehelps the first. Multiple linear regression is used to determine the relative importance of multiple variablesto the overall fit of the data.
Multiple linear regression attempts to maximize the fit of the data to a regression equation (minimize thesquared deviations from the regression equation) for the biological activity (maximize the r 2 value) byadjusting each of the available parameters up or down. Regression programs often approach this task in astepwise fashion. That is, successive regression equations will be derived in which parameters will be either
added or removed until the r 2
and s values are optimized. The magnitude of the coefficients derived in thismanner indicate the relative contribution of the associated parameter to biological activity.
There are two important caveats in applying multiple regression analysis. The first is based on the fact that,given enough parameters any data set can be fitted to a regression line. The consequence of this is thatregression analysis generally requires significantly more compounds than parameters; a useful rule of thumb is three to six times the number of parameters under consideration. The difficulty is that regressionanalysis is most effective for interpolation and it is extrapolation that is most useful in a synthesis campaign(i.e., the region of experimental space described by the regression analysis has been explained, but
projecting to a new, unanalyzed region can be problematic).
Using multiple regression for the capsaicin analogs, one can derive the following equation which relateshydrophobicity and molar refractivity to biological activity.
Log EC 50 = 0.762 - (0.819) + (0.011)MR s = 0.313, r 2 = 0.888
To judge the importance of a regression term, three items need to be considered.
8/14/2019 Introduction to QSAR Methodology
http://slidepdf.com/reader/full/introduction-to-qsar-methodology 15/28
1. Statistical significance of the regression coefficient.
2. The magnitude of the typical effect b ixi (in this case, 0.011 25.36).
3. Any cross-correlation with other terms.
As more terms are added to multiple linear regression, r 2 always gets larger. We recompute the previouscalculations (r 2 = 0.89) carrying three significant figures so that rounding does not lead to confusion.These results of this analysis indicate that, within this series , steric bulk is not an important factor inactivity. The influence of the hydrophobicity constant confirms the presence of a hydrophobic binding site.Given the limited number of substituents in this analysis, it is unlikely that more can be learned fromfurther analysis.This section has developed the fundamental mathematics of QSAR studies. Several authors have publishedreviews of QSAR and have discussed various aspects of the methods 3-8. Each of the examples to followuses these techniques to derive information about the chemical factors which are important for activity.
Approaches to Developing a QSAR
Drugs exert their biological effects by participating in a series of events which include transport, bindingwith the receptor and metabolism to an inactive species. Since the interaction mechanisms between themolecule and the putative receptor are unknown in most cases (i.e., no bound crystal structures), one isreduced to making inferences from properties which can easily be obtained (molecular properties anddescriptors) to explain these interactions for known molecules. Once the relationship is defined, it can beused to aid in the prediction of new or unknown molecules.
The first approach to developing quantitative relationships which described activity as a function of chemical structure relied on the principles of thermodynamics. The free-energy terms E, H and Swere represented by a series of parameters which could be derived for a given molecule.
Electronic effects such as electron donating and withdrawing tendencies, partial atomic charges andelectrostatic field densities were defined by Hammett sigma ( ) values, resonance parameters (R values),
inductive parameters (F values) and Taft substituent values ( *, *, E s). Steric effects such as molecular volume and surface area were represented by values calculated for Molar Refractivity and the Taft steric
parameter. Enthalpic effects were calculated using partition coefficients (LogP) or the hydrophobic parameter, , which was derived from the partition coefficient. In addition, an assortment of structuralindices were used to describe the presence of specific functional groups at positions within the molecule.The linear equation which described the relationship between activity and this parameter set was theHansch equation
log 1/[C] = A(logP) - B(logP) 2 + C(E s) + D( ) + E + ...
8/14/2019 Introduction to QSAR Methodology
http://slidepdf.com/reader/full/introduction-to-qsar-methodology 16/28
Multiple linear regression analysis was used to derive the values of the coefficients. In general, Hansch typestudies were performed on compounds which contained a common template (usually a rigid one such as anaromatic ring) with structural variation limited to functional group changes at specific sites.
Hansch utilized this approach in his analysis of 256 4,6-diamino-1,2-dihydro-2,3-dimethyl-1-(X-phenyl)-s-
triazines which were active against tumor dihydrofolate reductase9
. It was demonstrated that for 244 of thecompounds, activity could be correlated to the presence of hydrophobic groups at the three and four
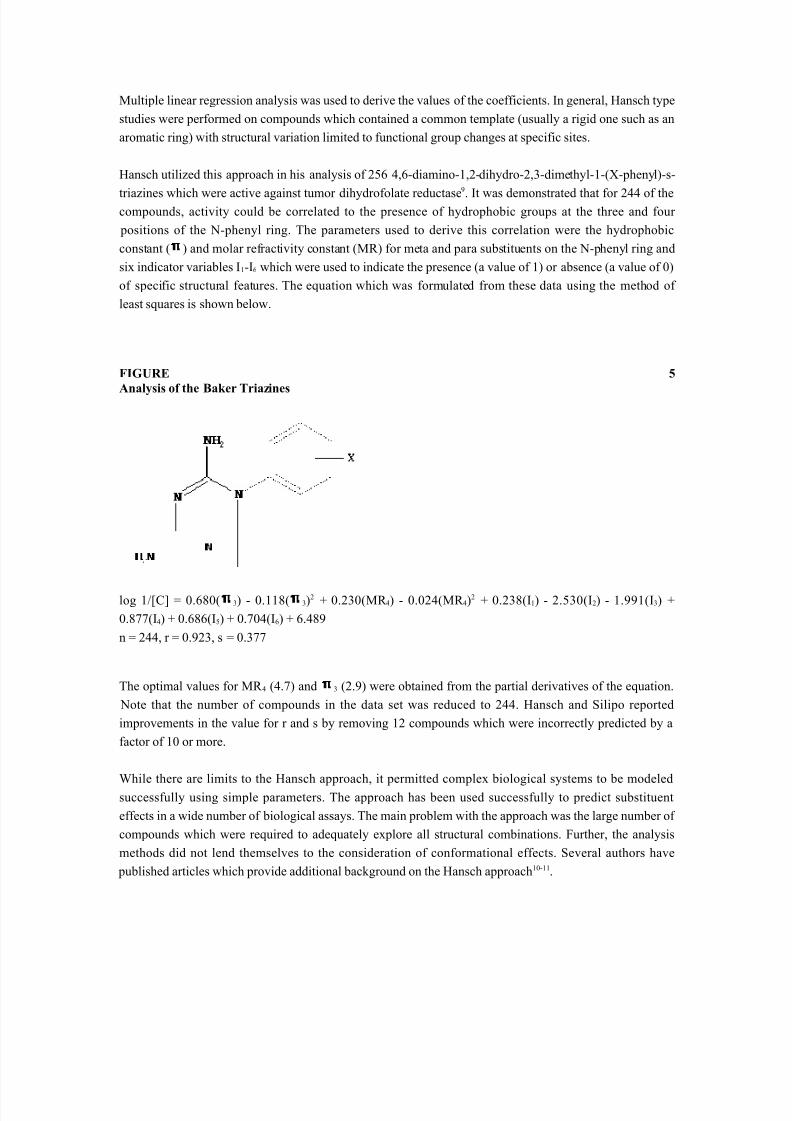
positions of the N-phenyl ring. The parameters used to derive this correlation were the hydrophobicconstant ( ) and molar refractivity constant (MR) for meta and para substituents on the N-phenyl ring andsix indicator variables I 1-I6 which were used to indicate the presence (a value of 1) or absence (a value of 0)of specific structural features. The equation which was formulated from these data using the method of least squares is shown below.
FIGURE 5
Analysis of the Baker Triazines
log 1/[C] = 0.680( 3) - 0.118( 3)2 + 0.230(MR 4) - 0.024(MR 4)2 + 0.238(I 1) - 2.530(I 2) - 1.991(I 3) +0.877(I 4) + 0.686(I 5) + 0.704(I 6) + 6.489n = 244, r = 0.923, s = 0.377
The optimal values for MR 4 (4.7) and 3 (2.9) were obtained from the partial derivatives of the equation. Note that the number of compounds in the data set was reduced to 244. Hansch and Silipo reportedimprovements in the value for r and s by removing 12 compounds which were incorrectly predicted by afactor of 10 or more.
While there are limits to the Hansch approach, it permitted complex biological systems to be modeledsuccessfully using simple parameters. The approach has been used successfully to predict substituenteffects in a wide number of biological assays. The main problem with the approach was the large number of compounds which were required to adequately explore all structural combinations. Further, the analysismethods did not lend themselves to the consideration of conformational effects. Several authors have
published articles which provide additional background on the Hansch approach 10-11 .
8/14/2019 Introduction to QSAR Methodology
http://slidepdf.com/reader/full/introduction-to-qsar-methodology 17/28
Alternative approaches to compound design have been suggested which avoid the combinatorial problemfound in Hansch type analyses. Free and Wilson used a series of substituent constants which related
biological activity to the presence of a specific functional group at a specific location on the parentmolecule 12. The relationship between biological activity and the presence or absence of a substituent wasthen expressed by the following equation:
Activity = A + i jG ijX ij
where A was defined as the average biological activity for the series, G ij the contribution to activity of afunctional group i in the jth position and X ij the presence (1.0) or absence (0.0) of the functional group i inthe jth position.
The procedure used the equation above to build a matrix for the series and represented this matrix as aseries of equations. Substituent constants then were derived for every functional group at every position.Statistical tests were used to test the importance of the constants. If the models were shown to be valid, themodel was used to predict activity values for compounds which had not been prepared. In general, while alarge number of compounds are required to explore the effects of multiple substitution patterns, the Free-Wilson approach substantially reduces the number of analogs required. However, the method demands thatthe effects of substituents are additive.
In 1972, John Topliss published a paper which detailed methodology to automate the Hansch approach 2.The method assumed that the lead compound of interest contained at least one phenyl ring which couldserve as the template for functional group modifications. The first modification to the template was
preparation of the para-chloro derivative to examine lipophilicity. Additional substitution patterns were thenmade sequentially in an attempt to explore and optimize the relationship between activity and thehydrophobic and electronic character of the molecule. While the Topliss approach is easy to follow, it has
several drawbacks. The primary problems are that the procedure is not applicable to all types of studies andthat there is a high degree of risk associated with its use (it essentially ignores the possibility of interactions
between substituents as it changes one substituent at a time).
The use of classical QSAR was expanded during the 1960's as a means of correlating observed activity tochemical properties. However, there are many areas where these techniques could not be used or wherethey failed to provide useful correlations. These included situations in which activity was found to bedetermined by 3-dimensional geometry, where poor training sets of compounds were used or the set of compounds were too small or insufficiently diverse and cases where biological activity could not be wellquantified. Many of these problems were addressed by extensions to the Hansch method and thedevelopment of alternative approaches to QSAR.
There are cases where biological activity values cannot be determined accurately for a variety of reasons,e.g. lack of sensitivity of a particular test system. Alternative statistical techniques can be used in thesecases; the problem is simplified to a classification scheme in which compounds are labeled as active,
partially active, inactive, etc. The resulting data set is then searched for patterns which predict thesecategories. The methods which have been used for this type of analysis include SIMCA (Soft, Independent
8/14/2019 Introduction to QSAR Methodology
http://slidepdf.com/reader/full/introduction-to-qsar-methodology 18/28
Modeling of Class Analogy) 13, ADAPT (Automated Data Analysis by Pattern recognition Techniques) 14,CASE (Computer Automated Structure Evaluation) 15 and CSA (Cluster Significance Analysis) 16.
Pattern recognition methods 17 attempt to define the set of parameter values which will result in clusteringcompounds of similar activity into regions of n-dimensional space. The methods used to accomplish this
goal can be parametric or nonparametric. Parametric methods search the n-dimensional space for clusters of compounds based on their calculated properties. These methods do not use derived values (e.g., meanvectors and covariance matrices), but instead use the original data to find clustering definitions and applyiterative procedures to find the linear set of parameters which best define the classification scheme.Where the methods described above develop discriminant functions, SIMCA methods use PrincipalComponent Analysis (PCA) to describe the data set. The objective of PCA is to create a reduced number variables which describe biological activity or chemical properties into a relatively few independent ones.This is accomplished through an analysis of the correlation matrix of biological or chemical properties.
Principle component analysis can be used to create derived variables for each class (e.g., active andinactive) separately by decomposing the correlation matrix; this method is useful to point out redundancies
or interrelationships among the variables. PCA seeks to find simplified relationships in data bytransforming the original parameters into a new set of uncorrelated variables which are termed principalcomponents. The symmetric correlation matrix is decomposed by an eigenvalue decomposition. The largesteigenvalue and its eigenvector are used to form a linear combination of the original variables withmaximum variance. Successively smaller eigenvalues and vectors produce linear combinations of theoriginal variables with diminishing variance. Successive eigenvectors are independent of one another. Thesimplification is derived by disregarding eigenvectors associated with small eigenvalues. In summary, the
procedure finds the set of orthogonal axes for the data which decompose variance in the data.
Another approach to examining the effects of chemical structure on activity was developed by the Jurs'group. Rather than rely on multivariant statistics to highlight these relationships, Jurs used the combinationof cluster analysis and pattern recognition techniques as a tool to develop these correlations. The ADAPT
program generated a data set of molecular descriptors (topological, geometrical and physicochemical)derived from three dimensional model building, projected these data points onto an n-dimensional surfaceand analyzed them using pattern recognition methods. The goal of this analysis was to discriminate
between active and inactive compounds in a series.
Jurs has reported several applications of the methodology contained in ADAPT. In one study of chemicalcarcinogens 18, a linear discriminant function was derived from a set of 28 calculated structure featuresincluding fragment descriptors, substructure descriptors, environment descriptors, molecular connectivitydescriptors and geometric descriptors. Two hundred and nine compounds from twelve structural classes
(130 carcinogens, 79 noncarcinogens) were selected for this study. The program was used to identify atraining set of 192 compounds which was used to find the best set of descriptors and analyze the entire dataset. A predictive success of 90% for carcinogenic compounds and 78% for noncarcinogenic compoundswas obtained in randomized testing.
The CASE program extended the techniques in ADAPT by using topological methods to definesubstructural fragments which were essential for activity. CASE was able to differentiate between
positional isomers. Both CASE and ADAPT are limited to analyzing structurally similar data sets.
8/14/2019 Introduction to QSAR Methodology
http://slidepdf.com/reader/full/introduction-to-qsar-methodology 19/28
The analysis methods described to this point have not explicitly incorporated the contribution of threedimensional shape in the analysis of the activity of a molecule. While the use of chemical graph indexes 18,intermolecular binding distances 19, molecular surface areas 20 and electrostatic potentials 21 contain someinformation about the 3-D shape of molecules, the Hopfinger 22 and Marshall 23 groups were the first to
exhaustively analyze these effects.
In 1979, Marshall extended the 2-D approach to QSAR by explicitly considering the conformationalflexibility of a series as reflected by their 3-D shape 23. The first step of the Active Analog Approach was toexhaustively search the conformations of a compound which was highly active in a particular biologicalassay. The result of the search was a map of interatomic distances which was used to filter theconformational searches of subsequent molecules in the series. The implicit assumption of the method wasthat all compounds which display similar activity profiles were able to adopt similar conformations. Oncethe "active conformation" was determined, molecular volumes for each molecule were calculated andsuperimposed. Regression analysis of the volumes was used to establish a relationship to biologicalactivity. Marshall and co-workers commercialized the Active Analog Approach and a suite of other drug
design techniques in the SYBYL molecular modeling program.
Hopfinger and co-workers also used 3-D shape in QSAR. In molecular shape analysis 24 of the Baker Triazines, the common space shared by all molecules of a series and the differences in their potentialenergy fields were computed. When these calculations were combined with a set of rules for overlappingthe series, comparative indicies of the shape of different molecules were obtained. Inclusion of these shapedescriptors in standard Hansch analysis schemes lead to improved descriptions relating computed
parameters to biological activity such that no compounds in the original data set had to be eliminated fromthe calculations. The techniques developed by Hopfinger and co-workers were made available in theCAMSEQ, CAMSEQ-II, CHEMLAB and CAMSEQ-M computer programs.
In 1988, Richard Cramer proposed that biological activity could be analyzed by relating the shape-dependent steric and electrostatic fields for molecules to their biological activity 25. Additionally, rather thanlimiting the analysis to fitting data to a regression line, CoMFA (Comparative Molecular Field Analysis)utilized new methods of data analysis, PLS (Partial Least Squares) and cross-validation, to develop modelsfor activity predictions.
The approach used in the CoMFA procedure requires that the scientist define alignment rules for the serieswhich overlap the putative pharmacophore for each molecule; the active conformation and alignment rulemust be specified. Once aligned, each molecule is fixed into a three-dimensional grid by the program andthe electrostatic and steric components of the molecular mechanics force field, arising from interaction with
a probe atom (e.g., an SP 3 C atom), are calculated at intersecting lattice points within the 3-D grid. Theequations which result from this exercise have the form
Act 1 = Const 1 + a 1(steric xyz) + b 1(steric xyz) + ... + a' 1(estatic xyz) + b' 1(estatic xyz) + ...Act 2 = Const 2 + a 2(steric xyz) + b 2(steric xyz) + ... + a' 2(estatic xyz) + b' 2(estatic xyz) + ...Act n = Const n + a n(steric xyz) + b n(steric xyz) + ... + a' n(estatic xyz) + b' n(estatic xyz) + ...
8/14/2019 Introduction to QSAR Methodology
http://slidepdf.com/reader/full/introduction-to-qsar-methodology 20/28
Traditional regression methods require that the number of parameters must be considerably smaller than thenumber of compounds in the data set (or the number of degrees of freedom in the data). The data tableswhich result from CoMFA analysis have far more parameters than compounds. PLS, which removes thislimitation, is used to derive the coefficients for all of the steric and electrostatic terms. PLS essentiallyrelies upon the fact that the correlations among near parts of a molecule are similar so that the real
dimensionality is smaller that the number of grid points. Since these coefficients are position dependant,substituent patterns for the series are elucidated which define regions of steric bulk and electrostatic chargeassociated with increased or decreased activity. The size of the model (the number of components 27 neededfor the best model) and the validity of the model as a predictive tool are assessed using cross-validation.As opposed to traditional regression methods, cross-validation evaluates the validity of a model by howwell it predicts data rather than how well it fits data. The analysis uses a "leave-one-out" scheme; a modelis built with N-1 compounds and the N th compound is predicted. Each compound is left out of the modelderivation and predicted in turn. An indication of the performance of the model is obtained from the cross-validated (or predictive) r 2 which is defined asr 2 (cross-validated) = (SD - Press)/SD
SD is the Sum-of-Squares deviation for each activity from the mean. Press (or Predictive Sum of Squares)is the sum of the squared differences between the actual and that predicted when the compound is omittedfrom the fitting process.
As we have discussed, values for conventional r 2 range from 0 to 1. Values for the cross-validated r 2 arereported by the method to range from -1 to 1. Negative values indicate that biological activity values areestimated by the mean of the activity values better than they are by the model (i.e, the predictions derivedfrom the model are worse than no model). Once a model is developed which has the highest cross-validatedr 2, this model is used to derive the conventional QSAR equation and conventional r 2 and s values. Theresults of the final model are then visualized as contour maps of the coefficients.
The first CoMFA study reported analyzed the binding affinities of 21 steroid structures to humancorticosteroid-binding globulins and testosterone-binding globulins. This class of compounds is rigid andwas selected to eliminate conformationally dependant effects from the study. The models for each steroidwere built from coordinates from the Cambridge Crystallographic Database which were minimized usingthe Tripos force field. Side chain positioning was accomplished using systematic conformational searching.The Field Fit algorithm was used to align each structure within the fixed lattice (the 3-D grid used tocalculate the CoMFA field effects). The fit of the regression line for the predicted versus actual bindingvalues for the corticosteroids showed a cross-validated r 2 of 0.65 (conventional r 2 = 0.897, s = 0.397). For the testosterone-binding steroids, the cross-validated r 2 was 0.555 (conventional r 2 = 0.873, s = 0.453).
As noted, CoMFA starts with defined pharmacophore and overlap rules and derives a 3-D model which can be used to predict activity for new chemical entities. The Apex and Catalyst ( Accelrys , Formerly Molecular Simulations Incorporated) programs are used to identify pharmacophores from databases of chemicalstructures and biological activity. These models are then used to predict activities for novel compounds.Apex-3D is an automated pharmacophore identification system which can identify possible
pharmacophores from a set of biologically active molecules using statistical techniques and 3-D patternmatching algorithms. The program classifies molecular structures using three methods: the agreementinductive method identifies common structural patterns in compounds having similar activity; the
8/14/2019 Introduction to QSAR Methodology
http://slidepdf.com/reader/full/introduction-to-qsar-methodology 21/28
difference inductive method identifies structural patterns which differentiate active and inactive compoundsand the concomitant variations inductive method highlights variations in structural features that explainchanges in biological activity for sets of compounds.
The methods defined above follow logic similar to that used by a practicing medicinal chemist: What
pharmacophoric patterns are present in the active molecule which are not present in the inactive ones?Pharmacophores are defined by different chemical centers (atom centered functional groups) and thedistances between these centers. These descriptor centers can include such things as aromatic ring centers,electron donor ability, hydrogen bonding sites, lipophilic regions, and partial atomic charge. Theinformation for each molecule is stored in a knowledge base in the form of rules which can be used to
predict the activity of novel structures.
Apex-3D contains an expert system which automatically selects the best conformation and alignment for structures based on identified pharmacophores. When quantitative biological data is available, a 3D-QSAR model can be developed for any of the possible identified pharmacophores. Depending on the type of
biological activity available, it is possible to identify pharmacophores for different binding orientations,
receptor subtypes, or agonist versus antagonist activity.
To use this approach, the scientist is required to assign the training set of compounds to one or moreactivity classes Specific descriptor centers also can be defined if desired. The automated pharmacophoreidentification portion of the program then builds the knowledge base using the following steps:
identify all possible binding interaction centers for each compound in the data set;
generate topological (2D) or topographical (3D) distance matrices based on the set of descriptors;
identify possible pharmacophores from all pairs of molecules using clique selection algorithms;
classify these pharmacophores based upon their occurance in compounds in each activity class
using Bayesian statistics and their nonchance occurance;
set thresholds for probability and reliability statistics associated with a pharmacophore so that all
training set molecules are properly classified by the pharmacophore rules;
align compounds containing high probability pharmacophores on the pharmacophore.
Once the knowledge base has been constructed, the scientist can use it to predict biological activity for compounds not included in the training set.The pharmacophores defined above can be used to build 3D QSAR models by correlating indexescalculated for biophore sites, secondary sites or whole molecule properties. 3-D QSAR models in Apex aregenerated and screened using a modified scheme of multiple linear regression analysis with variableselection. Special randomization checks are made to estimate the chance of fortuitous correlation. The stepsinvolved are:
8/14/2019 Introduction to QSAR Methodology
http://slidepdf.com/reader/full/introduction-to-qsar-methodology 22/28
Interactively select the pharmacophore(s) to use in the analysis;
Interactively choose parameters to include in the pool of possible parameters to be selected by the
program and
Calculate the best 3D QSAR models for each pharmacophore using stepwise multiple regression
and analysis of statistics to assess the validity and predictive power of the model.
At this point the knowledge base with 3D QSAR models can be used to calculate activities of novelcompounds. Given a set of conformations for a novel structure, an activity range will be calculated basedon each conformation which contains one of the pharmacophores and fits the 3D QSAR model.
Few applications of Apex have appeared to date in the literature. One example applied to nonpeptideAngiotensin II antagonists will be discussed for its heuristic value. Several structurally diverse compoundsin this activity class have been reported in the literature 31-44 . Pharmacophore models have been postulated
with some disagreement about whether all of the highly active molecules are binding at the same site 30.Automated pharmacophore identification can be used to analyze these compounds and to assess the
probability that they could be acting at the same site. A set of 55 compounds with specific binding activity(IC 50) values ranging over 6 orders of magnitude was used. Multiple conformations were included using 3Dstructures whose geometries were optimized by AMPAC. Four activity classes were defined; the mostactive class (< 100 nM) included 27 compounds. Apex-3D was able to generate rules which properlyclassified all compounds in the most active class without false negatives or positives. The fact that several
biophores were required is consistent with the exsistence of multiple binding sites.
Quantitative 3D QSAR models also were developed for some of these pharmacophores. One model whichcontained 48 compounds had the following statistical parameters: predicted R 2 = 0.83, predicted RMSE =0.86. Predicted activities for compounds excluded from the training set were within statistical boundaries.Like Apex, Catalyst generates structure-activity hypotheses from a set of molecules of various activities.Once molecular connectivity and activity values are specified for all molecules, Catalyst derives ahypotheses which consist of a set of generalized chemical functions (regions of hydrophobic surface,hydrogen bond vectors, charge centers, or other user-defined features) at specified relative positions. Up toten hypotheses are produced and ranked by estimated statistical significance. The hypotheses can beexamined graphically, fit to new molecules, or fed directly to flexible 3D database search.
In the first step of the process, a set of representative conformers is found that covers the low-energyconformational space of each molecule. Representative structures are chosen to maximize the sampling of
conformational space. The second step locates a list of candidate hypotheses that are common among activeand rare among inactive compounds (the presence of all identified features is not required for inclusion inthe active class since it is unlikely that all active members of a training set possess all the important bindingfeatures). The cost of a hypothesis is defined as the number of bits needed to describe the hypothesis aswell as the errors in activities as estimated by the hypothesis. The theory of minimum complexityestimation indicates that a predictive hypothesis will minimize this cost. Minimization is carried out over the space of hypotheses covered by the candidates identified above. Statistical significance of the results
8/14/2019 Introduction to QSAR Methodology
http://slidepdf.com/reader/full/introduction-to-qsar-methodology 23/28
(low probability of having found a chance correlation) on a variety of medicinal training sets is verified bya non-parametric randomization test.
The Genetic Function Approximation (GFA) algorithm is a novel technique for constructing QSAR models 45. It was specifically developed for use with data sets containing many more variables than samples,
or data sets which contain nonlinear relationships between the variables and the activity.
GFA begins with a population of randomly-constructed QSAR models; these models are rated using anerror measure which estimates each model's relative predictiveness. The population is evolved byrepeatedly selecting two better-rated models to serve as parents, then creating a new child model by usingterms from each of the parent models. The worst-rated model in the population is replaced by this newmodel. As evolution proceeds, the population becomes enriched with higher and higher quality models.
The different models are, in effect, multiple fits to the data. Scientists can then use their scientificknowledge and intuition to select among the final models. By studying the similarities and differencesamong the models, the scientist may be provoked to consider alternative mechanisms which explain the
data or may plan new experiments to decide between different possible models. Since the models usuallyuse only a subset of the total number of variables in the data set, GFA behaves as a member of the class of variable reduction algorithms and is most useful if the critical information in the data set is concentrated ina few variables.
Experimental results against published data sets demonstrate that GFA discovers models which arecomparable to, and in some cases superior to, models discovered using standard techniques such asstepwise regression, linear regression, or partial least-squares regression. As the number of computationaland instrumentational sources of experimental data increase, the ability of GFA to perform variablereduction, to discover nonlinear relationships, and to present the user with multiple models representingmultiple interpretations of the data set, may become increasingly useful in data analysis.
There are many additional properties beyond binding which contribute to the biological activity of amolecule including transportation, distribution, metabolism and elimination. Since the techniques describedabove address binding and typically do not account for any of these other processes, they often fail.However, one should note that their utility is one of efficiency and probability. They are generally moresuccessful and efficient than are the ad hoc/intuitive methods. Because no single method works for allcases, many groups are examining alternative approaches to developing SAR equations including electronic
based descriptors and topological indicies.
Peter Goodford has reported an energy based grid approach to compound design. The GRID program 46 is a
computational procedure for detecting energetically favorable binding sites on molecules of knownstructure. It has been used to study arrays of molecules in membranes and crystals or proteins. The energiesare calculated as the electrostatic, hydrogen-bond and Lennard-Jones interactions of a specific probe groupwith the target structure. GRID has also been used to distinguish between selective binding sites for different probes.
In general, topological approaches start with a very different graph theoretic representation of molecular structure in which atoms are represented by vertexes and bonds by edges. Numerical indexes for the
8/14/2019 Introduction to QSAR Methodology
http://slidepdf.com/reader/full/introduction-to-qsar-methodology 24/28
structure are then defined which abstract information including atom descriptors (atom types, atomicweight, atomic number, ratio of valance electrons to core electrons, etc.) and sub-group descriptors. In
addition, a series of indexes (the indexes) are developed which describe the molecule as a set of fragments of varying size and complexity. Regression analysis of equations which have chi indexes as
parameters has been used to correlate chemical structure to physicochemical behavior in applications suchas chromatographic retention times, molar refractivity, ionization potential and heats of atomization. Whilethe application of topological indicies has been widely reported in QSAR 47-49, the utility of these methodsgenerally has been limited to predicting structure-property relationships for polymers and hydrocarbons.
SUMMARY
Developing a quantitative structure activity relationship is difficult. Molecules are typically flexible and itis possible to compute many possibly useful properties that might relate to activity. Early in a research
program there are typically few compounds to model. Thus we have a few compounds in a very highdimensional descriptor space. Which are the important variables and how do we optimize them? It is clear that many training compounds need to span through the space and model fitting techniques need to addressnot only deriving a fit, but the predictive quality of the fit. While these methods have not discovered a newcompound, they have aided scientists in examining the volumes of data generated in a research program. Asthe methods evolve, they will find broader application in areas such as combinatorial chemistry.
REFERENCES
1. Christopher S.J. Walpole, Roger Wrigglerworth, Stuart Bevan, Elizabeth A. Campbell, Andy Dray,
Iain F. James, Kay J. Masdin, Martin N. Perkins and Janet Winter, J. Med. Chem. , 36 , 2381
(1993).
2. John G. Topliss, Utilization of Operational Schemes for Analog Synthesis in Drug Design, J. Med.
Chem. , 15 , 1006 (1972).
3. Yvonne C. Martin, A Practitioner's Perspective of the Role of Quantitative Structure Activity
Analysis in Medicinal Chemistry, J. Med. Chem. , 24 , 229 (1981).
4. John G. Topliss, Quantitative Structure-Activity Relationships of Drugs, Academic Press, New
York, (1983).
5. Franke, R., Theoretical Drug Design Methods, Elsevier, Amsterdam, (1984).
6. Seydel, J.K., QSAR and Strategies in the Design of Bioactive Compounds, VCH, Weinheim,
(1985).
8/14/2019 Introduction to QSAR Methodology
http://slidepdf.com/reader/full/introduction-to-qsar-methodology 25/28
7. Yvonne C. Martin, Accounts of Chem. Res. , 19 , 392 (1986).
8. Corwin Hansch, Accounts of Chem. Res. , 2, 232 (1969).
9. Corwin Hansch and Carlo Silipo, J. Amer. Chem. Soc. , 97 , 6849 (1975).
10. Robert F. Gould (ed.), Biological Correlations -- The Hansch Approach, Advances in Chemistry
Series, No. 114 , American Chemical Society, Washington, D.C., 1972.
11. Yvonne C. Martin, Quantitative Drug Design, Marcel Dekker, New York, (1978).
12. Spencer M. Free and James W. Wilson, A Mathematical Contribution to Structure-Activity
Studies, J. Med. Chem. , 7, 395 (1964).
13. Svante Wold, Pattern Recognition by Means of Disjoint Principal Components Models, Pattern
Recognition , 8, 127 (1976).
14. A.J. Stuper, W.E. Brugger and P.C. Jurs, Chemometrics: Theory and Application, B.R. Kowalski
(Ed.), American Chemical Society, Washington, D.C., 1977.
15. G. Klopman and M.I. Dimayuga, J. Comput.-Aided Mol. Design , 4, 117 (1990).
16. J. McFarland, J. Med. Chem. ,
17. Peter C. Jurs, Chemometrics and Multivariate Analysis in Analytical Chemistry, in Reviews in
Computational Chemistry, Volume 1, K.B. Lipkowitz and B.B. Boyd (Eds.), VCH Publishers, Inc.,
New York, 1990.
18. Peter C. Jurs, J. T. Chou and M. Yuan, J. Med. Chem. , 22 , 476 (1979).
19. Lemont B. Kier, Molecular Orbital Theory in Drug Research, Academic Press, New York, NY,
1971.
20. Gordon M. Crippen, J. Med. Chem. , 22 , 988 (1979).
21. M. Mabilia, R.A. Pearlstein and A.J. Hopfinger, Computer Graphics in Molecular Shape Analysis,
in Molecular Graphics and Drug Design, A.S.V. Burgen, G.C.K. Roberts and M.S. Tute (Eds.),
Elsevier Science Publishers, Amsterdam, 1986.
8/14/2019 Introduction to QSAR Methodology
http://slidepdf.com/reader/full/introduction-to-qsar-methodology 26/28
22. H. Weinstein, in Chemical Applications of Molecular Electrostatic Potentials, Peter Politzer and
Donald G. Truhlar (Eds.), Plenum Press, New York, NY, 1981.
23. R. Potenzone, E. Cavicchi, H.J.R. Weintraub and A.J. Hopfinger, Comput. Chem. , 1, 187 (1977).
24. G.R. Marshall, C.D. Barry, H.E. Bosshard, R.A.. Dammkoehler and D.A. Dunn, The
Conformational Parameter in Drug Design: The Active Analog Approach, in Computer Assisted
Drug Design, ACS Symposia, 112 , E.C. Olson and R.E. Christofferson (Eds.), American Chemical
Society, Washington D.C., 1979
25. Anton J. Hopfinger, J. Amer. Chem. Soc. , 102 , 7196 (1980).
26. Richard D. Cramer III, David E. Patterson and Jeffrey D. Bunce, J. Amer. Chem. Soc. , 110 , 5959
(1988).
27. Components are defined as the linear combination of all parameters (the independent data) which
are used to fit the shape of the parameters to the shape of the activity data (the dependent data).
28. V. E. Golender and A. B. Rozenblit, Logical Structural Approach to Computer Assisted Drug
Design, in Drug Design, Vol IX, Academic Press (1980).
29. V. E. Golender and A. B. Rozenblit, Logical and Combinatorial Algorithms for Drug Design,
Research Studies Press, UK (1983).
30. V. E. Golender and E. R. Vorpagel, Computer Assisted Pharmacophore Identification, in 3D
QSAR in Drug Design: Theory, Methods and Applications, ESCOM Science Publishers,
Netherlands (1993).
A. P. Thomas, C. P. Allott, et. al., "New Nonpeptide Angiotensin II Receptor Antagonists. 1.
Synthesis, Biological Properties, and Structure-Activity Relationships of 2-Alkyl
Benzimidazole Derivatives", J. Med. Chem. , 35 , 877-885 (1992).
31. R. H. Bradbury, C. P. Allott, et. al., "New Nonpeptide Angiotensin II Receptor Antagonists. 2.
Synthesis, Biological Properties, and Structure-Activity Relationships of 2-Alkyl-4-
(biphenylylmethoxy)quinoline Derivatives", J. Med. Chem. , 35 , 4027-4038 (1992).
32. R. H. Bradbury, C. P. Allott, et. al., "New Nonpeptide Angiotensin II Receptor Antagonists. 3.
Synthesis, Biological Properties, and Structure-Activity Relationships of 2-Alkyl-4-
(biphenylylmethoxy)pyridine Derivatives", J. Med. Chem. , 36 , 1245-1254 (1993).

8/14/2019 Introduction to QSAR Methodology
http://slidepdf.com/reader/full/introduction-to-qsar-methodology 27/28
33. P. R. Bovy, D. B. Reitz, et. al., "Nonpeptide Angiotensin II Antagonists: N-Phenyl-1H-pyrrole
Derivatives Are Angiotensin II Receptor Antagonists", J. Med. Chem. , 36 , 101-110 (1993).
34. N. B. Mantlo, P. K. Chakravarty, et. al., "Potent, Orally Active Imidazo[4,5-b] pyridine-Based
Angiotensin II Receptor Antagonists", J. Med. Chem. , 34 , 2919-2922 (1991).
35. W. T. Ashton, C. L. Cantone, et. al., "Nonpeptide Angiotensin II Antagonists Derived from 4H-
1,2,4-Triazoles and 3H-Imidazo[1,2-b][1,2,4]triazoles", J. Med. Chem. , 36 , 591-609 (1993).
36. K. S. Atwal, S. Z. Ahmed, et. al., "Dihydro pyrimidine Angiotensin II Receptor Antagonists", J.
Med. Chem. , 35 , 4751-4763 (1992).
37. J. V. Duncia, A. T. Chiu, et. al., "The Discovery of Potent Nonpeptide Angiotensin II Receptor
Antagonists: A New Class of Potent Antihypertensives", J. Med. Chem. , 33 , 1312-1329 (1990).
38. B. De, M. Winn, et. al., "Discovery of a Novel Class of Orally Active, Non-Peptide Angiotensin II
Antagonists", J. Med. Chem. , 35 , 3714-3717 (1992).
39. K. Kybo, Y. Kohara, et. al., "Nonpeptide Angiotensin II Receptor Antagonists. Synthesis and
Biological Activity of Potential Prodrugs of Benzimidazole-7-carboxylic Acids", J. Med. Chem. ,
36 , 2343-2349 (1993).
I. Sircar, J. C. Hodges, et. al., "Nonpeptide Angiotensin II Receptor Antagonists. 2. Design,
Synthesis, and Structure-Activity Relationships of 2-Alkyl-4-(1H-pyrrol-1-yl)-1H-imidazoleDerivatives: Profile of 2-Propyl-1-[[2'-(1H-tetrazol-5-yl)-[1,1'-biphenyl]-4-yl]-methyl]-4-[2-
(trifluoroacetyl)-1H-pyrrol-1-yl]-1H-imidazole-5-carboxylic Acid (CI-996)", J. Med. Chem. ,
36 , 2253-2265 (1993).
40. J. Weinstock, R. M. Keenan, et. al., "1-(Carboxybenzyl_imidazole-5-acrylic Acids: Potent and
Selective Angiotensin II Receptor Antagonists", J. Med. Chem. , 34 , 1514-1517 (1991).
41. R. M. Keenan, J. Weinstock, et. al., "Imidazole-5-acrylic Acids: Potent Nonpeptide Angiotensin II
Receptor Antagonists Designed Using a Novel Peptide Pharmacophore Model", J. Med. Chem. ,35 , 3858-3872 (1992).
42. R. M. Keenan, J. Weinstock, et. al., "Potent Nonpeptide Angiotensin II Receptor Antagonists. 2. 1-
(Carboxybenzyl)imidazole-5-acrylic Acids", J. Med. Chem. , 36 , 1880-1892 (1993).
8/14/2019 Introduction to QSAR Methodology
http://slidepdf.com/reader/full/introduction-to-qsar-methodology 28/28
43. D. Rogers and A. J. Hopfinger, "Applications of Genetic Function Approximation (GFA) to
Quantitative Structure-Activity Relationships (QSAR) and Quantitative Structure Property
Relationships (QSPR)", J. Chem. Inf. Comp. Sci. , 34 , 854-866 (1994).
44. Peter J. Goodford, J. Med. Chem. , 28 , 849 (1985).
45. A.T. Balaban, Applications of Graph Theory in Chemistry, J. Chem. Inf. Comput. Sci. , 25 , 334
(1985).
46. Lowell H. Hall and Lemont B. Kier, The Molecular Connectivity Chi Indexes and Kappa Shape
Indexes in Structure-Property Modeling, in Reviews in Computational Chemistry, Volume 2, K.B.
Lipkowitz and D.B. Boyd (Eds.), VCH Publishers, Inc., New York, 1991.
47. I.B. Bersuker and A.S. Dimoglo, The Electron-Topological Approach to the QSAR Problem, in
Reviews in Computational Chemistry, Volume 2, K.B. Lipkowitz and D.B. Boyd (Eds.), VCH
Publishers, Inc., New York, 1991.