Introduction to QGIS for Archaeological Landscape Analysis
15
Using QGIS for Archaeological Landscape Analysis Table of Contents Lab 1 (c.1.5hrs).....................................................................................................................................2 Background Information – Setting Up Your Project............................................................................ 3 Task 1 – Opening raster files in QGIS and editing their properties..................................................... 5 Task 2 – An Introduction to Georeferencing (and helping the British Museum)................................. 8 Task 3 – Opening a vector file in QGIS............................................................................................... 9 Task 4 – Creating a vector file in QGIS............................................................................................. 10 Task 5 – Add a Web-based Mapping Layer........................................................................................ 14 Homework (In preparation for the DBA Assignment)....................................................................... 15 Course Materials designed by Rebecca Bennett, Jan 2013 Please use freely for your own information and the instruction of others but recognise the rights of the author to be acknowledged if the material contained is disseminated. AAB Lab 1 – Intro to QGIS 1
Transcript of Introduction to QGIS for Archaeological Landscape Analysis

Using QGIS for Archaeological Landscape Analysis
Table of ContentsLab 1 (c.1.5hrs).....................................................................................................................................2Background Information – Setting Up Your Project............................................................................3Task 1 – Opening raster files in QGIS and editing their properties.....................................................5Task 2 – An Introduction to Georeferencing (and helping the British Museum).................................8Task 3 – Opening a vector file in QGIS...............................................................................................9Task 4 – Creating a vector file in QGIS.............................................................................................10Task 5 – Add a Web-based Mapping Layer........................................................................................14Homework (In preparation for the DBA Assignment).......................................................................15
Course Materials designed by Rebecca Bennett, Jan 2013Please use freely for your own information and the instruction of others but
recognise the rights of the author to be acknowledged if the material contained is disseminated.
AAB Lab 1 – Intro to QGIS 1

Using QGIS for Visualising Spatial Data
Pre-requisites
To follow this workshop you will need QGIS 1.8. Detailed instructions on how to do this can be found in the pre-course information and are not repeated here.
Lab 1 (c.1.5hrs)
The aim of this lab is familiarise yourself with QGIS. In this session you will undertake the following tasks:
• Set up a GIS project• import and view aerial photographs• add a digital terrain model• add an historic map layer• edit the properties of a raster• import a vector file• create a vector file• edit a vector file• add a openstreetmap layer
Each of these tasks stand alone as useful GIS tools but together they provide a workflow for visualising raster data and recording the features from it. Illustrations in this booklet show the icons on screen for each task. The full menu options are notated as follows: File > Open.
AAB Lab 1 – Intro to QGIS 2

Background Information – Setting Up Your Project1. Start QGIS. Familiarise yourself with the layout of the screen. Some of the toolbars
at the top of the screen may be compressed. To expand them use the double arrow
To move the toolbars so that all the icons are visible use the vertical dotted line to the left of each toolbar. Hover your mouse over this line to get cross-hairs then click and drag to move the menu to another part of the screen. To find out the purpose of any icon hover your mouse over it.Below are the key toolbars for this session – you should check that all these are visible.
Navigation toolbar (pan, zoom)
Add data toolbar
Edit shapefile toolbar
2. When you are happy that you can see all the icons in the toolbars your first task will be to set the project properties and save the project. From the file menu select Project Properties or click on the globe in the bottom right of the screen
AAB Lab 1 – Intro to QGIS 3

3. We'll be working with data from the UK so set the units in the General tab of the Project Properties box select metres and click apply
4. To set the coordinate reference system (CRS) click on the CRS tab. The data for this tutorial is from the UK so we will search through the list for OSGB 1936. A quick way to do this is to type in the EPSG ID code 27700 and click find. Click apply to set the CRS.
5. Click OK to close Project Properties and return to the main screen.6. Use File>save to save the project to ClassCommons
AAB Lab 1 – Intro to QGIS 4

Task 1 – Opening raster files in QGIS and editing their properties
1. First we will open an aerial photograph (AP) of the study area using the tool bar icon (layer > add raster layer). Repeat this step to add all of the AP images for your study site.
2. We can open historic mapping supplied by the Ordnance Survey in the same way. Experiment with opening the historic mapping.
AAB Lab 1 – Intro to QGIS 5

3. Next we will open a digital terrain model also using the addraster menu. Pick the Digital Surface Model and Digital Terrain Model for your study area.
4. To improve the raster display we will now edit the raster properties. In the menu bar, right click on the raster's name and select properties.
5. Edit the symbology so that the image is stretched to min and max values. This preference can be saved as the default for the file.
AAB Lab 1 – Intro to QGIS 6

6. The raster display should now resemble the image below.
7. Return to the properties menu. In this menu can be found a variety of options for colouring the map, editing transparency and viewing metadata. Take some time to familiarise yourself with these options.
8. The DSM contains 3D height data but the GIS interface is of course only 2D. To better visualise the height data we can undertake processing of the DSM to create a number of different models (we'll look at these in the next lab). But the simplest way to view the height data is to draw a profile across the raster image.
9. Go to Go to Plugins> Fetch Python Plugins. In the search box type “profile”. Click install and then close the dialogue. A new Icon will now be available on your tool bar.
10. To use the tool select a layer in the navigation menu on the left and then click on this tool click once to begin a line and twice to end it. The profile will be drawn in the lower portion of the screen. Notice that height values along the profile are recorded in a table and can be exported for further analysis
AAB Lab 1 – Intro to QGIS 7

Task 2 – An Introduction to Georeferencing (and helping the British Museum)
Sometimes scanned or historical maps are not georeferenced, i.e. tied to a modern co-ordinate reference system (CRS). To display them in their real locations you need to transform the map based on control points. The historic maps we are using for this project are already georeferenced, so we are going to practice this by helping the British Museum to georeference their map collection online.
1. Watch this tutorial form the British Museum http://www.bl.uk/maps/
2. click on the “fix location of a map” button to georeference a map
AAB Lab 1 – Intro to QGIS 8

Task 3 – Opening a vector file in QGIS
1. For this task we will open a vector file that indicates areas that are designated as Scheduled (Ancient) Monuments (SMs) by English Heritage. Go to Layer > Add Vector Layer
2. Use the Browse button to navigate to the dataset. In the next window select ESRI Shapefiles [OGR] from the file type drop down. Highlight the shapefile 20121221_ScheduledMonument.shp. Click Open and Open.
3. Each vector file has a table attached containing attribute data. You can use the Info button to view the data for any polygon. Select the Info tool and click on a polygon.
4. The entire table for the vector file can be accessed by right clicking the layer in the layer manager on the left of the screen. Take a minute to explore the data structure of the Scheduled Monuments data.
AAB Lab 1 – Intro to QGIS 9

Task 4 – Creating a vector file in QGIS
1. For this task you are going to create a simple shapefile in QGIS that provides a boundary for the area covered by the airborne data. From the toolbar select the create new vector layer icon to open the window below
2. Select the type of file you want to create (point / line / polygon). We want to define an area so a polygon will be most appropriate.
3. Specify the CRS of the shapefile (OSGB 36 as in Task 1). Notice that the CRS of the project is available for quick selection.
AAB Lab 1 – Intro to QGIS 10

4. Each shapefile has an attribute table where data about the features can be stored. Add the attribute fields you want in the New Attribute section. In this case we will make a text field called “Name”. Click add to attributes list to save the attribute field then click OK
5. Name the shapefile “Study Area” and save it to ClassCommons (you may wish to create a new folder to store shapefiles together). Click OK to create the shapefile. It will automatically be added to the navigation menu on the left of your screen.
AAB Lab 1 – Intro to QGIS 11

6. To edit the shapefile highlight its name in the menu and click on the Toggle Edit icon in the toolbar.
7. Select the draw polygon tool
8. Draw your study areas around the DSM, right click to finish the square.
AAB Lab 1 – Intro to QGIS 12

9. You will be given the option to record attribute data for “Name”. Enter the name of the study area.
10.Click on the Toggle Edit icon again to finish drawing and save your edits.
11.Make the vector file editable again and experiment with moving the area using the move feature icon and editing the nodes using the node tool
12.Save your edits, making sure that the area still represents the coverage of the lidar raster.
13.By right clicking on the name of the file in the navigation bar and selecting Properties you can edit the symbology. Experiment with different display options for your shapefile.
AAB Lab 1 – Intro to QGIS 13
Task 5 – Add a Web-based Mapping Layer
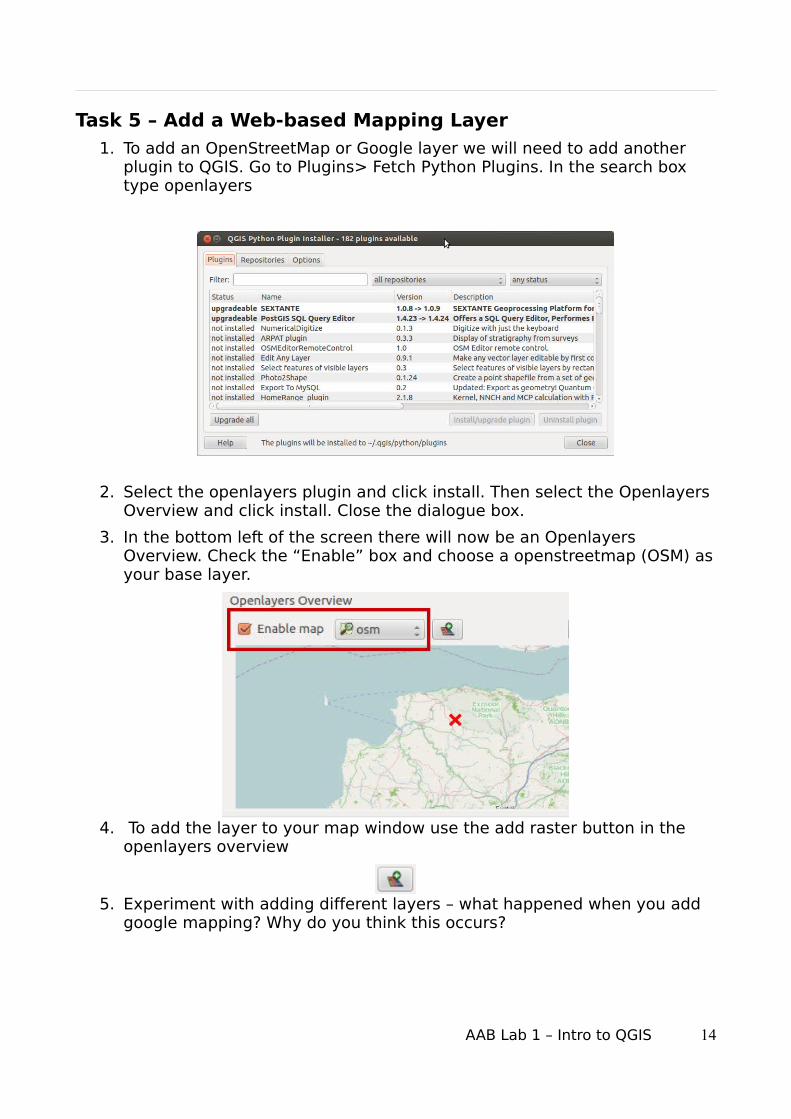
1. To add an OpenStreetMap or Google layer we will need to add another plugin to QGIS. Go to Plugins> Fetch Python Plugins. In the search box type openlayers
2. Select the openlayers plugin and click install. Then select the Openlayers Overview and click install. Close the dialogue box.
3. In the bottom left of the screen there will now be an Openlayers Overview. Check the “Enable” box and choose a openstreetmap (OSM) as your base layer.
4. To add the layer to your map window use the add raster button in the openlayers overview
5. Experiment with adding different layers – what happened when you add google mapping? Why do you think this occurs?
AAB Lab 1 – Intro to QGIS 14

Homework (In preparation for the DBA Assignment)
Your assignment from the lab will require you to digitise features from the raster data into a vector file.
Practise this by
a) tracing the outline of the Exmoor National Park Boundary from open map layers
b) examining the historic map data and tracing features of potential archaeological interest (roads, tracks, railways, mounds).
You should think carefully about the structure of the data you are recording – what will you need to know about these digitised features in order to understand them, identify them on the ground and produce a synthesised narrative of the landscape?
Here are some suggestions:
source (I.e. which data you used as a base to digitise)
form (circular, rectangular, profile)
date
type (tip – look at the English Heritage standards for recording monument type
http://thesaurus.english-heritage.org.uk/thesaurus.asp?thes_no=1)
description
AAB Lab 1 – Intro to QGIS 15