Introduction to Python Pandas for Data Analytics - … · Introduction to Python Pandas for Data...
115
Introduction to Python Pandas for Data Analytics Srijith Rajamohan Introduction to Python Python programming NumPy Matplotlib Introduction to Pandas Case study Conclusion Introduction to Python Pandas for Data Analytics Srijith Rajamohan Advanced Research Computing, Virginia Tech Tuesday 19 th July, 2016 1 / 115
-
Upload
phungxuyen -
Category
Documents
-
view
309 -
download
5
Transcript of Introduction to Python Pandas for Data Analytics - … · Introduction to Python Pandas for Data...
Introductionto PythonPandas for
DataAnalytics
SrijithRajamohan
Introductionto Python
Pythonprogramming
NumPy
Matplotlib
Introductionto Pandas
Case study
Conclusion
Introduction to Python Pandas for DataAnalytics
Srijith Rajamohan
Advanced Research Computing, Virginia Tech
Tuesday 19th July, 2016
1 / 115
Introductionto PythonPandas for
DataAnalytics
SrijithRajamohan
Introductionto Python
Pythonprogramming
NumPy
Matplotlib
Introductionto Pandas
Case study
Conclusion
Course Contents
This week:
• Introduction to Python
• Python Programming
• NumPy
• Plotting with Matplotlib
• Introduction to Python Pandas
• Case study
• Conclusion
2 / 115

Introductionto PythonPandas for
DataAnalytics
SrijithRajamohan
Introductionto Python
Pythonprogramming
NumPy
Matplotlib
Introductionto Pandas
Case study
Conclusion
Section 1
1 Introduction to Python
2 Python programming
3 NumPy
4 Matplotlib
5 Introduction to Pandas
6 Case study
7 Conclusion
3 / 115

Introductionto PythonPandas for
DataAnalytics
SrijithRajamohan
Introductionto Python
Pythonprogramming
NumPy
Matplotlib
Introductionto Pandas
Case study
Conclusion
Python Features
Why Python ?
• Interpreted
• Intuitive and minimalistic code
• Expressive language
• Dynamically typed
• Automatic memory management
4 / 115
Introductionto PythonPandas for
DataAnalytics
SrijithRajamohan
Introductionto Python
Pythonprogramming
NumPy
Matplotlib
Introductionto Pandas
Case study
Conclusion
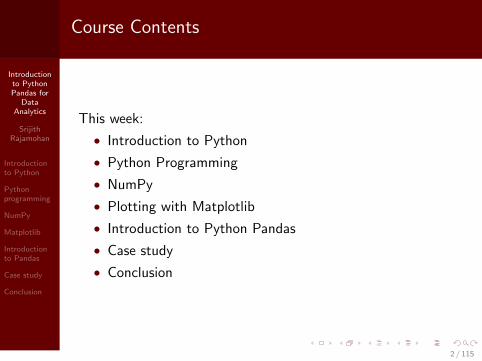
Python Features
Advantages
• Ease of programming
• Minimizes the time to develop and maintain code
• Modular and object-oriented
• Large community of users
• A large standard and user-contributed library
Disadvantages
• Interpreted and therefore slower than compiled languages
• Decentralized with packages
5 / 115
Introductionto PythonPandas for
DataAnalytics
SrijithRajamohan
Introductionto Python
Pythonprogramming
NumPy
Matplotlib
Introductionto Pandas
Case study
Conclusion
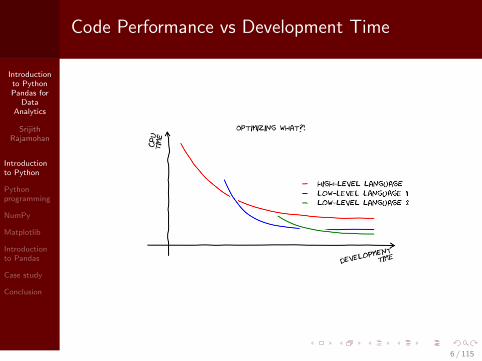
Code Performance vs Development Time
6 / 115
Introductionto PythonPandas for
DataAnalytics
SrijithRajamohan
Introductionto Python
Pythonprogramming
NumPy
Matplotlib
Introductionto Pandas
Case study
Conclusion
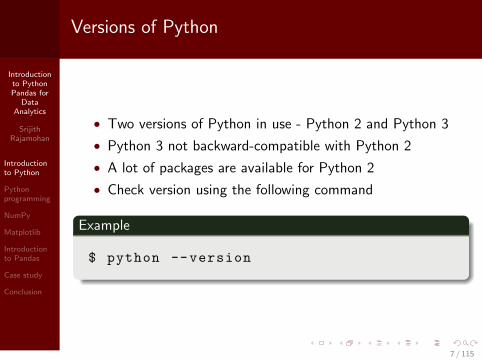
Versions of Python
• Two versions of Python in use - Python 2 and Python 3
• Python 3 not backward-compatible with Python 2
• A lot of packages are available for Python 2
• Check version using the following command
Example
$ python --version
7 / 115

Introductionto PythonPandas for
DataAnalytics
SrijithRajamohan
Introductionto Python
Pythonprogramming
NumPy
Matplotlib
Introductionto Pandas
Case study
Conclusion
Section 2
1 Introduction to Python
2 Python programming
3 NumPy
4 Matplotlib
5 Introduction to Pandas
6 Case study
7 Conclusion
8 / 115
Introductionto PythonPandas for
DataAnalytics
SrijithRajamohan
Introductionto Python
Pythonprogramming
NumPy
Matplotlib
Introductionto Pandas
Case study
Conclusion
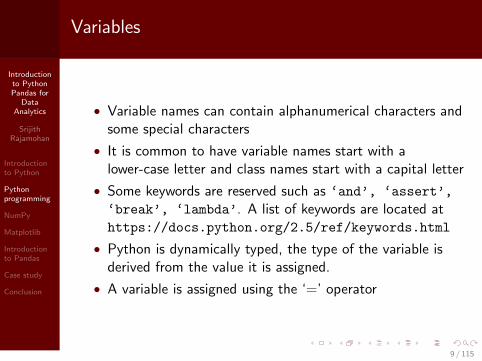
Variables
• Variable names can contain alphanumerical characters andsome special characters
• It is common to have variable names start with alower-case letter and class names start with a capital letter
• Some keywords are reserved such as ‘and’, ‘assert’,
‘break’, ‘lambda’. A list of keywords are located athttps://docs.python.org/2.5/ref/keywords.html
• Python is dynamically typed, the type of the variable isderived from the value it is assigned.
• A variable is assigned using the ‘=’ operator
9 / 115
Introductionto PythonPandas for
DataAnalytics
SrijithRajamohan
Introductionto Python
Pythonprogramming
NumPy
Matplotlib
Introductionto Pandas
Case study
Conclusion
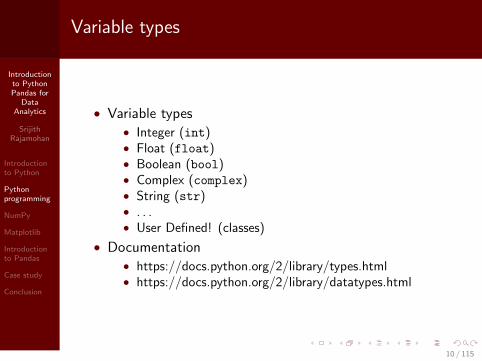
Variable types
• Variable types• Integer (int)• Float (float)• Boolean (bool)• Complex (complex)• String (str)• . . .• User Defined! (classes)
• Documentation• https://docs.python.org/2/library/types.html• https://docs.python.org/2/library/datatypes.html
10 / 115
Introductionto PythonPandas for
DataAnalytics
SrijithRajamohan
Introductionto Python
Pythonprogramming
NumPy
Matplotlib
Introductionto Pandas
Case study
Conclusion
Variable types
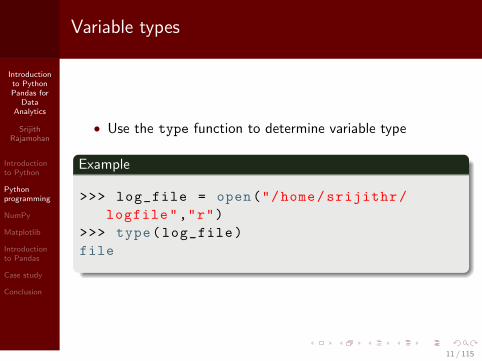
• Use the type function to determine variable type
Example
>>> log_file = open("/home/srijithr/
logfile","r")
>>> type(log_file)
file
11 / 115

Introductionto PythonPandas for
DataAnalytics
SrijithRajamohan
Introductionto Python
Pythonprogramming
NumPy
Matplotlib
Introductionto Pandas
Case study
Conclusion
Variable types
• Variables can be cast to a different type
Example
>>> share_of_rent = 295.50 / 2.0
>>> type(share_of_rent)
float
>>> rounded_share = int(share_of_rent)
>>> type(rounded_share)
int
12 / 115
Introductionto PythonPandas for
DataAnalytics
SrijithRajamohan
Introductionto Python
Pythonprogramming
NumPy
Matplotlib
Introductionto Pandas
Case study
Conclusion
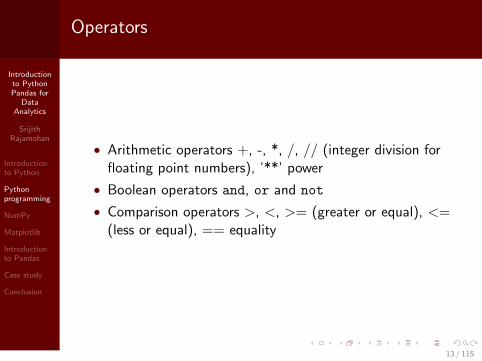
Operators
• Arithmetic operators +, -, *, /, // (integer division forfloating point numbers), ’**’ power
• Boolean operators and, or and not
• Comparison operators >, <, >= (greater or equal), <=(less or equal), == equality
13 / 115
Introductionto PythonPandas for
DataAnalytics
SrijithRajamohan
Introductionto Python
Pythonprogramming
NumPy
Matplotlib
Introductionto Pandas
Case study
Conclusion
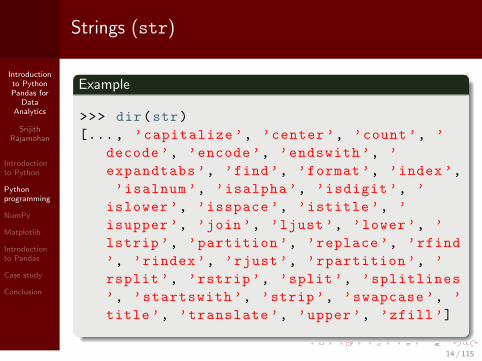
Strings (str)
Example
>>> dir(str)
[..., ’capitalize ’, ’center ’, ’count’, ’
decode ’, ’encode ’, ’endswith ’, ’
expandtabs ’, ’find’, ’format ’, ’index ’,
’isalnum ’, ’isalpha ’, ’isdigit ’, ’
islower ’, ’isspace ’, ’istitle ’, ’
isupper ’, ’join’, ’ljust’, ’lower’, ’
lstrip ’, ’partition ’, ’replace ’, ’rfind
’, ’rindex ’, ’rjust’, ’rpartition ’, ’
rsplit ’, ’rstrip ’, ’split’, ’splitlines
’, ’startswith ’, ’strip’, ’swapcase ’, ’
title ’, ’translate ’, ’upper ’, ’zfill ’]
14 / 115
Introductionto PythonPandas for
DataAnalytics
SrijithRajamohan
Introductionto Python
Pythonprogramming
NumPy
Matplotlib
Introductionto Pandas
Case study
Conclusion
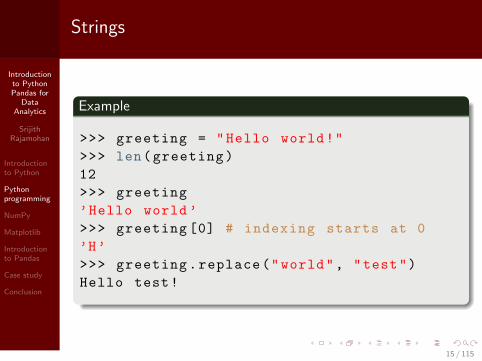
Strings
Example
>>> greeting = "Hello world!"
>>> len(greeting)
12
>>> greeting
’Hello world ’
>>> greeting [0] # indexing starts at 0
’H’
>>> greeting.replace("world", "test")
Hello test!
15 / 115
Introductionto PythonPandas for
DataAnalytics
SrijithRajamohan
Introductionto Python
Pythonprogramming
NumPy
Matplotlib
Introductionto Pandas
Case study
Conclusion
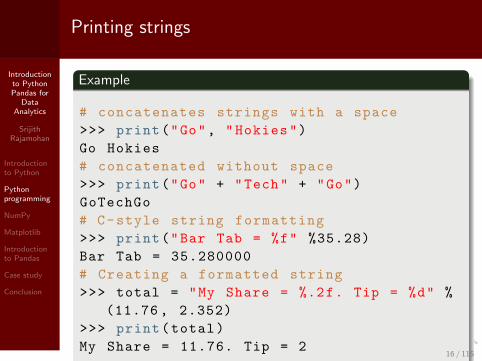
Printing strings
Example
# concatenates strings with a space
>>> print("Go", "Hokies")
Go Hokies
# concatenated without space
>>> print("Go" + "Tech" + "Go")
GoTechGo
# C-style string formatting
>>> print("Bar Tab = %f" %35.28)
Bar Tab = 35.280000
# Creating a formatted string
>>> total = "My Share = %.2f. Tip = %d" %
(11.76 , 2.352)
>>> print(total)
My Share = 11.76. Tip = 216 / 115
Introductionto PythonPandas for
DataAnalytics
SrijithRajamohan
Introductionto Python
Pythonprogramming
NumPy
Matplotlib
Introductionto Pandas
Case study
Conclusion
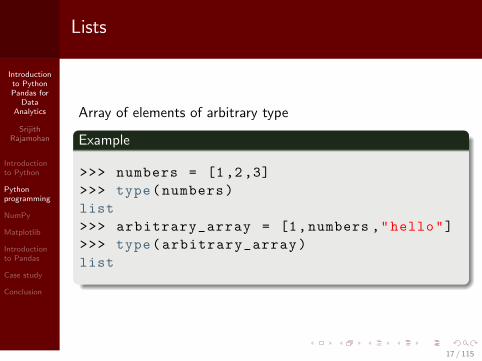
Lists
Array of elements of arbitrary type
Example
>>> numbers = [1,2,3]
>>> type(numbers)
list
>>> arbitrary_array = [1,numbers ,"hello"]
>>> type(arbitrary_array)
list
17 / 115
Introductionto PythonPandas for
DataAnalytics
SrijithRajamohan
Introductionto Python
Pythonprogramming
NumPy
Matplotlib
Introductionto Pandas
Case study
Conclusion
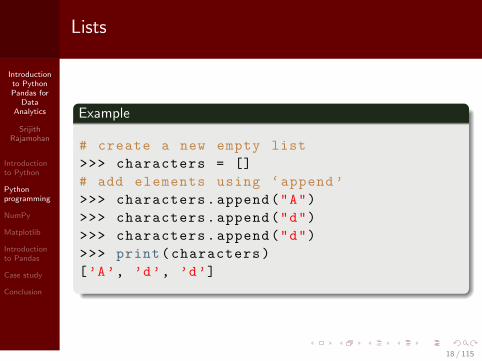
Lists
Example
# create a new empty list
>>> characters = []
# add elements using ‘append ’
>>> characters.append("A")
>>> characters.append("d")
>>> characters.append("d")
>>> print(characters)
[’A’, ’d’, ’d’]
18 / 115
Introductionto PythonPandas for
DataAnalytics
SrijithRajamohan
Introductionto Python
Pythonprogramming
NumPy
Matplotlib
Introductionto Pandas
Case study
Conclusion
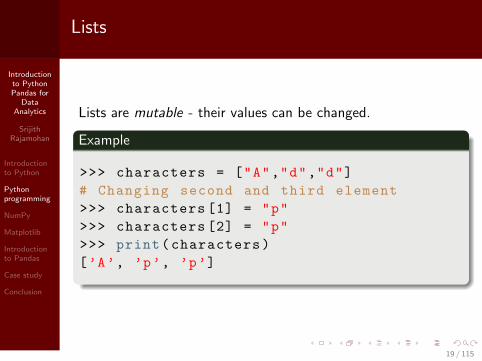
Lists
Lists are mutable - their values can be changed.
Example
>>> characters = ["A","d","d"]
# Changing second and third element
>>> characters [1] = "p"
>>> characters [2] = "p"
>>> print(characters)
[’A’, ’p’, ’p’]
19 / 115
Introductionto PythonPandas for
DataAnalytics
SrijithRajamohan
Introductionto Python
Pythonprogramming
NumPy
Matplotlib
Introductionto Pandas
Case study
Conclusion
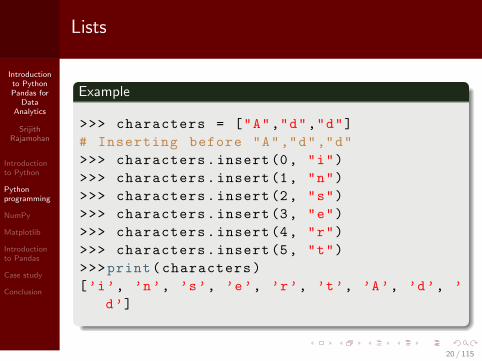
Lists
Example
>>> characters = ["A","d","d"]
# Inserting before "A","d","d"
>>> characters.insert(0, "i")
>>> characters.insert(1, "n")
>>> characters.insert(2, "s")
>>> characters.insert(3, "e")
>>> characters.insert(4, "r")
>>> characters.insert(5, "t")
>>>print(characters)
[’i’, ’n’, ’s’, ’e’, ’r’, ’t’, ’A’, ’d’, ’
d’]
20 / 115
Introductionto PythonPandas for
DataAnalytics
SrijithRajamohan
Introductionto Python
Pythonprogramming
NumPy
Matplotlib
Introductionto Pandas
Case study
Conclusion
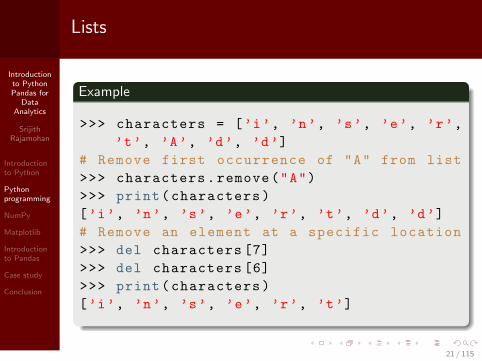
Lists
Example
>>> characters = [’i’, ’n’, ’s’, ’e’, ’r’,
’t’, ’A’, ’d’, ’d’]
# Remove first occurrence of "A" from list
>>> characters.remove("A")
>>> print(characters)
[’i’, ’n’, ’s’, ’e’, ’r’, ’t’, ’d’, ’d’]
# Remove an element at a specific location
>>> del characters [7]
>>> del characters [6]
>>> print(characters)
[’i’, ’n’, ’s’, ’e’, ’r’, ’t’]
21 / 115

Introductionto PythonPandas for
DataAnalytics
SrijithRajamohan
Introductionto Python
Pythonprogramming
NumPy
Matplotlib
Introductionto Pandas
Case study
Conclusion
Tuples
Tuples are like lists except they are immutable. Difference is inperformance
Example
>>> point = (10, 20) # Note () for tuples
instead of []
>>> type(point)
tuple
>>> point = 10,20
>>> type(point)
tuple
>>> point [2] = 40 # This will fail!
TypeError: ’tuple ’ object does not support
item assignment
22 / 115
Introductionto PythonPandas for
DataAnalytics
SrijithRajamohan
Introductionto Python
Pythonprogramming
NumPy
Matplotlib
Introductionto Pandas
Case study
Conclusion
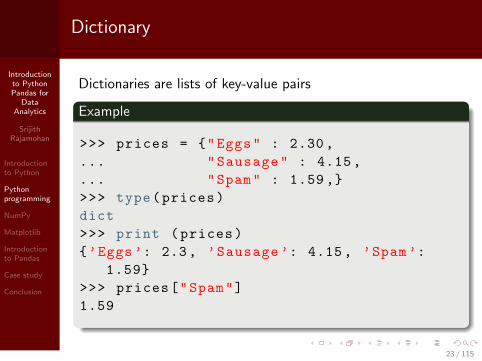
Dictionary
Dictionaries are lists of key-value pairs
Example
>>> prices = {"Eggs" : 2.30,
... "Sausage" : 4.15,
... "Spam" : 1.59 ,}
>>> type(prices)
dict
>>> print (prices)
{’Eggs’: 2.3, ’Sausage ’: 4.15, ’Spam’:
1.59}
>>> prices["Spam"]
1.59
23 / 115
Introductionto PythonPandas for
DataAnalytics
SrijithRajamohan
Introductionto Python
Pythonprogramming
NumPy
Matplotlib
Introductionto Pandas
Case study
Conclusion
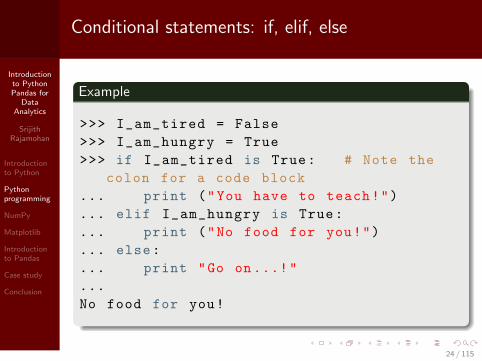
Conditional statements: if, elif, else
Example
>>> I_am_tired = False
>>> I_am_hungry = True
>>> if I_am_tired is True: # Note the
colon for a code block
... print ("You have to teach!")
... elif I_am_hungry is True:
... print ("No food for you!")
... else:
... print "Go on...!"
...
No food for you!
24 / 115
Introductionto PythonPandas for
DataAnalytics
SrijithRajamohan
Introductionto Python
Pythonprogramming
NumPy
Matplotlib
Introductionto Pandas
Case study
Conclusion
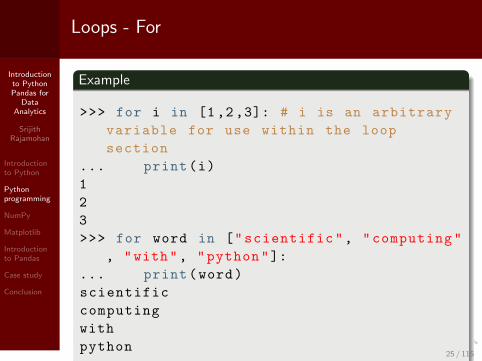
Loops - For
Example
>>> for i in [1,2,3]: # i is an arbitrary
variable for use within the loop
section
... print(i)
1
2
3
>>> for word in ["scientific", "computing"
, "with", "python"]:
... print(word)
scientific
computing
with
python25 / 115

Introductionto PythonPandas for
DataAnalytics
SrijithRajamohan
Introductionto Python
Pythonprogramming
NumPy
Matplotlib
Introductionto Pandas
Case study
Conclusion
Loops - While
Example
>>>i = 0
>>>while i < 5:
... print(i)
... i = i + 1
0
1
2
3
4
26 / 115
Introductionto PythonPandas for
DataAnalytics
SrijithRajamohan
Introductionto Python
Pythonprogramming
NumPy
Matplotlib
Introductionto Pandas
Case study
Conclusion
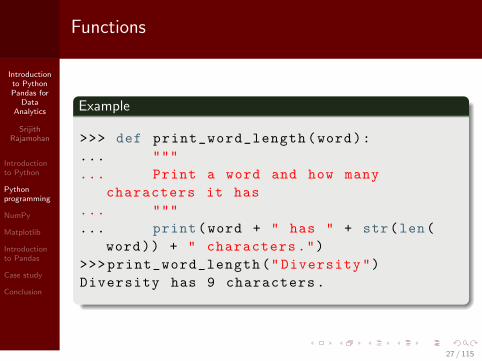
Functions
Example
>>> def print_word_length(word):
... """
... Print a word and how many
characters it has
... """
... print(word + " has " + str(len(
word)) + " characters.")
>>>print_word_length("Diversity")
Diversity has 9 characters.
27 / 115

Introductionto PythonPandas for
DataAnalytics
SrijithRajamohan
Introductionto Python
Pythonprogramming
NumPy
Matplotlib
Introductionto Pandas
Case study
Conclusion
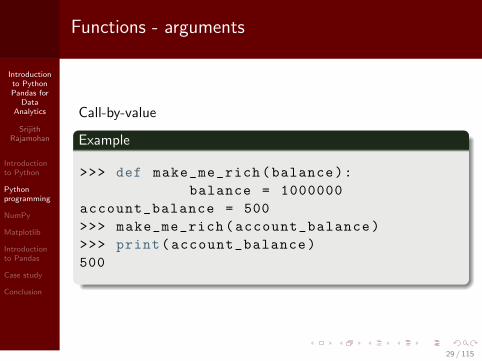
Functions - arguments
• Passing immutable arguments like integers, strings ortuples acts like call-by-value
• They cannot be modified!
• Passing mutable arguments like lists behaves likecall-by-reference
28 / 115
Introductionto PythonPandas for
DataAnalytics
SrijithRajamohan
Introductionto Python
Pythonprogramming
NumPy
Matplotlib
Introductionto Pandas
Case study
Conclusion
Functions - arguments
Call-by-value
Example
>>> def make_me_rich(balance):
balance = 1000000
account_balance = 500
>>> make_me_rich(account_balance)
>>> print(account_balance)
500
29 / 115

Introductionto PythonPandas for
DataAnalytics
SrijithRajamohan
Introductionto Python
Pythonprogramming
NumPy
Matplotlib
Introductionto Pandas
Case study
Conclusion
Functions - arguments
Call-by-reference
Example
>>> def talk_to_advisor(tasks):
tasks.insert(0, "Publish")
tasks.insert(1, "Publish")
tasks.insert(2, "Publish")
>>> todos = ["Graduate","Get a job","...",
"Profit!"]
>>> talk_to_advisor(todos)
>>> print(todos)
["Publish","Publish","Publish","Graduate"
,"Get a job","...","Profit!"]
30 / 115
Introductionto PythonPandas for
DataAnalytics
SrijithRajamohan
Introductionto Python
Pythonprogramming
NumPy
Matplotlib
Introductionto Pandas
Case study
Conclusion
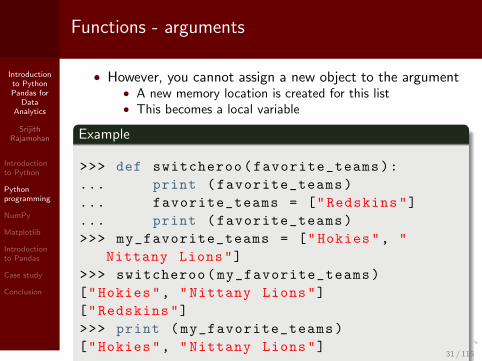
Functions - arguments
• However, you cannot assign a new object to the argument• A new memory location is created for this list• This becomes a local variable
Example
>>> def switcheroo(favorite_teams):
... print (favorite_teams)
... favorite_teams = ["Redskins"]
... print (favorite_teams)
>>> my_favorite_teams = ["Hokies", "
Nittany Lions"]
>>> switcheroo(my_favorite_teams)
["Hokies", "Nittany Lions"]
["Redskins"]
>>> print (my_favorite_teams)
["Hokies", "Nittany Lions"]31 / 115
Introductionto PythonPandas for
DataAnalytics
SrijithRajamohan
Introductionto Python
Pythonprogramming
NumPy
Matplotlib
Introductionto Pandas
Case study
Conclusion
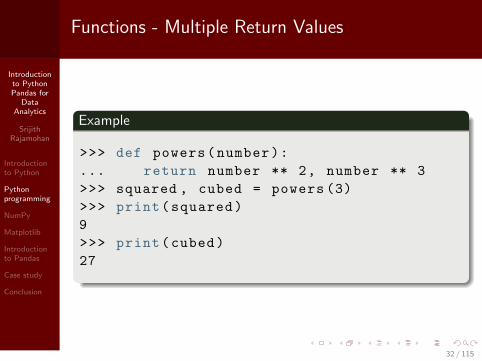
Functions - Multiple Return Values
Example
>>> def powers(number):
... return number ** 2, number ** 3
>>> squared , cubed = powers (3)
>>> print(squared)
9
>>> print(cubed)
27
32 / 115
Introductionto PythonPandas for
DataAnalytics
SrijithRajamohan
Introductionto Python
Pythonprogramming
NumPy
Matplotlib
Introductionto Pandas
Case study
Conclusion
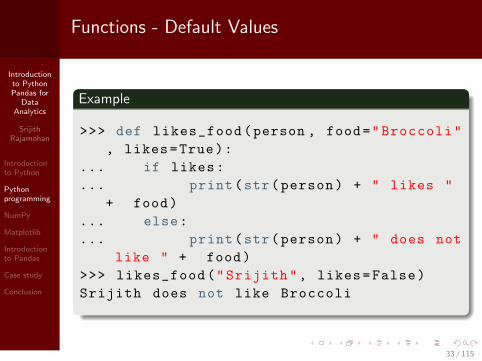
Functions - Default Values
Example
>>> def likes_food(person , food="Broccoli"
, likes=True):
... if likes:
... print(str(person) + " likes "
+ food)
... else:
... print(str(person) + " does not
like " + food)
>>> likes_food("Srijith", likes=False)
Srijith does not like Broccoli
33 / 115

Introductionto PythonPandas for
DataAnalytics
SrijithRajamohan
Introductionto Python
Pythonprogramming
NumPy
Matplotlib
Introductionto Pandas
Case study
Conclusion
Section 3
1 Introduction to Python
2 Python programming
3 NumPy
4 Matplotlib
5 Introduction to Pandas
6 Case study
7 Conclusion
34 / 115
Introductionto PythonPandas for
DataAnalytics
SrijithRajamohan
Introductionto Python
Pythonprogramming
NumPy
Matplotlib
Introductionto Pandas
Case study
Conclusion
NumPy
Used in almost all numerical computations in Python
• Used for high-performance vector and matrix computations
• Provides fast precompiled functions for numerical routines
• Written in C and Fortran
• Vectorized computations
35 / 115
Introductionto PythonPandas for
DataAnalytics
SrijithRajamohan
Introductionto Python
Pythonprogramming
NumPy
Matplotlib
Introductionto Pandas
Case study
Conclusion
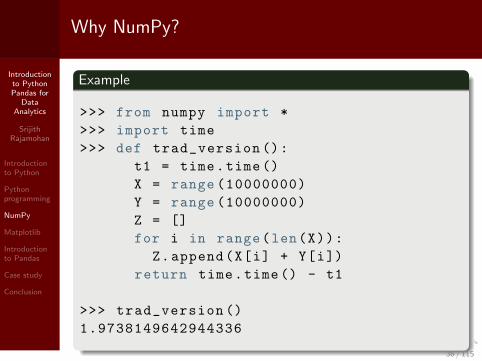
Why NumPy?
Example
>>> from numpy import *
>>> import time
>>> def trad_version ():
t1 = time.time()
X = range (10000000)
Y = range (10000000)
Z = []
for i in range(len(X)):
Z.append(X[i] + Y[i])
return time.time() - t1
>>> trad_version ()
1.9738149642944336
36 / 115
Introductionto PythonPandas for
DataAnalytics
SrijithRajamohan
Introductionto Python
Pythonprogramming
NumPy
Matplotlib
Introductionto Pandas
Case study
Conclusion
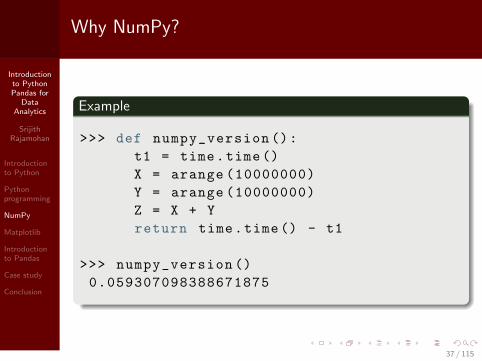
Why NumPy?
Example
>>> def numpy_version ():
t1 = time.time()
X = arange (10000000)
Y = arange (10000000)
Z = X + Y
return time.time() - t1
>>> numpy_version ()
0.059307098388671875
37 / 115
Introductionto PythonPandas for
DataAnalytics
SrijithRajamohan
Introductionto Python
Pythonprogramming
NumPy
Matplotlib
Introductionto Pandas
Case study
Conclusion
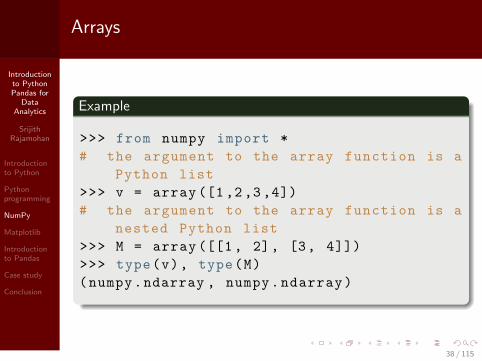
Arrays
Example
>>> from numpy import *
# the argument to the array function is a
Python list
>>> v = array ([1,2,3,4])
# the argument to the array function is a
nested Python list
>>> M = array ([[1, 2], [3, 4]])
>>> type(v), type(M)
(numpy.ndarray , numpy.ndarray)
38 / 115
Introductionto PythonPandas for
DataAnalytics
SrijithRajamohan
Introductionto Python
Pythonprogramming
NumPy
Matplotlib
Introductionto Pandas
Case study
Conclusion
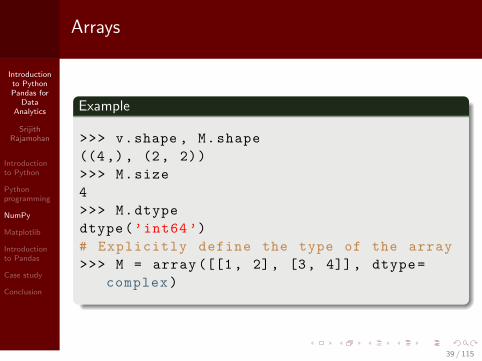
Arrays
Example
>>> v.shape , M.shape
((4,), (2, 2))
>>> M.size
4
>>> M.dtype
dtype(’int64’)
# Explicitly define the type of the array
>>> M = array ([[1, 2], [3, 4]], dtype=
complex)
39 / 115
Introductionto PythonPandas for
DataAnalytics
SrijithRajamohan
Introductionto Python
Pythonprogramming
NumPy
Matplotlib
Introductionto Pandas
Case study
Conclusion
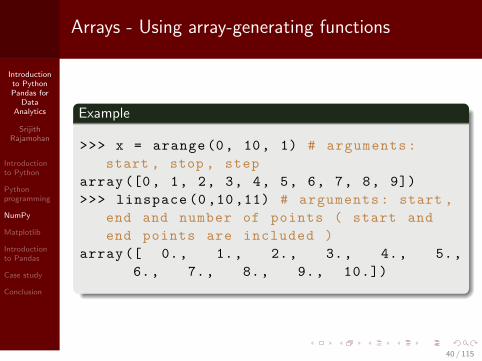
Arrays - Using array-generating functions
Example
>>> x = arange(0, 10, 1) # arguments:
start , stop , step
array([0, 1, 2, 3, 4, 5, 6, 7, 8, 9])
>>> linspace (0,10,11) # arguments: start ,
end and number of points ( start and
end points are included )
array([ 0., 1., 2., 3., 4., 5.,
6., 7., 8., 9., 10.])
40 / 115
Introductionto PythonPandas for
DataAnalytics
SrijithRajamohan
Introductionto Python
Pythonprogramming
NumPy
Matplotlib
Introductionto Pandas
Case study
Conclusion
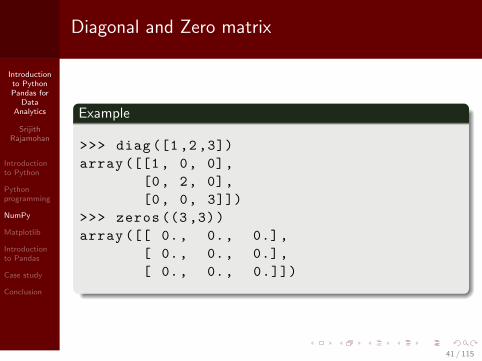
Diagonal and Zero matrix
Example
>>> diag ([1 ,2,3])
array ([[1, 0, 0],
[0, 2, 0],
[0, 0, 3]])
>>> zeros ((3 ,3))
array ([[ 0., 0., 0.],
[ 0., 0., 0.],
[ 0., 0., 0.]])
41 / 115
Introductionto PythonPandas for
DataAnalytics
SrijithRajamohan
Introductionto Python
Pythonprogramming
NumPy
Matplotlib
Introductionto Pandas
Case study
Conclusion
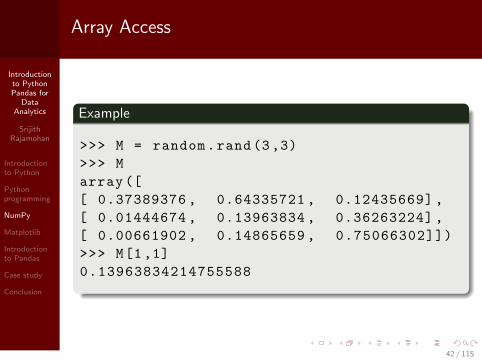
Array Access
Example
>>> M = random.rand (3,3)
>>> M
array([
[ 0.37389376 , 0.64335721 , 0.12435669] ,
[ 0.01444674 , 0.13963834 , 0.36263224] ,
[ 0.00661902 , 0.14865659 , 0.75066302]])
>>> M[1,1]
0.13963834214755588
42 / 115

Introductionto PythonPandas for
DataAnalytics
SrijithRajamohan
Introductionto Python
Pythonprogramming
NumPy
Matplotlib
Introductionto Pandas
Case study
Conclusion
Array Access
Example
# Access the first row
>>> M[1]
array(
[ 0.01444674 , 0.13963834 , 0.36263224])
# The first row can be also be accessed
using this notation
>>> M[1,:]
array(
[ 0.01444674 , 0.13963834 , 0.36263224])
# Access the first column
>>> M[:,1]
array(
[ 0.64335721 , 0.13963834 , 0.14865659])
43 / 115
Introductionto PythonPandas for
DataAnalytics
SrijithRajamohan
Introductionto Python
Pythonprogramming
NumPy
Matplotlib
Introductionto Pandas
Case study
Conclusion
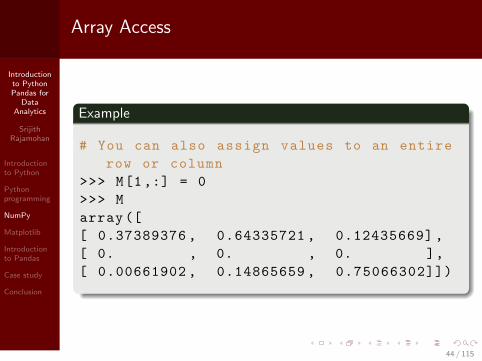
Array Access
Example
# You can also assign values to an entire
row or column
>>> M[1,:] = 0
>>> M
array([
[ 0.37389376 , 0.64335721 , 0.12435669] ,
[ 0. , 0. , 0. ],
[ 0.00661902 , 0.14865659 , 0.75066302]])
44 / 115
Introductionto PythonPandas for
DataAnalytics
SrijithRajamohan
Introductionto Python
Pythonprogramming
NumPy
Matplotlib
Introductionto Pandas
Case study
Conclusion
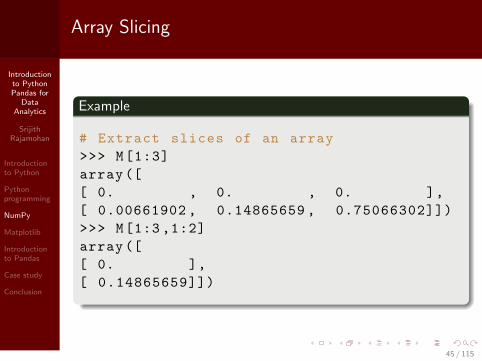
Array Slicing
Example
# Extract slices of an array
>>> M[1:3]
array([
[ 0. , 0. , 0. ],
[ 0.00661902 , 0.14865659 , 0.75066302]])
>>> M[1:3 ,1:2]
array([
[ 0. ],
[ 0.14865659]])
45 / 115
Introductionto PythonPandas for
DataAnalytics
SrijithRajamohan
Introductionto Python
Pythonprogramming
NumPy
Matplotlib
Introductionto Pandas
Case study
Conclusion
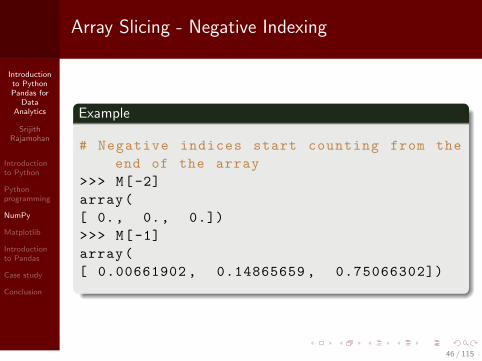
Array Slicing - Negative Indexing
Example
# Negative indices start counting from the
end of the array
>>> M[-2]
array(
[ 0., 0., 0.])
>>> M[-1]
array(
[ 0.00661902 , 0.14865659 , 0.75066302])
46 / 115
Introductionto PythonPandas for
DataAnalytics
SrijithRajamohan
Introductionto Python
Pythonprogramming
NumPy
Matplotlib
Introductionto Pandas
Case study
Conclusion
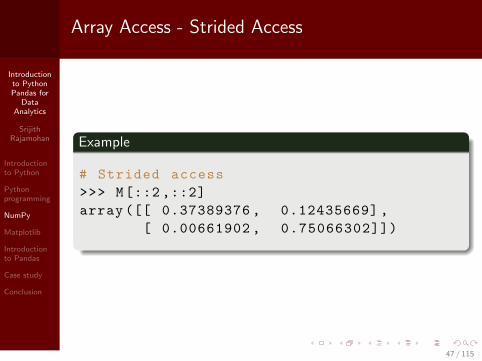
Array Access - Strided Access
Example
# Strided access
>>> M[::2 ,::2]
array ([[ 0.37389376 , 0.12435669] ,
[ 0.00661902 , 0.75066302]])
47 / 115
Introductionto PythonPandas for
DataAnalytics
SrijithRajamohan
Introductionto Python
Pythonprogramming
NumPy
Matplotlib
Introductionto Pandas
Case study
Conclusion
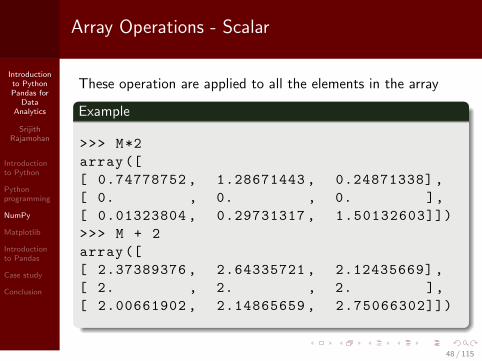
Array Operations - Scalar
These operation are applied to all the elements in the array
Example
>>> M*2
array([
[ 0.74778752 , 1.28671443 , 0.24871338] ,
[ 0. , 0. , 0. ],
[ 0.01323804 , 0.29731317 , 1.50132603]])
>>> M + 2
array([
[ 2.37389376 , 2.64335721 , 2.12435669] ,
[ 2. , 2. , 2. ],
[ 2.00661902 , 2.14865659 , 2.75066302]])
48 / 115

Introductionto PythonPandas for
DataAnalytics
SrijithRajamohan
Introductionto Python
Pythonprogramming
NumPy
Matplotlib
Introductionto Pandas
Case study
Conclusion
Matrix multiplication
Example
>>> M * M # Element -wise multiplication
array([
[1.397965e -01 ,4.139085e -01 ,1.546458e-02],
[0.000000e+00 ,0.000000e+00 ,0.00000e+00],
[4.381141e -05 ,2.209878e -02 ,5.634949e -01]])
>>> dot(M,M) # Matrix multiplication
array([
[ 0.14061966 , 0.25903369 , 0.13984616] ,
[ 0. , 0. , 0. ],
[ 0.00744346 , 0.1158494 , 0.56431808]])
49 / 115
Introductionto PythonPandas for
DataAnalytics
SrijithRajamohan
Introductionto Python
Pythonprogramming
NumPy
Matplotlib
Introductionto Pandas
Case study
Conclusion
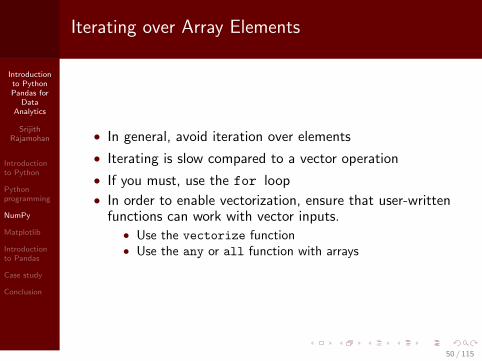
Iterating over Array Elements
• In general, avoid iteration over elements
• Iterating is slow compared to a vector operation
• If you must, use the for loop
• In order to enable vectorization, ensure that user-writtenfunctions can work with vector inputs.
• Use the vectorize function• Use the any or all function with arrays
50 / 115
Introductionto PythonPandas for
DataAnalytics
SrijithRajamohan
Introductionto Python
Pythonprogramming
NumPy
Matplotlib
Introductionto Pandas
Case study
Conclusion
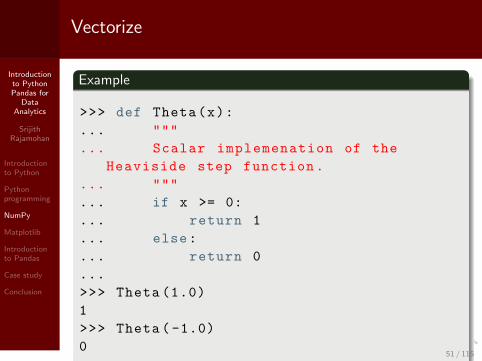
Vectorize
Example
>>> def Theta(x):
... """
... Scalar implemenation of the
Heaviside step function.
... """
... if x >= 0:
... return 1
... else:
... return 0
...
>>> Theta (1.0)
1
>>> Theta (-1.0)
051 / 115

Introductionto PythonPandas for
DataAnalytics
SrijithRajamohan
Introductionto Python
Pythonprogramming
NumPy
Matplotlib
Introductionto Pandas
Case study
Conclusion
Vectorize
Without vectorize we would not be able to pass v to thefunction
Example
>>> v
array([1, 2, 3, 4])
>>> Tvec = vectorize(Theta)
>>> Tvec(v)
array([1, 1, 1, 1])
>>> Tvec (1.0)
array (1)
52 / 115
Introductionto PythonPandas for
DataAnalytics
SrijithRajamohan
Introductionto Python
Pythonprogramming
NumPy
Matplotlib
Introductionto Pandas
Case study
Conclusion
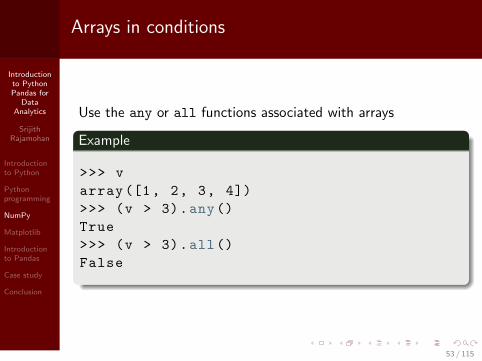
Arrays in conditions
Use the any or all functions associated with arrays
Example
>>> v
array([1, 2, 3, 4])
>>> (v > 3).any()
True
>>> (v > 3).all()
False
53 / 115
Introductionto PythonPandas for
DataAnalytics
SrijithRajamohan
Introductionto Python
Pythonprogramming
NumPy
Matplotlib
Introductionto Pandas
Case study
Conclusion
Section 4
1 Introduction to Python
2 Python programming
3 NumPy
4 Matplotlib
5 Introduction to Pandas
6 Case study
7 Conclusion
54 / 115
Introductionto PythonPandas for
DataAnalytics
SrijithRajamohan
Introductionto Python
Pythonprogramming
NumPy
Matplotlib
Introductionto Pandas
Case study
Conclusion
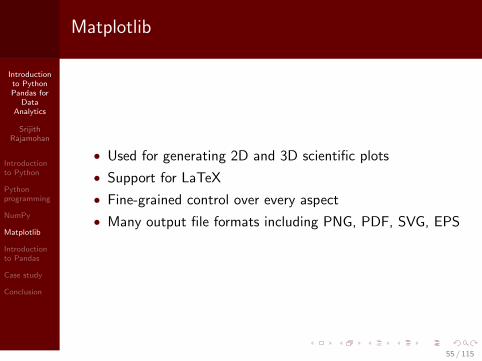
Matplotlib
• Used for generating 2D and 3D scientific plots
• Support for LaTeX
• Fine-grained control over every aspect
• Many output file formats including PNG, PDF, SVG, EPS
55 / 115
Introductionto PythonPandas for
DataAnalytics
SrijithRajamohan
Introductionto Python
Pythonprogramming
NumPy
Matplotlib
Introductionto Pandas
Case study
Conclusion
Matplotlib - Customize matplotlibrc
• Configuration file ‘matplotlibrc’ used to customize almostevery aspect of plotting
• On Linux, it looks in .config/matplotlib/matplotlibrc
• On other platforms, it looks in .matplotlib/matplotlibrc
• Use ‘matplotlib.matplotlib fname()’ to determinefrom where the current matplotlibrc is loaded
• Customization options can be found athttp://matplotlib.org/users/customizing.html
56 / 115

Introductionto PythonPandas for
DataAnalytics
SrijithRajamohan
Introductionto Python
Pythonprogramming
NumPy
Matplotlib
Introductionto Pandas
Case study
Conclusion
Matplotlib
• Matplotlib is the entire library
• Pyplot - a module within Matplotlib that provides accessto the underlying plotting library
• Pylab - a convenience module that combines thefunctionality of Pyplot with Numpy
• Pylab interface convenient for interactive plotting
57 / 115
Introductionto PythonPandas for
DataAnalytics
SrijithRajamohan
Introductionto Python
Pythonprogramming
NumPy
Matplotlib
Introductionto Pandas
Case study
Conclusion
Pylab
Example
>>> import pylab as pl
>>> pl.ioff()
>>> pl.isinteractive ()
False
>>> x = [1,3,7]
>>> pl.plot(x) # if interactive mode is
off use show() after the plot command
[<matplotlib.lines.Line2D object at 0
x10437a190 >]
>>> pl.savefig(’fig_test.pdf’,dpi=600,
format=’pdf’)
>>> pl.show()
58 / 115

Introductionto PythonPandas for
DataAnalytics
SrijithRajamohan
Introductionto Python
Pythonprogramming
NumPy
Matplotlib
Introductionto Pandas
Case study
Conclusion
Pylab
0.0 0.5 1.0 1.5 2.01
2
3
4
5
6
7Simple Pylab plot
59 / 115
Introductionto PythonPandas for
DataAnalytics
SrijithRajamohan
Introductionto Python
Pythonprogramming
NumPy
Matplotlib
Introductionto Pandas
Case study
Conclusion
Pylab
Example
>>> X = np.linspace(-np.pi , np.pi , 256,
endpoint=True)
>>> C, S = np.cos(X), np.sin(X)
# Plot cosine with a blue continuous line
of width 1 (pixels)
>>> pl.plot(X, C, color="blue", linewidth
=1.0, linestyle="-")
>>> pl.xlabel("X") ; pl.ylabel("Y")
>>> pl.title("Sine and Cosine waves")
# Plot sine with a green continuous line
of width 1 (pixels)
>>> pl.plot(X, S, color="green", linewidth
=1.0, linestyle="-")
>>> pl.show()
...
...
...
60 / 115
Introductionto PythonPandas for
DataAnalytics
SrijithRajamohan
Introductionto Python
Pythonprogramming
NumPy
Matplotlib
Introductionto Pandas
Case study
Conclusion
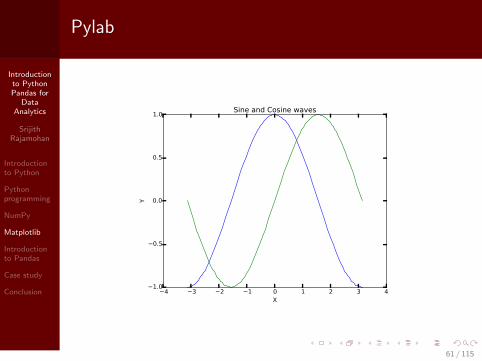
Pylab
4 3 2 1 0 1 2 3 4X
1.0
0.5
0.0
0.5
1.0
Y
Sine and Cosine waves
61 / 115
Introductionto PythonPandas for
DataAnalytics
SrijithRajamohan
Introductionto Python
Pythonprogramming
NumPy
Matplotlib
Introductionto Pandas
Case study
Conclusion
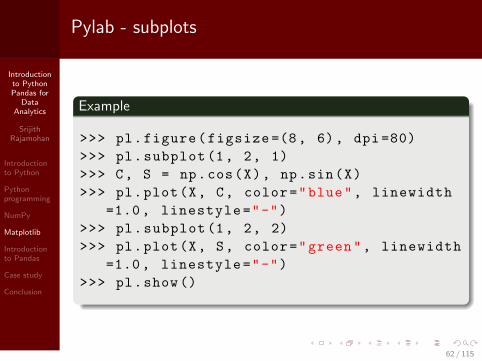
Pylab - subplots
Example
>>> pl.figure(figsize =(8, 6), dpi =80)
>>> pl.subplot(1, 2, 1)
>>> C, S = np.cos(X), np.sin(X)
>>> pl.plot(X, C, color="blue", linewidth
=1.0, linestyle="-")
>>> pl.subplot(1, 2, 2)
>>> pl.plot(X, S, color="green", linewidth
=1.0, linestyle="-")
>>> pl.show()
62 / 115

Introductionto PythonPandas for
DataAnalytics
SrijithRajamohan
Introductionto Python
Pythonprogramming
NumPy
Matplotlib
Introductionto Pandas
Case study
Conclusion
Pylab - subplots
4 3 2 1 0 1 2 3 41.0
0.5
0.0
0.5
1.0
4 3 2 1 0 1 2 3 41.0
0.5
0.0
0.5
1.0
63 / 115
Introductionto PythonPandas for
DataAnalytics
SrijithRajamohan
Introductionto Python
Pythonprogramming
NumPy
Matplotlib
Introductionto Pandas
Case study
Conclusion
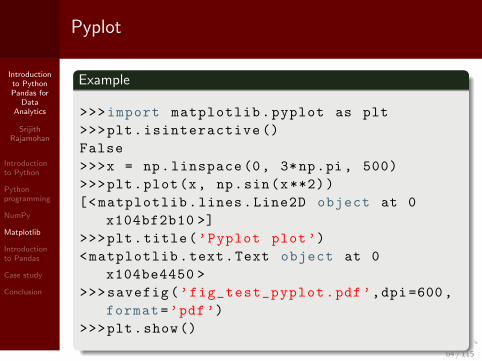
Pyplot
Example
>>>import matplotlib.pyplot as plt
>>>plt.isinteractive ()
False
>>>x = np.linspace(0, 3*np.pi , 500)
>>>plt.plot(x, np.sin(x**2))
[<matplotlib.lines.Line2D object at 0
x104bf2b10 >]
>>>plt.title(’Pyplot plot’)
<matplotlib.text.Text object at 0
x104be4450 >
>>>savefig(’fig_test_pyplot.pdf’,dpi=600,
format=’pdf’)
>>>plt.show()
64 / 115

Introductionto PythonPandas for
DataAnalytics
SrijithRajamohan
Introductionto Python
Pythonprogramming
NumPy
Matplotlib
Introductionto Pandas
Case study
Conclusion
Pyplot
0 2 4 6 8 10−1.0
−0.5
0.0
0.5
1.0Pyplot plot
65 / 115
Introductionto PythonPandas for
DataAnalytics
SrijithRajamohan
Introductionto Python
Pythonprogramming
NumPy
Matplotlib
Introductionto Pandas
Case study
Conclusion
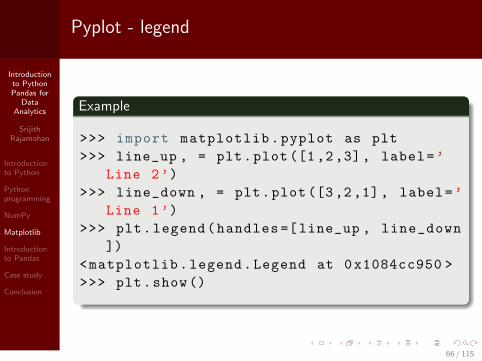
Pyplot - legend
Example
>>> import matplotlib.pyplot as plt
>>> line_up , = plt.plot([1,2,3], label=’
Line 2’)
>>> line_down , = plt.plot([3,2,1], label=’
Line 1’)
>>> plt.legend(handles =[line_up , line_down
])
<matplotlib.legend.Legend at 0x1084cc950 >
>>> plt.show()
66 / 115

Introductionto PythonPandas for
DataAnalytics
SrijithRajamohan
Introductionto Python
Pythonprogramming
NumPy
Matplotlib
Introductionto Pandas
Case study
Conclusion
Pyplot - legend
0.0 0.5 1.0 1.5 2.01.0
1.5
2.0
2.5
3.0
Line 2Line 1
67 / 115
Introductionto PythonPandas for
DataAnalytics
SrijithRajamohan
Introductionto Python
Pythonprogramming
NumPy
Matplotlib
Introductionto Pandas
Case study
Conclusion
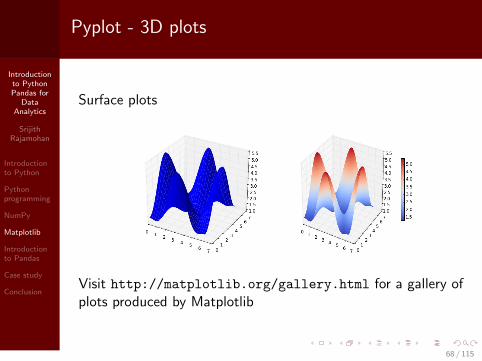
Pyplot - 3D plots
Surface plots
Visit http://matplotlib.org/gallery.html for a gallery ofplots produced by Matplotlib
68 / 115

Introductionto PythonPandas for
DataAnalytics
SrijithRajamohan
Introductionto Python
Pythonprogramming
NumPy
Matplotlib
Introductionto Pandas
Case study
Conclusion
Section 5
1 Introduction to Python
2 Python programming
3 NumPy
4 Matplotlib
5 Introduction to Pandas
6 Case study
7 Conclusion
69 / 115
Introductionto PythonPandas for
DataAnalytics
SrijithRajamohan
Introductionto Python
Pythonprogramming
NumPy
Matplotlib
Introductionto Pandas
Case study
Conclusion
What is Pandas?
• Pandas is an open source, BSD-licensed library
• High-performance, easy-to-use data structures and dataanalysis tools
• Built for the Python programming language.
70 / 115
Introductionto PythonPandas for
DataAnalytics
SrijithRajamohan
Introductionto Python
Pythonprogramming
NumPy
Matplotlib
Introductionto Pandas
Case study
Conclusion
Pandas - import modules
Example
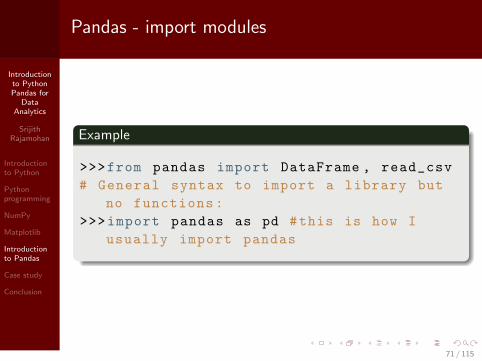
>>>from pandas import DataFrame , read_csv
# General syntax to import a library but
no functions:
>>>import pandas as pd #this is how I
usually import pandas
71 / 115
Introductionto PythonPandas for
DataAnalytics
SrijithRajamohan
Introductionto Python
Pythonprogramming
NumPy
Matplotlib
Introductionto Pandas
Case study
Conclusion
Pandas - Create a dataframe
Example
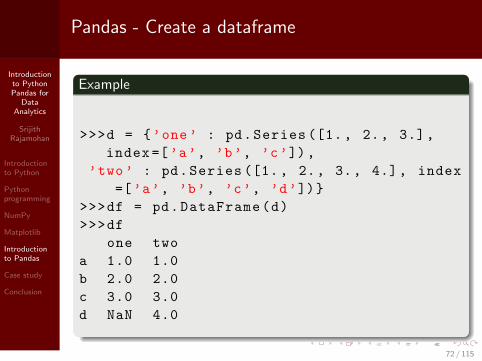
>>>d = {’one’ : pd.Series ([1., 2., 3.],
index=[’a’, ’b’, ’c’]),
’two’ : pd.Series ([1., 2., 3., 4.], index
=[’a’, ’b’, ’c’, ’d’])}
>>>df = pd.DataFrame(d)
>>>df
one two
a 1.0 1.0
b 2.0 2.0
c 3.0 3.0
d NaN 4.0
72 / 115
Introductionto PythonPandas for
DataAnalytics
SrijithRajamohan
Introductionto Python
Pythonprogramming
NumPy
Matplotlib
Introductionto Pandas
Case study
Conclusion
Pandas - Create a dataframe
Example
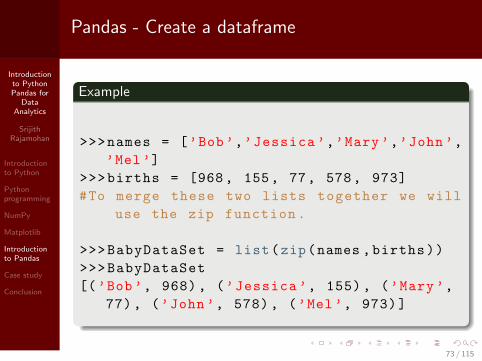
>>>names = [’Bob’,’Jessica ’,’Mary’,’John’,
’Mel’]
>>>births = [968, 155, 77, 578, 973]
#To merge these two lists together we will
use the zip function.
>>>BabyDataSet = list(zip(names ,births))
>>>BabyDataSet
[(’Bob’, 968), (’Jessica ’, 155), (’Mary’,
77), (’John’, 578), (’Mel’, 973)]
73 / 115
Introductionto PythonPandas for
DataAnalytics
SrijithRajamohan
Introductionto Python
Pythonprogramming
NumPy
Matplotlib
Introductionto Pandas
Case study
Conclusion
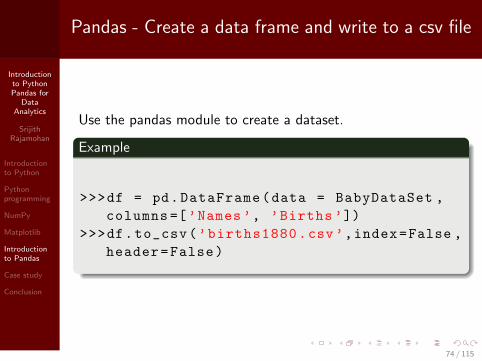
Pandas - Create a data frame and write to a csv file
Use the pandas module to create a dataset.
Example
>>>df = pd.DataFrame(data = BabyDataSet ,
columns =[’Names’, ’Births ’])
>>>df.to_csv(’births1880.csv’,index=False ,
header=False)
74 / 115
Introductionto PythonPandas for
DataAnalytics
SrijithRajamohan
Introductionto Python
Pythonprogramming
NumPy
Matplotlib
Introductionto Pandas
Case study
Conclusion
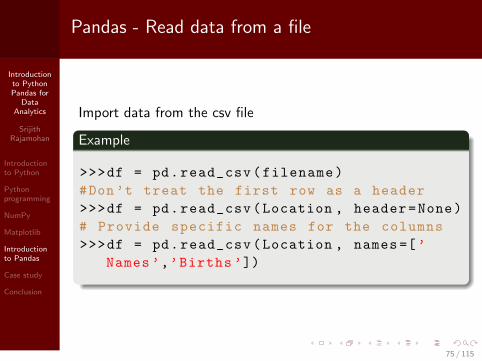
Pandas - Read data from a file
Import data from the csv file
Example
>>>df = pd.read_csv(filename)
#Don’t treat the first row as a header
>>>df = pd.read_csv(Location , header=None)
# Provide specific names for the columns
>>>df = pd.read_csv(Location , names=[’
Names ’,’Births ’])
75 / 115
Introductionto PythonPandas for
DataAnalytics
SrijithRajamohan
Introductionto Python
Pythonprogramming
NumPy
Matplotlib
Introductionto Pandas
Case study
Conclusion
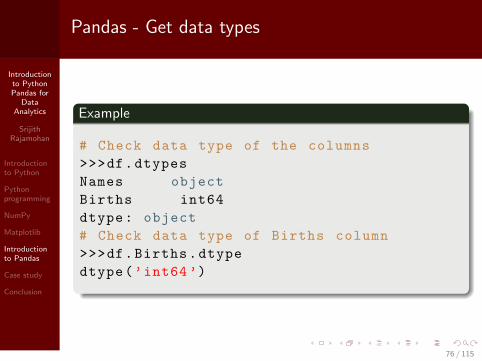
Pandas - Get data types
Example
# Check data type of the columns
>>>df.dtypes
Names object
Births int64
dtype: object
# Check data type of Births column
>>>df.Births.dtype
dtype(’int64’)
76 / 115
Introductionto PythonPandas for
DataAnalytics
SrijithRajamohan
Introductionto Python
Pythonprogramming
NumPy
Matplotlib
Introductionto Pandas
Case study
Conclusion
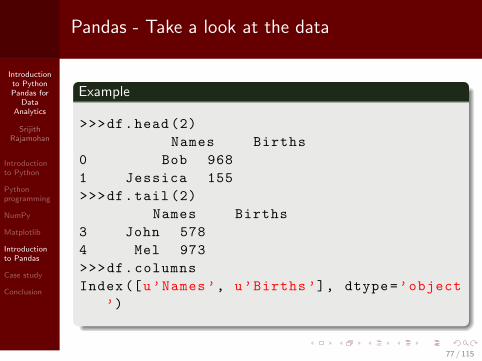
Pandas - Take a look at the data
Example
>>>df.head (2)
Names Births
0 Bob 968
1 Jessica 155
>>>df.tail (2)
Names Births
3 John 578
4 Mel 973
>>>df.columns
Index([u’Names’, u’Births ’], dtype=’object
’)
77 / 115
Introductionto PythonPandas for
DataAnalytics
SrijithRajamohan
Introductionto Python
Pythonprogramming
NumPy
Matplotlib
Introductionto Pandas
Case study
Conclusion
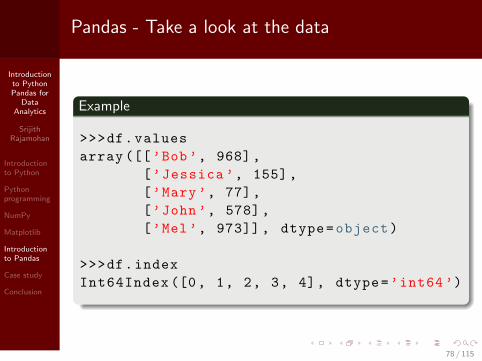
Pandas - Take a look at the data
Example
>>>df.values
array ([[’Bob’, 968],
[’Jessica ’, 155],
[’Mary’, 77],
[’John’, 578],
[’Mel’, 973]] , dtype=object)
>>>df.index
Int64Index ([0, 1, 2, 3, 4], dtype=’int64 ’)
78 / 115
Introductionto PythonPandas for
DataAnalytics
SrijithRajamohan
Introductionto Python
Pythonprogramming
NumPy
Matplotlib
Introductionto Pandas
Case study
Conclusion
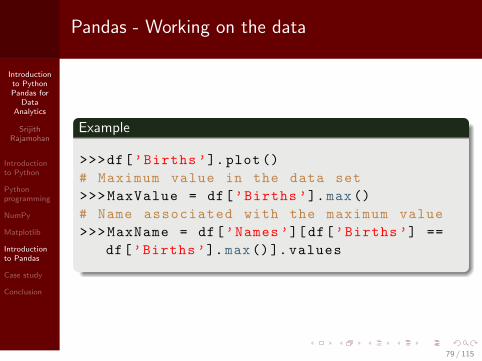
Pandas - Working on the data
Example
>>>df[’Births ’].plot()
# Maximum value in the data set
>>>MaxValue = df[’Births ’].max()
# Name associated with the maximum value
>>>MaxName = df[’Names’][df[’Births ’] ==
df[’Births ’].max()]. values
79 / 115
Introductionto PythonPandas for
DataAnalytics
SrijithRajamohan
Introductionto Python
Pythonprogramming
NumPy
Matplotlib
Introductionto Pandas
Case study
Conclusion
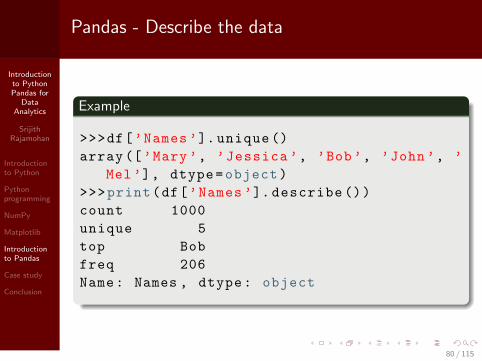
Pandas - Describe the data
Example
>>>df[’Names’]. unique ()
array([’Mary’, ’Jessica ’, ’Bob’, ’John’, ’
Mel’], dtype=object)
>>>print(df[’Names’]. describe ())
count 1000
unique 5
top Bob
freq 206
Name: Names , dtype: object
80 / 115
Introductionto PythonPandas for
DataAnalytics
SrijithRajamohan
Introductionto Python
Pythonprogramming
NumPy
Matplotlib
Introductionto Pandas
Case study
Conclusion
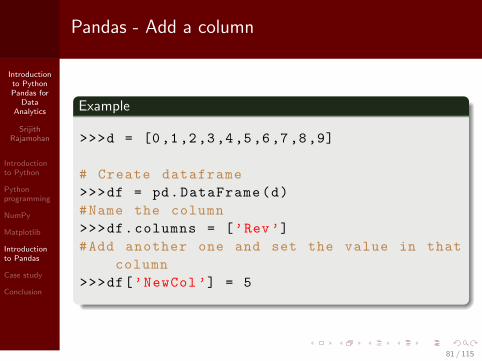
Pandas - Add a column
Example
>>>d = [0,1,2,3,4,5,6,7,8,9]
# Create dataframe
>>>df = pd.DataFrame(d)
#Name the column
>>>df.columns = [’Rev’]
#Add another one and set the value in that
column
>>>df[’NewCol ’] = 5
81 / 115
Introductionto PythonPandas for
DataAnalytics
SrijithRajamohan
Introductionto Python
Pythonprogramming
NumPy
Matplotlib
Introductionto Pandas
Case study
Conclusion
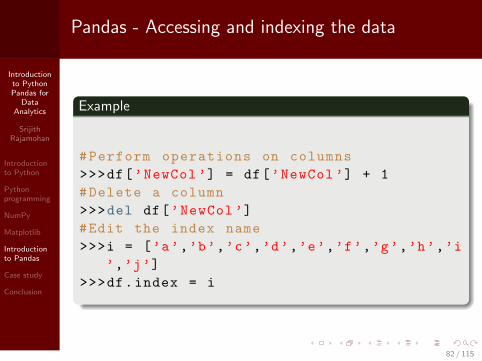
Pandas - Accessing and indexing the data
Example
#Perform operations on columns
>>>df[’NewCol ’] = df[’NewCol ’] + 1
#Delete a column
>>>del df[’NewCol ’]
#Edit the index name
>>>i = [’a’,’b’,’c’,’d’,’e’,’f’,’g’,’h’,’i
’,’j’]
>>>df.index = i
82 / 115
Introductionto PythonPandas for
DataAnalytics
SrijithRajamohan
Introductionto Python
Pythonprogramming
NumPy
Matplotlib
Introductionto Pandas
Case study
Conclusion
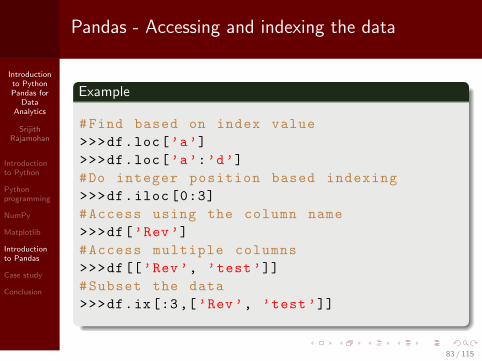
Pandas - Accessing and indexing the data
Example
#Find based on index value
>>>df.loc[’a’]
>>>df.loc[’a’:’d’]
#Do integer position based indexing
>>>df.iloc [0:3]
#Access using the column name
>>>df[’Rev’]
#Access multiple columns
>>>df[[’Rev’, ’test’]]
#Subset the data
>>>df.ix[:3,[’Rev’, ’test’]]
83 / 115
Introductionto PythonPandas for
DataAnalytics
SrijithRajamohan
Introductionto Python
Pythonprogramming
NumPy
Matplotlib
Introductionto Pandas
Case study
Conclusion
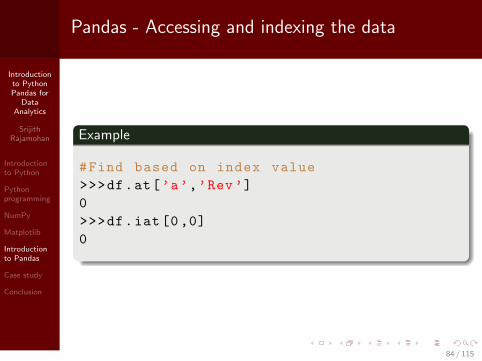
Pandas - Accessing and indexing the data
Example
#Find based on index value
>>>df.at[’a’,’Rev’]
0
>>>df.iat[0,0]
0
84 / 115
Introductionto PythonPandas for
DataAnalytics
SrijithRajamohan
Introductionto Python
Pythonprogramming
NumPy
Matplotlib
Introductionto Pandas
Case study
Conclusion
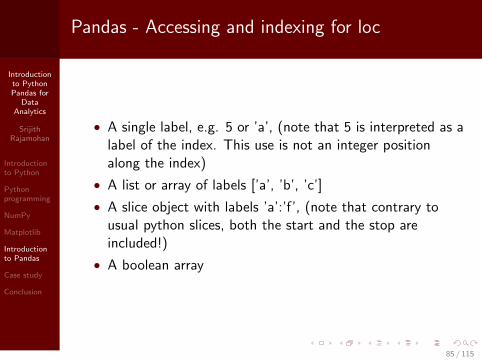
Pandas - Accessing and indexing for loc
• A single label, e.g. 5 or ’a’, (note that 5 is interpreted as alabel of the index. This use is not an integer positionalong the index)
• A list or array of labels [’a’, ’b’, ’c’]
• A slice object with labels ’a’:’f’, (note that contrary tousual python slices, both the start and the stop areincluded!)
• A boolean array
85 / 115

Introductionto PythonPandas for
DataAnalytics
SrijithRajamohan
Introductionto Python
Pythonprogramming
NumPy
Matplotlib
Introductionto Pandas
Case study
Conclusion
Pandas - Accessing and indexing for iloc
• An integer e.g. 5
• A list or array of integers [4, 3, 0]
• A slice object with ints 1:7
86 / 115

Introductionto PythonPandas for
DataAnalytics
SrijithRajamohan
Introductionto Python
Pythonprogramming
NumPy
Matplotlib
Introductionto Pandas
Case study
Conclusion
Pandas - Accessing and indexing summarized
Example
loc: only work on index
iloc: work on position
ix: this is the most general and
supports index and position based
retrieval
at: get scalar values , it’s a very fast
loc
iat: get scalar values , it’s a very fast
iloc
87 / 115
Introductionto PythonPandas for
DataAnalytics
SrijithRajamohan
Introductionto Python
Pythonprogramming
NumPy
Matplotlib
Introductionto Pandas
Case study
Conclusion
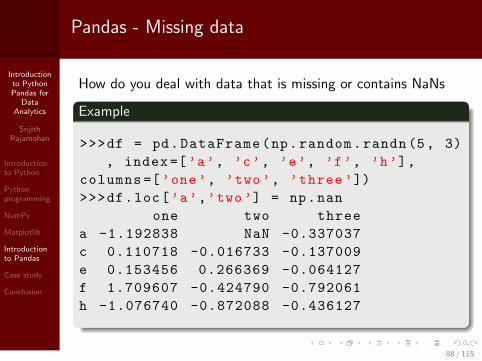
Pandas - Missing data
How do you deal with data that is missing or contains NaNs
Example
>>>df = pd.DataFrame(np.random.randn(5, 3)
, index=[’a’, ’c’, ’e’, ’f’, ’h’],
columns =[’one’, ’two’, ’three’])
>>>df.loc[’a’,’two’] = np.nan
one two three
a -1.192838 NaN -0.337037
c 0.110718 -0.016733 -0.137009
e 0.153456 0.266369 -0.064127
f 1.709607 -0.424790 -0.792061
h -1.076740 -0.872088 -0.436127
88 / 115
Introductionto PythonPandas for
DataAnalytics
SrijithRajamohan
Introductionto Python
Pythonprogramming
NumPy
Matplotlib
Introductionto Pandas
Case study
Conclusion
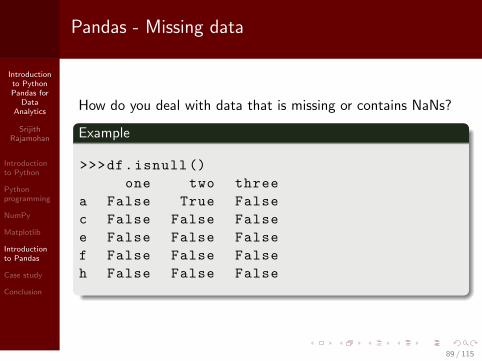
Pandas - Missing data
How do you deal with data that is missing or contains NaNs?
Example
>>>df.isnull ()
one two three
a False True False
c False False False
e False False False
f False False False
h False False False
89 / 115

Introductionto PythonPandas for
DataAnalytics
SrijithRajamohan
Introductionto Python
Pythonprogramming
NumPy
Matplotlib
Introductionto Pandas
Case study
Conclusion
Pandas - Missing data
You can fill this data in a number of ways.
Example
>>>df.fillna (0)
one two three
a -1.192838 0.000000 -0.337037
c 0.110718 -0.016733 -0.137009
e 0.153456 0.266369 -0.064127
f 1.709607 -0.424790 -0.792061
h -1.076740 -0.872088 -0.436127
90 / 115
Introductionto PythonPandas for
DataAnalytics
SrijithRajamohan
Introductionto Python
Pythonprogramming
NumPy
Matplotlib
Introductionto Pandas
Case study
Conclusion
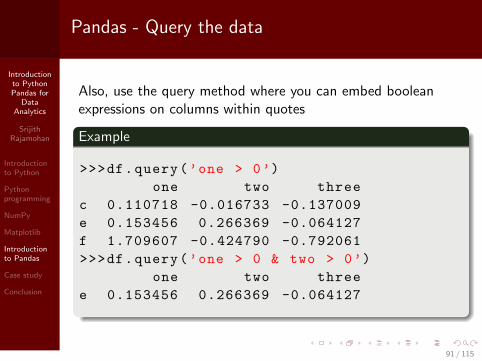
Pandas - Query the data
Also, use the query method where you can embed booleanexpressions on columns within quotes
Example
>>>df.query(’one > 0’)
one two three
c 0.110718 -0.016733 -0.137009
e 0.153456 0.266369 -0.064127
f 1.709607 -0.424790 -0.792061
>>>df.query(’one > 0 & two > 0’)
one two three
e 0.153456 0.266369 -0.064127
91 / 115
Introductionto PythonPandas for
DataAnalytics
SrijithRajamohan
Introductionto Python
Pythonprogramming
NumPy
Matplotlib
Introductionto Pandas
Case study
Conclusion
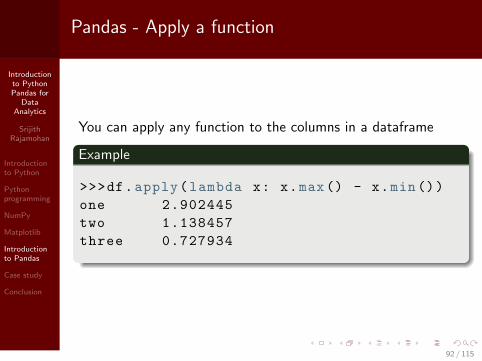
Pandas - Apply a function
You can apply any function to the columns in a dataframe
Example
>>>df.apply(lambda x: x.max() - x.min())
one 2.902445
two 1.138457
three 0.727934
92 / 115
Introductionto PythonPandas for
DataAnalytics
SrijithRajamohan
Introductionto Python
Pythonprogramming
NumPy
Matplotlib
Introductionto Pandas
Case study
Conclusion
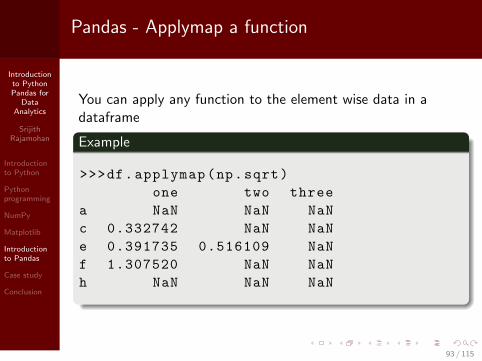
Pandas - Applymap a function
You can apply any function to the element wise data in adataframe
Example
>>>df.applymap(np.sqrt)
one two three
a NaN NaN NaN
c 0.332742 NaN NaN
e 0.391735 0.516109 NaN
f 1.307520 NaN NaN
h NaN NaN NaN
93 / 115
Introductionto PythonPandas for
DataAnalytics
SrijithRajamohan
Introductionto Python
Pythonprogramming
NumPy
Matplotlib
Introductionto Pandas
Case study
Conclusion
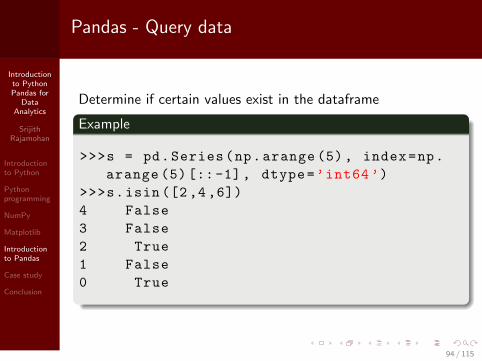
Pandas - Query data
Determine if certain values exist in the dataframe
Example
>>>s = pd.Series(np.arange (5), index=np.
arange (5)[::-1], dtype=’int64’)
>>>s.isin ([2 ,4,6])
4 False
3 False
2 True
1 False
0 True
94 / 115

Introductionto PythonPandas for
DataAnalytics
SrijithRajamohan
Introductionto Python
Pythonprogramming
NumPy
Matplotlib
Introductionto Pandas
Case study
Conclusion
Pandas - Query data
Use the where method
Example
>>>s = pd.Series(np.arange (5), index=np.
arange (5)[::-1], dtype=’int64’)
>>>s.where(s>3)
4 NaN
3 NaN
2 NaN
1 NaN
0 4
95 / 115
Introductionto PythonPandas for
DataAnalytics
SrijithRajamohan
Introductionto Python
Pythonprogramming
NumPy
Matplotlib
Introductionto Pandas
Case study
Conclusion
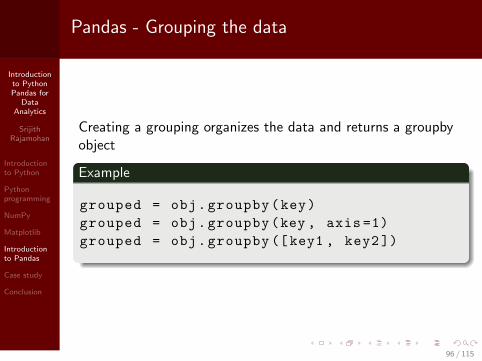
Pandas - Grouping the data
Creating a grouping organizes the data and returns a groupbyobject
Example
grouped = obj.groupby(key)
grouped = obj.groupby(key , axis =1)
grouped = obj.groupby ([key1 , key2])
96 / 115
Introductionto PythonPandas for
DataAnalytics
SrijithRajamohan
Introductionto Python
Pythonprogramming
NumPy
Matplotlib
Introductionto Pandas
Case study
Conclusion
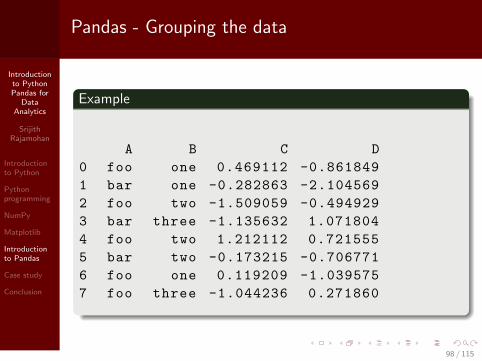
Pandas - Grouping the data
Example
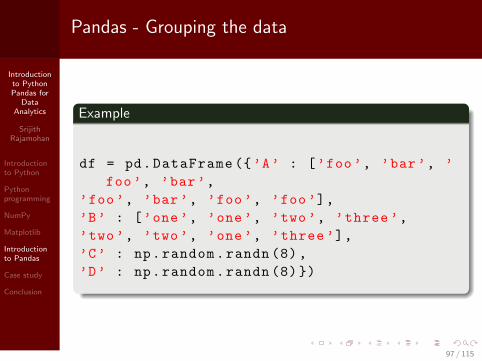
df = pd.DataFrame ({’A’ : [’foo’, ’bar’, ’
foo’, ’bar’,
’foo’, ’bar’, ’foo’, ’foo’],
’B’ : [’one’, ’one’, ’two’, ’three’,
’two’, ’two’, ’one’, ’three’],
’C’ : np.random.randn (8),
’D’ : np.random.randn (8)})
97 / 115
Introductionto PythonPandas for
DataAnalytics
SrijithRajamohan
Introductionto Python
Pythonprogramming
NumPy
Matplotlib
Introductionto Pandas
Case study
Conclusion
Pandas - Grouping the data
Example
A B C D
0 foo one 0.469112 -0.861849
1 bar one -0.282863 -2.104569
2 foo two -1.509059 -0.494929
3 bar three -1.135632 1.071804
4 foo two 1.212112 0.721555
5 bar two -0.173215 -0.706771
6 foo one 0.119209 -1.039575
7 foo three -1.044236 0.271860
98 / 115

Introductionto PythonPandas for
DataAnalytics
SrijithRajamohan
Introductionto Python
Pythonprogramming
NumPy
Matplotlib
Introductionto Pandas
Case study
Conclusion
Pandas - Grouping the data
Group by either A or B columns or both
Example
>>>grouped = df.groupby(’A’)
>>>grouped = df.groupby ([’A’, ’B’])
# Sorts by default , disable this for
potential speedup
>>>grouped = df.groupby(’A’,sort=False)
99 / 115
Introductionto PythonPandas for
DataAnalytics
SrijithRajamohan
Introductionto Python
Pythonprogramming
NumPy
Matplotlib
Introductionto Pandas
Case study
Conclusion
Pandas - Grouping the data
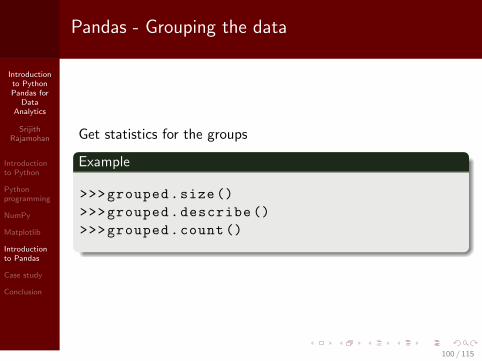
Get statistics for the groups
Example
>>>grouped.size()
>>>grouped.describe ()
>>>grouped.count()
100 / 115
Introductionto PythonPandas for
DataAnalytics
SrijithRajamohan
Introductionto Python
Pythonprogramming
NumPy
Matplotlib
Introductionto Pandas
Case study
Conclusion
Pandas - Grouping the data
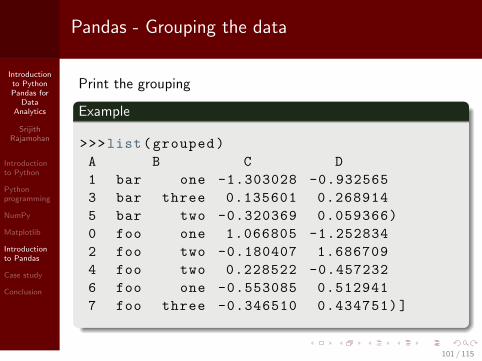
Print the grouping
Example
>>>list(grouped)
A B C D
1 bar one -1.303028 -0.932565
3 bar three 0.135601 0.268914
5 bar two -0.320369 0.059366)
0 foo one 1.066805 -1.252834
2 foo two -0.180407 1.686709
4 foo two 0.228522 -0.457232
6 foo one -0.553085 0.512941
7 foo three -0.346510 0.434751)]
101 / 115
Introductionto PythonPandas for
DataAnalytics
SrijithRajamohan
Introductionto Python
Pythonprogramming
NumPy
Matplotlib
Introductionto Pandas
Case study
Conclusion
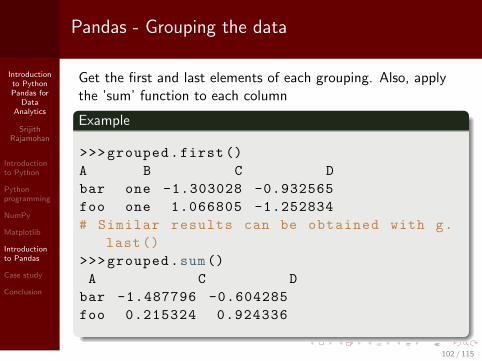
Pandas - Grouping the data
Get the first and last elements of each grouping. Also, applythe ’sum’ function to each column
Example
>>>grouped.first()
A B C D
bar one -1.303028 -0.932565
foo one 1.066805 -1.252834
# Similar results can be obtained with g.
last()
>>>grouped.sum()
A C D
bar -1.487796 -0.604285
foo 0.215324 0.924336
102 / 115
Introductionto PythonPandas for
DataAnalytics
SrijithRajamohan
Introductionto Python
Pythonprogramming
NumPy
Matplotlib
Introductionto Pandas
Case study
Conclusion
Pandas - Grouping the data
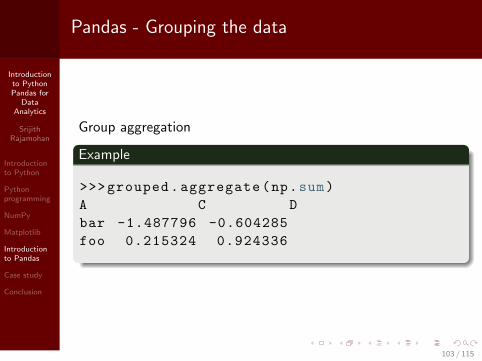
Group aggregation
Example
>>>grouped.aggregate(np.sum)
A C D
bar -1.487796 -0.604285
foo 0.215324 0.924336
103 / 115
Introductionto PythonPandas for
DataAnalytics
SrijithRajamohan
Introductionto Python
Pythonprogramming
NumPy
Matplotlib
Introductionto Pandas
Case study
Conclusion
Pandas - Grouping the data
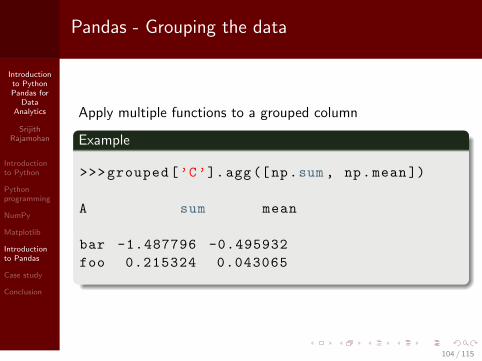
Apply multiple functions to a grouped column
Example
>>>grouped[’C’].agg([np.sum , np.mean])
A sum mean
bar -1.487796 -0.495932
foo 0.215324 0.043065
104 / 115

Introductionto PythonPandas for
DataAnalytics
SrijithRajamohan
Introductionto Python
Pythonprogramming
NumPy
Matplotlib
Introductionto Pandas
Case study
Conclusion
Pandas - Grouping the data
Visually inspecting the grouping
Example
>>>w = grouped[’C’].agg([np.sum , np.mean])
.plot()
>>>import matplotlib.pyplot as plt
>>>plt.show()
105 / 115

Introductionto PythonPandas for
DataAnalytics
SrijithRajamohan
Introductionto Python
Pythonprogramming
NumPy
Matplotlib
Introductionto Pandas
Case study
Conclusion
Pandas - Grouping the data
Apply a transformation to the grouping
Example
>>>f = lambda x: x*2
>>>transformed = grouped.transform(f)
>>>print transformed
106 / 115
Introductionto PythonPandas for
DataAnalytics
SrijithRajamohan
Introductionto Python
Pythonprogramming
NumPy
Matplotlib
Introductionto Pandas
Case study
Conclusion
Pandas - Grouping the data
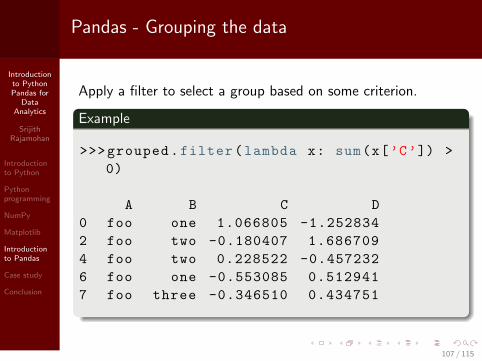
Apply a filter to select a group based on some criterion.
Example
>>>grouped.filter(lambda x: sum(x[’C’]) >
0)
A B C D
0 foo one 1.066805 -1.252834
2 foo two -0.180407 1.686709
4 foo two 0.228522 -0.457232
6 foo one -0.553085 0.512941
7 foo three -0.346510 0.434751
107 / 115

Introductionto PythonPandas for
DataAnalytics
SrijithRajamohan
Introductionto Python
Pythonprogramming
NumPy
Matplotlib
Introductionto Pandas
Case study
Conclusion
Section 6
1 Introduction to Python
2 Python programming
3 NumPy
4 Matplotlib
5 Introduction to Pandas
6 Case study
7 Conclusion
108 / 115

Introductionto PythonPandas for
DataAnalytics
SrijithRajamohan
Introductionto Python
Pythonprogramming
NumPy
Matplotlib
Introductionto Pandas
Case study
Conclusion
Cost of College
• We are going to analyze the cost of college data scorecardprovided by the federal government
• https://collegescorecard.ed.gov/data/
109 / 115

Introductionto PythonPandas for
DataAnalytics
SrijithRajamohan
Introductionto Python
Pythonprogramming
NumPy
Matplotlib
Introductionto Pandas
Case study
Conclusion
Cost of College
• Find the top 10 median 10 year debt
• Find the top 10 median earnings
• Find the top 10 schools with the best sat scores
• Find the top 10 best return of investment
• Find average median earnings per state
• Compute the correlation between the SAT scores andmedian income
110 / 115

Introductionto PythonPandas for
DataAnalytics
SrijithRajamohan
Introductionto Python
Pythonprogramming
NumPy
Matplotlib
Introductionto Pandas
Case study
Conclusion
Cost of College
Columns of interest
• UNITID
• INSTNM
• STABBR
• CITY
• GRAD DEBT MDN SUPP
• SAT AVG
111 / 115
Introductionto PythonPandas for
DataAnalytics
SrijithRajamohan
Introductionto Python
Pythonprogramming
NumPy
Matplotlib
Introductionto Pandas
Case study
Conclusion
Cost of College - Generate metrics and createinteractive visualizations using Bokeh
• Generate metrics and create interactive visualizationsusing Bokeh
• Create an interactive chloropleth visualization
• Sample given here athttp://sjster.bitbucket.org/sub2/index.html
112 / 115

Introductionto PythonPandas for
DataAnalytics
SrijithRajamohan
Introductionto Python
Pythonprogramming
NumPy
Matplotlib
Introductionto Pandas
Case study
Conclusion
Interactive Chloropleth for querying andvisualization
113 / 115
Introductionto PythonPandas for
DataAnalytics
SrijithRajamohan
Introductionto Python
Pythonprogramming
NumPy
Matplotlib
Introductionto Pandas
Case study
Conclusion
Section 7
1 Introduction to Python
2 Python programming
3 NumPy
4 Matplotlib
5 Introduction to Pandas
6 Case study
7 Conclusion
114 / 115

Introductionto PythonPandas for
DataAnalytics
SrijithRajamohan
Introductionto Python
Pythonprogramming
NumPy
Matplotlib
Introductionto Pandas
Case study
Conclusion
Questions
Thank you for attending !
115 / 115


![Pandas · 2020-05-11 · In [1]: !pip install --upgrade pandas-datareader 2 Overview Pandas is a package of fast, efficient data analysis tools for Python. Its popularity has surged](https://static.fdocuments.in/doc/165x107/5f0360687e708231d408e93c/pandas-2020-05-11-in-1-pip-install-upgrade-pandas-datareader-2-overview.jpg)