Introduction to Python A. Objectives Learn about …...2. 32 GByte MicroSD card à Give your MicroSD...
13
Department of Engineering Science Lab 3 – Introduction to Python F. Farahmand 10/26/2019 Ver. 4 1 Introduction to Python A. Objectives 1. Learn about Python and its different versions. 2. Learn about Python libraries and packages. 3. Python IDE such as Geany, Bluefish, Atom, etc. 4. Learn about how to run Linux commands from Python. 5. Learn about generating random numbers in Python. 6. Learn about NumPy and Panda in Python. 7. Learn about how to write into a file and read from a file to plot values. B. Time of Completion This laboratory activity is designed for students with some knowledge of Python and it is estimated to take about 4-7 hours to complete. C. Requirements 1. A Raspberry Pi 3 Model 3 2. 32 GByte MicroSD card à Give your MicroSD card to the lab instructor for a copy of Ubuntu. 3. USB adaptor to power up the Pi D. Pre-Lab Lean about basic Python commands. • Read the posted tutorial on Canvas. • Review File examples provided in the course web page. • This is also a great resource for beginners: https://www.codecademy.com/ . Maye sure you sign up and complete the first 14 slides. Learn about the difference between Python 2 and 3: • Here is a great source for learning Python 3: https://www.learnpython.org/ For more detailed information about Python 2.7 programming refer to the page: • Learn Python and practice: https://www.w3schools.com/python/python_conditions.asp • Another great source to learn Python: https://www.tutorialspoint.com/python/number_seed.htm • A good introduction to Python 2.7 with videos: http://www.pitt.edu/~naraehan/python2/tutorial8.html
Transcript of Introduction to Python A. Objectives Learn about …...2. 32 GByte MicroSD card à Give your MicroSD...

Department of Engineering Science
Lab 3 – Introduction to Python
F. Farahmand 10/26/2019
Ver. 4
1
Introduction to Python
A. Objectives 1. Learn about Python and its different versions. 2. Learn about Python libraries and packages. 3. Python IDE such as Geany, Bluefish, Atom, etc. 4. Learn about how to run Linux commands from Python. 5. Learn about generating random numbers in Python. 6. Learn about NumPy and Panda in Python. 7. Learn about how to write into a file and read from a file to plot values.
B. Time of Completion This laboratory activity is designed for students with some knowledge of Python and it is estimated to take about 4-7 hours to complete. C. Requirements
1. A Raspberry Pi 3 Model 3 2. 32 GByte MicroSD card à Give your MicroSD card to the lab instructor for a copy of Ubuntu. 3. USB adaptor to power up the Pi
D. Pre-Lab Lean about basic Python commands.
• Read the posted tutorial on Canvas. • Review File examples provided in the course web page. • This is also a great resource for beginners: https://www.codecademy.com/ . Maye sure you sign
up and complete the first 14 slides. Learn about the difference between Python 2 and 3:
• Here is a great source for learning Python 3: https://www.learnpython.org/ For more detailed information about Python 2.7 programming refer to the page:
• Learn Python and practice: https://www.w3schools.com/python/python_conditions.asp • Another great source to learn Python: https://www.tutorialspoint.com/python/number_seed.htm • A good introduction to Python 2.7 with videos:
http://www.pitt.edu/~naraehan/python2/tutorial8.html

Department of Engineering Science
Lab 3 – Introduction to Python
F. Farahmand 10/26/2019
Ver. 4
2
E. Lab Complete the following sections.
1. BasicPythonCommands&PythonEditorPython happens to be the most commonly used language on Raspberry Pi. In fact, Pi in RPi comes from Python. There two main version of Python: 2 and 3.
1.1. CommandBasedEditorsThere are many editors that can be utilized to edit your Python code. Some of the editors are command based: vi, nano, or vim. For example, you can use Use vi or nano: nano test.py to modify the file:
Use control x to exit, or save and exit. There are also many different graphical editors that we can use to write and execute python codes. One such editor is Geany. An alternative to Geany is Atom text editor: https://atom.io/ or Notepad.
Here is the link to a complete list of Python editors and IDEs: https://wiki.python.org/moin/IntegratedDevelopmentEnvironments .
1.2. OnlinePythonEditorCheck out the following online Python compilers:
• Python 3: https://www.jdoodle.com/python3-programming-online • Python 3: https://www.onlinegdb.com/online_python_compiler • Python 2.7: http://rextester.com/l/python_online_compiler • Interactive Python: https://trinket.io/python • Python Cloud: http://pythonfiddle.com/dfa-simple-implementation/
A very simple and useful online editor is http://pythontutor.com/live.html#mode=edit . Using this site you can use various Python versions and create a short link for your examples and share them with others. Try this example: https://goo.gl/mohx9u . A very interesting feature of this site is that you may get online assistance in case you run into some coding issues.

Department of Engineering Science
Lab 3 – Introduction to Python
F. Farahmand 10/26/2019
Ver. 4
3
1.3. PythonIDEsandEditorsTo install Geany run the following and follow the instruction in [2]: sudo apt-get install geany The manual for Geany can be found here: https://www.geany.org/manual/current/index.html . Note that all configuration setup can be found in the following file: config/geany/geany.conf. Use vi or vim: vi .config/geany/geany.conf to modify it. Once you open Geany your workspace may look something like this. Note that using the Terminal window at the bottom you can run the Python file: ./example.py. Make sure you are in the right directory. You can always write your Python code on your remote computer and later copy it on your RPi using Secure Copy (scp command)1: scp “test_file.py” [email protected]:Desktop/ Alternatively, you can logon to you remote RPi and using command line to edit and run your code. Here is a simple example:
Executing a Python file such as test.py will be as follow:
2. PracticingwithPython2.7 Copy the example files on the course web page and practice some of the commands. Here are a few examples.
1 For more information see: https://help.ubuntu.com/community/SSH/TransferFiles
Department of Engineering Science
Lab 3 – Introduction to Python
F. Farahmand 10/26/2019
Ver. 4
4
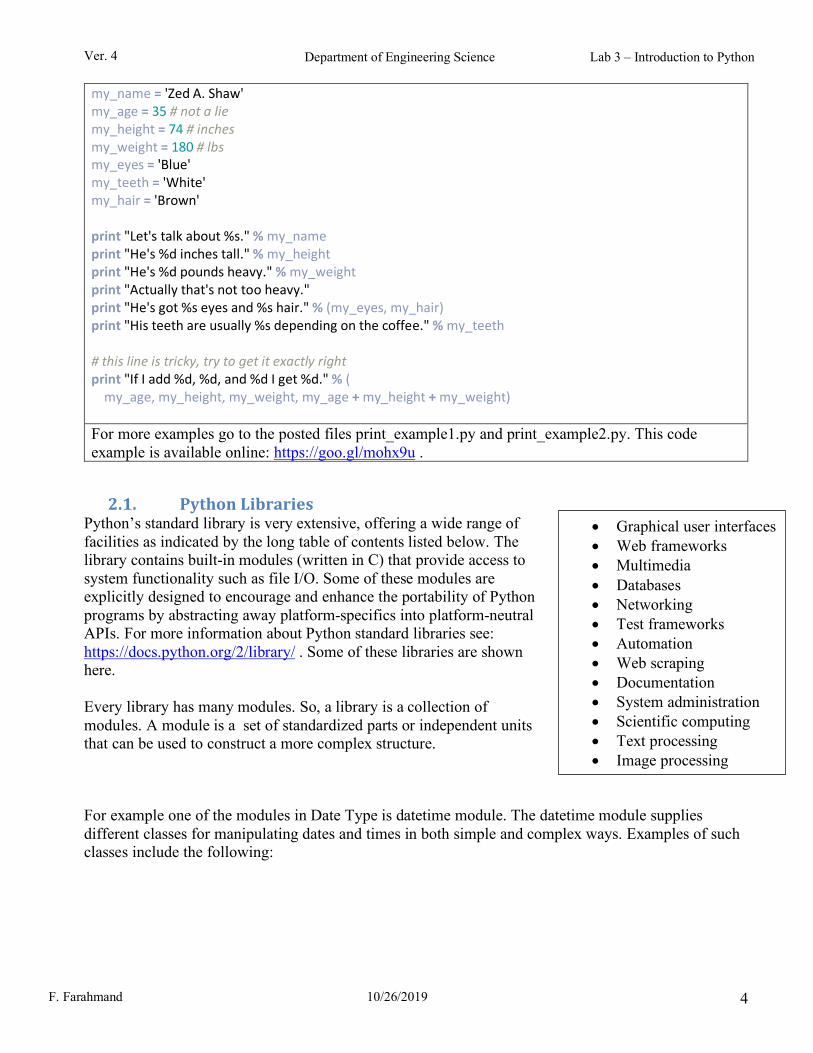
my_name = 'Zed A. Shaw' my_age = 35 # not a lie my_height = 74 # inches my_weight = 180 # lbs my_eyes = 'Blue' my_teeth = 'White' my_hair = 'Brown' print "Let's talk about %s." % my_name print "He's %d inches tall." % my_height print "He's %d pounds heavy." % my_weight print "Actually that's not too heavy." print "He's got %s eyes and %s hair." % (my_eyes, my_hair) print "His teeth are usually %s depending on the coffee." % my_teeth # this line is tricky, try to get it exactly right print "If I add %d, %d, and %d I get %d." % ( my_age, my_height, my_weight, my_age + my_height + my_weight) For more examples go to the posted files print_example1.py and print_example2.py. This code example is available online: https://goo.gl/mohx9u .
2.1. PythonLibrariesPython’s standard library is very extensive, offering a wide range of facilities as indicated by the long table of contents listed below. The library contains built-in modules (written in C) that provide access to system functionality such as file I/O. Some of these modules are explicitly designed to encourage and enhance the portability of Python programs by abstracting away platform-specifics into platform-neutral APIs. For more information about Python standard libraries see: https://docs.python.org/2/library/ . Some of these libraries are shown here. Every library has many modules. So, a library is a collection of modules. A module is a set of standardized parts or independent units that can be used to construct a more complex structure. For example one of the modules in Date Type is datetime module. The datetime module supplies different classes for manipulating dates and times in both simple and complex ways. Examples of such classes include the following:
• Graphical user interfaces • Web frameworks • Multimedia • Databases • Networking • Test frameworks • Automation • Web scraping • Documentation • System administration • Scientific computing • Text processing • Image processing

Department of Engineering Science
Lab 3 – Introduction to Python
F. Farahmand 10/26/2019
Ver. 4
5
timedelta tzinfo time date datetime
Each class or object can have many different attributes. For example, attributes of datetime can be minutes, second, etc. See the example below: from datetime import datetime # a particular class of the module is used module dt = datetime(2013, 8, 21, 2, 30, 45) # datetime class is used print(dt.hour) # an attribute of the class is used here print(dt.minute) print(dt.second) print(dt.strftime("%m-%d-%Y %H:%M:%S"))
3. CreatingaFunctionIn many cases we need to create (or define) a function. Note that the function can return multiple values and thus, sometimes we have to separate them. Here is an example. #!/usr/bin/env python # Defining the function def calculate_temperature(temp_kel): # pay attention to temp_cels = temp_kel - 32 # the following lines: must be indented temp_fahren = (temp_cels * 9 / 5) - 32 return temp_cels, temp_fahren # 2 values are generated/returned # Calling the function x = calculate_temperature(340) # The input is temp_kel = 340 print x # or print (x) --> (i,j) is printed print "separating the pair: ", x[0], 'and', x[1] # you can use " " or ' ' x,y = calculate_temperature(340) # note in this case x=temp_cels, y=temp_fahren print 'The temp. in fahrenhet is: ', y See Test3.py file for more information.
4. ReadingandWritingFrom/toaFileSee Test4.py file for examples. Here is a simple example to check and examine if a value exists in a file. if VALUE in open('FILE.txt').read(): print("true") else: print("False")

Department of Engineering Science
Lab 3 – Introduction to Python
F. Farahmand 10/26/2019
Ver. 4
6
5. RandomTopicsUsingLinuxCommandsThere are a few random topics about Python that may come handy. Here are a few things to know.
5.1. MeasuringtheTemperatureThere are many ways to measure the CPU temperature on the RPI board. For example you can do the following to get the temperature in milli-Celsius: $ cat /sys/class/thermal/thermal_zone0/temp It is also possible to measure the temperature on the RPi using the following commands: cd /opt/vc/bin LD_LIBRARY_PATH=/opt/vc/lib ./vcgencmd measure_temp One way to simplify this is to create an alias linking it to the original Linux command: alias temp="LD_LIBRARY_PATH=/opt/vc/lib && /opt/vc/bin/vcgencmd measure_temp" In the above example, once we create the alias, we just have to use temp command to get the temperature on the RPi: $temp
5.2. MeasuringtheNetworkBroadbandSpeedThe network performance can be measure using speedtest-cli. The speedtest-cli isn’t available right away from Linux, but we can install it by using a tool called pip that comes pre-installed. You can make sure that you have pip by running this command: sudo apt-get update If you see a message that reads “python-pip is already the newest version,” that means that we’re good to go. Next, let’s use pip to install speedtest-cli: sudo pip install speedtest-cli With speedtest-cli now installed, you can measure your broadband speed easily with this command: speedtest-cli Though, for our purposes, using speedtest-cli’s simple mode is more convenient: speedtest-cli --simple
5.3. MonitoringCPU,RAM,andStorageRAM works in conjunction with the central processing unit (CPU). RAM is considered to be as the temporary memory, and CPU can be thought as the brain of the computer. The CPU chip retrieves data from the RAM. The chip takes those instructions and begins to move and process data through the motherboard in the correct order to its next designated location. The RAM assists CPU in its ability to process data quickly. Each application requires a minimum amount of temporary memory to operate efficiently. Applications that require graphics need more RAM than applications without graphics. Keep in mind that having more than one application open
Department of Engineering Science
Lab 3 – Introduction to Python
F. Farahmand 10/26/2019
Ver. 4
7
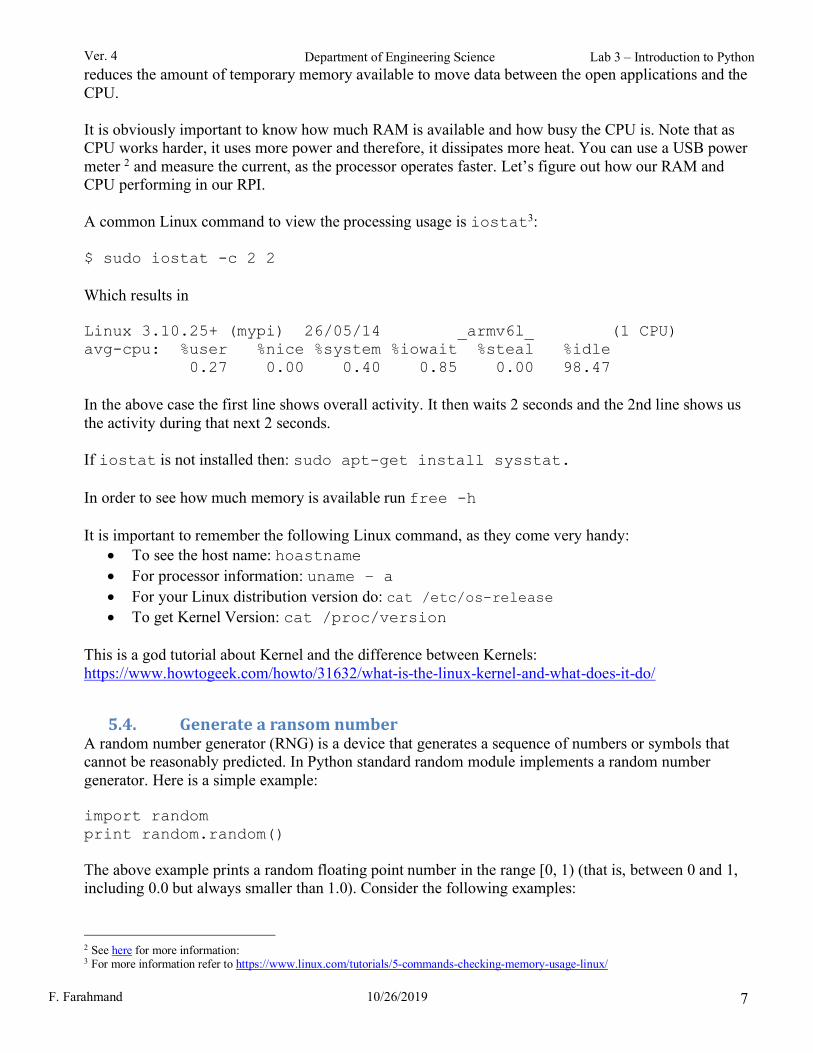
reduces the amount of temporary memory available to move data between the open applications and the CPU. It is obviously important to know how much RAM is available and how busy the CPU is. Note that as CPU works harder, it uses more power and therefore, it dissipates more heat. You can use a USB power meter 2 and measure the current, as the processor operates faster. Let’s figure out how our RAM and CPU performing in our RPI. A common Linux command to view the processing usage is iostat3: $ sudo iostat -c 2 2 Which results in Linux 3.10.25+ (mypi) 26/05/14 _armv6l_ (1 CPU) avg-cpu: %user %nice %system %iowait %steal %idle 0.27 0.00 0.40 0.85 0.00 98.47 In the above case the first line shows overall activity. It then waits 2 seconds and the 2nd line shows us the activity during that next 2 seconds. If iostat is not installed then: sudo apt-get install sysstat. In order to see how much memory is available run free -h It is important to remember the following Linux command, as they come very handy:
• To see the host name: hoastname • For processor information: uname – a • For your Linux distribution version do: cat /etc/os-release • To get Kernel Version: cat /proc/version
This is a god tutorial about Kernel and the difference between Kernels: https://www.howtogeek.com/howto/31632/what-is-the-linux-kernel-and-what-does-it-do/
5.4. GeneratearansomnumberA random number generator (RNG) is a device that generates a sequence of numbers or symbols that cannot be reasonably predicted. In Python standard random module implements a random number generator. Here is a simple example: import random print random.random()
The above example prints a random floating point number in the range [0, 1) (that is, between 0 and 1, including 0.0 but always smaller than 1.0). Consider the following examples:
2 See here for more information: 3 For more information refer to https://www.linux.com/tutorials/5-commands-checking-memory-usage-linux/

Department of Engineering Science
Lab 3 – Introduction to Python
F. Farahmand 10/26/2019
Ver. 4
8
import random for x in range(10): print random.randint(1,21)*5, print Basically, the above code will generate a random number between 1 and 20, and then multiply that number by 5. So, not only will every number printed be a multiple of 5, but the highest number that can be printed is 100 (20*5=100). Using the following online Python compiler play around with the code yourself and see if you can generate a random number between 1-100 where every number generated is a multiple of ten: https://www.tutorialspoint.com/execute_python_online.php . As you can see there are many ways to generate a random number. The random numbers rely on random seed value. The code below shows how we can change the seed value. Note that as long as the seed value is the same, the same exact random number is generated. # Random Number Generator # generate a random integer value from random import seed from random import randint seed(1) for x in range(10): value = randint(0,10) print(value) Question: What is the output for the following code? # importing random module import random random.seed(3) # print a random number between 1 and 1000. print(random.randint(1, 1000)) # if you want to get the same random number again then, random.seed(3) print(random.randint(1, 1000)) # If seed function is not used # Gives totally unpredictable response. print(random.randint(1, 1000))
5.5. ExecutingLinuxCommandsfromPythonYou can execute the command in a subshell using os.system(). This will call the Standard C function system(). This function will return the exit status of the process or command. This method is considered as old and not recommended, but presented here for historical reasons only. Here is an example: import os # invoking the os module os.system('ls -l') # using system command
You can also use os.popen class if you wish to manipulate the output without displaying it. f = os.popen("ifconfig | grep HWaddr | head -1| cut -d':' -f3-9") mac_x = f.read() print "My MAC is ", mac_x
Another approach is to use subprocess.Popen and it provides more powerful facilities for running command and retrieving their results.

Department of Engineering Science
Lab 3 – Introduction to Python
F. Farahmand 10/26/2019
Ver. 4
9
# Import the module import subprocess # Ask the user for input host = raw_input("Enter a host to ping: ") # input an argument # Set up the echo command and direct the output to a pipe p1 = subprocess.Popen(['ping', '-c 2', host], stdout=subprocess.PIPE) # Run the command output = p1.communicate()[0] print output For more information see https://www.pythonforbeginners.com/os/subprocess-for-system-administrators.
6. UsingPythontoPlotDataNote: SSH does not work for this part! You can use Remote Desktop to access your RPi
In the python world, there many options for visualizing the data. Read this article to learn about their differences: http://pbpython.com/visualization-tools-1.html . The article contains a sample of some of the more popular visualization tools and illustrates how to use them to create a simple bar chart. One of the most common ways to create data visualization (or graphs) in Python is using matplotlib library. It is very powerful but requires some learning. Here are some good examples of plots generated using matplotlib: https://matplotlib.org/examples/ Matlablib works with Numpy and pandas. Pandas is a Python package providing fast, flexible, and expressive data structures designed to make working with “relational” or “labeled” data both easy and intuitive. It aims to be the fundamental high-level building block for doing practical, real world data analysis in Python. NumPy is a library for the Python programming language, adding support for large, multi-dimensional arrays and matrices, along with a large collection of high-level mathematical functions to operate on these arrays. In order to Install numpy, and matplotlib for Python 2 4: $ sudo apt-get install python-numpy $ sudo apt-get install python-matplotlib $ sudo apt-get install python-pandas $ sudo apt-get install python-pip You can check the version of each of the packages using apt list command: $ apt list python-numpy $ apt list python-matplotlib To make sure a package is installed, type python and in the prompt type import <package_name>:
4 For more information see: http://helloraspberrypi.blogspot.com/2015/03/install-numpy-matplotlib-and-drawnow.html

Department of Engineering Science
Lab 3 – Introduction to Python
F. Farahmand 10/26/2019
Ver. 4
10
ssuee@ssuee-desktop:~/Desktop$ python Python 2.7.12 (default, Dec 4 2017, 14:50:18) [GCC 5.4.0 20160609] on linux2 Type "help", "copyright", "credits" or "license" for more information. >>> import pandas >>> exit Use exit() or Ctrl-D (i.e. EOF) to exit >>> Now, let’s try a few examples: #!/usr/bin/env python from matplotlib import pyplot as plt import numpy as np # Grid of 1 spacing from 2000 to 2004 years = np.arange(2000, 2004, 1) gdpy = [12.0, 13.2, 54.1, 65.3] plt.plot(years, gdpy, color='green', marker='o', linestyle='solid') plt.title("Nominal GDP") plt.ylabel('Billion $') plt.xlabel('Year') plt.xticks(np.arange(min(years), max(years)+1, 1.0)) plt.grid() plt.show() # you can use the following to save the file: # plt.savefig('myfirst_plot_ever.png')
#!/usr/bin/env python import numpy as np import pandas as pd from matplotlib import pyplot as plt # create 1000 data points and then each for a day starting with January 1st 2000 ts = pd.Series(np.random.randn(1000), index=pd.date_range('1/1/2000', periods=1000)) ts = ts.cumsum() plt.figure(); ts.plot(style='k', label='Series'); plt.legend() plt.show()
Here is an example of how to read a file and plotting the data:

Department of Engineering Science
Lab 3 – Introduction to Python
F. Farahmand 10/26/2019
Ver. 4
11
#!/usr/bin/env python import numpy as np import pandas as pd from matplotlib import pyplot as plt # Plot from a file # Method 1: x = [] y = [] # empty list # result2.txt File content is shown below: with open('result2.txt', 'r') as csvfile: plots = csv.reader(csvfile, delimiter=',') for row in plots: x.append(int(row[0])) # can change depending on the criteria y.append(int(row[4])) plt.plot(x,y, label='Plot CSV file') plt.xlabel ('x') plt.ylabel ('y') plt.title ('My First Plot') plt.legend() plt.show()
#!/usr/bin/env python import numpy as np import pandas as pd from matplotlib import pyplot as plt # Method 2: Using Numpy – result2.txt File content is shown here: a1,a2,a3,a4,a5 = np.loadtxt('result2.txt', delimiter=',', unpack= True) plt.plot(a1,a5, label='Plot CSV file') plt.xlabel ('x') plt.ylabel ('y') plt.title ('My First Plot') plt.legend() plt.show()
1, 10, 32, 43, 457 2, 12, 32, 43, 454 3, 12, 32, 43, 451 4, 12, 32, 43, 401 5, 12, 32, 43, 405 6, 12, 32, 43, 413
It is possible to plot multiple column graphs and bar graphs as you can imagine 5.
7. PuttingitTogetherThe following code can be used to detect which of the IP addresses on the LAN is active. Explore and understand why we are using -n and -W options for ping. Note that os.devnull is simply used to hide out the output of the ping function; it basically act similar to running a command is the background and making sure no response is displayed. import subprocess import os with open(os.devnull, "wb") as limbo: for n in xrange(1, 10): ip="192.168.0.{0}".format(n) result=subprocess.Popen(["ping", "-c", "1", "-n", "-W", "2", ip], stdout=limbo, stderr=limbo).wait() if result: print ip, "inactive" else: print ip, "active"
5 Here a good reference for multiple column plots: https://stackoverflow.com/questions/14270391/python-matplotlib-multiple-bars

Department of Engineering Science
Lab 3 – Introduction to Python
F. Farahmand 10/26/2019
Ver. 4
12
8. ProgrammingExercises Part 1: Using Bottle web frame create a web page on your pi. Your page must be accessible from another computer. Use the correct URL. Answer the following questions:
1. In this case how can you tell the IP address of the client? If so, how? 2. Can you tell the number of times different clients access your web page? If so, how? 3. Can you tell the exact time the clients are accessing your web page? If so, how?
Part 2: Write a Shell Script code that reads the number of TCP segments received and sent out every 5 seconds and save the result in a file called tcp_segments.txt. You can do netstat to gather this information. Each line must start with an index number starting with 1, as shown in the example below. Then use a Python code to plot the both received and sent TCP packets. Note that using curl command, you can force the TCP received segment to increase more (e.g., curl cnn.com) . You must have your name printed on the graph. Submit your codes and a snapshot of your graph. OPTIONAL: Note that your graph can be more meaningful if it only shows the number of transmitted and received TCP within the elapsed time (e.g., 5 seconds) rather than the total. This will be a great way to monitor the traffic and Internet usage. 1,11811,7486 2,11812,7487 3,11814,7488 4,11846,7509 5,11850,7510 6,11852,7511 7,11855,7512
Example of tcp_segments.txt file. Example of graph with multiple columns. Part 3 (Extra Credit): Write a code that checks every device on your LAN and identifies the total number of active IP addresses on the LAN. Assume you have created a file and it contains the MAC addresses of all recognized devices. If a device on the LAN has a MAC address that is NOT in the file, then your code should recognize it as an unregistered device. When you run your code it should generate an output EXACTLY like below. Take a snap shot of your response. Make sure it has your name on the snapshot. You MUST show the snapshot. ************************ ** FARID FARAHMAND ** ************************ There are (6) number of devices on your LAN There are (2) unregistered devices on your LAN: *** MAC Address b8:e9:37:8e:22:48 *** MAC Address b8:FE:37:8e:22:48 End of the report.

Department of Engineering Science
Lab 3 – Introduction to Python
F. Farahmand 10/26/2019
Ver. 4
13
Get ready for the quiz:
1- Make sure you understand the exercises here. 2- Make sure you have completed reviewing the test files. 3- Make sure you understand the Linux commands we discussed. 4- Make sure you understand how we generate random numbers in Python. 5- Review this: https://www.geeksforgeeks.org/python-multiple-choice-questions/ 6- Review these questions: https://www.sanfoundry.com/python-mcqs-strings-1/
F. Credits Special thanks to online resources and all SSU students who assisted putting together this lab. G. References
1- Raspberry Pi Cookbook by Simon - http://www.raspberrypicookbook.com/raspberry-pi-cookbook-ed2/ - Chapter 5
2- Install Geany: https://www.youtube.com/watch?v=jyOW9MbM4Uw 3- Python for Data Analysis by Wes McKinney – Appendix A 4- Great web page to lean many topics using Python: https://www.geeksforgeeks.org/display-
hostname-ip-address-python/ - examples are based on Python 3.