Introduction to Powerpoint Brad Jordan Bucknell Geology.
37
Introduction to Introduction to Powerpoint Powerpoint Bucknell Geology Bucknell Geology Brad Jordan Brad Jordan Bucknell Geology Bucknell Geology
-
Upload
wade-bobbitt -
Category
Documents
-
view
215 -
download
0
Transcript of Introduction to Powerpoint Brad Jordan Bucknell Geology.
Introduction to Introduction to PowerpointPowerpoint
Bucknell GeologyBucknell Geology
Brad JordanBrad JordanBucknell GeologyBucknell Geology
• Nothing FancyNothing Fancy
• Let your Let your sciencescience make the impressionmake the impression
What am I here to tell you?
Introduction to PowerPoint
Key Elements in Preparing and Presenting a Talk*
Introduction to PowerPoint * from GSA Today, 2/01
• Introduce, Inform, ConcludeIntroduce, Inform, Conclude
• Keep it simpleKeep it simple
• Talk to meTalk to me
• Body language mattersBody language matters
• Watch the clockWatch the clock
Introduce, Inform, Conclude
1. Tell them what you are going to tell them1. Tell them what you are going to tell them
2. Tell them2. Tell them
3. Tell them what you told them3. Tell them what you told them
Introduction to PowerPoint
Introduction to PowerPoint
Keep it simple
• Two to four key pointsTwo to four key points
• People cannot mentally organize more than thatPeople cannot mentally organize more than that
Introduction to PowerPoint
Talk to MeTalk to Me
• Use appropriate languageUse appropriate language
• Use short wordsUse short words
• Avoid jargon, even when talking to peersAvoid jargon, even when talking to peers
Introduction to PowerPoint
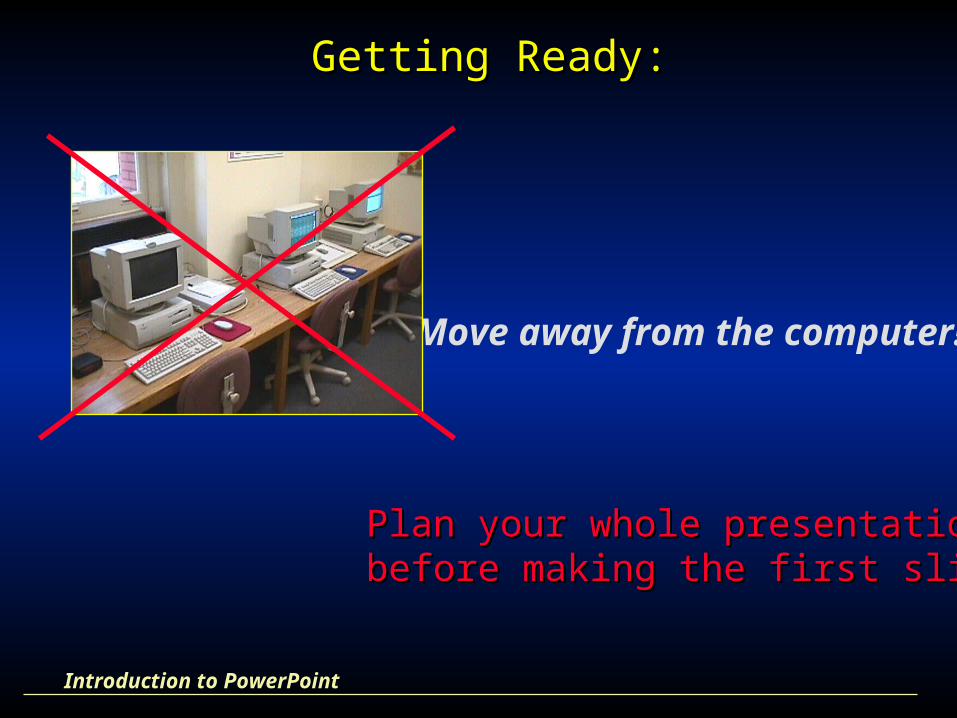
Getting Ready:Getting Ready:
Move away from the computer!
Plan your whole presentationPlan your whole presentationbefore making the first slidebefore making the first slide
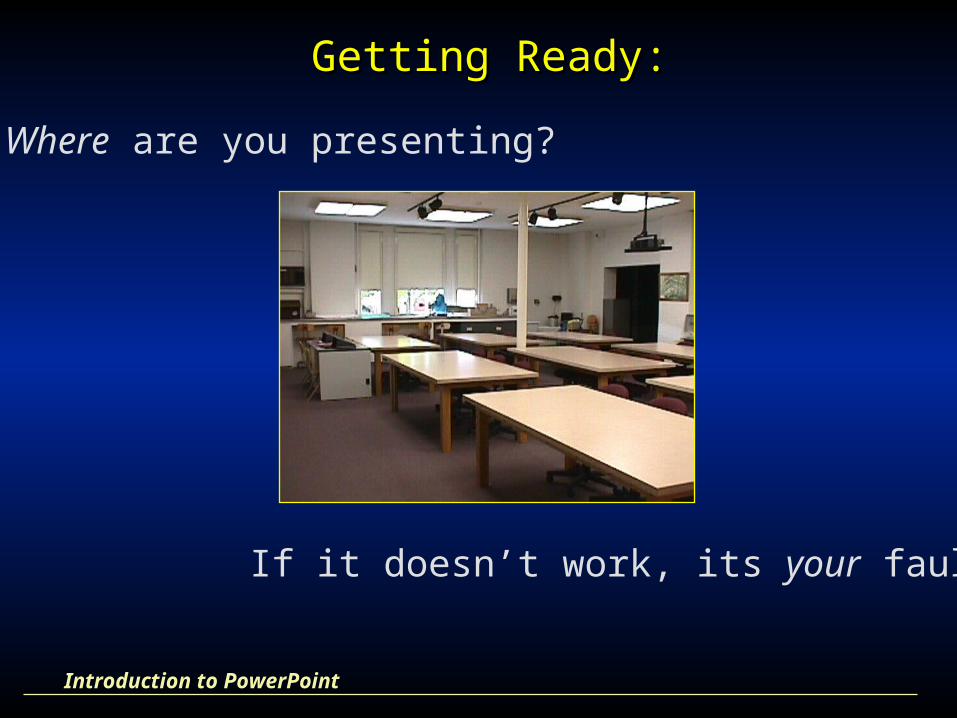
Where are you presenting?
If it doesn’t work, its your fault!
Introduction to PowerPoint
Getting Ready:Getting Ready:
Introduction to PowerPoint
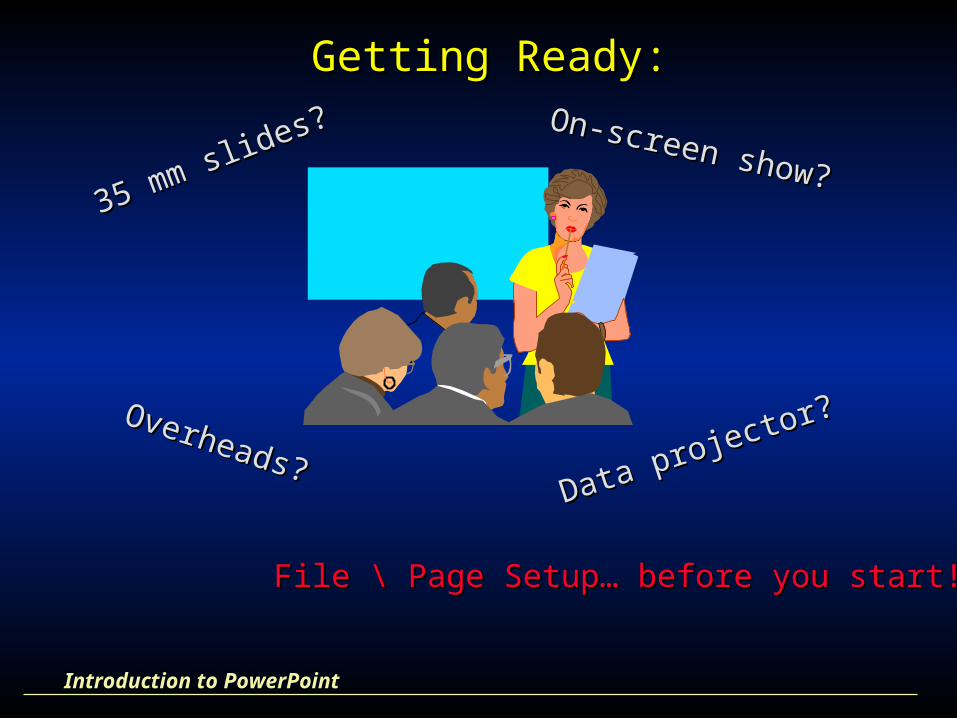
35 mm slides?
35 mm slides? On-screen show?
On-screen show?
Overheads?Overheads?
Data projector?
Data projector?
File \ Page Setup… before you start!File \ Page Setup… before you start!
Getting Ready:Getting Ready:
Plan AheadPlan Ahead
• Plan your whole presentation before Plan your whole presentation before making the first slidemaking the first slide
• Use a consistent style Use a consistent style (colors, font, graph type, etc.)(colors, font, graph type, etc.)
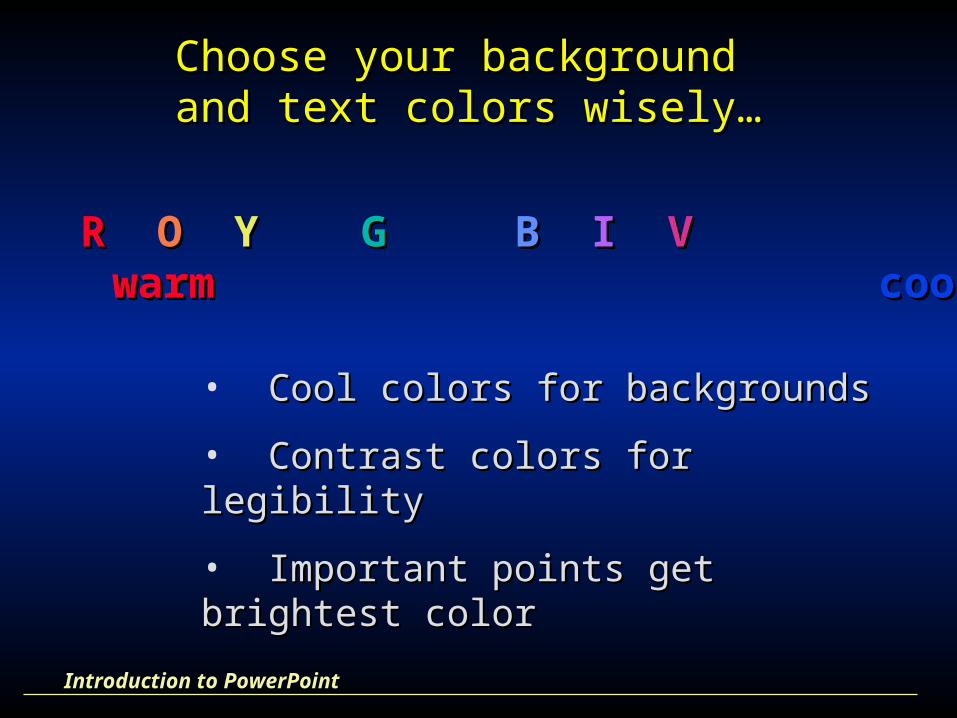
Choose your background Choose your background and text colors wisely…and text colors wisely…
RR OO YY GG BB II VV warmwarm coolcool
• Cool colors for backgroundsCool colors for backgrounds
• Contrast colors for legibilityContrast colors for legibility
• Important points get brightest colorImportant points get brightest color
Introduction to PowerPoint
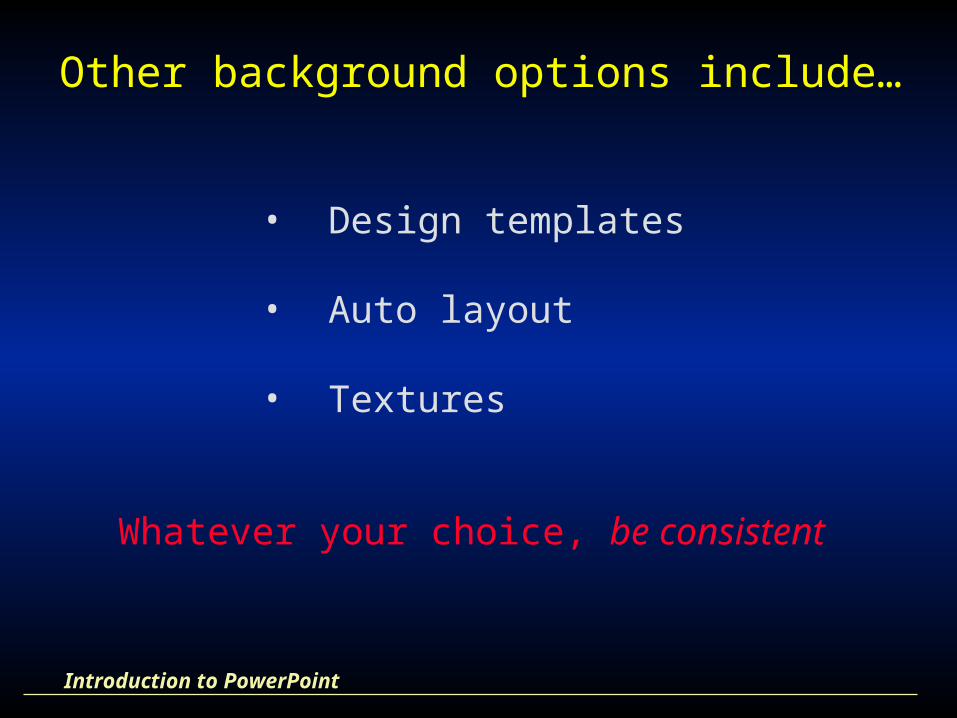
Other background options include…
• Design templates
• Auto layout
• Textures
Whatever your choice, be consistent
Introduction to PowerPoint
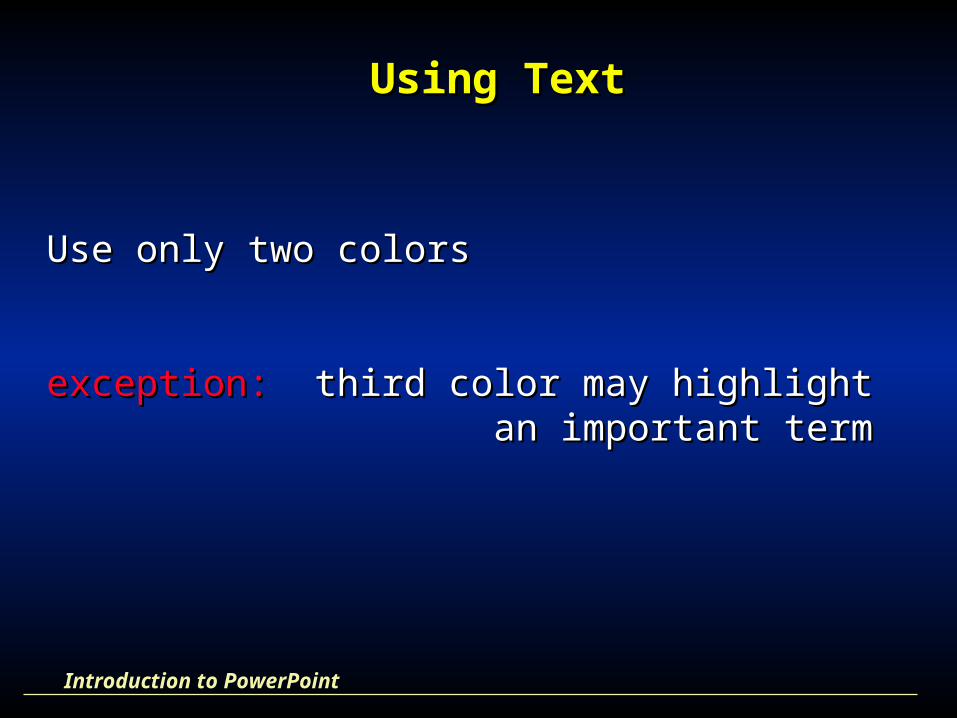
Using TextUsing Text
Use only two colorsUse only two colors
exception:exception: third color may highlight third color may highlight an important terman important term
Introduction to PowerPoint
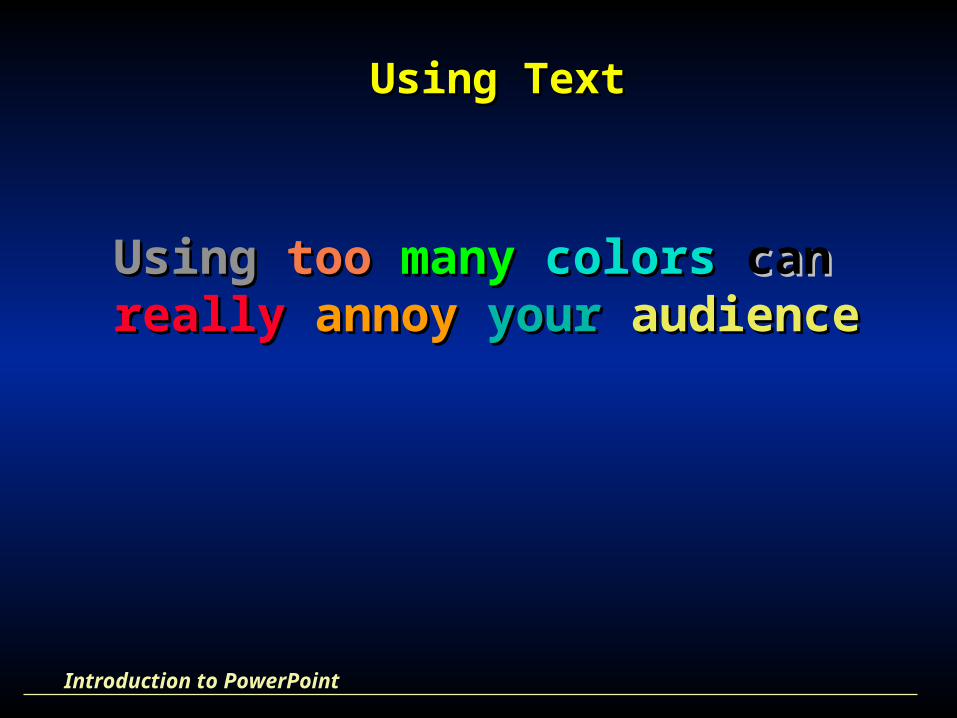
UsingUsing tootoo manymany colorscolors cancanreallyreally annoyannoy youryour audienceaudience
Using TextUsing Text
Introduction to PowerPoint
TextText
The main rule about text slides is to keepThe main rule about text slides is to keepthem short. Too much text can bore the them short. Too much text can bore the audience. Images are more motivating audience. Images are more motivating and persuasive. When you project a textand persuasive. When you project a textslide during a presentation, the audience slide during a presentation, the audience will not hear what you say while they will not hear what you say while they read the text.read the text.
TextText
Limit each slide to one topic:Limit each slide to one topic:
- Maximum 6 lines- Maximum 6 lines
- 3 - 6 words each line- 3 - 6 words each line
- Think "highway billboards"- Think "highway billboards"
TextText
• • Keep it shortKeep it short
• • Use imagesUse images
keep the audience focused on keep the audience focused on youyou
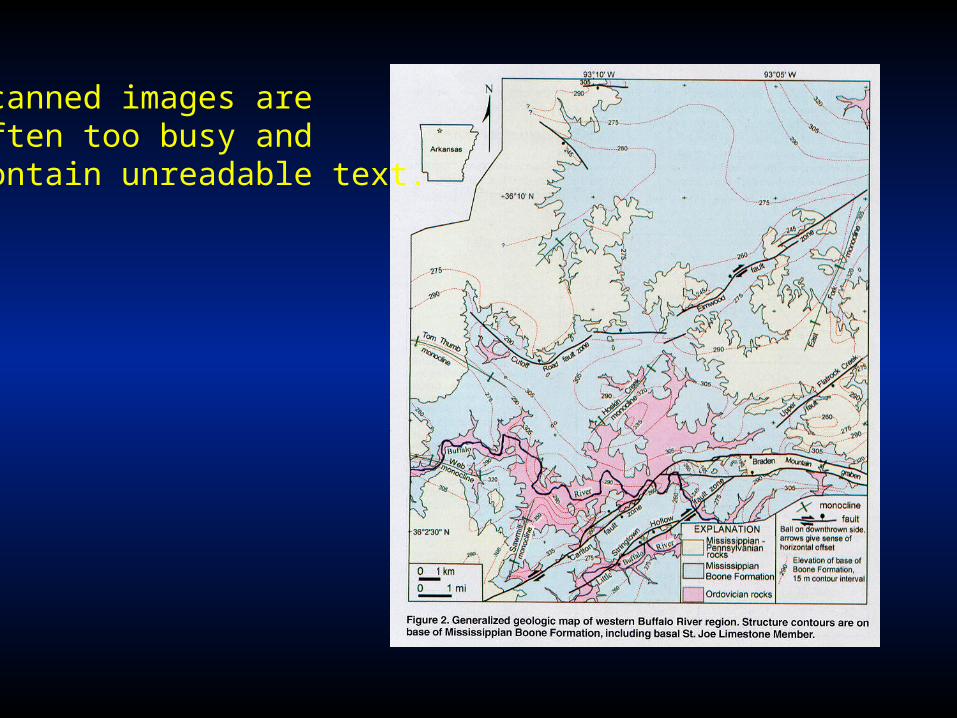
Scanned images areoften too busy and contain unreadable text.
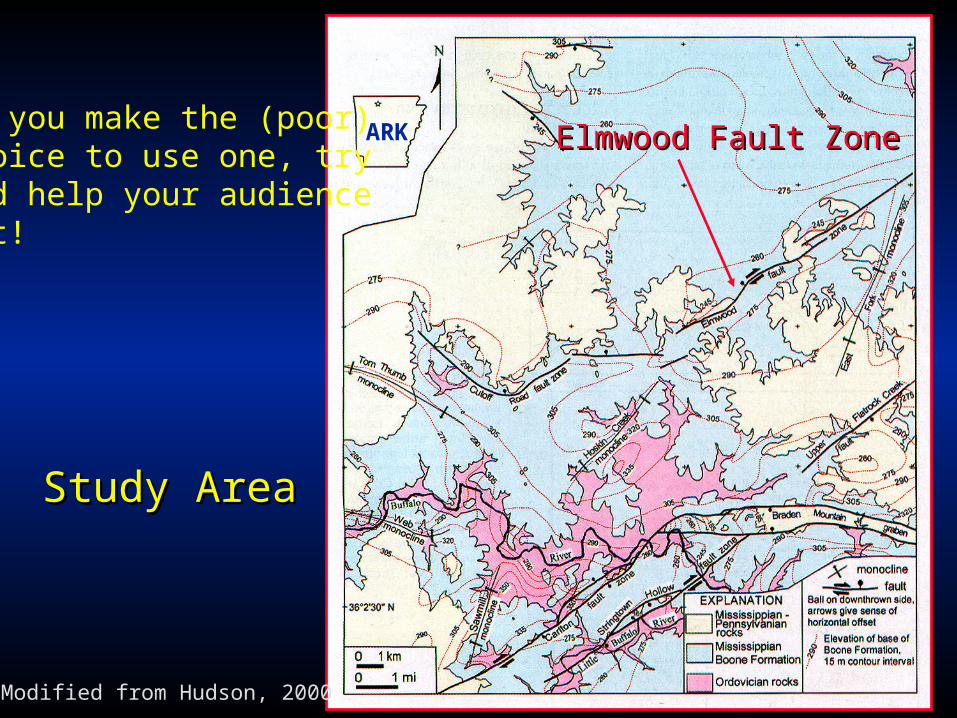
Study AreaStudy Area
Elmwood Fault ZoneElmwood Fault ZoneARK
Modified from Hudson, 2000
If you make the (poor)choice to use one, tryand help your audienceout!
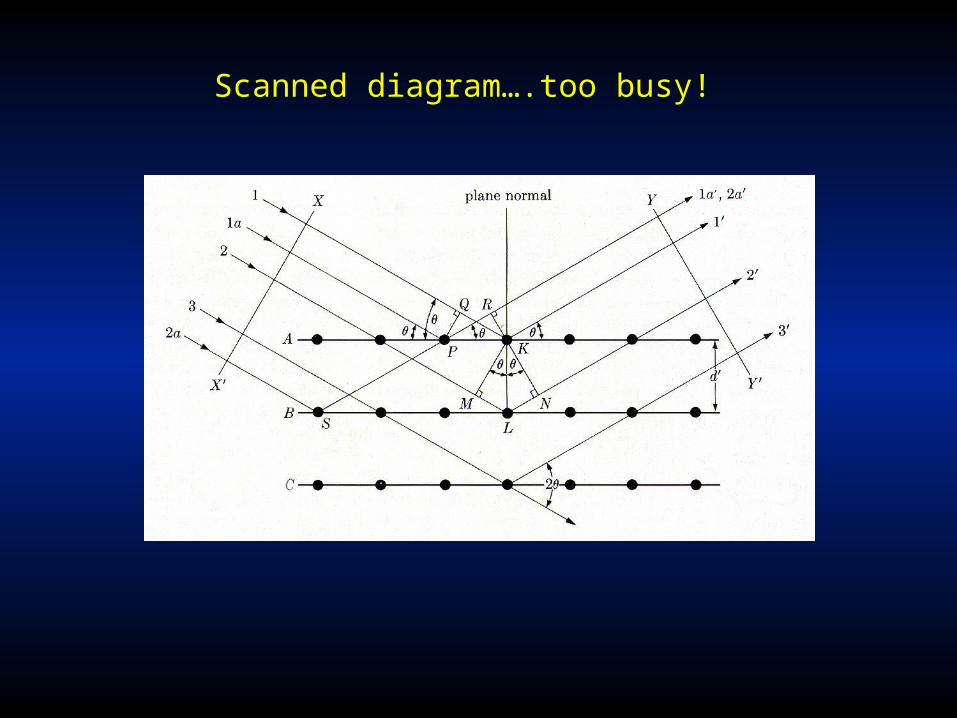
Scanned diagram….too busy!
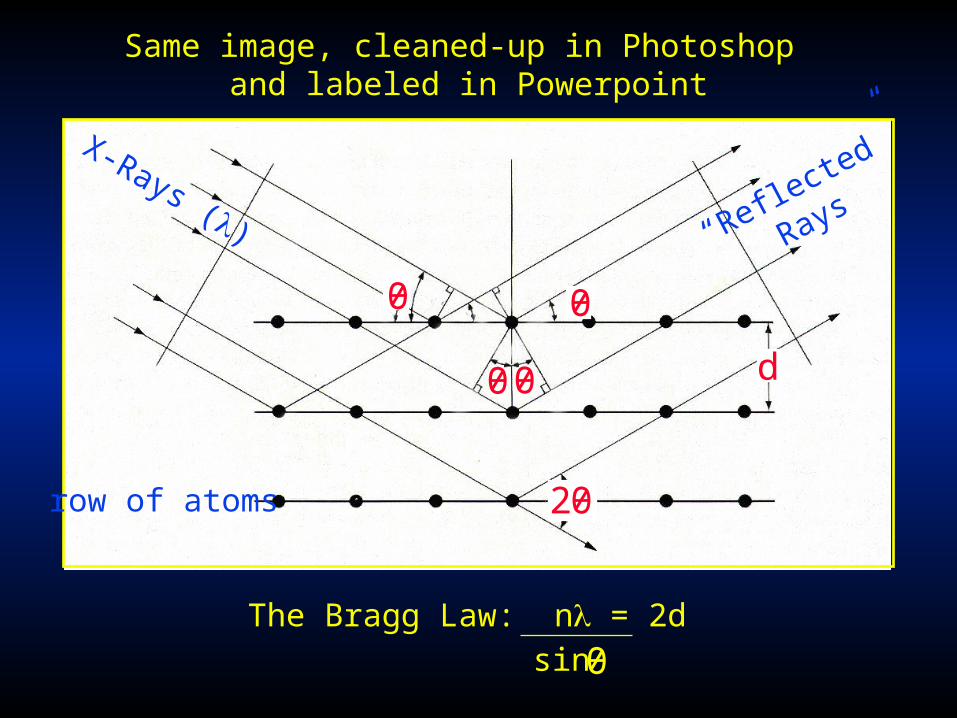
The Bragg Law: n = 2d
sin 0
00
20
0 0
d
X-Rays () “Reflected”
Rays
row of atoms
Same image, cleaned-up in Photoshop and labeled in Powerpoint
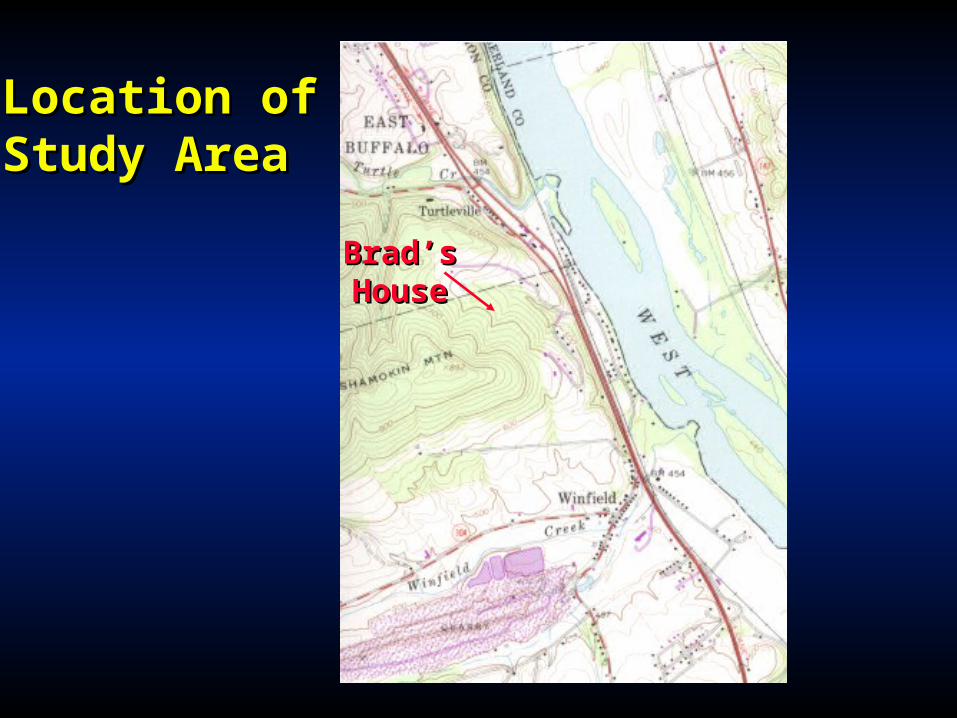
Location of Location of Study AreaStudy Area
Brad’sBrad’sHouseHouse
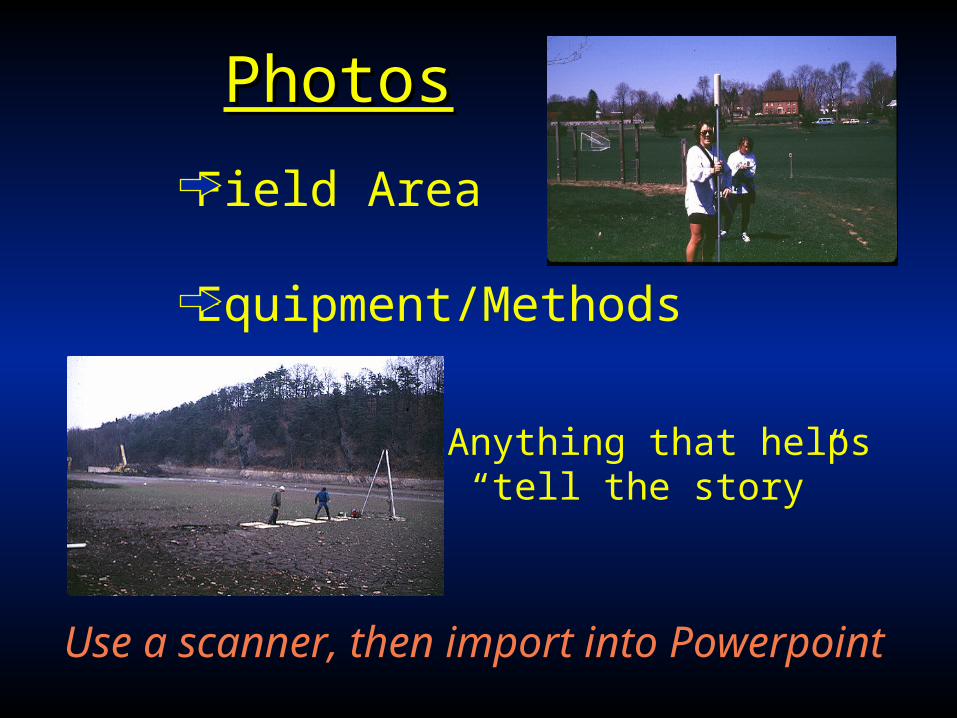
PhotosPhotos
Field Area
Equipment/Methods
Use a scanner, then import into Powerpoint
Anything that helps “tell the story”
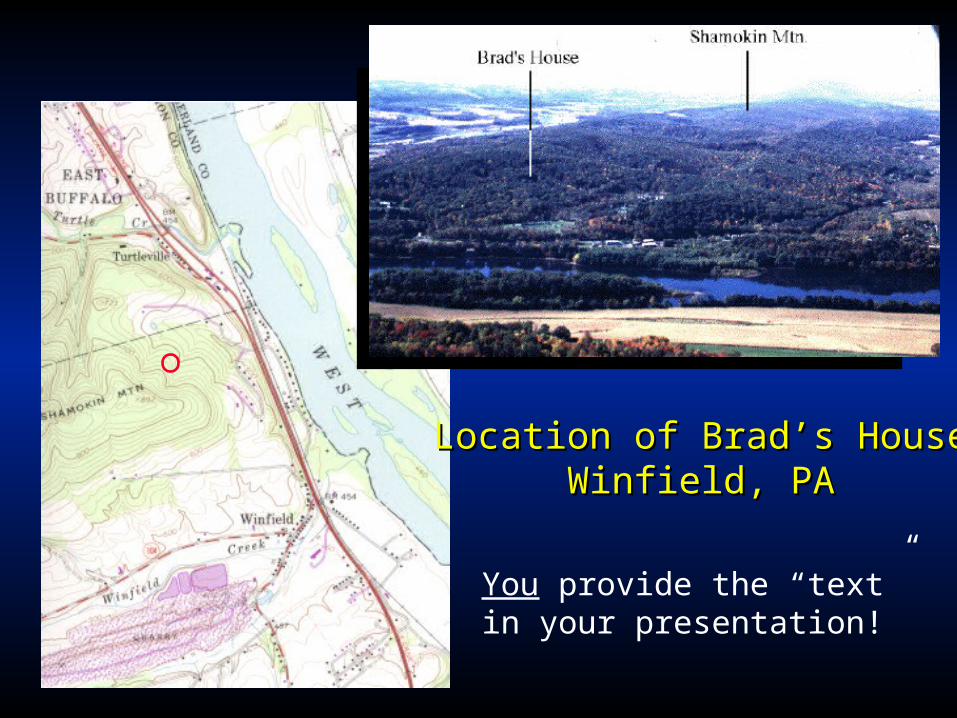
Location of Brad’s HouseLocation of Brad’s HouseWinfield, PAWinfield, PA
You provide the “text” in your presentation!
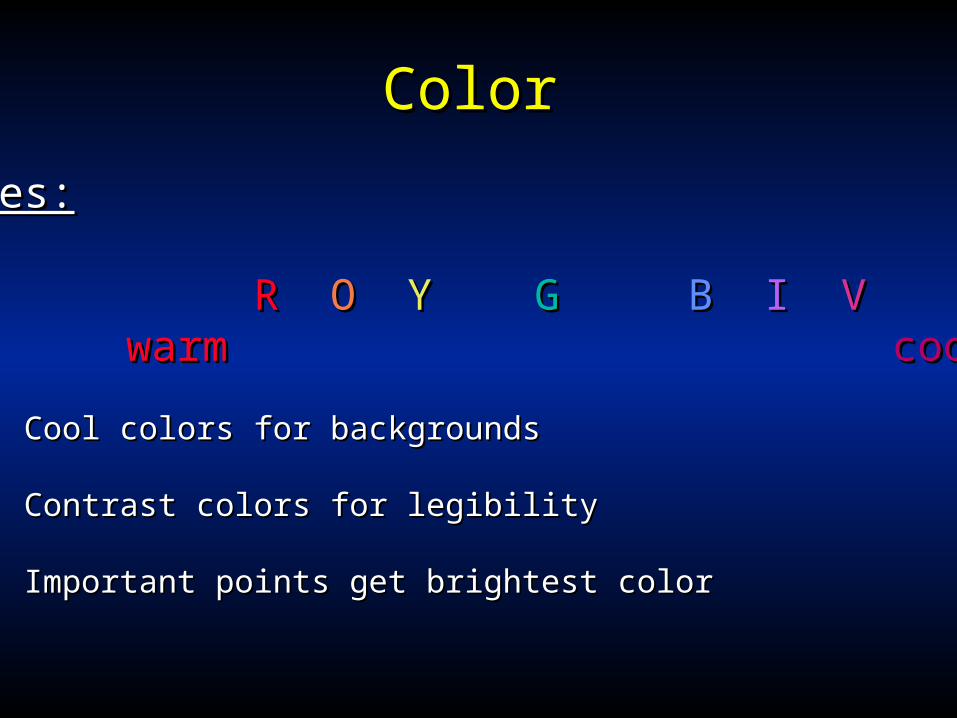
ColorColor
Choices:Choices:
RR OO YY GG BB II VV warmwarm coolcool
• Cool colors for backgroundsCool colors for backgrounds
• Contrast colors for legibilityContrast colors for legibility
• Important points get brightest colorImportant points get brightest color
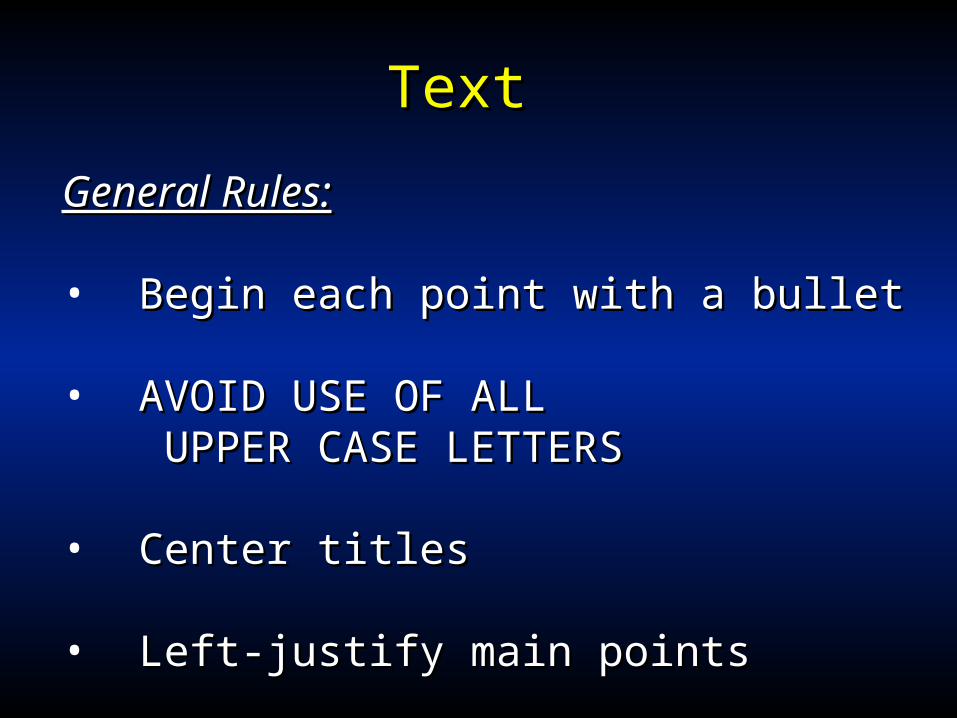
TextText
General Rules:General Rules:
• Begin each point with a bulletBegin each point with a bullet
• AVOID USE OF ALL AVOID USE OF ALL UPPER CASE LETTERSUPPER CASE LETTERS
• Center titlesCenter titles
• Left-justify main pointsLeft-justify main points
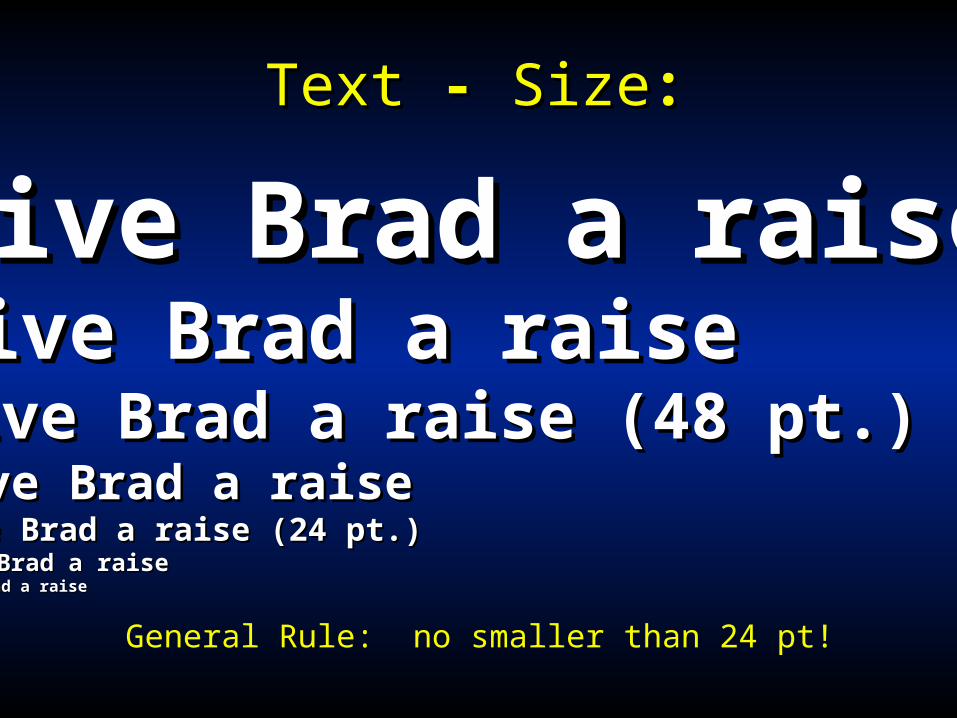
TextText - - SizeSize::
Give Brad a raiseGive Brad a raiseGive Brad a raiseGive Brad a raiseGive Brad a raise (48 pt.)Give Brad a raise (48 pt.)Give Brad a raiseGive Brad a raiseGive Brad a raise (24 pt.)Give Brad a raise (24 pt.)Give Brad a raiseGive Brad a raiseGive Brad a raiseGive Brad a raise
General Rule: no smaller than 24 pt!
GraphicsGraphics
• Keep it simpleKeep it simple
• Get main ideas absorbed quicklyGet main ideas absorbed quickly
• No tables!No tables!
• Illustrate one point at a timeIllustrate one point at a time
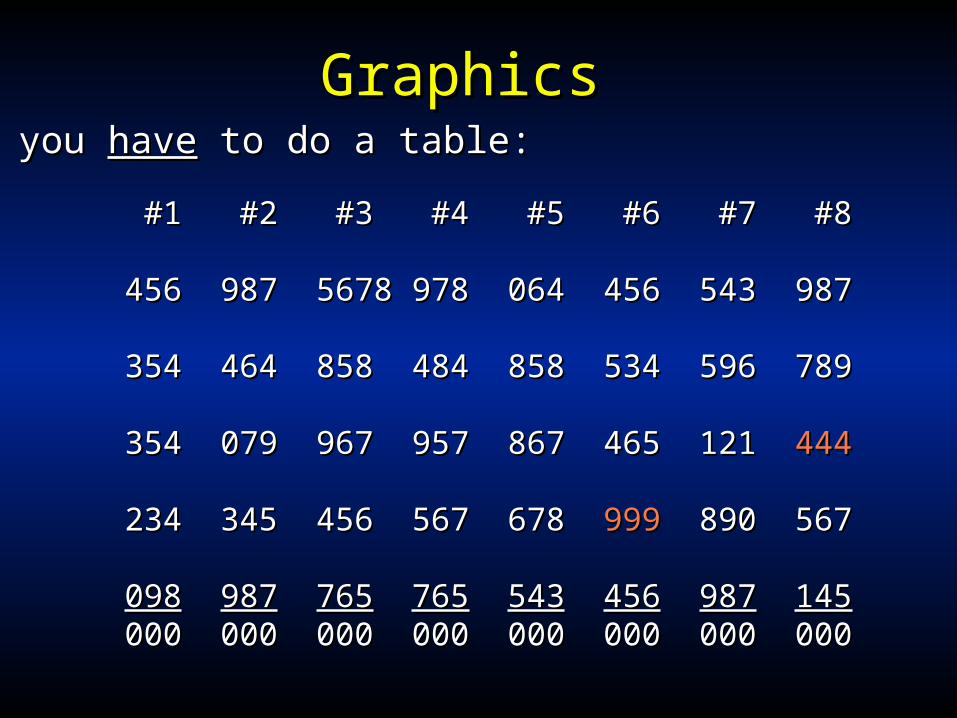
GraphicsGraphicsIf you If you havehave to do a table: to do a table:
#1#1 #2 #2 #3 #3 #4 #4 #5 #5 #6 #6 #7 #7 #8 #8
456456 987987 56785678 978978 064064 456456 543543 987987
354354 464464 858858 484484 858858 534534 596596 789789
354354 079079 967967 957957 867867 465465 121121 444444
234234 345345 456456 567567 678678 999999 890890 567567
098098 987987 765765 765765 543543 456456 987987 145145000000 000000 000000 000000 000000 000000 000000 000000
GraphicsGraphics
Colors:Colors:
• Limit of 5 colorsLimit of 5 colors
• Important points brightImportant points bright
• Ticks, axes, grids - dull colorTicks, axes, grids - dull color
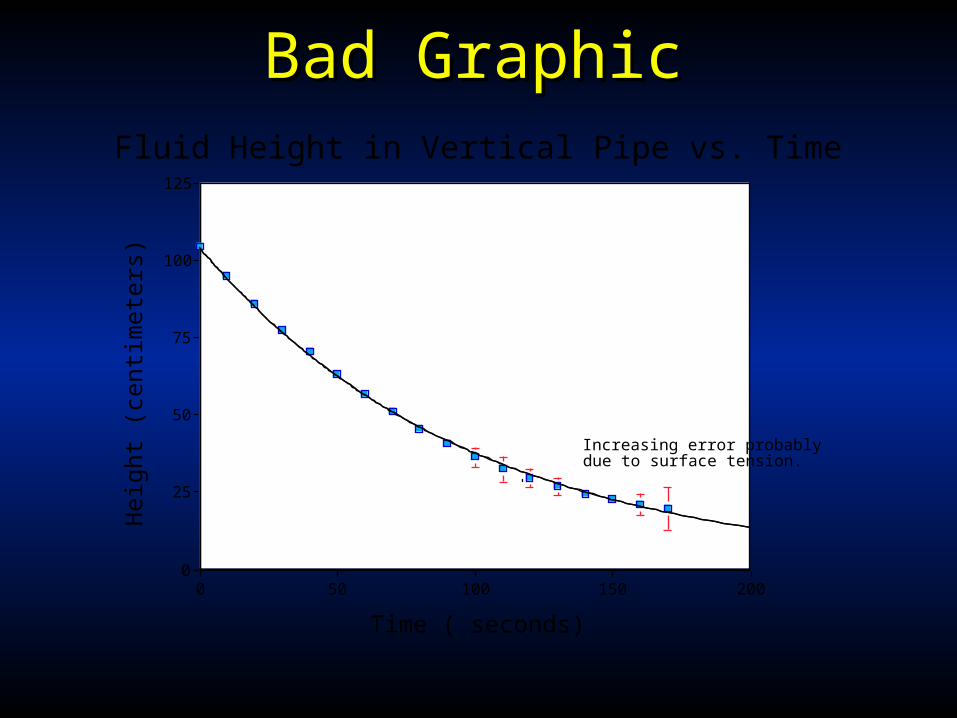
0
25
50
75
100
125
Time ( seconds)
0 50 100 150 200
Hei
ght (
cent
imet
ers)
Fluid Height in Vertical Pipe vs. Time
Increasing error probablydue to surface tension.
Bad GraphicBad Graphic
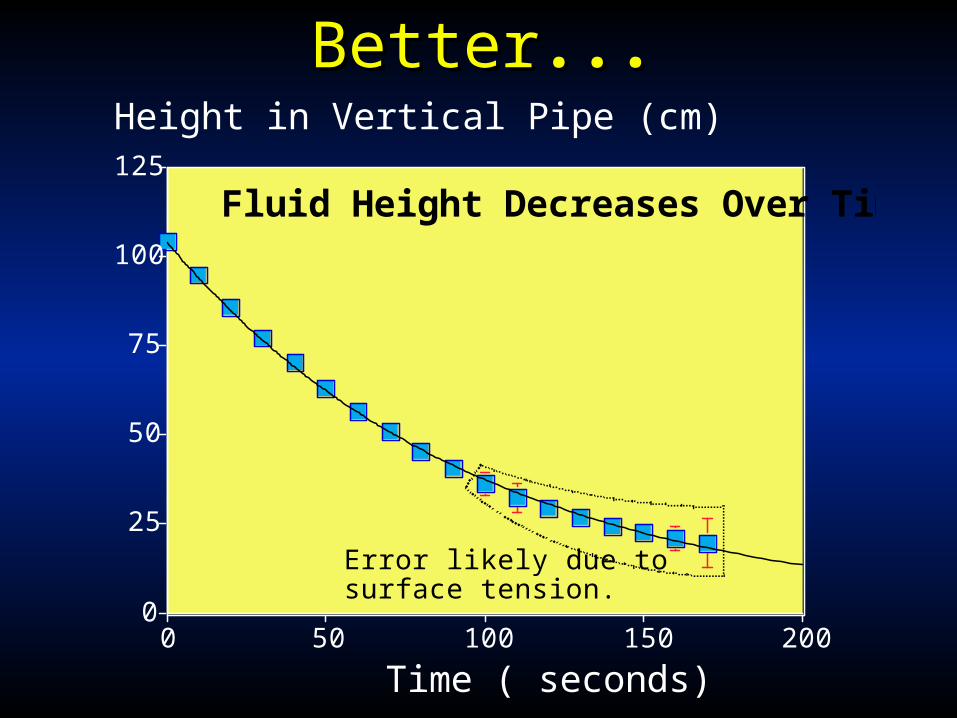
0
25
50
75
100
125
Time ( seconds)0 50 100 150 200
Height in Vertical Pipe (cm)
Fluid Height Decreases Over Time
Error likely due tosurface tension.
BetterBetter......
Maps and IllustrationsMaps and Illustrations
• Simple, simple, simpleSimple, simple, simple
• Text and Labels to a minimum Text and Labels to a minimum YouYou explain it explain it
.
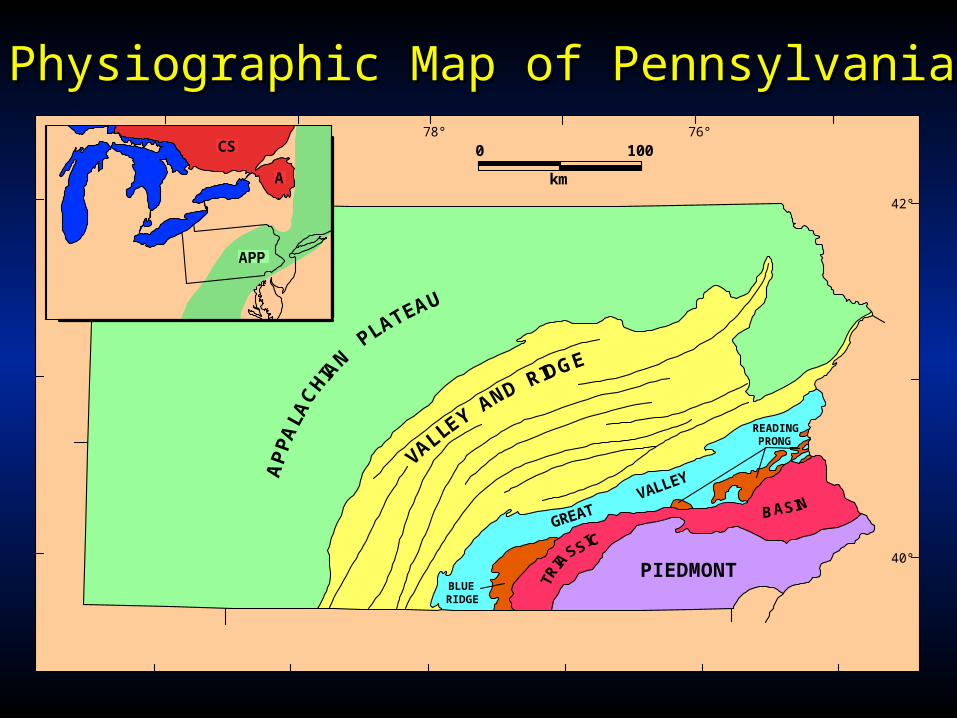
0 100
km
B A
PIEDMONTBLUERIDGE
READINGPRONG
CS
A
APP
76°78°
42°
40°
Physiographic Map of PennsylvaniaPhysiographic Map of Pennsylvania
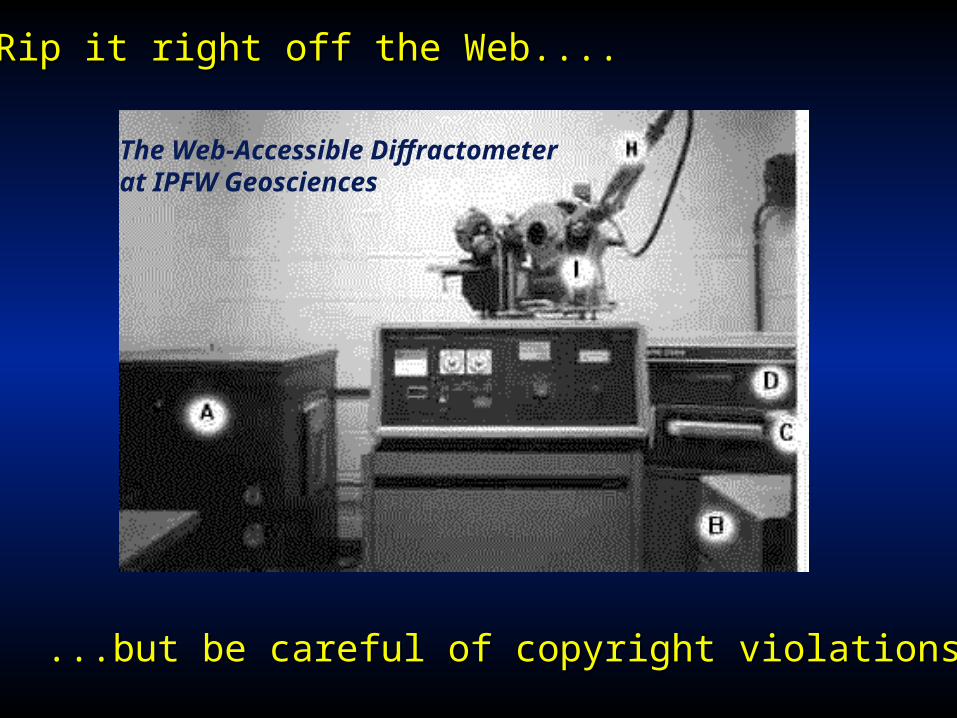
Rip it right off the Web....Rip it right off the Web....
...but be careful of copyright violations!...but be careful of copyright violations!
The Web-Accessible Diffractometerat IPFW Geosciences
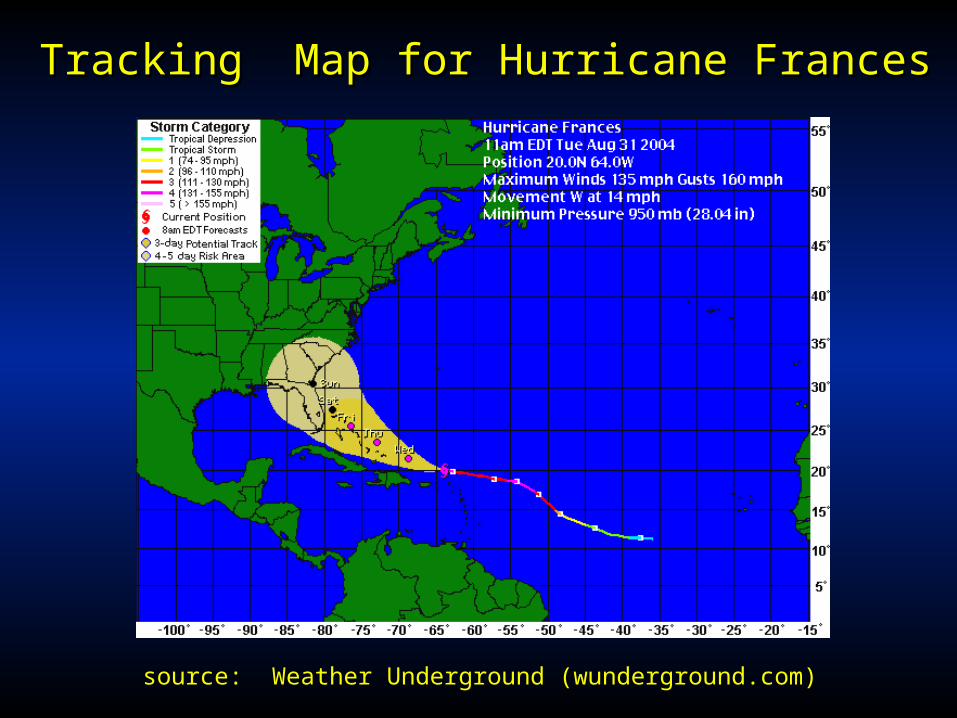
Tracking Map for Hurricane FrancesTracking Map for Hurricane Frances
source: Weather Underground (wunderground.com)