Introduction to Plunger Lift - Shale Tec,...
51
Appalachian Basin Gas Well Deliquification Seminar Marietta College Marietta, Ohio June 4 – 6, 2012 Plunger Lift Optimize and Troubleshoot David Cosby, P.E. Ferguson Beauregard
Transcript of Introduction to Plunger Lift - Shale Tec,...

Appalachian Basin
Gas Well Deliquification Seminar
Marietta College
Marietta, Ohio
June 4 – 6, 2012
Plunger Lift
Optimize and Troubleshoot
David Cosby, P.E.
Ferguson Beauregard

2 June 4 – 6, 2012
Appalachian Basin Gas Well Deliquification Seminar
Marietta, Ohio
Optimized ?
Optimize a single well
Optimize many wells
CONTENTS
PRIMARY PURPOSE Remove liquid from the tubing so gas can
flow freely to the surface

3
GOAL
OPTIMIZED
70 % or more of AOF
On original decline curve
June 4 – 6, 2012 Appalachian Basin Gas Well Deliquification Seminar
Marietta, Ohio

4
0
50
100
150
200
250
0
200
400
600
800
1000
1200
16-J
an-0
9
16-F
eb-0
9
16-M
ar-0
9
16-A
pr-0
9
16-M
ay-0
9
16-J
un-0
9
16-J
ul-0
9
16-A
ug-0
9
16-S
ep-0
9
16-O
ct-0
9
16-N
ov-0
9
16-D
ec-0
9
16-J
an-1
0
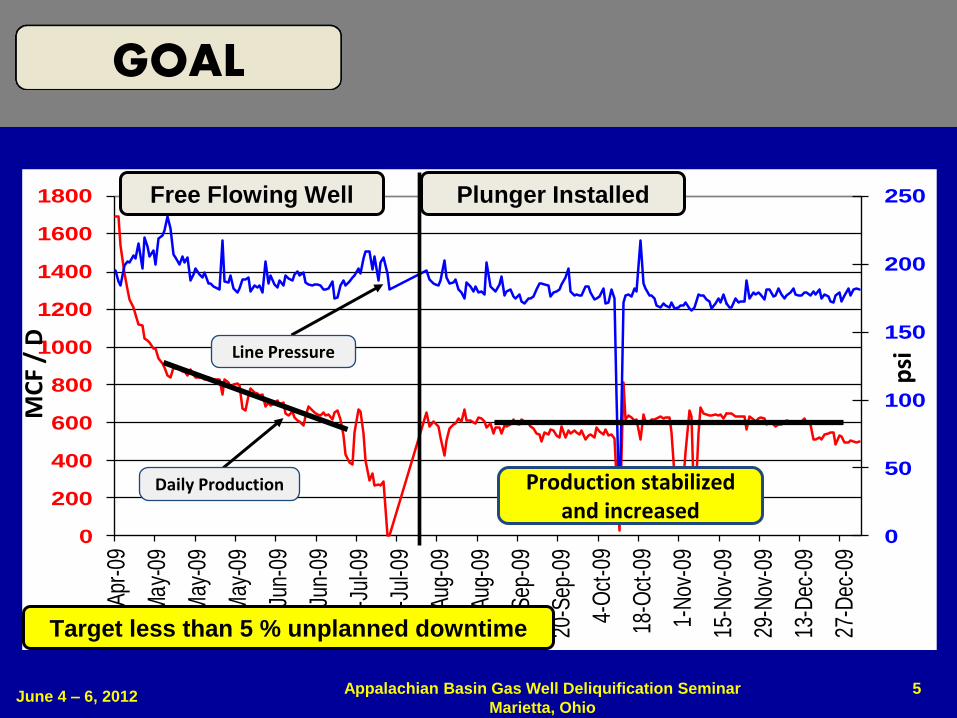
Free Flowing Well Plunger Installed
psi
MC
F /
D
Line Pressure
Daily Production Production stabilized and increased
Use long term trend to set production goal
GOAL
June 4 – 6, 2012 Appalachian Basin Gas Well Deliquification Seminar
Marietta, Ohio
5
0
50
100
150
200
250
0
200
400
600
800
1000
1200
1400
1600
1800
19-A
pr-0
9
3-M
ay-0
9
17-M
ay-0
9
31-M
ay-0
9
14-J
un-0
9
28-J
un-0
9
12-J
ul-0
9
26-J
ul-0
9
9-A
ug-0
9
23-A
ug-0
9
6-S
ep-0
9
20-S
ep-0
9
4-O
ct-0
9
18-O
ct-0
9
1-N
ov-0
9
15-N
ov-0
9
29-N
ov-0
9
13-D
ec-0
9
27-D
ec-0
9
Free Flowing Well
psi
MC
F /
D
Plunger Installed
Production stabilized and increased
Line Pressure
Daily Production
Target less than 5 % unplanned downtime
GOAL
June 4 – 6, 2012 Appalachian Basin Gas Well Deliquification Seminar
Marietta, Ohio
6
0
500
1,000
1,500
2,000
2,500
3,000
3,500
4,000
500
1,000
1,500
2,000
2,500
3,000
3,500
4,000
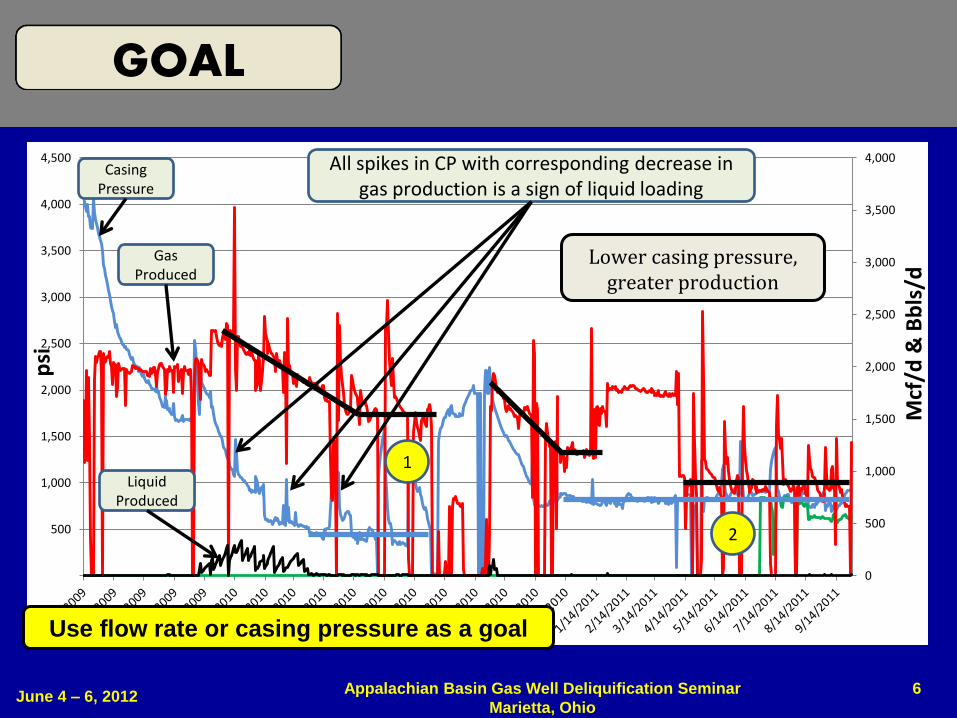
4,500Casing
Pressure
Gas Produced
Liquid Produced
psi
Mcf
/d &
Bb
ls/d
All spikes in CP with corresponding decrease in gas production is a sign of liquid loading
1
2
Lower casing pressure, greater production
GOAL
June 4 – 6, 2012 Appalachian Basin Gas Well Deliquification Seminar
Marietta, Ohio
Use flow rate or casing pressure as a goal
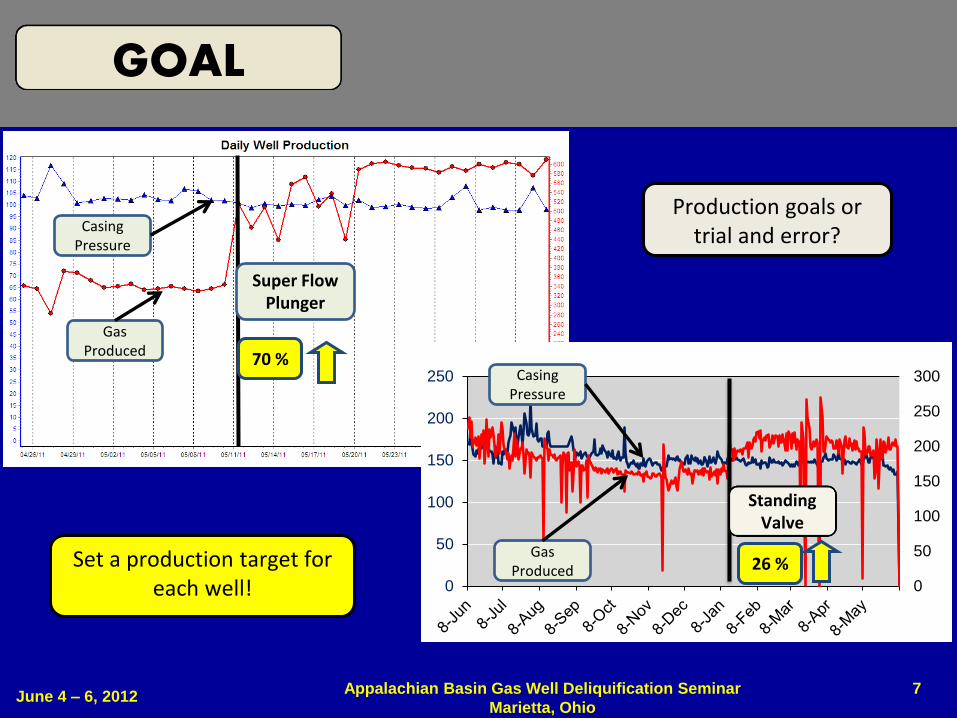
Super Flow Plunger
70 %
7
Production goals or trial and error?
0
50
100
150
200
250
300
0
50
100
150
200
250
Standing Valve
26 % Set a production target for each well!
GOAL
Casing Pressure
Gas Produced
Casing Pressure
Gas Produced
June 4 – 6, 2012 Appalachian Basin Gas Well Deliquification Seminar
Marietta, Ohio

8
IPR CURVE
Low Pressure Well
BACKPRESSURE High line pressure
LIQUID LOADING
Scale / paraffin build-up
Chokes
Motor valve trim size
Multiple 90 degree elbows
Small orifice plates
Over 90% of the gas wells in the US are liquid loaded
(Marathon study)
Hi Pressure Well
Qsc = C ( Pr2 - Pwf
2)n
GOAL
June 4 – 6, 2012 Appalachian Basin Gas Well Deliquification Seminar
Marietta, Ohio
Use IPR curve to set production target
9
0
200
400
600
800
1,000
1,200
1,400
1,600
0
200
400
600
800
1,000
1,200
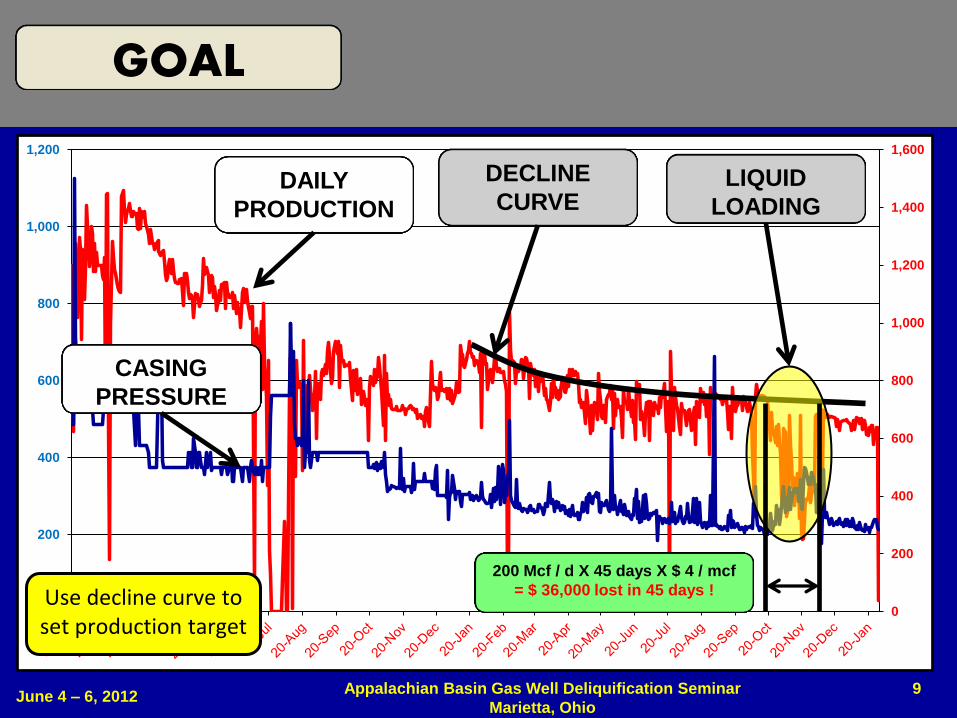
DAILY
PRODUCTION
CASING
PRESSURE
DECLINE
CURVE LIQUID
LOADING
200 Mcf / d X 45 days X $ 4 / mcf
= $ 36,000 lost in 45 days !
GOAL
June 4 – 6, 2012 Appalachian Basin Gas Well Deliquification Seminar
Marietta, Ohio
Use decline curve to set production target
10
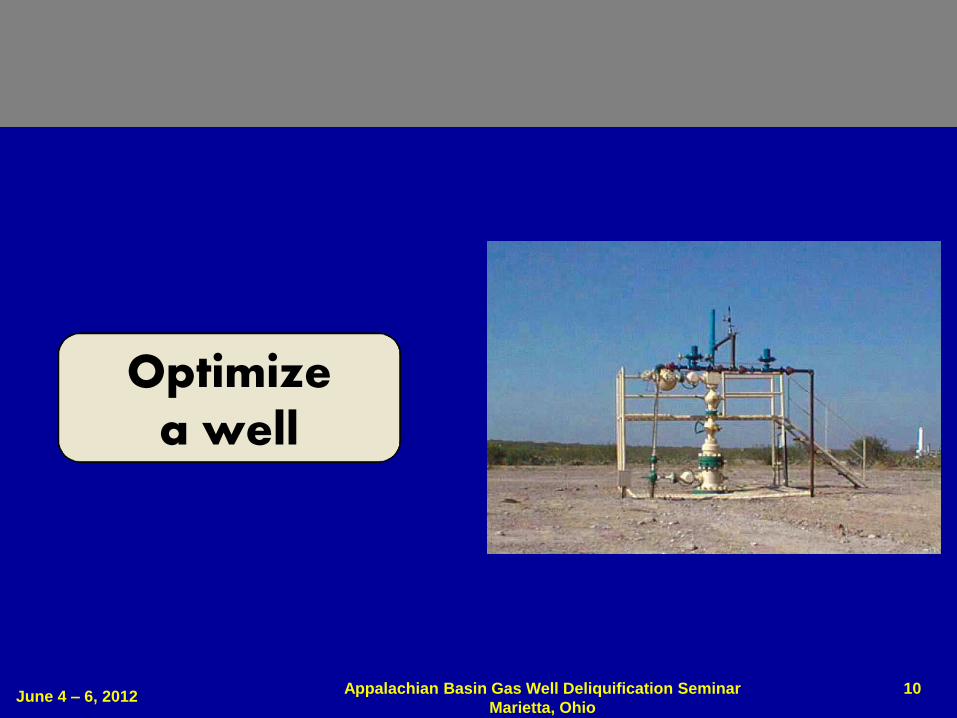
Optimize a well
June 4 – 6, 2012 Appalachian Basin Gas Well Deliquification Seminar
Marietta, Ohio
11
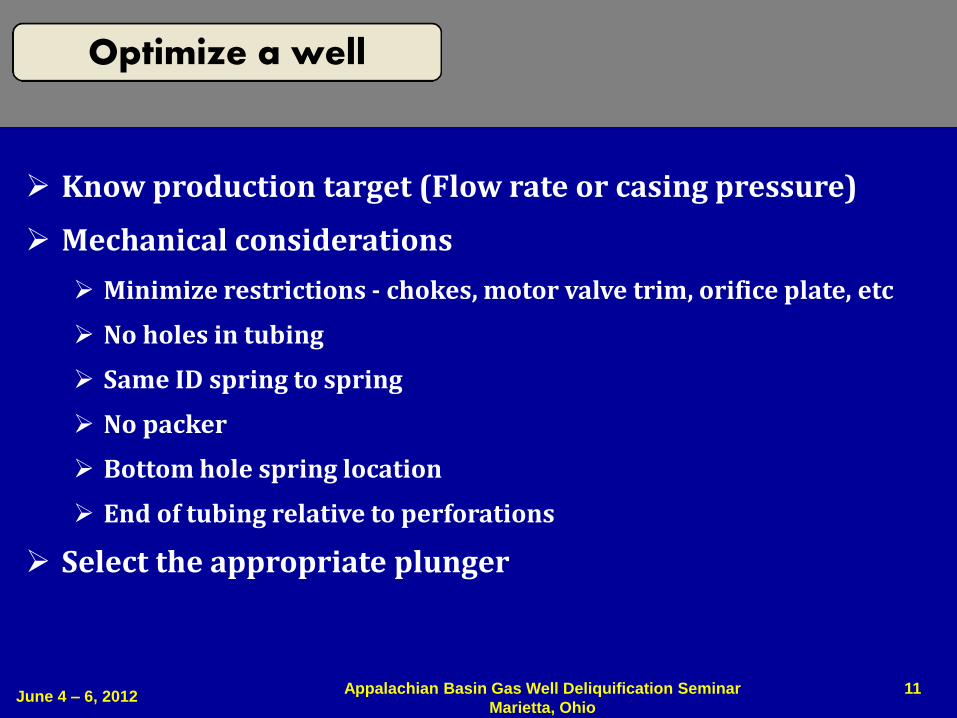
Optimize a well
Know production target (Flow rate or casing pressure)
Mechanical considerations
Minimize restrictions - chokes, motor valve trim, orifice plate, etc
No holes in tubing
Same ID spring to spring
No packer
Bottom hole spring location
End of tubing relative to perforations
Select the appropriate plunger
June 4 – 6, 2012 Appalachian Basin Gas Well Deliquification Seminar
Marietta, Ohio

12
Optimize a well
June 4 – 6, 2012 Appalachian Basin Gas Well Deliquification Seminar
Marietta, Ohio
Use checklists!
Pre-Installation
Installation
Troubleshooting
Etc
Select the appropriate algorithm
Time assumes limited well variations
Self adjusting algorithms can be less labor intensive
Minimize variation! Same lift pressure and liquid load
Optimize production – use plunger velocity as indicator
13 June 4 – 6, 2012
Appalachian Basin Gas Well Deliquification Seminar
Marietta, Ohio
Optimize a well
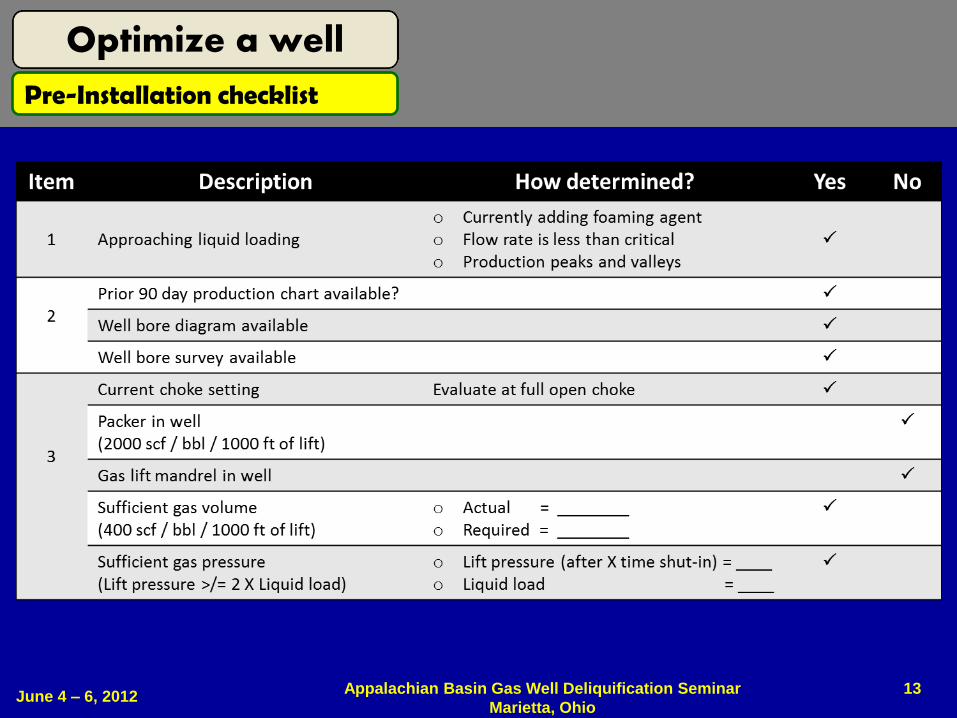
Pre-Installation checklist

14 June 4 – 6, 2012
Appalachian Basin Gas Well Deliquification Seminar
Marietta, Ohio
Optimize a well
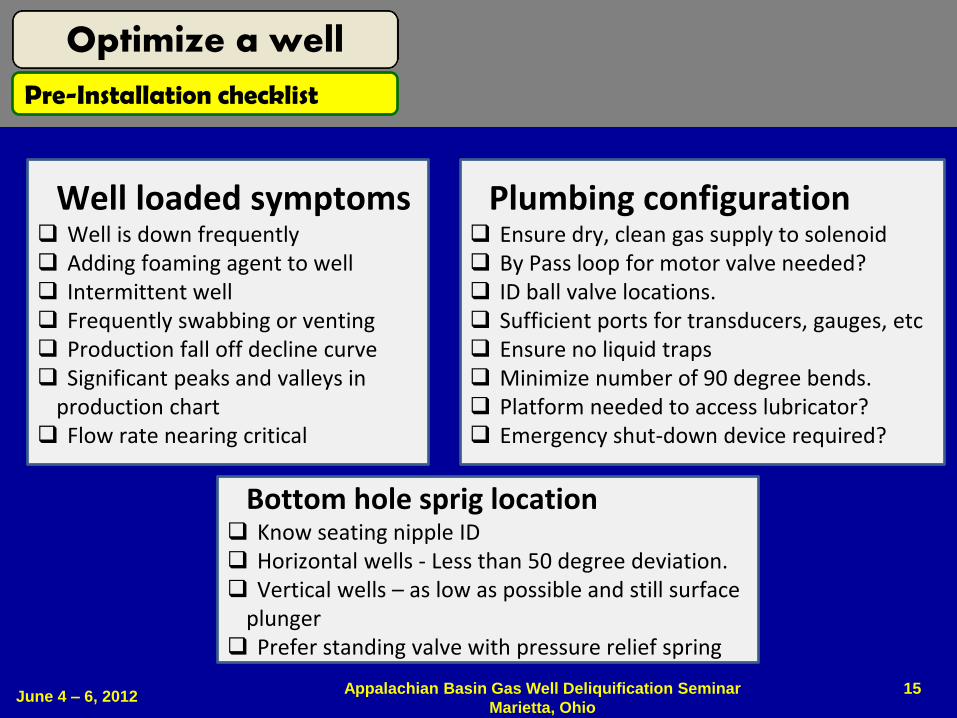
Pre-Installation checklist
8
9
10
15 June 4 – 6, 2012
Appalachian Basin Gas Well Deliquification Seminar
Marietta, Ohio
Optimize a well
Pre-Installation checklist
Plumbing configuration Ensure dry, clean gas supply to solenoid By Pass loop for motor valve needed? ID ball valve locations. Sufficient ports for transducers, gauges, etc Ensure no liquid traps Minimize number of 90 degree bends. Platform needed to access lubricator? Emergency shut-down device required?
Well loaded symptoms Well is down frequently Adding foaming agent to well Intermittent well Frequently swabbing or venting Production fall off decline curve Significant peaks and valleys in
production chart Flow rate nearing critical
Bottom hole sprig location Know seating nipple ID Horizontal wells - Less than 50 degree deviation. Vertical wells – as low as possible and still surface
plunger Prefer standing valve with pressure relief spring
16 June 4 – 6, 2012
Appalachian Basin Gas Well Deliquification Seminar
Marietta, Ohio
Optimize a well
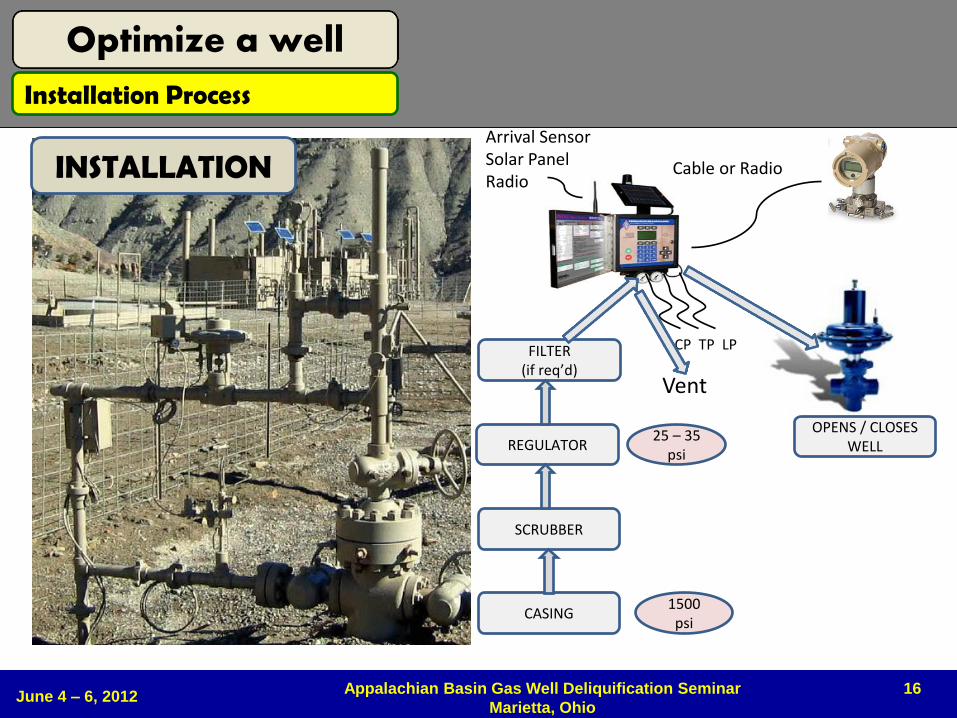
Installation Process
CP TP LP
Cable or Radio
REGULATOR
SCRUBBER
CASING
FILTER (if req’d)
1500 psi
25 – 35 psi
Vent
Arrival Sensor Solar Panel Radio
OPENS / CLOSES WELL
INSTALLATION

17 June 4 – 6, 2012
Appalachian Basin Gas Well Deliquification Seminar
Marietta, Ohio
Optimize a well
1. Set tubing plug and pressure test tubing. If tubing integrity is good, continue.
2. Check tubing diameter using a ring gauge. If necessary, broach the tubing to ensure no tight spots between the seating nipple and lubricator connection point.
3. Ensure well head diameter is the same as the tubing ID. If larger, sleeve the wellhead.
4. Prepare the flow line and install the flanged control valve for plunger lift control.
5. Install the lubricator (dual outlet preferred) on the wellhead and plumb in the flow line.
Installation & Start-up Process

18 June 4 – 6, 2012
Appalachian Basin Gas Well Deliquification Seminar
Marietta, Ohio
Optimize a well
6. Set the bottom hole spring assembly at the prescribed location.
7. Install the plunger lift controller, ensuring required supply line pressure to the solenoid latch valve is reliable and free of debris and liquid. Do not over pressurize the solenoid valve or motor valve!
8. With the well closed, observe casing and tubing pressure. If the well is liquid loaded, swab the well until the available Lift Pressure (Casing – Line) is at least 2 times the Liquid Load in the tubing (Casing – Tubing).
9. Engage the catcher to hold the plunger. Place the selected plunger in the lubricator. Ensure the plunger selection matches the well conditions.
10. Observe the casing pressure. If casing pressure is high, resulting in a potential rapid plunger run, open the well to bleed off some casing pressure until it is in an acceptable range. Be careful not to liquid load the well during this process.
11. If casing pressure is in an adequate range, drop the selected plunger.
Installation & Start-up Process

19 June 4 – 6, 2012
Appalachian Basin Gas Well Deliquification Seminar
Marietta, Ohio
Optimize a well
11. Using plunger fall time calculations, allow adequate time for the plunger to reach the bottom hole spring assembly.
12. Document the lift pressure prior to opening the well. Allow the plunger to surface, documenting plunger arrival velocity. Generally, plunger arrival velocities between 500 and 1000 feet per minute are desirable.
13. Allow the well to flow until the flow rate approaches the critical flow rate. Then, shut the well in, documenting the liquid load soon after the well is closed. Compare the liquid load, lift pressure and plunger arrival velocity.
14. If necessary, adjust controller settings in preparation for the next cycle to achieve optimal production at desirable plunger velocities.
Optimal Production is achieved at the lowest flowing bottom hole pressure
Practical application strives toward operating at low casing pressures, thus lifting small amounts of fluid on each cycle, cycling many times a day.
Installation & Start-up Process

20 June 4 – 6, 2012
Appalachian Basin Gas Well Deliquification Seminar
Marietta, Ohio
Open Conditions (After fall time elapses)
o Time = set point
o Tubing pressure = set point
o Casing pressure = set point
o Tubing/Casing = set point
o Tubing – Line = set point
o Lift pressure = set point
o Lift pressure = Foss and Gaul
o Load Factor = Set point
Objective:
Maximize production while allowing the designed
quantity of liquid to enter tubing on every cycle
Objective:
Open at minimum pressure required to
surface plunger at desired plunger velocity
Load Factor =
Liquid Load /
Lift Pressure
Close Conditions (After plunger surfaces)
o Time = set point
o Tubing pressure = set point
o Casing pressure = set point o Flow Rate = set point = Critical flow = % of critical
Optimize a well
Algorithm

21 June 4 – 6, 2012
Appalachian Basin Gas Well Deliquification Seminar
Marietta, Ohio
CONVENTIONAL PLUNGER EXAMPLE (8000 foot deep well)
TRADITIONAL Fall time (Use EchoMeter to optimize)
Gas – 7750 ft @ 180 fpm Liquid – 250 ft @ 40 fpm (1 bbl) Total = 43 min + 6 min Total = 49 min + 10% Total = 54 min
CP Build 30 min to reach req’d pressure Higher pressure req’d to lift 1 bbl
Rise Time 600 fpm = 13 min
Production mode (afterflow) 60 min
Total cycle = 2.6 hours or 9 trips / day Total Production time = 9 hours
(Partially in liquid loaded tubing)
FREQUENT TRIPS Fall time (Use EchoMeter to optimize)
Gas – 7937 ft @ 800 fpm Liquid – 63 ft @ 40 fpm ( ¼ bbl) Total = 10 min + 1.5 min Total = 11.5 min + 10% Total = 12.5 min
CP Build Open when plunger reaches bottom Less pressure req’d to lift ¼ bbl
Rise Time 600 fpm = 13 min
Production mode (afterflow) 15 min
Total cycle = 40.5 min or 35.5 trips / day Total Production time = 8.75 hours (Clear tubing, lower flowing pressure)
Optimize a well
Design Lift Cycle
Design cycle aide EchoMeter Plunger Lift Calculator

22 June 4 – 6, 2012
Appalachian Basin Gas Well Deliquification Seminar
Marietta, Ohio
Plunger free cycling
Casing Pressure
Tubing Pressure
Line Pressure
Flow Rate
UNCONVENTIONAL PLUNGER EXAMPLE Plunger falls when well is open Only round trip times recorded Less shut-in Excessive plunger velocities possible
Optimize a well
Design Lift Cycle

23
Optimize many wells
June 4 – 6, 2012 Appalachian Basin Gas Well Deliquification Seminar
Marietta, Ohio

24 June 4 – 6, 2012
Appalachian Basin Gas Well Deliquification Seminar
Marietta, Ohio
1. Install artificial lift before production declines
2. Determine best artificial lift type for well conditions
3. Know target (production or casing pressure)
4. Aggressively prevent unplanned downtime
5. Troubleshoot – detect rapidly, solve root cause!
6. Prioritize wells daily – before driving route
7. Produce at the lowest flowing bottom hole pressure
8. Train wide and deep!
Optimize many wells

25
July 2009 Chesapeake published decline curve
Critical Flow Rate Area (Turner may under predict)
Install Plunger Lift
1. Install A.L. before liquid loading
June 4 – 6, 2012 Appalachian Basin Gas Well Deliquification Seminar
Marietta, Ohio
Optimize many wells

26
0
200
400
600
800
1000
1200
0 10 20 30 40 50 60 70 80 90 100
A.L. GENERALLY NOT REQUIRED
BBLS / D
MC
F /
D
GLR for Plunger Lift (Barnett Shale)
GLR = 10
GLR = 5
GLR = 3
CONSIDER: 2 Stage Plunger Lift,
Gas Assisted Plunger Lift, Plunger Assisted Gas Lift
Minimum Gas Volume Required (7500 ft TVD)
400 scf / Bbl / 1000 ft of Lift 3 Mcf per BBL or GLR = 3
Note: Higher GLR wells are easier to keep running, resulting in less non productive time
2. Know which A.L. type to use
June 4 – 6, 2012 Appalachian Basin Gas Well Deliquification Seminar
Marietta, Ohio
Optimize many wells

27
TWO STAGE PLUNGER LIFT GAS ASSISTED PLUNGER LIFT PLUNGER ASSISTED GAS LIFT
o Low GLR, marginal wells
o 200 scf / bbl / 1000 ft o Two or more plungers in the same well
o Ideal for slim hole or
wells with packers oCan be used with injection
gas
o Low GLR wells
o Gas injected to annulus 400 scf / bbl / 1000 ft
o Short shut-in times
o + / - 250 Bbls / day
possible oPlunger seal is important
o Low GLR wells
o Add plunger to intermittent gas lift wells
o Reduces injected gas
requirements (30 % range)
o Eliminates fall back o Increases production
2. Know which A.L. type to use
June 4 – 6, 2012 Appalachian Basin Gas Well Deliquification Seminar
Marietta, Ohio
Optimize many wells

28
Set a production or casing pressure goal for each well
3. Set production target – flow rate or casing pressure
0
200
400
600
800
1,000
1,200
1,400
1,600
0
200
400
600
800
1,000
1,200
20
-Jan
20
-Fe
b
20
-Mar
20
-Apr
20
-May
20
-Jun
20
-Jul
20
-Aug
20
-Sep
20
-Oct
20
-Nov
20
-Dec
20
-Jan
20
-Fe
b
20
-Mar
20
-Apr
20
-May
20
-Jun
20
-Jul
20
-Aug
20
-Sep
20
-Oct
20
-Nov
20
-Dec
20
-Jan
DAILY
PRODUCTION
CASING
PRESSURE
DECLINE
CURVE
June 4 – 6, 2012 Appalachian Basin Gas Well Deliquification Seminar
Marietta, Ohio
Optimize many wells

29
PRODUCTION ($ 4.50 / Mcf)
$’s
per day
$’s
per week
$’s
per month
25 Mcf / day $ 113 $ 788 $ 3,150
50 Mcf / day $ 225 $ 1,575 $ 6,300
100 Mcf / day $ 450 $ 3,150 $ 12,600
250 Mcf / day $ 1,125 $ 7,875 $ 31,500
500 Mcf / day $ 2,250 $ 15,750 $ 63,000
750 Mcf / day $ 3,375 $ 23,625 $ 94,500
1,000 Mcf / day $ 4,500 $ 31,500 $ 126,000
4. Aggressively prevent unplanned downtime
How long to re-start a well? How long to detect after problem occurs, allocate well tender time, get parts, schedule wire line, schedule swab rig, etc ?
June 4 – 6, 2012 Appalachian Basin Gas Well Deliquification Seminar
Marietta, Ohio
Optimize many wells
30
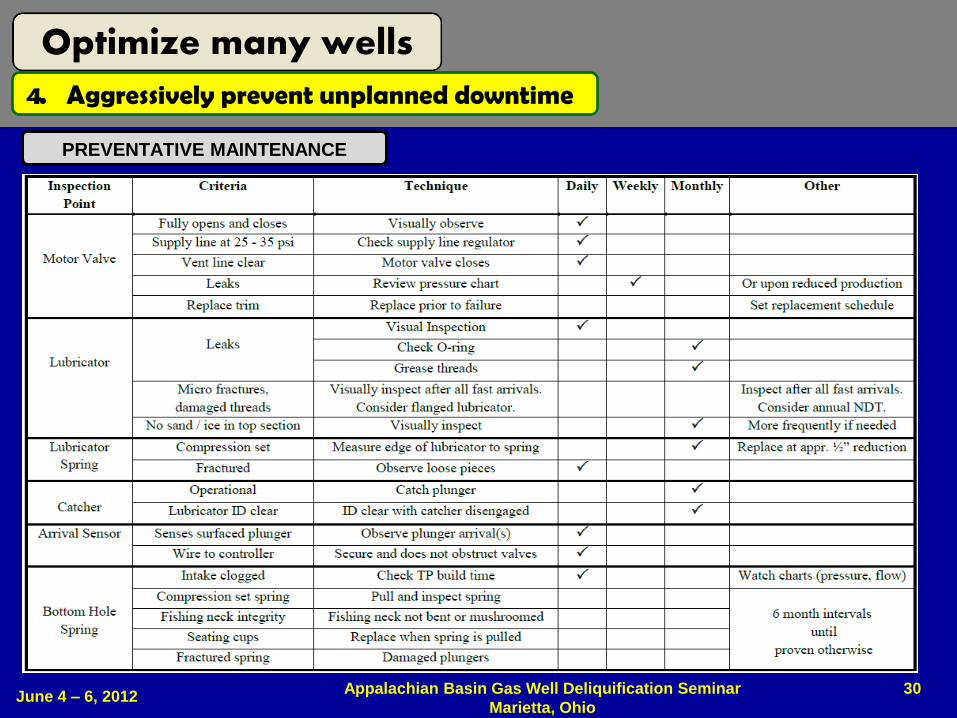
4. Aggressively prevent unplanned downtime
PREVENTATIVE MAINTENANCE
June 4 – 6, 2012 Appalachian Basin Gas Well Deliquification Seminar
Marietta, Ohio
Optimize many wells

31
4. Aggressively prevent unplanned downtime
PREVENTATIVE MAINTENANCE
June 4 – 6, 2012 Appalachian Basin Gas Well Deliquification Seminar
Marietta, Ohio
Optimize many wells
32
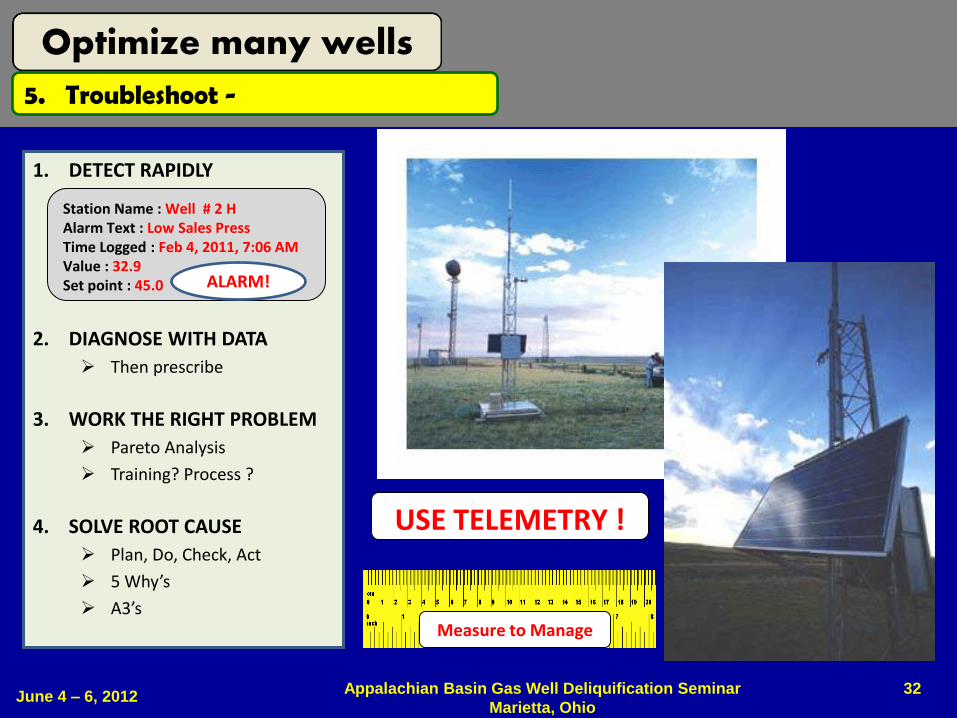
5. Troubleshoot -
1. DETECT RAPIDLY
2. DIAGNOSE WITH DATA
Then prescribe
3. WORK THE RIGHT PROBLEM
Pareto Analysis
Training? Process ?
4. SOLVE ROOT CAUSE
Plan, Do, Check, Act
5 Why’s
A3’s
Station Name : Well # 2 H Alarm Text : Low Sales Press Time Logged : Feb 4, 2011, 7:06 AM Value : 32.9 Set point : 45.0 ALARM!
USE TELEMETRY !
Measure to Manage
June 4 – 6, 2012 Appalachian Basin Gas Well Deliquification Seminar
Marietta, Ohio
Optimize many wells

33
Casing Pressure
Flow Rate
Line Pressure
Tubing Pressure
Lift Pressure
Liquid Load
LOOK FOR VARIATIONS TO THE TYPICAL
PLUNGER CYCLE !
June 4 – 6, 2012 Appalachian Basin Gas Well Deliquification Seminar
Marietta, Ohio
Optimize many wells
5. Troubleshoot -
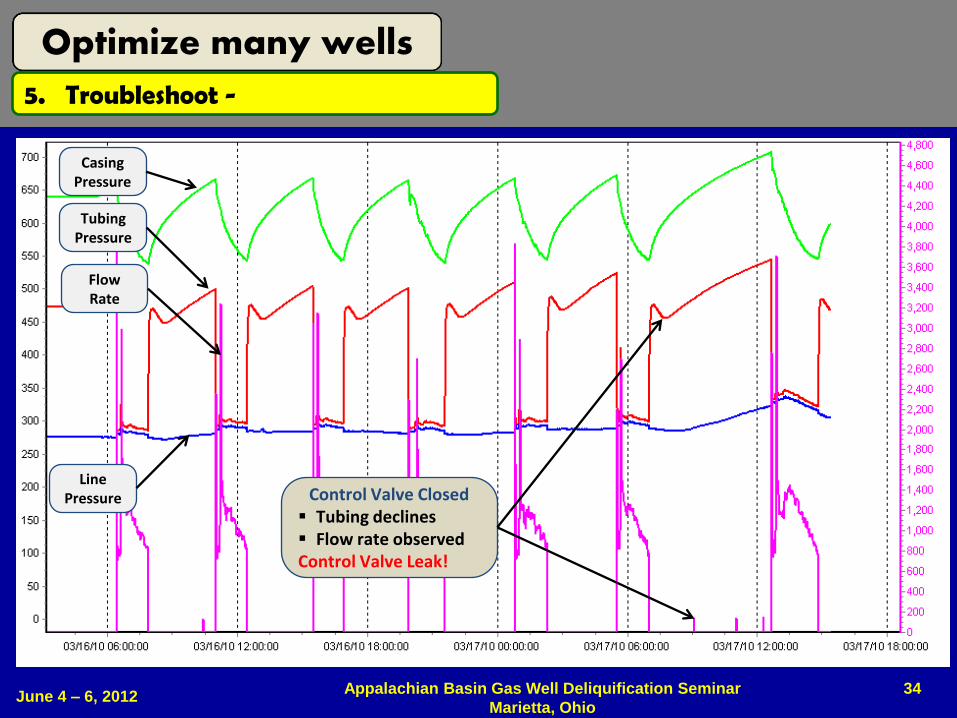
34
Casing Pressure
Tubing Pressure
Line Pressure
Flow Rate
Control Valve Closed Tubing declines Flow rate observed Control Valve Leak!
June 4 – 6, 2012 Appalachian Basin Gas Well Deliquification Seminar
Marietta, Ohio
Optimize many wells
5. Troubleshoot -

35
Casing Pressure
Tubing Pressure
Line Pressure
Flow Rate
Control Valve Closed Line pressure declines Possible Dump Valve Leak!
June 4 – 6, 2012 Appalachian Basin Gas Well Deliquification Seminar
Marietta, Ohio
Optimize many wells
5. Troubleshoot -

36
Casing Pressure
Tubing Pressure
Line Pressure
Flow Rate
Control Valve Open Well closed when flow
rate is increasing Flow longer!
June 4 – 6, 2012 Appalachian Basin Gas Well Deliquification Seminar
Marietta, Ohio
Optimize many wells
5. Troubleshoot -

37
Casing Pressure
Tubing Pressure
Line Pressure
Flow Rate
Control Valve Closed Casing and tubing equalize Pushing liquid out of tubing
Shorten close time or add a standing valve
June 4 – 6, 2012 Appalachian Basin Gas Well Deliquification Seminar
Marietta, Ohio
Optimize many wells
5. Troubleshoot -

38
Greater than 1000 fpm
500 to 1000 fpm
Less than 500 fpm
Self Adjusting Controllers
Liquid Load Lift Pressure
Plunger Velocity Close time Production
June 4 – 6, 2012 Appalachian Basin Gas Well Deliquification Seminar
Marietta, Ohio
Optimize many wells
5. Troubleshoot -

39
SYMPTOM POSSIBLE CAUSES
No arrivals
Plunger stuck in lubricator. Worn plunger. Lift pressure insufficient. Too much
liquid. Disconnected arrival sensor. Arrival sensor malfunction. Excessive
grease in tubing from wellhead valves. Plunger stuck in tubing – try retrieval
plunger. Rapid fall plunger flow valve hung open.
Slow arrivals Worn plunger. Lift pressure insufficient. Too much liquid. Tubing restriction
(scale, paraffin). Wrong plunger style.
Fast arrivals Fall time too short. Plunger hung in well head – check catcher and well head
valves. Tight spot in tubing. Too much lift pressure. Not enough liquid load.
Motor valve will not open
No gas supply pressure – check regulator. Clogged filter. Liquid in gas supply
line. Debris in solenoid valve. Solenoid valve malfunction. Hole in motor valve
diaphragm.
Motor valve will not close Liquid in gas supply line. Debris in solenoid valve. Solenoid valve malfunction.
Solenoid vent line plugged.
Motor valve leaks Hydrate or other obstacle in trim. Inspect / replace trim. Consider ceramic trim.
Lubricator top seeps / leaks Dry threads. Inspect “o” ring. Grease “o” ring.
COMMON PROBLEMS
June 4 – 6, 2012 Appalachian Basin Gas Well Deliquification Seminar
Marietta, Ohio
Optimize many wells
5. Troubleshoot -

40
COMMON PROBLEMS
SYMPTOM POSSIBLE CAUSES
Short battery life
Inspect battery. Inspect solar panel wires. Inspect solar
panel – clean? 45 degree? Facing south? Check radio
– constant on?
Plunger fishing neck mushroomed Lubricator spring worn or too stiff. Fast plunger runs.
Catcher will not trap plunger Inspect / replace spring (ball and spring type).
Motor valve closed, flow rate not zero Motor valve leak or calibrate flow meter
Flow rate increasing at end of afterflow Flow longer
Motor valve closed, TP & CP slowly equalize, fast
and dry plunger runs, possible liquid produced after
plunger arrives
Pressure is pushing liquid out of tubing. Shorten close
time or add a standing valve.
Fall time elapsed, casing pressure not increasing,
shut-in time remains
Reduce shut-in time or open at lower lift pressure
Consistent plunger runs; consistent fluid loads
followed by instant liquid loading and no plunger runs
Tubing set too high. Liquid column slowly builds below
tubing. When column reaches tubing, well loads
Fast, dry plunger runs. Liquid in tubing on each cycle Fall time too short
June 4 – 6, 2012 Appalachian Basin Gas Well Deliquification Seminar
Marietta, Ohio
Optimize many wells
5. Troubleshoot -

41
25 psi
Supply Line
Vent Line
Latching
Solenoid
Valve
Motor
Valve To
Motor
Valve
1
4
3
2
5
1) Check supply line pressure (clean gas)
2) Check pressure to motor valve
3) Ensure vent line is not obstructed
4) Ensure solenoid valve is functioning
Clean if obstructed
5) Check trim/seat for wear, leaks
June 4 – 6, 2012 Appalachian Basin Gas Well Deliquification Seminar
Marietta, Ohio
Optimize many wells
5. Troubleshoot -

42
COMMON PROBLEMS
• If vent to tanks to raise
plunger, how long should
you vent after plunger
surfaces?
• If swab, how do you know
when it’s OK to restart the
plunger?
June 4 – 6, 2012 Appalachian Basin Gas Well Deliquification Seminar
Marietta, Ohio
Optimize many wells
5. Troubleshoot -
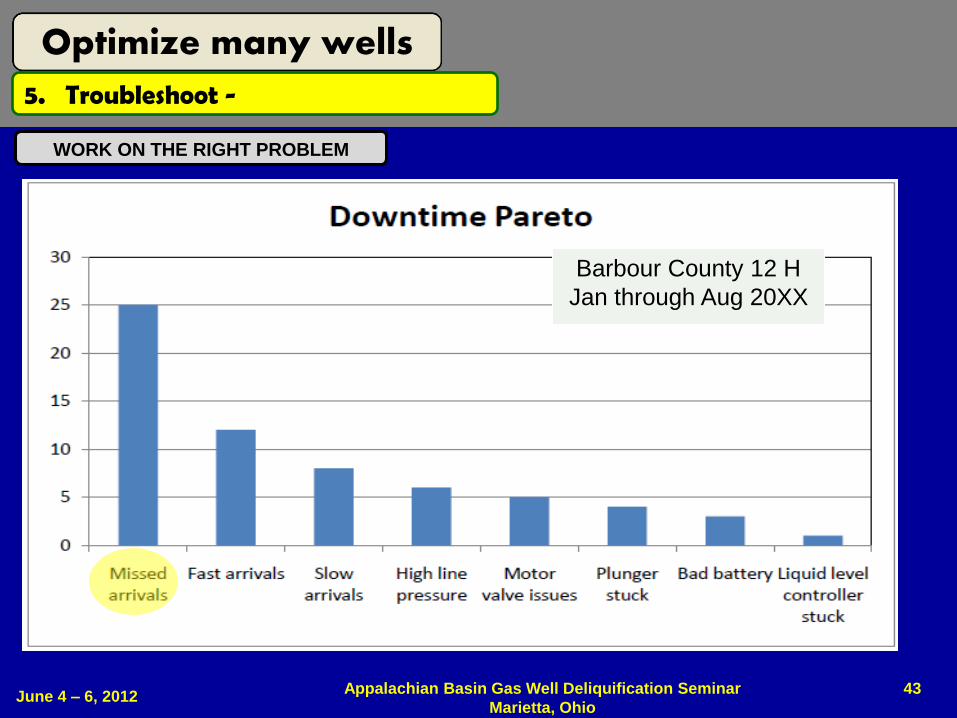
Barbour County 12 H
Jan through Aug 20XX
43
WORK ON THE RIGHT PROBLEM
June 4 – 6, 2012 Appalachian Basin Gas Well Deliquification Seminar
Marietta, Ohio
Optimize many wells
5. Troubleshoot -

44
What
prevents
missed
arrivals?
Line Pressure Variations
Operator Controller Well Conditions
Self adjusting
Actionable data
Worn
Correct type
Plunger
Knowledge
Time
Real time access
Real time alarms
Appropriate for
plunger lift
Compatible with algorithm
Notify prior to maintenance
Data Access
SOLVE ROOT CAUSE
June 4 – 6, 2012 Appalachian Basin Gas Well Deliquification Seminar
Marietta, Ohio
Optimize many wells
5. Troubleshoot -
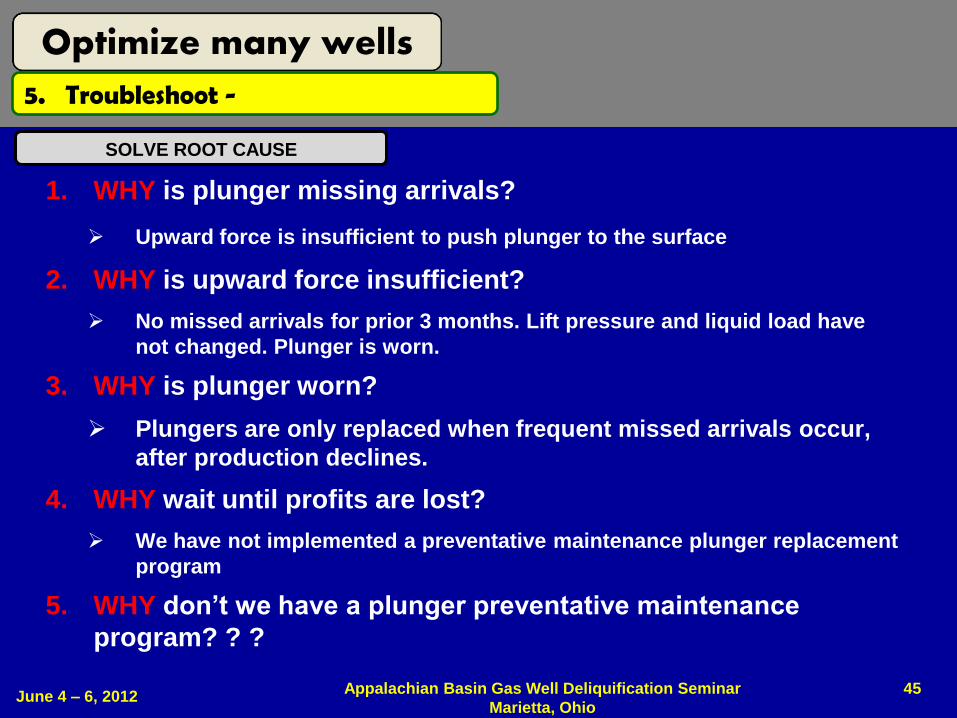
1. WHY is plunger missing arrivals?
Upward force is insufficient to push plunger to the surface
2. WHY is upward force insufficient?
No missed arrivals for prior 3 months. Lift pressure and liquid load have
not changed. Plunger is worn.
3. WHY is plunger worn?
Plungers are only replaced when frequent missed arrivals occur,
after production declines.
4. WHY wait until profits are lost?
We have not implemented a preventative maintenance plunger replacement
program
5. WHY don’t we have a plunger preventative maintenance
program? ? ?
45
SOLVE ROOT CAUSE
June 4 – 6, 2012 Appalachian Basin Gas Well Deliquification Seminar
Marietta, Ohio
Optimize many wells
5. Troubleshoot -

46
PLAN Understand the problem
“A problem well defined is a problem half solved”
1) Is the problem statement clear and accurate?
2) Has the systemic root cause been identified?
DO Implement the plan
3) Has irreversible corrective actions been implemented for all root causes?
CHECK Follow-up
4) Has a plan been identified to verify the effectiveness of all corrective actions?
ACT Adjust
5) Has a plan been identified to standardize and save all lessons learned across all groups?
SOLVE ROOT CAUSE
June 4 – 6, 2012 Appalachian Basin Gas Well Deliquification Seminar
Marietta, Ohio
Optimize many wells
5. Troubleshoot -
47
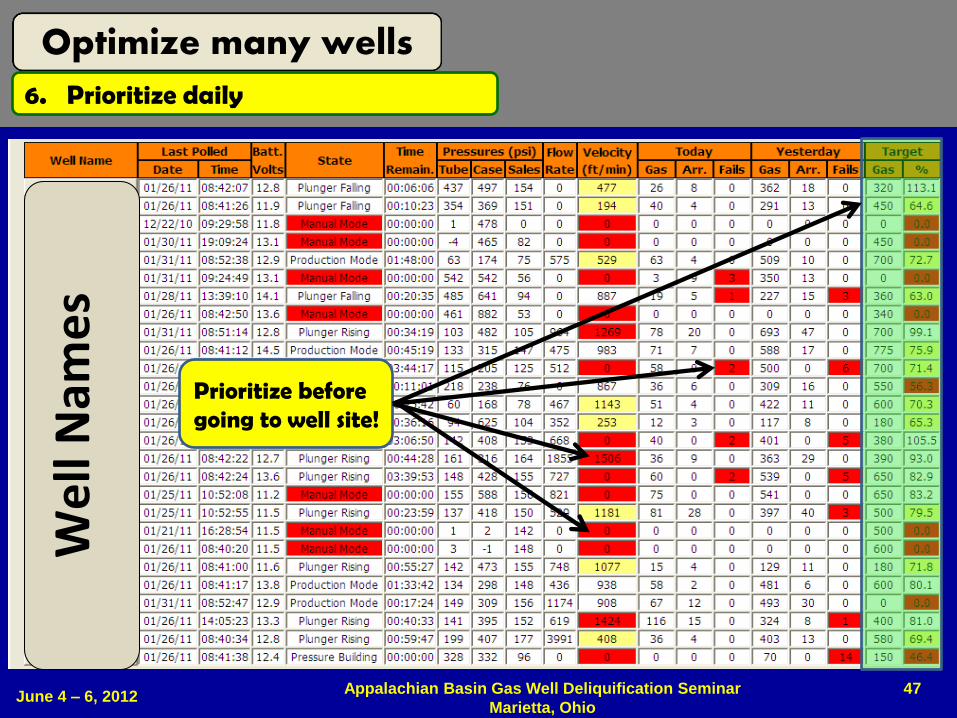
6. Prioritize daily W
ell
Nam
es
Prioritize before going to well site!
June 4 – 6, 2012 Appalachian Basin Gas Well Deliquification Seminar
Marietta, Ohio
Optimize many wells

48
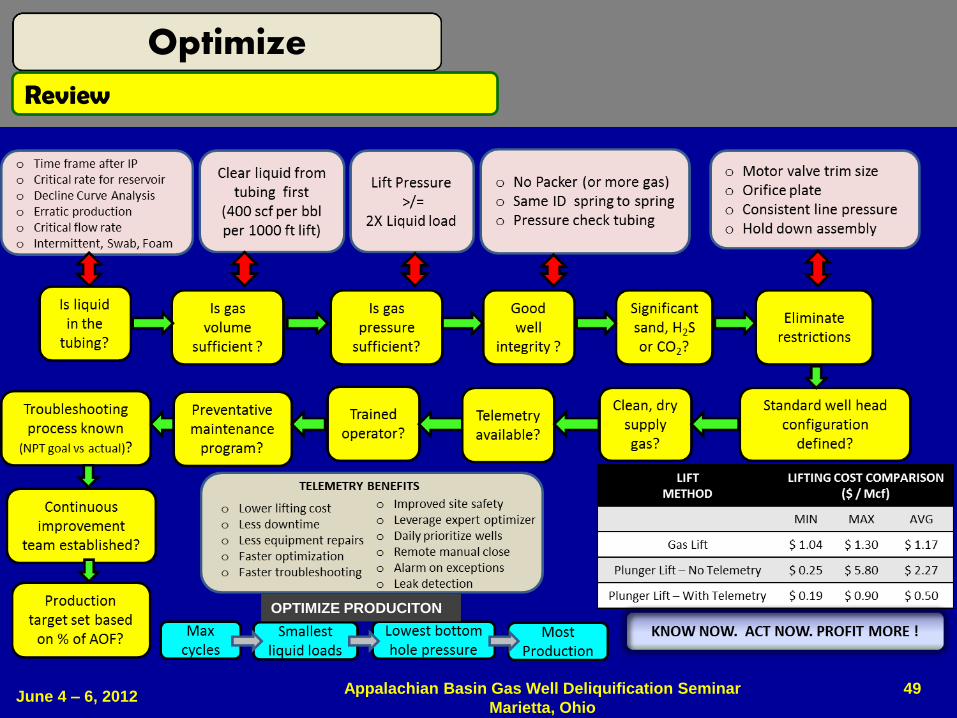
7. Produce at lowest flowing bottom hole pressure
Know production target
Minimize restrictions
Select correct plunger
Use a standing valve
Address well variations
with algorithm
Review on each cycle Fluid in tubing
Lift pressure
Plunger velocity
Shut-in time
Gas produced
Max Cycles Smallest
Liquid Loads Lowest
BHP
Most Production
June 4 – 6, 2012 Appalachian Basin Gas Well Deliquification Seminar
Marietta, Ohio
Optimize many wells
49
OPTIMIZE PRODUCITON
Review
June 4 – 6, 2012 Appalachian Basin Gas Well Deliquification Seminar
Marietta, Ohio
Optimize

50
Copyright
Rights to this presentation are owned by the company(ies) and/or author(s) listed on the title page. By submitting this presentation to the Gas Well Deliquification Workshop, they grant to the Workshop, the Artificial Lift Research and Development Council (ALRDC), and the Southwestern Petroleum Short Course (SWPSC), rights to:
– Display the presentation at the Workshop.
– Place it on the www.alrdc.com web site, with access to the site to be as directed by the Workshop Steering Committee.
– Place it on a CD for distribution and/or sale as directed by the Workshop Steering Committee.
Other use of this presentation is prohibited without the expressed written permission of the author(s). The owner company(ies) and/or author(s) may publish this material in other journals or magazines if they refer to the Gas Well Deliquification Workshop where it was first presented.
June 4 – 6, 2012
Appalachian Basin Gas Well Deliquification Seminar
Marietta, Ohio

51
Disclaimer
The following disclaimer shall be included as the last page of a Technical Presentation or Continuing Education Course. A similar disclaimer is included on the front page of the Gas Well Deliquification Web Site.
The Artificial Lift Research and Development Council and its officers and trustees, and the Gas Well Deliquification Workshop Steering Committee members, and their supporting organizations and companies (here-in-after referred to as the Sponsoring Organizations), and the author(s) of this Technical Presentation or Continuing Education Training Course and their company(ies), provide this presentation and/or training material at the Gas Well Deliquification Workshop "as is" without any warranty of any kind, express or implied, as to the accuracy of the information or the products or services referred to by any presenter (in so far as such warranties may be excluded under any relevant law) and these members and their companies will not be liable for unlawful actions and any losses or damage that may result from use of any presentation as a consequence of any inaccuracies in, or any omission from, the information which therein may be contained.
The views, opinions, and conclusions expressed in these presentations and/or training materials are those of the author and not necessarily those of the Sponsoring Organizations. The author is solely responsible for the content of the materials.
The Sponsoring Organizations cannot and do not warrant the accuracy of these documents beyond the source documents, although we do make every attempt to work from authoritative sources. The Sponsoring Organizations provide these presentations and/or training materials as a service. The Sponsoring Organizations make no representations or warranties, express or implied, with respect to the presentations and/or training materials, or any part thereof, including any warrantees of title, non-infringement of copyright or patent rights of others, merchantability, or fitness or suitability for any purpose.
June 4 – 6, 2012 Appalachian Basin Gas Well Deliquification Seminar
Marietta, Ohio