Introduction to Performance Tuning & Optimization Tools€¦ · Introduction to Performance Tuning...
44
Introduction to Performance Tuning & Optimization Tools Ian A. Cosden, Ph.D. Manager, HPC Software Engineering and Performance Tuning Research Computing, OIT, Princeton University [email protected] CoDaS-HEP Summer School July 13, 2017 a[i] b[i] a[i]+b[i] a[i+1] b[i+1] a[i+1]+b[i+1] a[i+2] b[i+2] a[i+2]+b[i+2] a[i+3] b[i+3] a[i+3]+b[i+3] + =
Transcript of Introduction to Performance Tuning & Optimization Tools€¦ · Introduction to Performance Tuning...
Introduction to Performance Tuning
& Optimization Tools
Ian A. Cosden, Ph.D.Manager, HPC Software Engineering and Performance Tuning
Research Computing, OIT, Princeton University
CoDaS-HEP Summer School
July 13, 2017
a[i]
b[i]
a[i]+b[i]
a[i+1]
b[i+1]
a[i+1]+b[i+1]
a[i+2]
b[i+2]
a[i+2]+b[i+2]
a[i+3]
b[i+3]
a[i+3]+b[i+3]
+
=
Outline
• What is Performance Tuning?
• Performance Tuning Workflow
• Software Tools
• Hotspots: Intel VTune
• OpenMP Scaling: Intel VTune
• Vectorization: Intel Advisor
• Hands-on VTune Exercise
• Hardware Counters: VTune

What is Performance?
• “Performance is the degree to which a computing system meets expectations of the persons involved in it.” Doherty (1970)
• Is it doing what I want?
• “Performance…is the effectiveness with which the resources of the host computer system are utilized toward meeting the objectives of the software system.” Graham (1973)
• Is it utilizing the resources well?

What is Tuning?
Algorithms
(you/community)
Programming
(you/team)
Performance Tuning
(you/some poor sap)
Operation of Supercomputers
(the sysadmins)
Applicable to all domains

Where does Tuning fit?
• Performance should not be ignored during development
• Algorithm selection
• Vectorization and Parallelization
• Data structures
• Hardware awareness
• Tuning typically happens near the end
• What if you invest time tuning code you never use?
• Principles and techniques applicable at any stage
• We’ll assume we are tuning an underperforming correct code
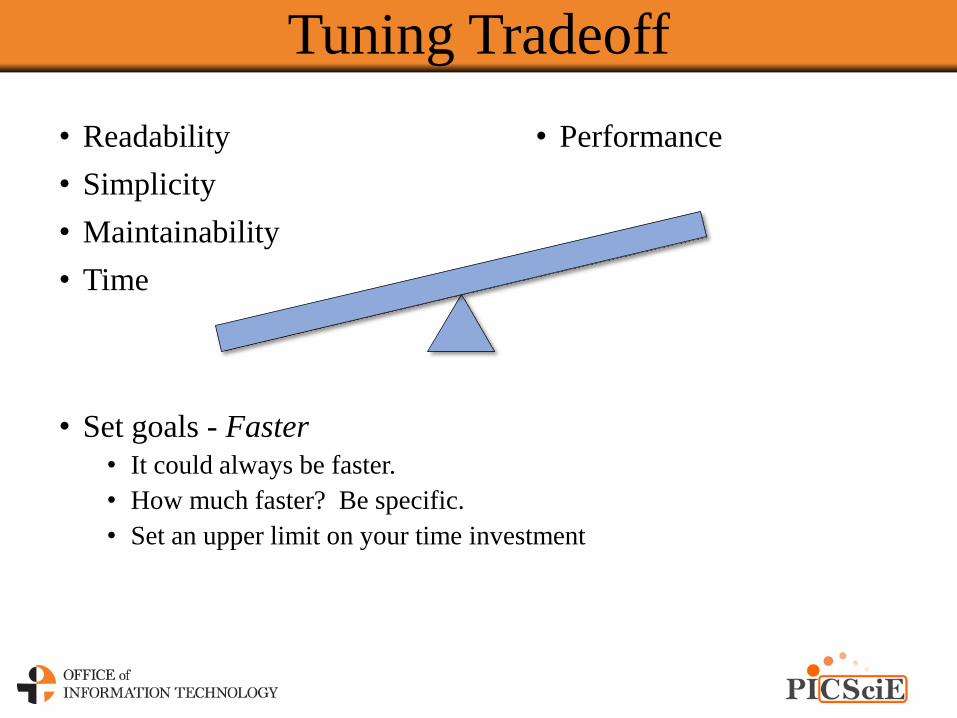
Tuning Tradeoff
• Readability
• Simplicity
• Maintainability
• Time
• Performance
• Set goals - Faster
• It could always be faster.
• How much faster? Be specific.
• Set an upper limit on your time investment

Performance Tuning Workflow
Prepare
Measure
AnalyzeHypothesize
Modify
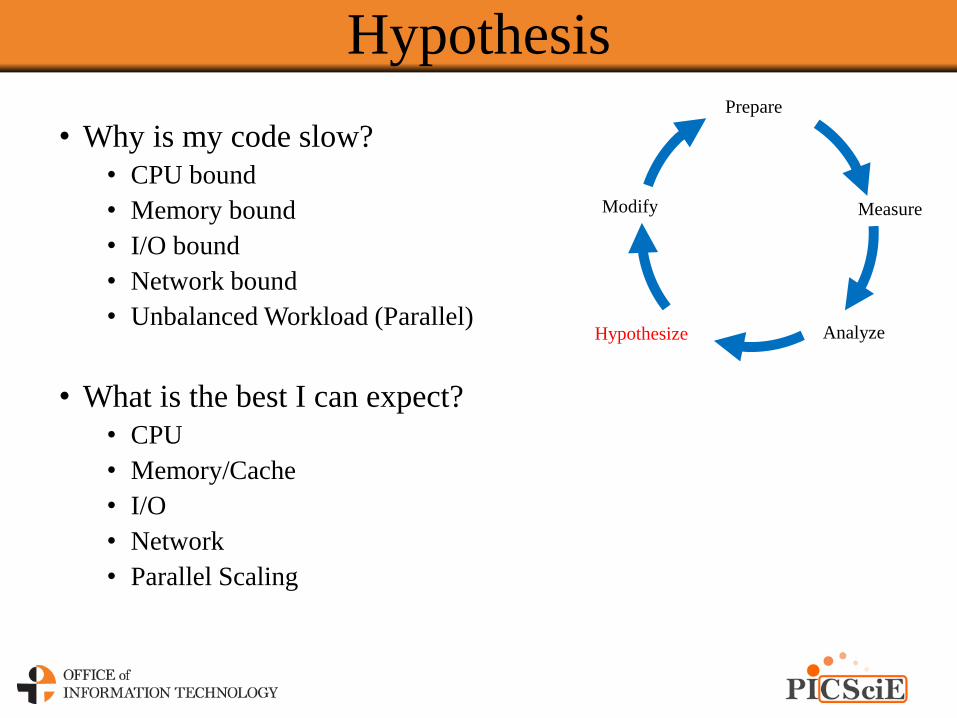
Hypothesis
• Why is my code slow?
• CPU bound
• Memory bound
• I/O bound
• Network bound
• Unbalanced Workload (Parallel)
• What is the best I can expect?
• CPU
• Memory/Cache
• I/O
• Network
• Parallel Scaling
Prepare
Measure
AnalyzeHypothesize
Modify

Measure
• Need some kind of monitor
• Direct Measurement a.k.a. Instrumentation
• Event is what we want to measure
• Accurate
• High overhead for frequent events
• Ex. Tracing
• Indirect Measurement a.k.a. Sampling
• Record system state at regular interval
• Typically low overhead
• Not every event recorded
• Ex. Profiling
• Measurement can influence result
Prepare
Measure
AnalyzeHypothesize
Modify

Measuring
• Measuring the performance of your code• You can’t fix what you can’t see
• Find the “hotspots”
• How much time is spent in each function
• Not always where you think it is
• Identify regions to optimize/parallelize
• Hardware Performance
• Vectorization, cache misses, branch misprediction, etc.
• Do it yourself• Put time calls around loops/functions
• Only works if:• Done carefully during development
• On a small code base
• Use a tool

Easy Measures - Linux
• Total Runtime (“time”)
• Likely not enough
• Critically important number
• Slurm feedback (“seff”)
• Essentially same as top for a cluster
• Only useful for threading/MPI efficiency and I/O
Untuned Tuned
• CPU usage (“top”)
• N*100% cpu = N threads running full-tilt
• 100% ≠ 100% peak theoretical performance
• Useful for threading efficiency only
Performance Tools
• Many free and commercial products
• Site specific – but most places have the major products
• Intel Parallel Studio
• VTune Amplifier XE
• Advisor
• Many others: Allinea Forge (MAP), Tau, Intel Trace Analyzer and Collector, HPCToolkit, gprof, perf, gperftools, …
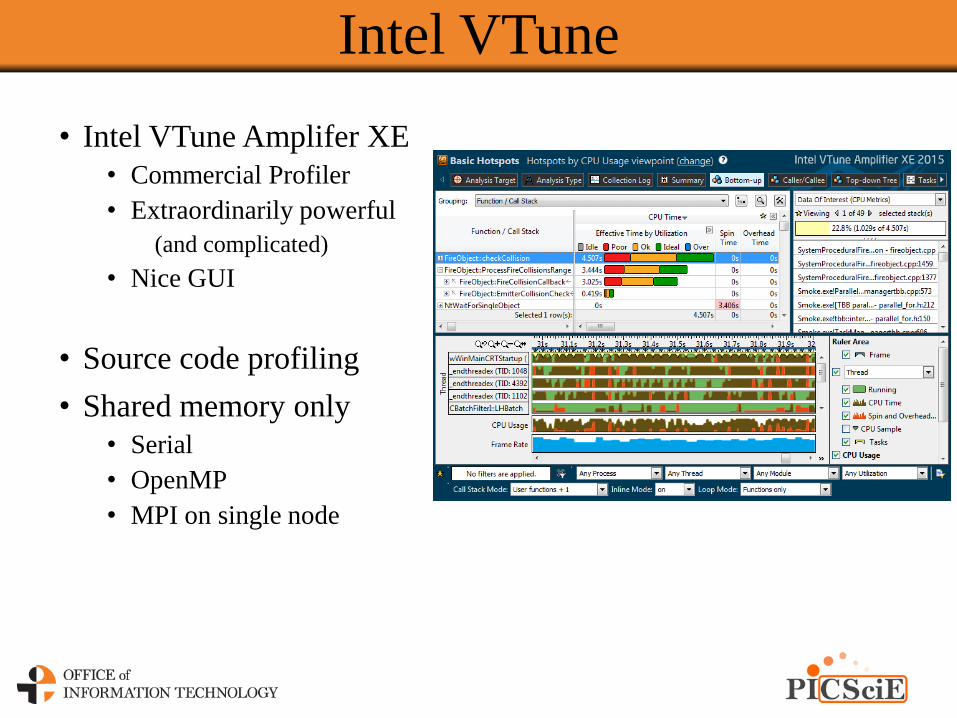
Intel VTune
• Intel VTune Amplifer XE
• Commercial Profiler
• Extraordinarily powerful
(and complicated)
• Nice GUI
• Source code profiling
• Shared memory only
• Serial
• OpenMP
• MPI on single node

Intel Advisor
• Intel Advisor
• Vectorization (and threading) advisor
• Identifies loops to target for vectorization
• Provides efficiency statistics and tips for improvement
• Roofline Analysis (new)
• In many ways it’s a simple profiler + GUI vec-report

Using Profilers
• Strength of all profiling tools revolves around ability to trace performance back to source code
• Need to include debug symbols in executable
• -g flag
• Use release-build optimization flags
• Ex. -O3, -xhost (Intel)
• Don’t waste time optimizing code the compiler can do automatically!
• Sometimes the compiler will optimize out useful regions
• Recommendations:
• -debug inline-debug-info, -debug full (Intel)
• For difficult problems use more than one profiler

Examples
A handful of real(ish) codes to demonstrate profiling:
1. Hotspots
• VTune
2. OpenMP Scaling
• VTune
3. Vectorization
• Advisor
4. Cache performance & Hardware Metrics
• VTune

VTune Example
• Code compiled with -g to enable source code profiling
• Example serial C++ code with:
• No multithreading
• No MPI
• Some I/O
• Use “Basic Hotspots” analysis
• This will be subject of hands-onexercise later

VTune – Profile Result

Bottom-up Tab (Functions)

Bottom-up (Loops)
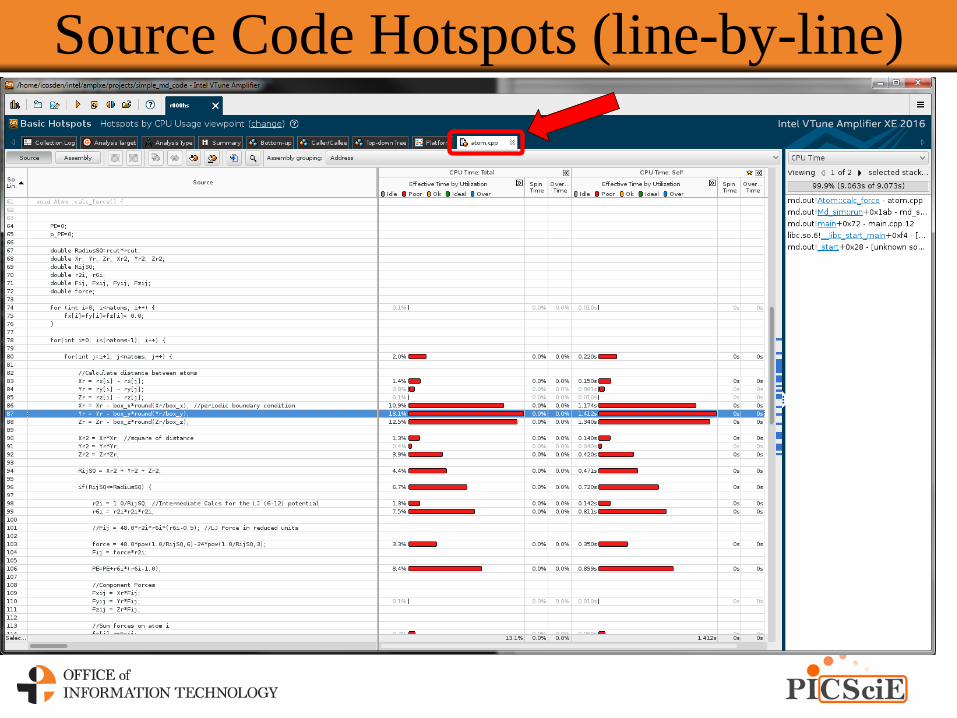
Source Code Hotspots (line-by-line)

Bottom-up – Real Code
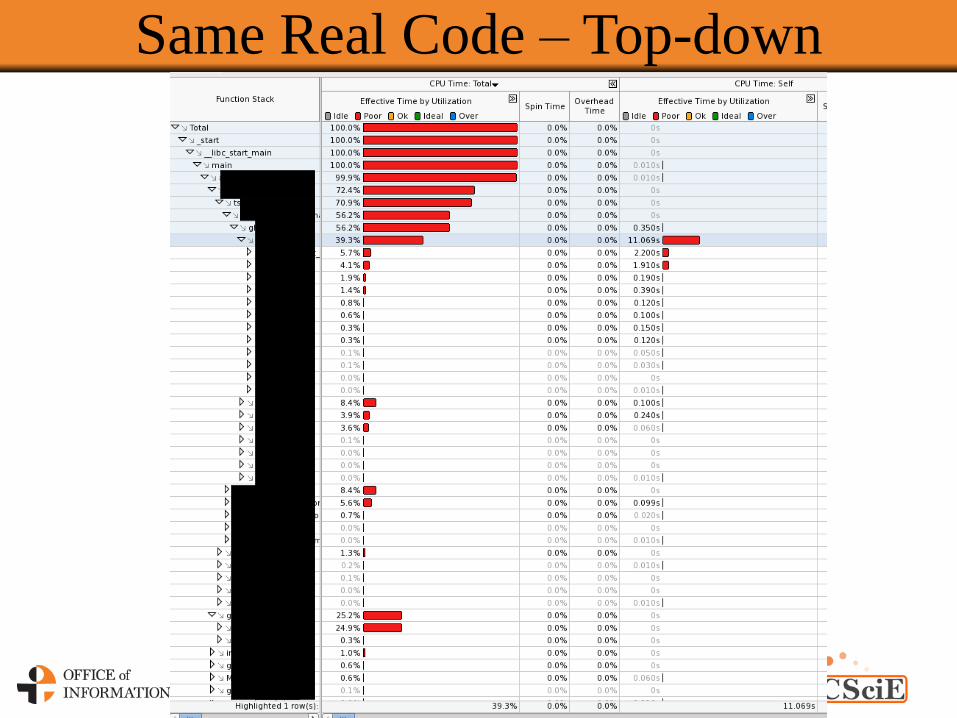
Same Real Code – Top-down

Examples
A handful of real(ish) codes to demonstrate profiling:
1. Hotspots
• VTune
2. OpenMP Scaling
• VTune
3. Vectorization
• Advisor
4. Cache performance & Hardware Metrics
• VTune
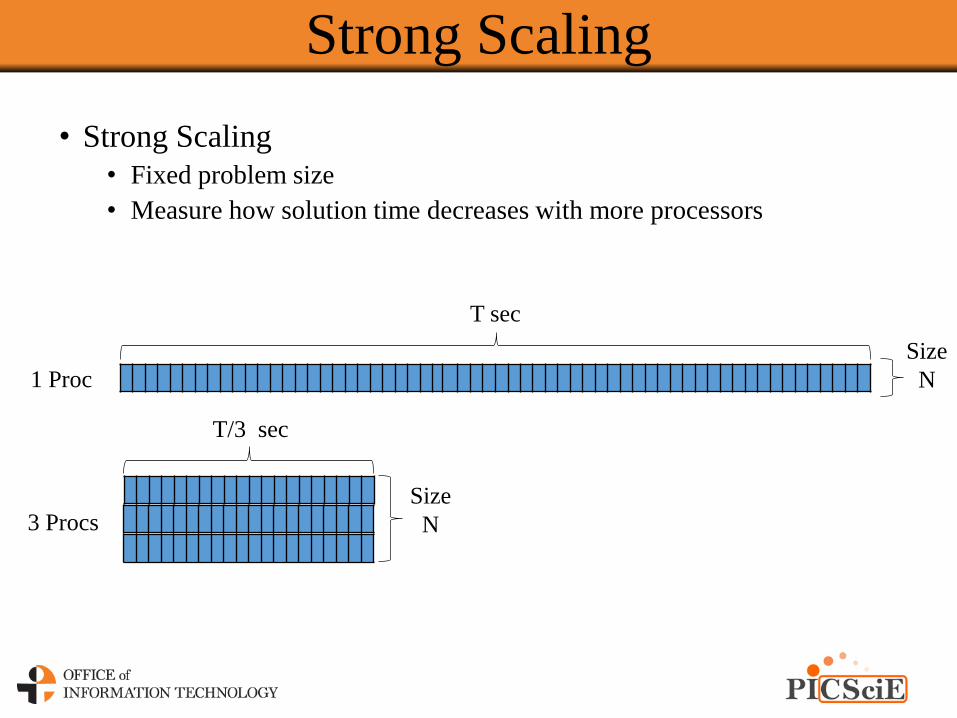
Strong Scaling
• Strong Scaling
• Fixed problem size
• Measure how solution time decreases with more processors
1 Proc
3 Procs
T sec
T/3 sec
Size
N
Size
N
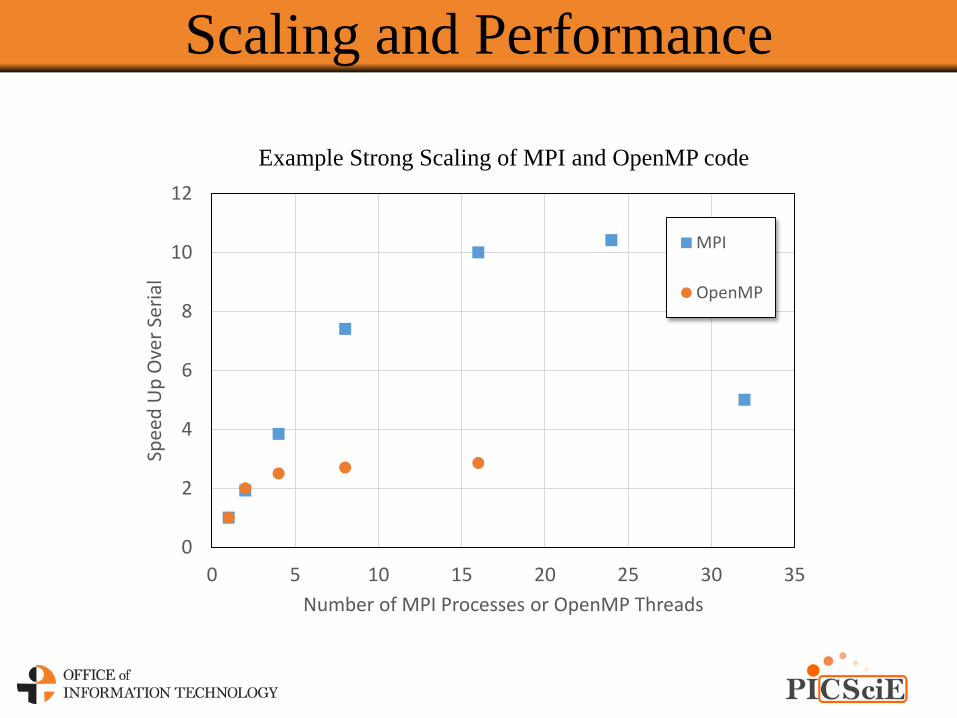
Scaling and Performance
0
2
4
6
8
10
12
0 5 10 15 20 25 30 35
Spee
d U
p O
ver
Seri
al
Number of MPI Processes or OpenMP Threads
MPI
OpenMP
Example Strong Scaling of MPI and OpenMP code
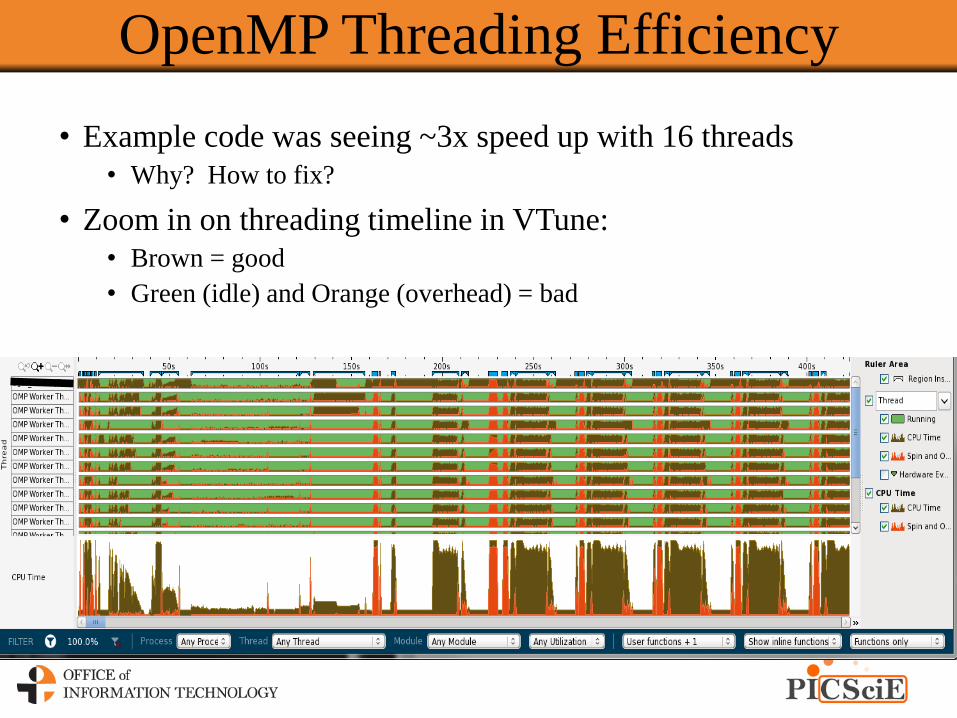
OpenMP Threading Efficiency
• Example code was seeing ~3x speed up with 16 threads
• Why? How to fix?
• Zoom in on threading timeline in VTune:
• Brown = good
• Green (idle) and Orange (overhead) = bad

Examples
A handful of real(ish) codes to demonstrate profiling:
1. Hotspots
• VTune
2. OpenMP Scaling
• VTune
3. Vectorization
• Advisor
4. Cache performance & Hardware Metrics
• VTune

Intel Advisor Example
• Example code compiled with intel compiler with flags: –no-vecand –no-simd
• Purposefully turns off auto-vectorization
• Useful with debugging or performance benchmarking only
• Or faking poorly vectorized code
• Then built normally
• –g (debugging symbols) and all release flags
• Ran on Broadwell node
• AVX2 instruction set (FMA)
• Two, 256-bit vector registers
• Single precision (32 bit) floating point numbers: 8 per register possible

Poorly Vectorized - Advisor

Vectorized - Advisor
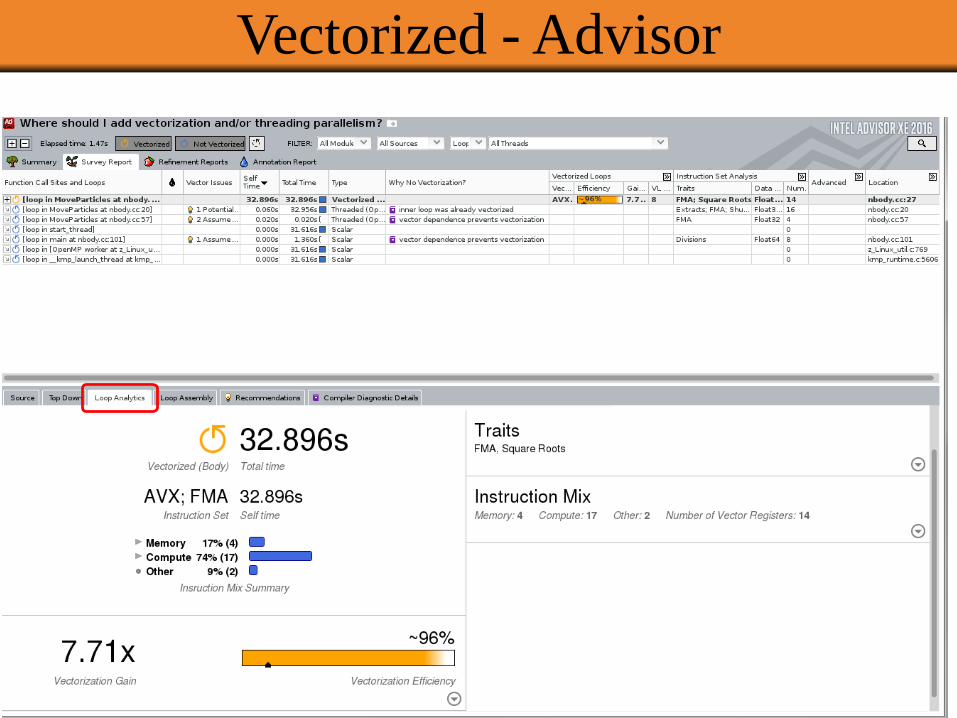
Vectorized - Advisor

Hands-on Exercise
• Goal: Identify hotspots in sample code
• Targets for parallelization and/or optimization
• Test code has 4 functions: mm[1-4]
• Each does a different version of matrix-matrix multiplication C=AxB
• Each function is called a different number of times
• Approximate call frequency:
• mm1: 10%
• mm2: 20%
• mm3: 30%
• mm4: 40%
• Where should we optimize?
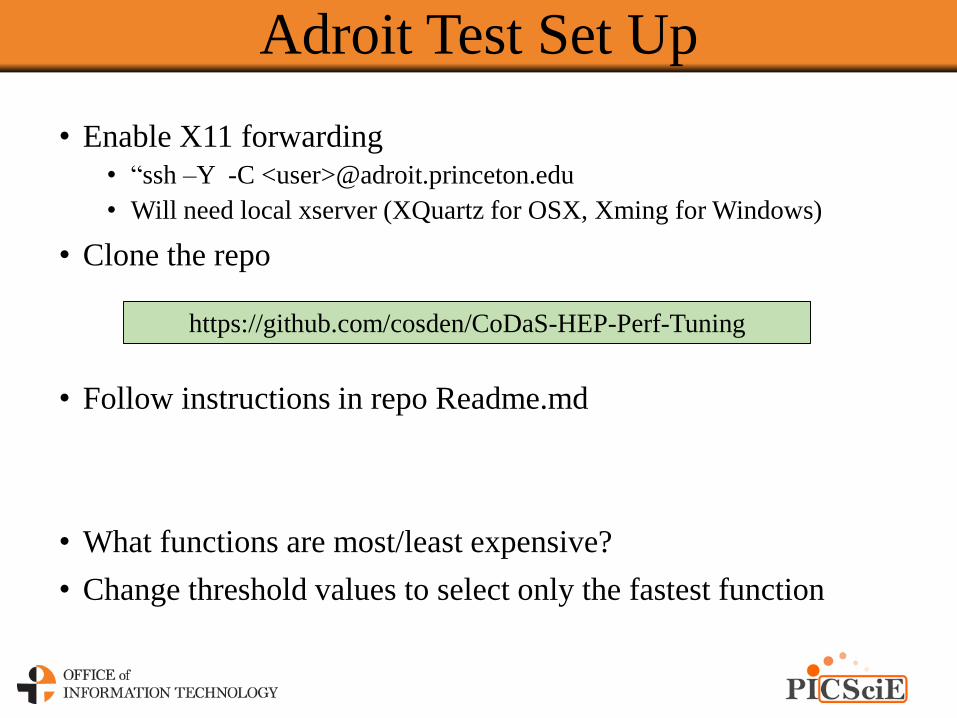
Adroit Test Set Up
• Enable X11 forwarding
• “ssh –Y -C <user>@adroit.princeton.edu
• Will need local xserver (XQuartz for OSX, Xming for Windows)
• Clone the repo
• Follow instructions in repo Readme.md
• What functions are most/least expensive?
• Change threshold values to select only the fastest function
https://github.com/cosden/CoDaS-HEP-Perf-Tuning
Hands-on Discussion
• During a break feel free to try
• GUI on head node
• Other analyses on compute node
• advanced-hotspots
• general-exploration
• Your code?
Examples
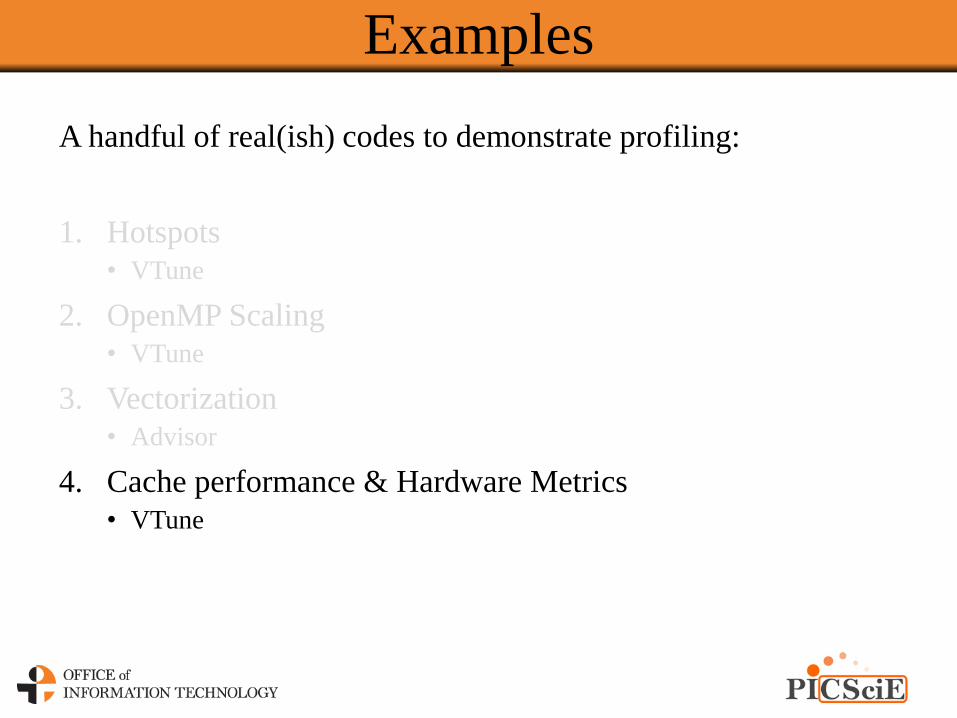
A handful of real(ish) codes to demonstrate profiling:
1. Hotspots
• VTune
2. OpenMP Scaling
• VTune
3. Vectorization
• Advisor
4. Cache performance & Hardware Metrics
• VTune

Hardware Counters
• Basic profilers “sample” the current program counter to see what instruction the cpu is currently executing.
• Then, after collecting enough samples, can give a good approximation as to what the program was doing.
• Performance Hardware Counters
• Special purpose registers to track hardware events
• VTune can access hardware counters
• Other profiling tools can access too, many build on top of open-source PAPI
• Literally hundreds of possible events to measure
• Different in name and meaning for different chips

Hardware Counter Code Example
• 2D Matrix multiplication from before – mm1
• 3 nested for loops
• Let’s assume we don’t know why it is slow or even if it is slow
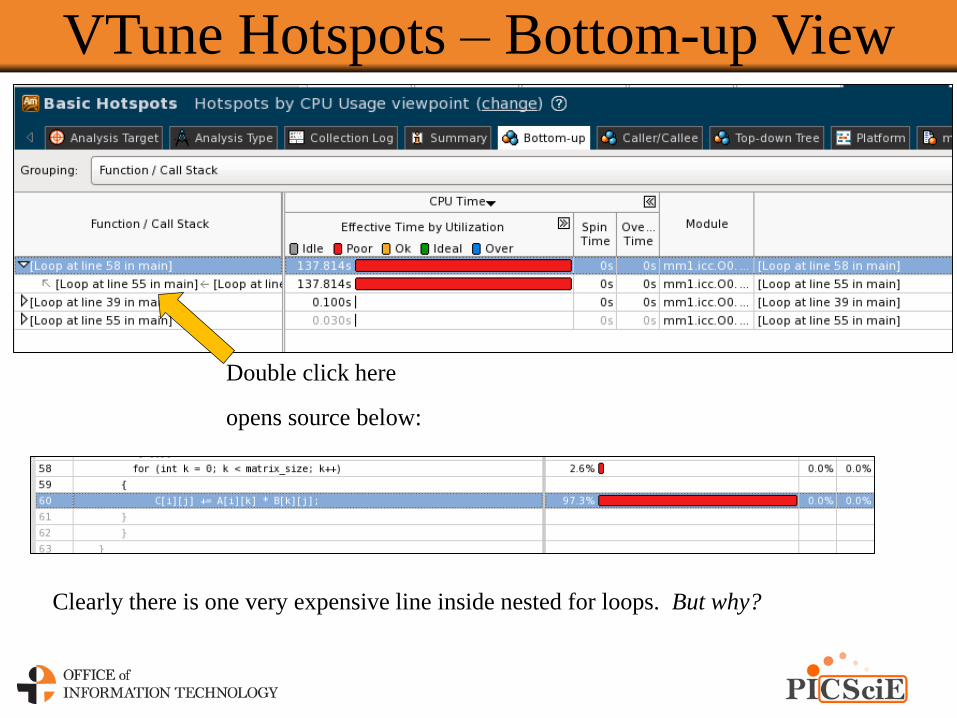
VTune Hotspots – Bottom-up View
Double click here
opens source below:
Clearly there is one very expensive line inside nested for loops. But why?

General Exploration Analysis - VTune
All flagged in pink:
Memory Bound: 49.8%
DRAM Bound: 0.105
Memory Latency: 0.654

Hardware Counters
• Remember every generation of chips has different counters
• VTune developers have calculated derived metrics that they feel best represent real problems• For example the sandybridge/ivybridge hardware counter:
MEM_LOAD_UOPS_RETIRED.LLC_MISS_PS may not truly indicate if the cpu was stalled waiting for the data.
• Colored in pink when they represent a value that might warrant investigation.
• My experience with cache misses:• Memory Bound, DRAM Bound, & Memory Latency together are very
good indicators that cache is not being used well.
• How to fix cache misses? • In this case: Reorder nested loops (mm2)
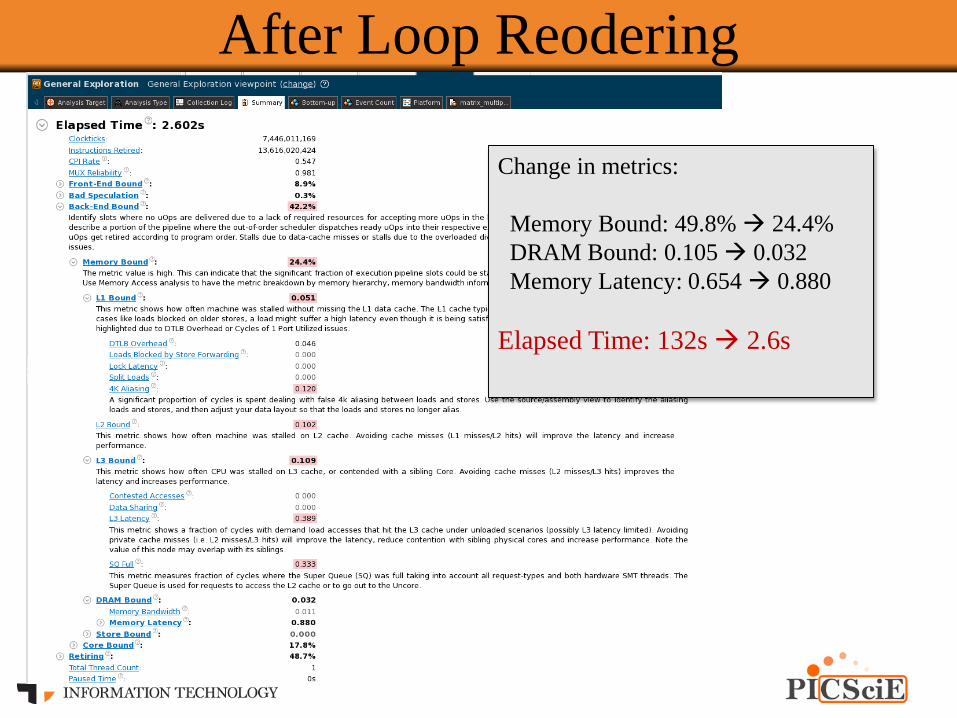
After Loop Reodering
Change in metrics:
Memory Bound: 49.8% 24.4%
DRAM Bound: 0.105 0.032
Memory Latency: 0.654 0.880
Elapsed Time: 132s 2.6s

Results
• Reording nested loops resulted in a better use of cache and a 50x speedup
• Clues in the VTune metrics (hardware counters)
• Note that “optimized” case still showed MANY pink highlighted metrics
• Something will always be limiting performance
• Always requires interpretation and consideration
Final Remarks
• Measurement is key
• Tools are helpful
• Fast computing of wrong results is completely irrelevant!
• Have correctness test(s)
• Test after each modification
• Don’t fall into the “tuning trap”
• Remember what really matters: Total Runtime