Introduction to Pandas
47
PANDAS A POWERFUL DATA MANIPULATION TOOL / / Emma Jason A Myers @jasonamyers
-
Upload
jason-myers -
Category
Technology
-
view
428 -
download
0
Transcript of Introduction to Pandas

PANDASA POWERFUL DATA MANIPULATION TOOL
/ / EmmaJason A Myers @jasonamyers

WHAT'S SO SPECIAL ABOUT PANDAS?1. Tabular/Matrix2. Data Flexibility3. Data Manipulation4. Time Series


INSTALLATIONpip install pandas
pip install pandas as pd

PANDAS DATA STRUCTURESSeries - basically an ordered dict that can be namedDataframe - A labeled two dimensional datatype

SERIESimport pandas as pd
cookies = pd.Series( [ 'Chocolate Chip,' 'Peanut Butter,' 'Ginger Molasses,' 'Oatmeal Raisin,' 'Sugar', 'Oreo', ])

WHAT DOES IT LOOK LIKE?0 Chocolate Chip1 Peanut Butter2 Ginger Molasses3 Oatmeal Raisin4 Sugar5 Oreodtype: object

PROPERTIES>>> cookies.values
array(['Chocolate Chip', 'Peanut Butter', 'Ginger Molasses', 'Oatmeal Raisin', 'Sugar', 'Oreo'], dtype=object)
>>> cookies.index
Int64Index([0, 1, 2, 3, 4, 5], dtype='int64')

SPECIFYING THE INDEXcookies = pd.Series([12, 10, 8, 6, 4, 2], index=['Chocolate Chip', 'Peanut Butter', 'Ginger Molasses', 'Oatmeal Raisin', 'Sugar', 'Powder Sugar'])

INDEXED SERIESChocolate Chip 12Peanut Butter 10Ginger Molasses 8Oatmeal Raisin 6Sugar 4Powder Sugar 2dtype: int64
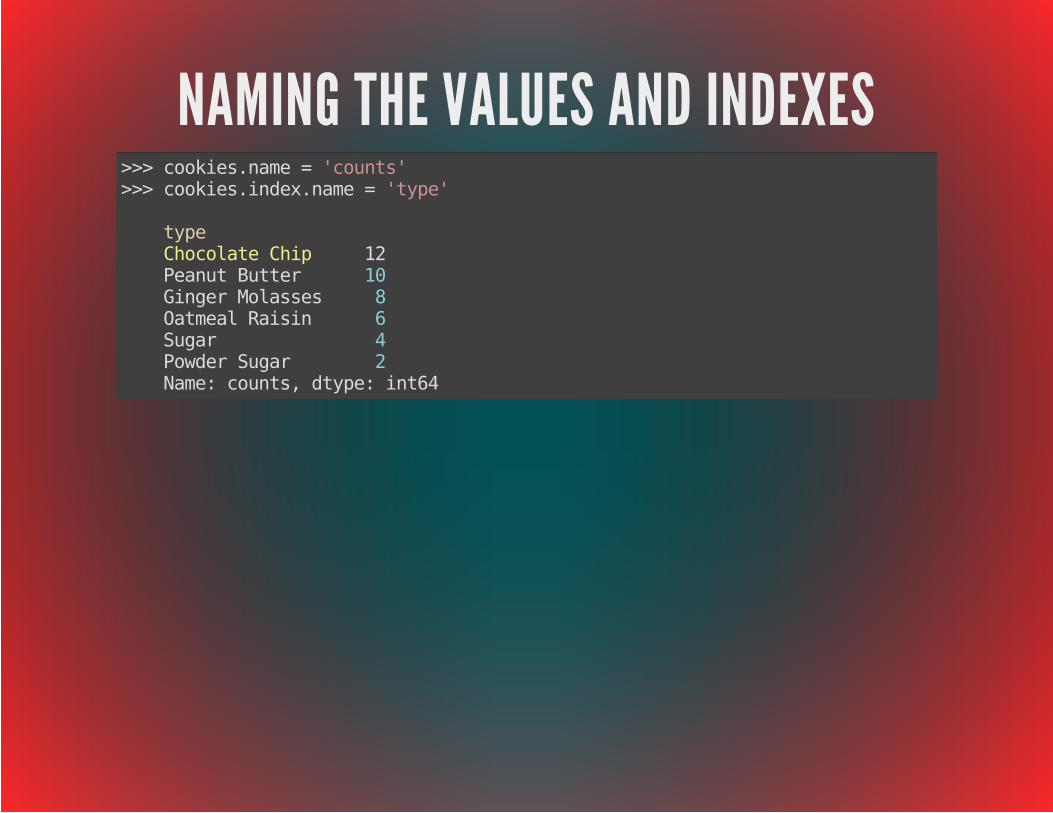
NAMING THE VALUES AND INDEXES>>> cookies.name = 'counts'>>> cookies.index.name = 'type'
type Chocolate Chip 12 Peanut Butter 10 Ginger Molasses 8 Oatmeal Raisin 6 Sugar 4 Powder Sugar 2 Name: counts, dtype: int64

ACCESSING ELEMENTS>>> cookies[[name.endswith('Sugar') for name in cookies.index]]
Sugar 4 Powder Sugar 2 dtype: int64
>>> cookies[cookies > 10]
Chocolate Chip 12 Name: counts, dtype: int64

DATAFRAMESdf = pd.DataFrame({ 'count': [12, 10, 8, 6, 2, 2, 2], 'type': ['Chocolate Chip', 'Peanut Butter', 'Ginger Molasses', 'Oatmeal Raisin', 'Sugar', 'Powder Sugar', 'Sugar'], 'owner': ['Jason', 'Jason', 'Jason', 'Jason', 'Jason', 'Jason', 'Marvin']})
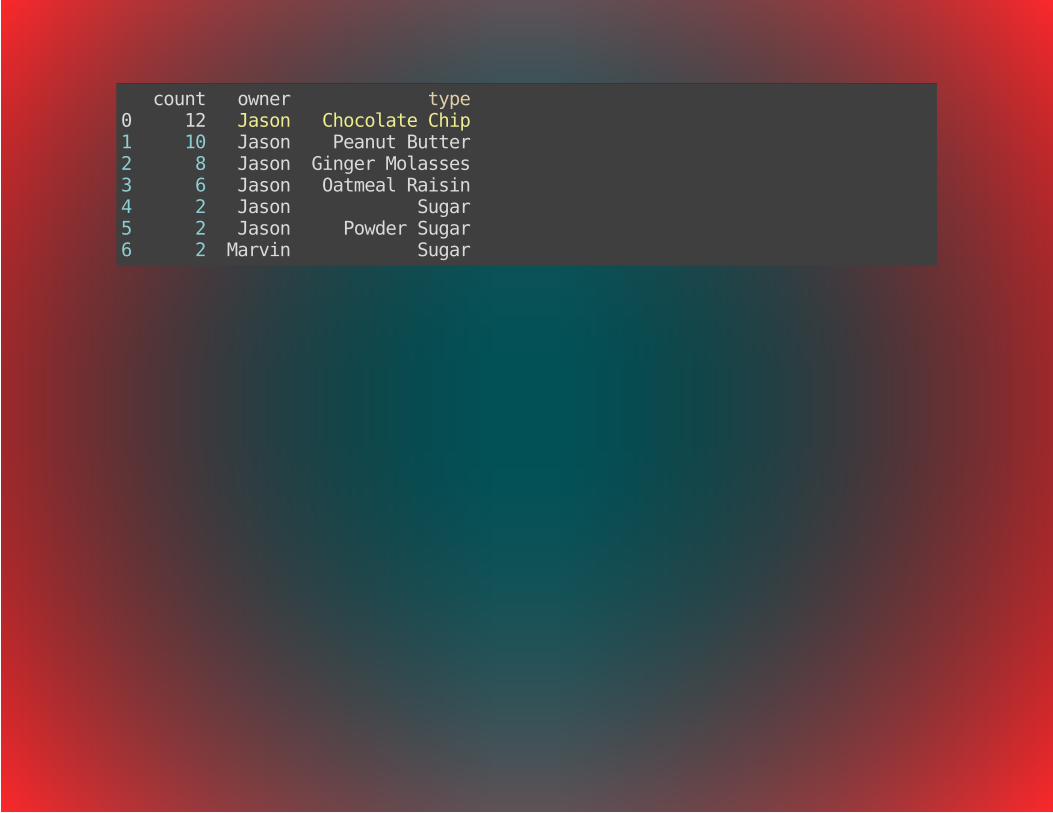
count owner type0 12 Jason Chocolate Chip1 10 Jason Peanut Butter2 8 Jason Ginger Molasses3 6 Jason Oatmeal Raisin4 2 Jason Sugar5 2 Jason Powder Sugar6 2 Marvin Sugar

ACCESSING COLUMNS>>> df['type']
0 Chocolate Chip1 Peanut Butter2 Ginger Molasses3 Oatmeal Raisin4 Sugar5 Powder Sugar6 SugarName: type, dtype: object

ACCESSING ROWS>>> df.loc[2]
count 8 owner Jason type Ginger Molasses Name: 2, dtype: object

SLICING ROWS>>> df.loc[2:5] count owner type 2 8 Jason Ginger Molasses 3 6 Jason Oatmeal Raisin 4 2 Jason Sugar 5 2 Jason Powder Sugar

PIVOTING>>> df.loc[3:4].T 3 4 count 6 2 owner Jason Jason type Oatmeal Raisin Sugar

GROUPING>>> df.groupby('owner').sum()
count owner Jason 40 Marvin 2

>>> df.groupby(['type','owner']).sum()
count type owner Chocolate Chip Jason 12 Ginger Molasses Jason 8 Oatmeal Raisin Jason 6 Peanut Butter Jason 10 Powder Sugar Jason 2 Sugar Jason 2 Marvin 2

RENAMING COLUMNS>>> g_sum = df.groupby(['type']).sum()>>> g_sum.columns = ['Total']
Total sum Chocolate Chip 12 Ginger Molasses 8 Oatmeal Raisin 6 Peanut Butter 10 Powder Sugar 2 Sugar 4
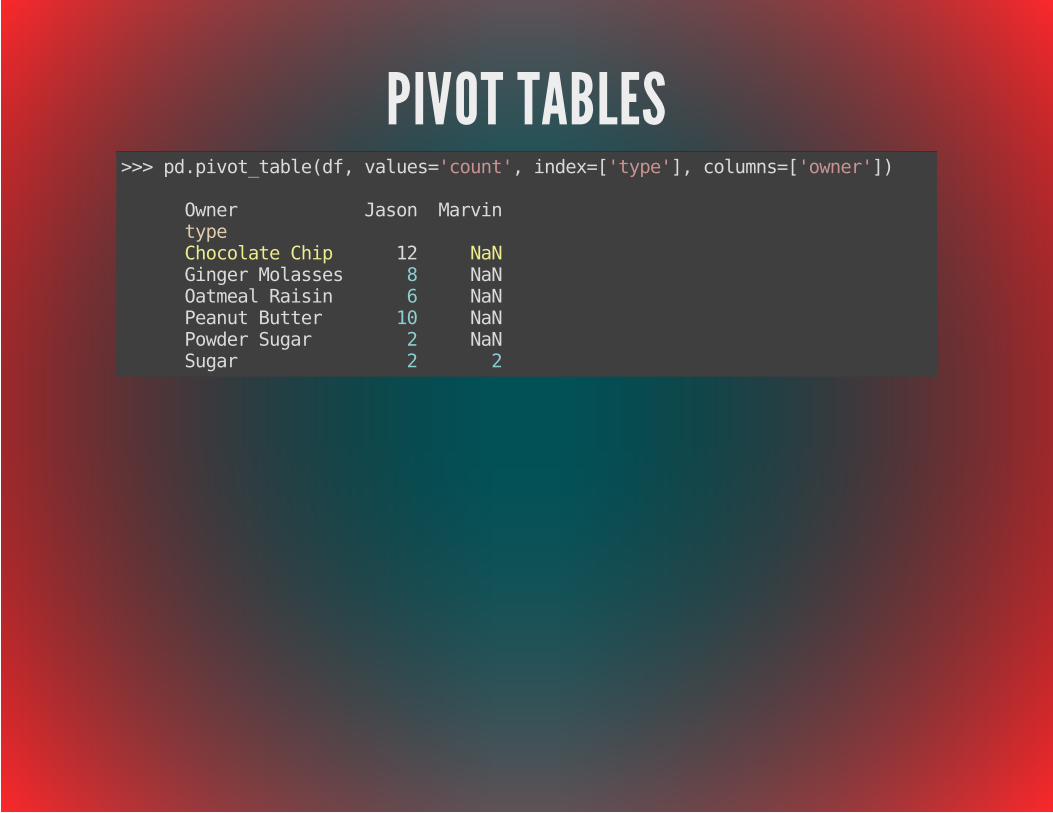
PIVOT TABLES>>> pd.pivot_table(df, values='count', index=['type'], columns=['owner'])
Owner Jason Marvin type Chocolate Chip 12 NaN Ginger Molasses 8 NaN Oatmeal Raisin 6 NaN Peanut Butter 10 NaN Powder Sugar 2 NaN Sugar 2 2

JOINING>>> df = pivot_t.join(g_sum)>>> df.fillna(0, inplace=True)
Jason Marvin Total type Chocolate Chip 12 0 12 Ginger Molasses 8 0 8 Oatmeal Raisin 6 0 6 Peanut Butter 10 0 10 Powder Sugar 2 0 2 Sugar 2 2 4


REAL WORLD PROBLEM


OUR DATASOURCE2014-06-24 17:20:23.014642,0,34,102,0,0,0,602014-06-24 17:25:01.176772,0,32,174,0,0,0,1332014-06-24 17:30:01.370235,0,28,57,0,0,0,752014-07-21 14:35:01.797838,0,39,74,0,0,0,30,0,262,2,3,3,02014-07-21 14:40:02.000434,0,54,143,0,0,0,44,0,499,3,9,9,0

READING FROM A CSVdf = pd.read_csv('results.csv', header=0, quotechar='\'')

datetime abuse_passthrough any_abuse_handled ...0 2014-06-24 17:20:23.014642 0 34 ...
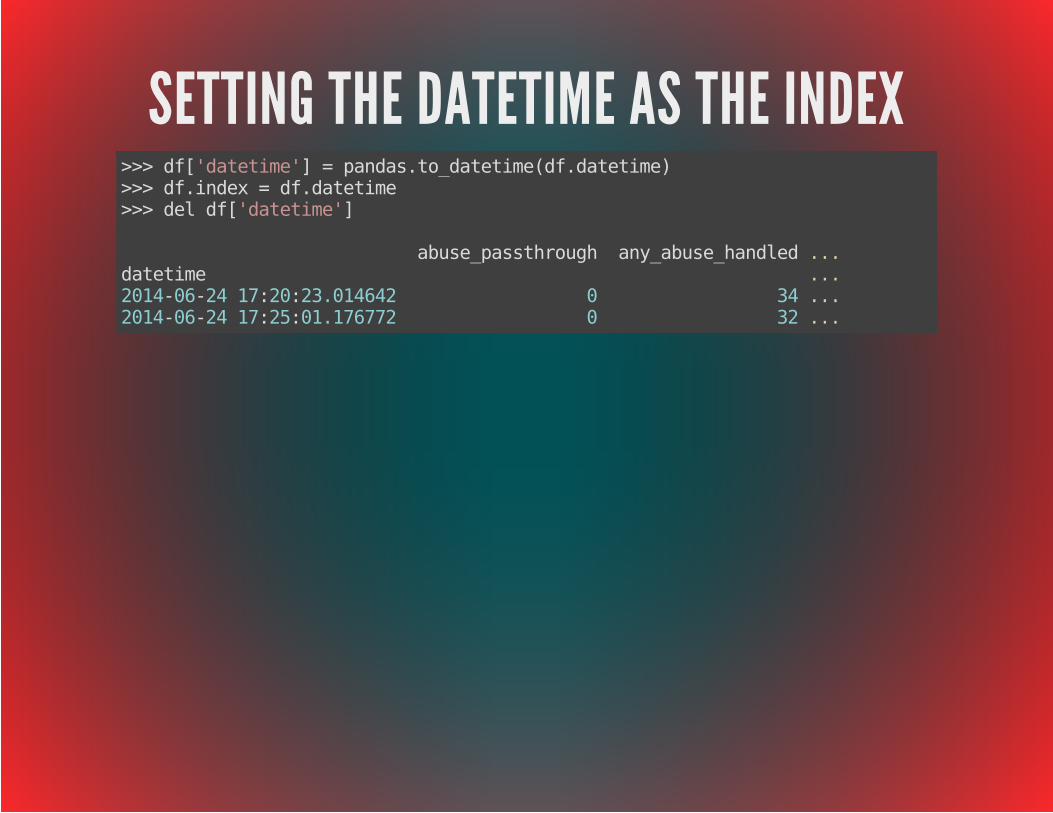
SETTING THE DATETIME AS THE INDEX>>> df['datetime'] = pandas.to_datetime(df.datetime)>>> df.index = df.datetime>>> del df['datetime']
abuse_passthrough any_abuse_handled ...datetime ...2014-06-24 17:20:23.014642 0 34 ...2014-06-24 17:25:01.176772 0 32 ...

TIME SLICING>>> df['2014-07-21 13:55:00':'2014-07-21 14:10:00'] abuse_passthrough any_abuse_handled ...datetime ...2014-07-21 13:55:01.153706 0 24 ...2014-07-21 14:00:01.372624 0 24 ...2014-07-21 14:05:01.910827 0 32 ...

Handling Missing Data Points>>> df.fillna(0, inplace=True)

FUNCTIONS>>> df.sum()
abuse_passthrough 39any_abuse_handled 81537handle_bp_message_handled 271689handle_bp_message_corrupt_handled 0error 0forward_all_unhandled 0original_message_handled 136116list_unsubscribe_optout 71default_handler_dropped 1342285default_unhandled 2978default_opt_out_bounce 22044default_opt_out 23132default_handler_pattern_dropped 0dtype: float64

>>> df.sum().sum()
1879891.0

>>> df.mean()
abuse_passthrough 0.009673any_abuse_handled 20.222470handle_bp_message_handled 67.383185handle_bp_message_corrupt_handled 0.000000error 0.000000forward_all_unhandled 0.000000original_message_handled 33.758929list_unsubscribe_optout 0.017609default_handler_dropped 332.907986default_unhandled 0.738591default_opt_out_bounce 5.467262default_opt_out 5.737103default_handler_pattern_dropped 0.000000dtype: float64

>>> df['2014-07-21 13:55:00':'2014-07-21 14:10:00'].apply(np.cumsum)
abuse_passthrough any_abuse_handled ...datetime ...2014-07-21 13:55:01.153706 0 24 ...2014-07-21 14:00:01.372624 0 48 ...2014-07-21 14:05:01.910827 0 80 ...

RESAMPLING>>> d_df = df.resample('1D', how='sum')
abuse_passthrough any_abuse_handled ... datetime ... 2014-07-07 0 3178 ... 2014-07-08 1 6536 ... 2014-07-09 2 6857 ...

SORTING>>> d_df.sort('any_abuse_handled', ascending=False)
abuse_passthrough any_abuse_handled ... datetime ... 2014-07-15 21 7664 ... 2014-07-17 5 7548 ... 2014-07-10 0 7106 ... 2014-07-11 10 6942 ...

DESCRIBE>>> d_df.describe()
abuse_passthrough any_abuse_handled ... count 15.00000 15.000000 ... mean 2.60000 5435.800000 ... std 5.79162 1848.716358 ... min 0.00000 2174.000000 ... 25% 0.00000 3810.000000 ... 50% 0.00000 6191.000000 ... 75% 1.50000 6899.500000 ... max 21.00000 7664.000000 ...

OUTPUT TO CSV>>> d_df.to_csv(path_or_buf='output.csv')


ONE MORE THING...Vincent
import vincent

CHARTSchart = vincent.StackedArea(d_df) chart.legend(title='Legend') chart.colors(brew='Set3')
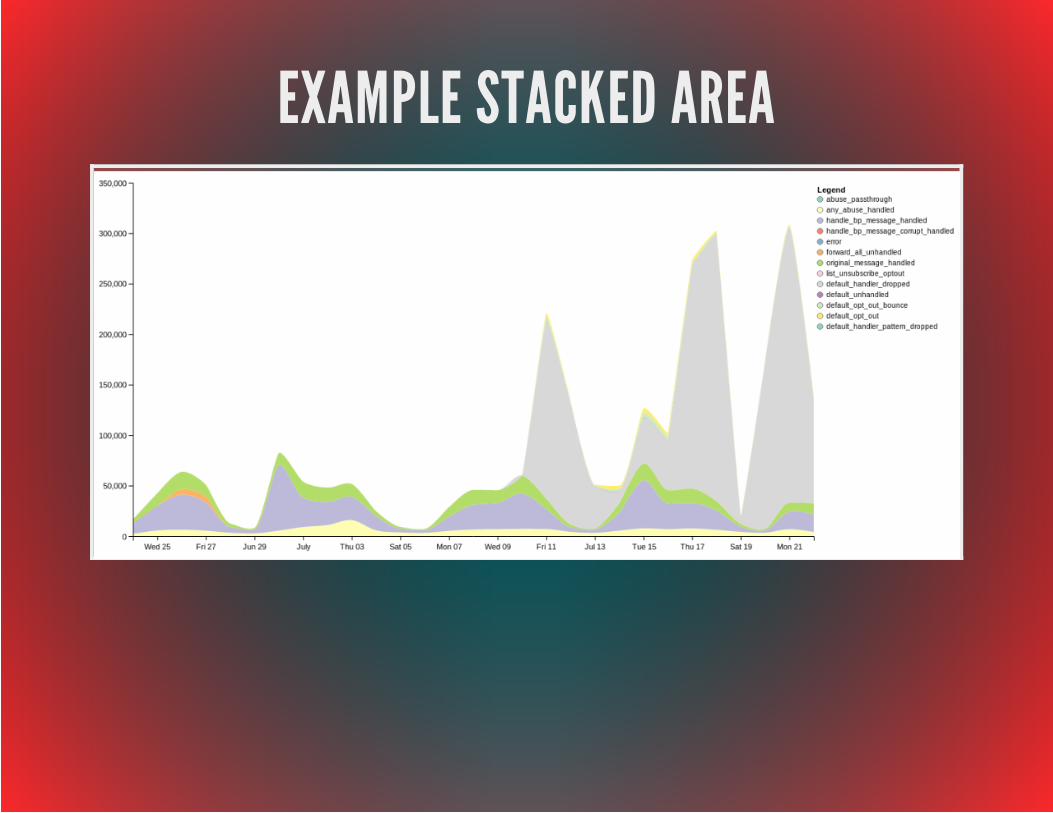
EXAMPLE STACKED AREA

EXAMPLE LINE

EXAMPLE PIE

QUESTIONSJASON A MYERS / @JASONAMYERS