INTRODUCTION TO NETWORK ANALYSIS FOR …liberalarts.oregonstate.edu/sites/liberalarts.oregon... ·...
67
INTRODUCTION TO NETWORK ANALYSIS FOR POLICY RESEARCH Some Network Diagrams Provided with permission by James Moody, Duke University and Lada Adamic, University of Michigan under Creative Commons License Mark Lubell, UC Davis
-
Upload
hoangtuyen -
Category
Documents
-
view
217 -
download
4
Transcript of INTRODUCTION TO NETWORK ANALYSIS FOR …liberalarts.oregonstate.edu/sites/liberalarts.oregon... ·...

INTRODUCTION TO NETWORK
ANALYSIS FOR POLICY RESEARCH
Some Network Diagrams Provided with permission by James Moody, Duke University
and Lada Adamic, University of Michigan under Creative Commons License
Mark Lubell, UC Davis

Outline
What is network analysis?
Network science
Social science theoretical foundations
Network data collection
Three empirical case studies: water management,
sustainable viticulture, climate science
Network analysis workshop for ORA

“How behavior and institutions are affected by social relations is one of the classic
questions of social theory.”—Granovetter, 1985, The Problem of Embeddedness
“One of the most potent ideas in the social sciences is the notion that individuals are
embedded in thick webs of social relations and interactions…the problem of social
order: how autonomous individuals can combine to create enduring, functioning
societies.”—Borgatti et al. 2009, Science
Why Networks?

What is Network Analysis?
Social networks consist of a set of actors and the
relationships or ties between them
Social network analysis (SNA) quantifies the
properties of a network to understand how it
functions
SNA assumes that social structure matters in shaping
in individual behavior

Think Relationally
• Relation: A property of two or more entities
– Linkage – Tie
– Interaction
– Connection
– Relationship
– Association
– Involvement …
A
B
C D
E
Generality of a
relational perspective
16 Slide courtesy of Katherine Faust, UC Irvine

17
Elements of a Social Network
• Actors – social units
• Relations – ties between or among actors
A
B E
C D
Slide courtesy of Katherine Faust, UC Irvine

Graph and sociomatrix
A
B
C D
E
7
Actors
Act
ors
A B C D E A 1 B 1 1 1 C 1 1 1 D 1 E 1 1
Slide courtesy of Katherine Faust, UC Irvine

Graph and sociomatrix
A
B
C D
E
8
Actors
Act
ors
A B C D E A - 0 1 0 0 B 0 - 1 1 1 C 1 1 - 0 1 D 0 1 0 - 0 E 0 1 1 0 -
Slide courtesy of Katherine Faust, UC Irvine

Network Science
Computer science, physics, mathematics, social
sciences, natural sciences—a merger is occuring
Graph theory
Erdos-Renyi (Bernoulli) random graph
Barabasi-Albert Model of preferential attachment
Watts-Strogatz small-world networks
“scale-free” degree distributions
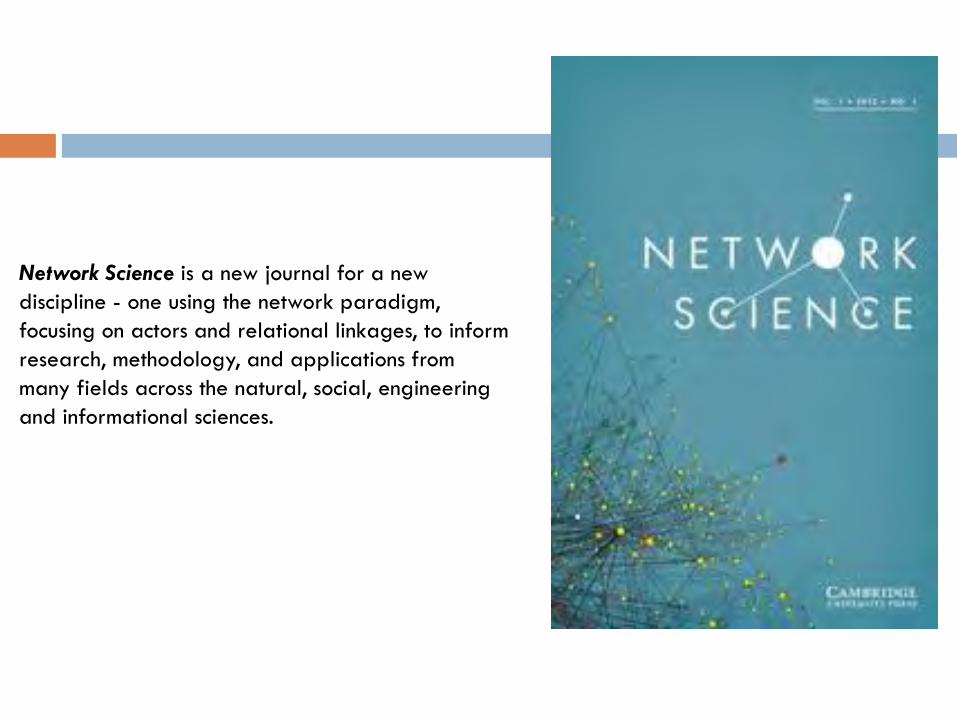
Network Science is a new journal for a new
discipline - one using the network paradigm,
focusing on actors and relational linkages, to inform
research, methodology, and applications from
many fields across the natural, social, engineering
and informational sciences.

Random Graph Models
Erdos Renyi
Barbasi Albert preferential attachment

Small World Networks

Theoretical Perspectives in Social
Science
Evolution of cooperation: reciprocity, multi-lateral relationships, long time horizon
Social capital: trust, reciprocity, and networks of civic engagement
Common pool resource management: Cooperation and local institutions needed to
overcome tragedy of commons and provide local public goods
Resilience: Capacity of social-ecological systems to bounce back after shock and
adapt to change; also important concept in network theory in physics and computer
science
Value chains: In a food system, the links between producers and consumers as food
moves through system—rightly viewed as “value networks”
Diffusion of innovation: Information of about innovations diffuses through social
networks
Communities of practice: Communities knit together to address common problems
and share knowledge about practices
Weak ties and structural holes: Closure versus search in networks

Policy Networks Framework

Scientific Consensus and Questions
Everybody thinks that networks matter, especially for
environmental policy
Density, reciprocity, and overall “social distance” seem to be
fairly well accepted
Less consensus on role of transitivity and clustering; probably
useful to have a some level of transitivity and clustering to
maintain local cooperation
Less consensus on bridging-bonding; you generally want to
increase bridging but system will be brittle without at least
some bonding
Optimal tradeoffs could depend heavily on context

16 16
Network Data Collection
Informant reports Questionnaire or interview
Systematic observation
Archival records
Experiment
Other Link trace
Small world
Diary
Sensors
Slide courtesy of Katherine Faust, UC Irvine

17 17
Questionnaire / Interview
Roster vs. Free-recall (name generator)
List of population members or not
Fixed choice vs. free choice
Fixed number of nominations or not
Fixing number of nominations is generally a bad idea
Dichotomous or valued
Rating, ranking
Pros and cons …
Slide courtesy of Katherine Faust, UC Irvine

18
Roster vs. free recall
Roster:
Below are the names of members of your work group. Which of them do you socialize with?
Ann
Bob
Carlos
Diana
Free recall (name generator):
Think of the members of your work group. Name the ones you socialize with.
Slide courtesy of Katherine Faust, UC Irvine

19
Fixed vs. free choice
Fixed choice
Please indicate your
three closest friends.
Free choice
Please indicate the
people who you
consider to be friends.
You may name as
many or as few as you
wish.
Slide courtesy of Katherine Faust, UC Irvine

20 20
Ties between people dichotomous, free
list
Asked of each person in the network
“Who would you go to for advice at work?”
“Who, at work, do consider your friends?”
Krackhardt high-tech managers network Slide courtesy of Katherine Faust, UC Irvine

21 21
Ties between people
valued, roster
Each person was asked to indicate for each other
person whether he/she:
0) did not know the other
1) had heard of the other but had not met him/her
2) had met the other
3) was a friend of the other
4) was a close personal friend of the other
Freeman et al. EIES network Slide courtesy of Katherine Faust, UC Irvine
Three Case Studies
Water management in an “ecology of games”
(Lubell, Robbins, Weng)
Sustainable Viticulture in California (Lubell,
Hoffman, Hillis)
Climate change networks (Lubell, Schwartz, Peters)

IRWM
Bay Area
Water
Forum
Bay Area Joint
Venture
Sonoma Creek
TMDL

Core Hypotheses
Institutions hypothesis: Collaborative institutions
designed for policy coordination are more central in
the network
Actor hypothesis: Actors with greater capacity have
more power in the network
“Risk” hypothesis (Berardo and Scholz 2010):
Network closure facilitates cooperation

Affiliation Network Analysis
Focuses on actors choosing to be in games
Exponential Random Graph Models: Compare observed frequencies of different “network” configurations to predictions from different “null” models
Key network processes: Activity (average degree), centralization(variance in degree), and closure (clustering)
Hypothesis tests:
Government agencies and collaborative institutions should have highest activity, most central, and most closure
Network closure structures more prevalent than expected from simple “random” process

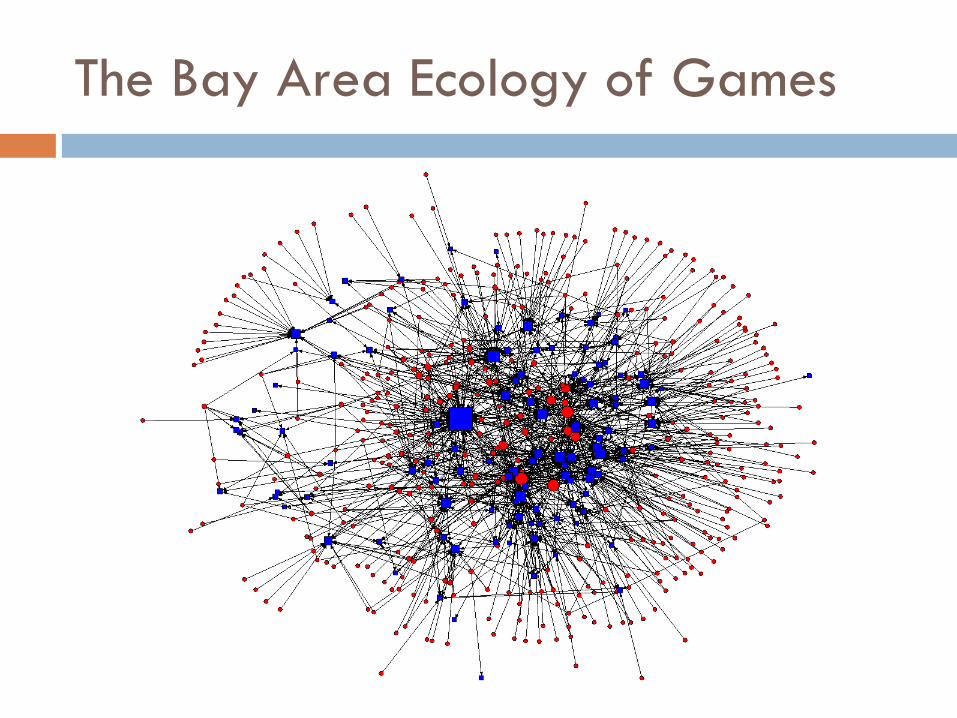
The Bay Area Ecology of Games

Most Central Nodes

Centrality by Type (Species)

Table 2: ERGM Model Parameter Estimates
Naïve Actor Model
Political Capacity Model
Strategic Decision Model
Strategic Geography Model
General Parameters
Density -3.88 (0.03)* -3.75 (0.07)* -7.01 (0.35)* -5.77(0.36)*
Centralization (actors) --- --- 0.61 (0.11)* -0.21(0.11)
Centralization (institutions) --- --- 1.36 (0.18)* 0.56(0.18)*
Closure (actors) --- --- -0.19(0.05)* -0.06(0.04)
Geographic Centralization --- --- --- 1.57(0.05)*
Actor Type Activity Parameters (Local Government is Excluded Category)
Federal Government --- 0.45 (0.15)* 0.43 (0.16)* 1.82(0.18)*
State Government --- 0.19 (0.14) 0.16 (0.13) 1.35(0.16)*
Water Special District --- 0.13 (0.09) 0.12 (0.09) 0.42(0.10)*
Environmental Special District --- 0.29 (0.17) 0.26 (0.17) 0.46(0.19)*
Environmental Group --- -0.18 (0.10) -0.16 (0.09) -0.01(0.10)
Industry Group --- -0.59 (0.26)* -0.50 (0.23)* 0.05(0.29)
Education/Consulting --- -0.40 (0.18)* -0.32 (0.17) -0.06(0.19)
Actor Coalition --- -0.03 (0.34) -0.03 (0.33) 0.44(0.38)
Other Activity --- 0.07 (0.48) 0.11 (0.43) 1.33(0.54)*
Institution Type Activity Parameters(Collaborative Partnership is Excluded Category)
Interest Group Association Activity --- -0.22 (0.10)* -0.09 (0.09) -0.04(0.06)
Advisory Committee Activity --- -0.16 (0.12) -0.10 (0.11) -0.03(0.06)
Regulatory Process Activity --- -0.78 (0.16)* -0.61(0.15)* -0.36(0.12)*
Actor as Venue Activity --- -0.70 (0.19)* -0.47 (0.16)* -0.26(0.13)*
Joint Powers Authority Activity --- 0.16 (0.16) 0.15 (0.15) 0.06(0.10)
Note: Cell entries are ERGM parameter estimates with standard errors in parentheses. All models are estimated with “exogenous hubs”, with fixed degree distributions for nodes with greater than 20 edges. *Reject null hypothesis of parameter=0, p<.05.

Residual Analysis: Federal
Government Actors in Strategic
Geography Model

Table 3: Residual Analysis Showing T-Statistics Greater Than Two
Centralization Closure
Actor Types
Federal Government 4.7
State Government 2.0 4.2
Local Government 14.0
Water Special District 4.8 25.9
Environmental Special District
Environmental Group 6.9
Industry Group
Education/Consulting
Actor Coalition
Other Activity
Institution Types
Interest Group Association 17.5
Collaborative Partnership 8.9
Advisory Committee
Regulatory Process
Actor as Venue
Joint Powers Authority
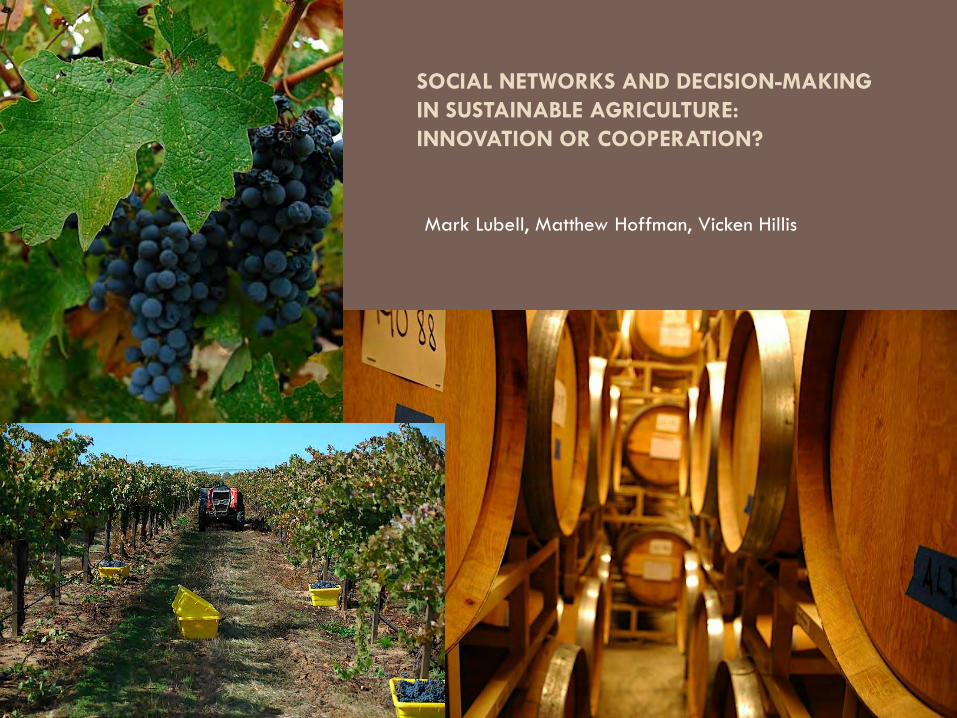
SOCIAL NETWORKS AND DECISION-MAKING
IN SUSTAINABLE AGRICULTURE:
INNOVATION OR COOPERATION?
Mark Lubell, Matthew Hoffman, Vicken Hillis

Sustainable Viticulture
Partnerships in California
Integrated Pest Management
Self Assessment Workbooks
Third-party Certification
Statewide Program

Sustainability Partnerships:
Lodi, Central Coast, Napa
Social Networks: Information
and Cooperation
Sustainable Practice
Adoption: Individual and
Social Benefits
Question 2: Restructuring
Social Networks
Question 1: Diffusion or
Cooperation
Question 3: Participation
Increases Adoption Rate
Conceptual Framework

0%
10%
20%
30%
40%
50%
60%
70%
80%
90%"Very useful" "Never used"
0% 10% 20% 30% 40% 50% 60% 70%
Published material
Organizations
Personal relationships
Personal experience

Lodi Grower
Knowledge
Network

n=46
n=25
n=140
0.00
0.05
0.10
0.15
0.20
0.25
Both Outreach Grower
n=1
n=32 n=9 n=10 n=3 n=13 n=8
0.00
0.20
0.40
0.60
0.80
1.00
1.20
Average
Centrality by
Type
Average Centrality of
Outreach Professions

Napa
Valley
Network


Vic
ken
Hillis, D
isse
rta
tion
Ana
lysi
s

Traditional Extension Model
University Scientist
County Advisor
Farmer
Carr, Anna, and Roger Wilkinson. 2005. "Beyond Participation:
Boundary Organizations as a New Space for Farmers and Scientists to
Interact." Society & Natural Resources 18 (3): 255-265.
“For many years agricultural
science assumed that research
was done by scientists,
repackaged by extension
officers, and launched at
farmers. Both their knowledge
systems and cultural roles were
seen as different. Nowadays
their roles are converging and
their boundaries are eroding.”--

Extension 3.0 as a Knowledge Network

Climate Science Networks and Public Lands
(with Mark Schwartz and Casey Peters)
Public lands management must adapt to climate change
National programs are pushing local land management
units in various ways, with national-level coordination
DOI Landscape Conservation Cooperatives
Science network programs created by USGS (Climate
Science Centers) and NOAA (RISAS)


Intermountain West Region of NPS

Figure 2. Management Consequences of Physical Climate Change Impacts
Figure 3. Management Consequences of Biological Climate Change Impacts

Conclusion: Networks Matter!
Networks mediate between institutions and individual behavior
Crucial for cooperation and innovation/learning in environmental policy
Decent tools available for studying structure of networks
Important frontiers: longitudinal, comparative, dealing with missing data, mathematical models, network management, connecting with outcomes

Network Analysis Definitions
•Nodes/Actors
•Edge/Ties/Relationship
•Binary/Dichotomous Network
•Valued Network
•Graphs/Networks
•Adjacency Matrix
•Directed Network
•Undirected Network
•Sociogram/Network diagram
•Attributes
Receiver 1 (AED)
Receiver 2 (USAID)
Receiver 3 (NGO)
Sender 1 (AED) Diagonal; self reference
0 1
Sender 2 (USAID)
1 Diagonal; self reference
0
Sender 3 (NGO)
1 1 Diagonal; self reference

Gettin
g D
ata
Int
o O
RA
Procedure: FileData Import WizardTable Data from Excel or text Rectangle of link weights Click through “next” buttons entering required infoEnter filename with “agent to agent” designation

Ad
d A
ttrib
utes
Procedure: Select “Agent” nodeSelect “Editor” tabClick Attributes “Import” Select “file” to importMake sure the first column in attribute file has same labels as network rows; ORA uses them as an index (I think)

Manage Data
Choices depend on application
Remove isolates (for example, if you have missing
survey data)
Binarize (if valued data don’t add info)
Symmetrize (if directional data doesn’t matter)
Procedure: Select “Data Management” menuSelect “Metanetwork transform”Select appropriate check boxes

Netw
ork
Vis
ualiz
ation
Procedure: Select “AgentXAgent” nodeClick Visualize this NetworkPlay with all kinds of things (Color nodes by attribute, size nodes by centrality, eliminate isolates)


Descriptive Statistics for Networks
Just like descriptive stats for ordinary, rectangular
data
Network level stats
Node level stats
Community Detection
Statistical models (not covered here)

Network Density
Density: Number of ties present divided by
maximum
For example, out of 12
possible connections, this graph
has 7, giving it a density of
7/12 = 0.583
Click to highlight your metanetwork( however named) Generate ReportsStandard Network Analysis Click through options to the end
Procedure

Reciprocity
Ratio of number of edges that are reciprocated over total number of relations in a network
In this example, there are 1/3 are reciprocal
Click to highlight your metanetwork( however named) Generate ReportsStandard Network Analysis Click through options to the end
Procedure

Average Path Length
The length of a path between two nodes is a count of the number edges that connects them. The distance between two nodes is the shortest path.
Average distance is the average of the shortest path for all pairs of nodes
In example, there is one path from blue to green of length 2 (shortest path) and another of length 3
Average distance for a node is the average of the shortest path lengths to all other nodes
Average (or characteristic) path length is the average of the average distance for the nodes
Click to highlight your metanetwork( however named) Generate ReportsStandard Network Analysis Click through options to the end
Procedure

Local and Global Clustering
The local clustering coefficient calculates the average density of ties between nodes directly adjacent (local neighborhood) to a focal node (ego), excluding the ties to the node itself
In the example, the blue node is the ego and red nodes are the local neighborhood. Density of ties (blue arrows) in local neighborhood is 2/6; cohesion averages this score overall all ties
Global clustering (UCINET cohesion): Average of the local clustering
High clustering relative to density is linked to sub group formation
Click to highlight your metanetwork( however named) Generate ReportsStandard Network Analysis Click through options to the end
Procedure

Network Transitivity
Three nodes (a triple) i,j,k are transitive if whenever node i is connected to node j and j is connected to k then vertex i is connected to vertex k.
The density of transitive triples is the number of triples which are transitive divided by the number of paths of length 2, i.e. the number of triples which have the potential to be transitive.
A triple is transitive if:
If iJ and Jk, then
ik
i k
J
i k
J
Valued Networks (note possible bug in
UCINET as of November 10, 2010 but they claim it was fixed)
Binary Networks
Procedure NetworkCohesionTransitivitySelect "Strong" Enter your "Filename"
NetworkCohesionTransitivitySelect "Adjacency" Enter your "Filename"
Output Transitivity: % of ordered triples in which i-->j and j-->k that are transitive
Transitivity: % of ordered triples in which i-->j and j-->k that are transitive
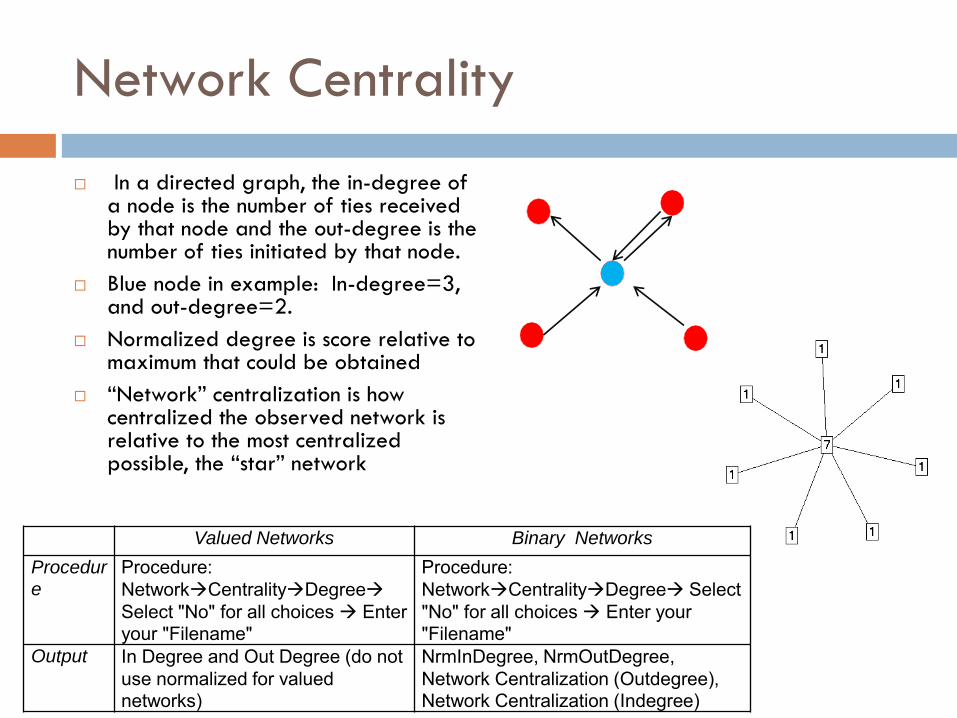
Network Centrality
In a directed graph, the in-degree of a node is the number of ties received by that node and the out-degree is the number of ties initiated by that node.
Blue node in example: In-degree=3, and out-degree=2.
Normalized degree is score relative to maximum that could be obtained
“Network” centralization is how centralized the observed network is relative to the most centralized possible, the “star” network
Valued Networks Binary Networks
Procedur
e Procedure: NetworkCentralityDegree Select "No" for all choices Enter your "Filename"
Procedure: NetworkCentralityDegree Select "No" for all choices Enter your "Filename"
Output In Degree and Out Degree (do not use normalized for valued networks)
NrmInDegree, NrmOutDegree, Network Centralization (Outdegree), Network Centralization (Indegree)

Centrality-Betweenness
Valued Networks Binary Networks
Procedure NA Procedure: NetworkCentralityFreeman Betweenness Node Betweenness Enter your "Filename"
Output NA nBetweenness, Network Centralization Index
A B C E D A lies between no two other vertices
B lies between A and 3 other vertices: C, D, and E
C lies between 4 pairs of vertices (A,D),(A,E),(B,D),(B,E)
A particular node is “between” another pair if it sits on the shortest path between the other pair
For each node, betweenness is a sum of the fraction of shortest paths between other pairs on which that node sits
Normalized betweenness is relative to the maximum that could be obtained
“Network” centralization is how centralized the observed network is relative to the most centralized possible, the “star” network

External-Internal (E-I) Index
Valued Networks Binary Networks Procedure Procedure: NetworkCohesionE-I
IndexEnter Your Attribute "Filename" Enter your Network Filename "Filename"
Procedure: NetworkCohesionE-I IndexEnter Your Attribute "Filename" Enter your Network Filename "Filename"
Output Re-scaled E-I Index, smallest value of p-values in permutation test table, group-level E-I indexes for each stakeholder group
Re-scaled E-I Index, smallest value of p-values, in permutation test table group-level E-I indexes for each stakeholder group
The E-I index provides a measure of the relative number of relationships within a
group (bridging), versus out-group ties that cross group boundaries (bonding).
The E-I index calculates the number of out-group ties, subtracts the number of in-
group ties, and then divides by the total number of ties in the network.
For example, if there are 20 ties in the whole network and 2 groups with all in-group
ties, the E-I index would be [0 (out-group)-20 (in-group)/20]=-1. If all ties were out-
group, then the E-I index would be [20 (out-group)-2 (in-group)/20]= +1. The E-I
index thus ranges between -1 and 1, and directions of ties are ignored.

Ego Networks
Valued Networks Binary Networks
Procedure N/A Procedure: NetworkEgonetEgonet Basic Measures Select "Undirected"Enter your Network Filename "Filename"
Output N/A Size, Ties, Density, and nBetweeneness for all nodes
Ego-networks are the local neighborhood of a
particular node; for example the blue node in the
diagram
Ego-networks are good for participatory planning or
isolating a particular organization for some contextual
reason
Ego-network analysis in UCINET looks at the binary
networks, and calculates a variety of relevant stats for
each ego-network
Visualization of Ego-Networks is done from NetDraw

Advanced Topics
Structural holes
Group detection algorithms, e.g., cliques, Newman-
Girvan, multidimensional scaling, structural
equivalence
QAP correlation and regression
Exponential random graph and other statistical
models

Software
UCINET—most basic and user friendly
R, statnet and other packages
ORA—newer program, very nice graphics, lots of
interesting descriptive stats
PAJEK—large networks, heavily used
MELNET, statistical models
SIENA, actor-oriented models, ERGM (but now in R)
Many others…