INTRODUCTION TO MICROSOFT EXCEL FOR BEGINEER
14
Microsoft Excel is a spreadsheet application developed by Microsoft for Microsoft Windows, Mac OS, and iOS.
-
Upload
besor-academy -
Category
Documents
-
view
66 -
download
0
Transcript of INTRODUCTION TO MICROSOFT EXCEL FOR BEGINEER

Microsoft Excel is a spreadsheet application developed by Microsoft for Microsoft Windows, Mac OS, and iOS.

Microsoft (MS) Excel is a powerful spreadsheet that is easy to use and allows you to store, manipulate, analyze, and visualize data. You may not yet be familiar with this program.
Microsoft Excel has the basic features of all spreadsheets, using a grid of cells arranged in numbered rows and letter-named columns to organize data manipulations like arithmetic operations
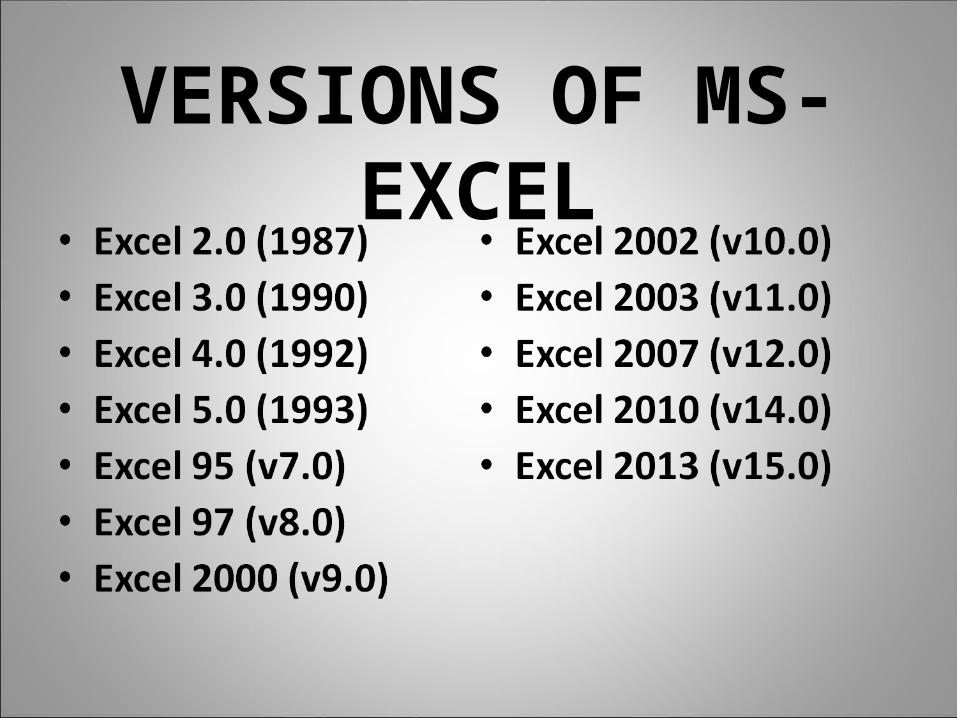
VERSIONS OF MS-EXCEL

What's Good About It?
• Using Excel can enhance understanding of content within a graphic presentation of the information; it provides a visual representation of data that makes it easier to analyze.
• Excel reduces the difficulty of plotting data and allows students a means for interpreting the data.
• Excel's ability to dynamically generate charts and graphs in seconds makes it easy to quickly demonstrate relationships between numbers.
• As a teaching tool, students can see how different types of graphs and charts can be used to represent the same series of data
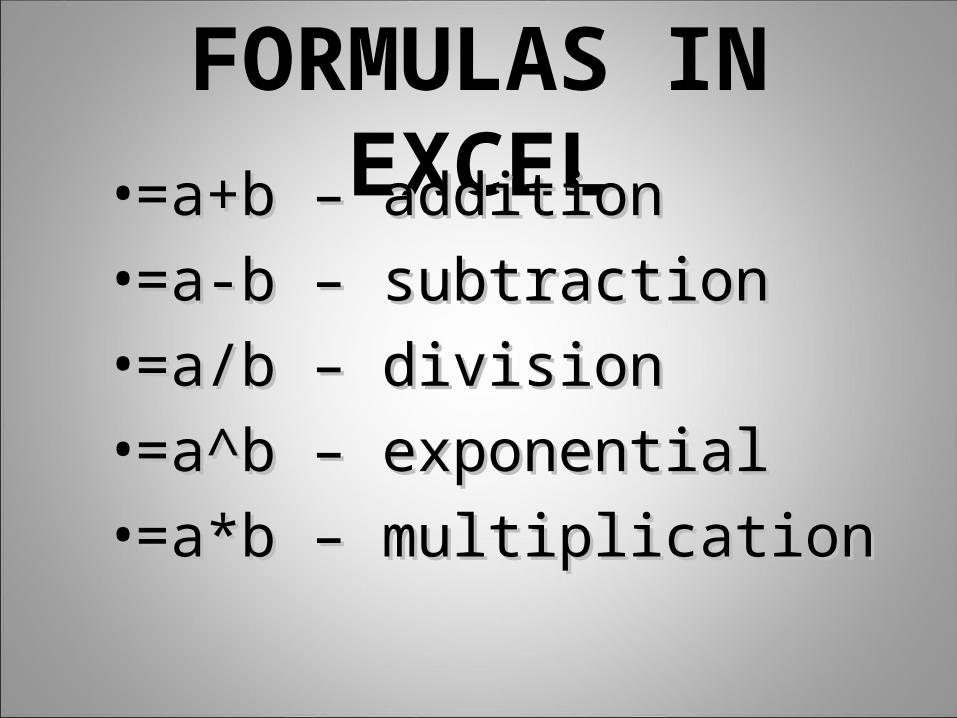
FORMULAS IN EXCEL• =a+b – addition =a+b – addition • =a-b – subtraction =a-b – subtraction • =a/b – division =a/b – division • =a^b – exponential =a^b – exponential • =a*b – multiplication =a*b – multiplication

MORE FORMULAS

FUNCTIONS FUNCTIONS • =SUM IF(RANGE,”CRITERIA”,SUM_RANGE)• =COUNT IF(RANGE," CRITERIA”)• =IF(FN>70,”A”,IF(FN>65,”AB”,IF(FN>60,”B”,IF
(FN>55,”BC”,IF(FN>50,”C”,IF(FN>45,”D”,IF(FN>40,”E”,IF(FN<40,”F”,)))))))))
• IF( CONDITION, RESULT IF TRUE, RESULT IF FALSE)-----=IF(FN<50,”FAIL”,”PASS”)

Getting Started Microsoft Excel
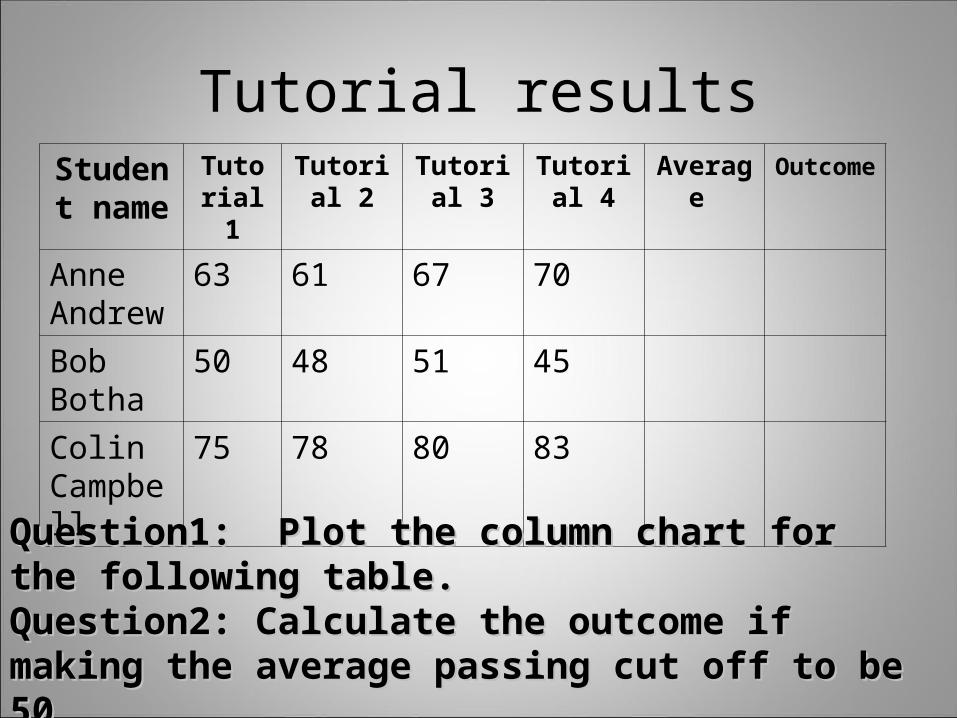
Tutorial resultsStudent
nameTutori
al 1Tutorial
2Tutorial
3Tutorial
4Average Outcome
Anne Andrew
63 61 67 70
Bob Botha
50 48 51 45
Colin Campbell
75 78 80 83
Question1: Plot the column chart for the following table.Question1: Plot the column chart for the following table.Question2: Calculate the outcome if making the average Question2: Calculate the outcome if making the average passing cut off to be 50passing cut off to be 50
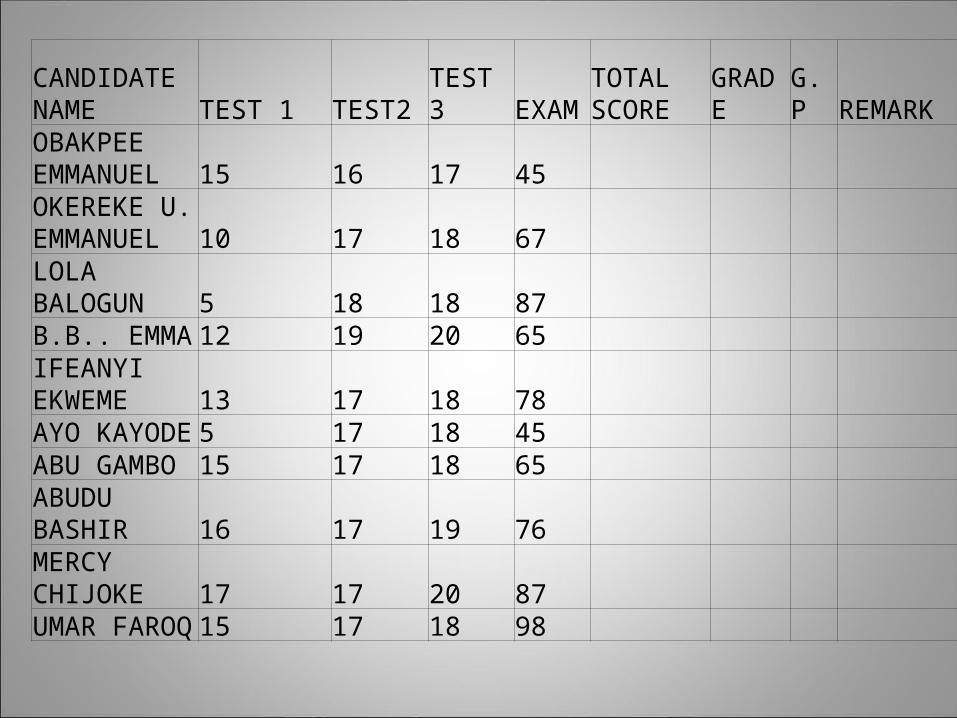
CANDIDATE NAME TEST 1 TEST2 TEST 3 EXAM
TOTAL SCORE GRADE G.P REMARK
OBAKPEE EMMANUEL 15 16 17 45 OKEREKE U. EMMANUEL 10 17 18 67 LOLA BALOGUN 5 18 18 87 B.B.. EMMA 12 19 20 65 IFEANYI EKWEME 13 17 18 78 AYO KAYODE 5 17 18 45 ABU GAMBO 15 17 18 65 ABUDU BASHIR 16 17 19 76 MERCY CHIJOKE 17 17 20 87 UMAR FAROQ 15 17 18 98
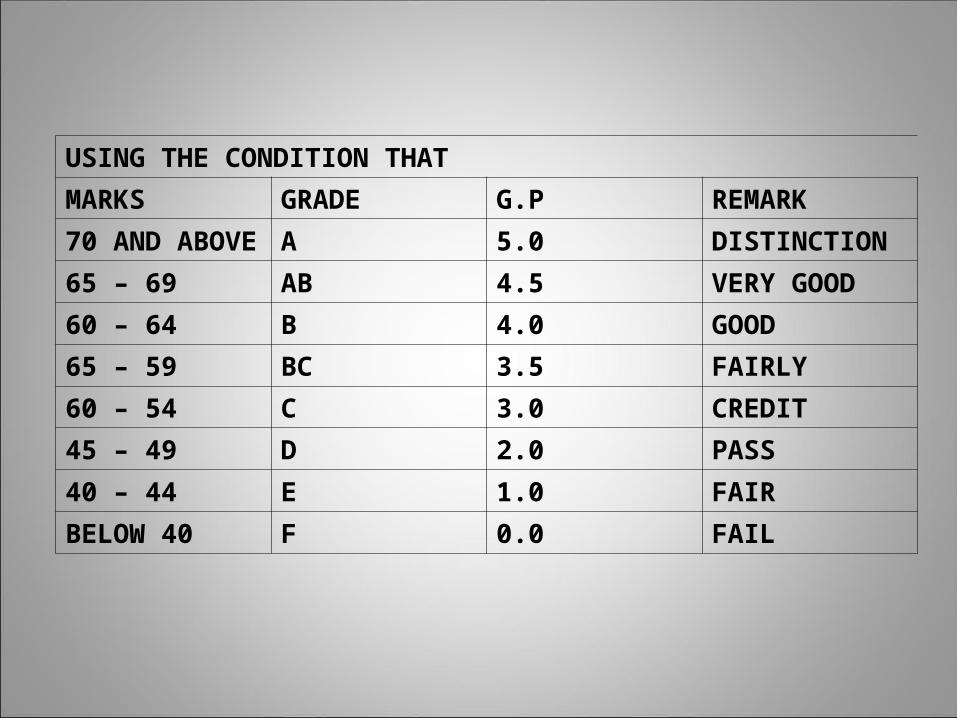
USING THE CONDITION THAT
MARKS GRADE G.P REMARK
70 AND ABOVE A 5.0 DISTINCTION
65 – 69 AB 4.5 VERY GOOD
60 – 64 B 4.0 GOOD
65 – 59 BC 3.5 FAIRLY
60 – 54 C 3.0 CREDIT
45 – 49 D 2.0 PASS
40 – 44 E 1.0 FAIR
BELOW 40 F 0.0 FAIL
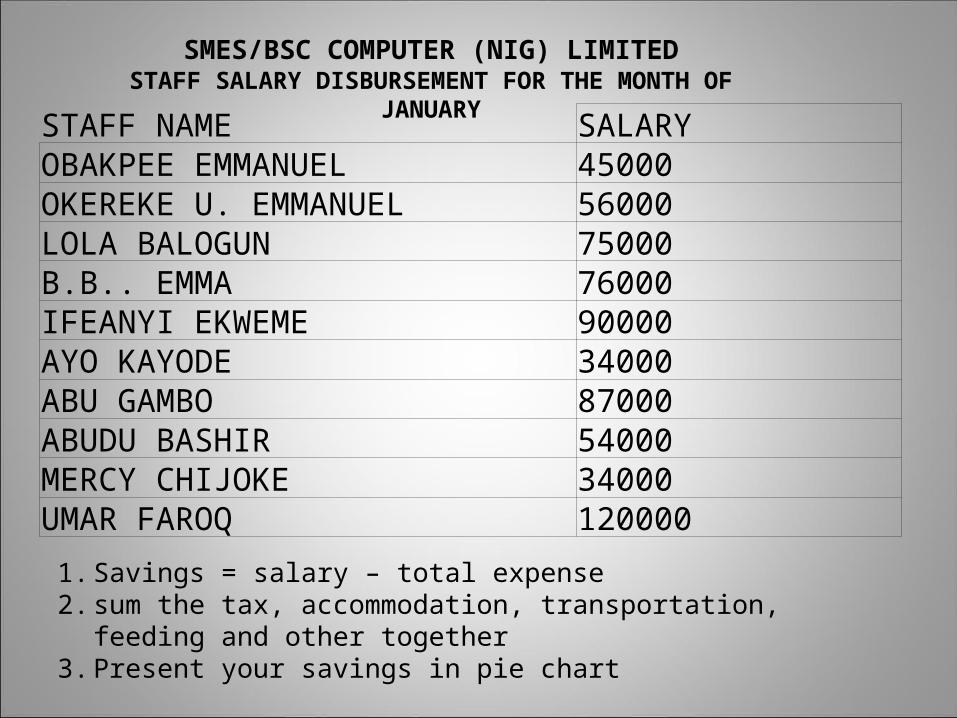
STAFF NAME SALARYOBAKPEE EMMANUEL 45000OKEREKE U. EMMANUEL 56000LOLA BALOGUN 75000B.B.. EMMA 76000IFEANYI EKWEME 90000AYO KAYODE 34000ABU GAMBO 87000ABUDU BASHIR 54000MERCY CHIJOKE 34000UMAR FAROQ 120000
SMES/BSC COMPUTER (NIG) LIMITEDSTAFF SALARY DISBURSEMENT FOR THE MONTH OF JANUARY
1. Savings = salary – total expense 2. sum the tax, accommodation, transportation, feeding and other together3. Present your savings in pie chart