Introduction to Meta-Analysis Charles DiMaggio,...
57
Introduction to Meta-Analysis Charles DiMaggio, PhD
Transcript of Introduction to Meta-Analysis Charles DiMaggio,...

Introduction to Meta-Analysis Charles DiMaggio, PhD

“If only we knew what we know!” Caria O’Dell and Jack Grayson
“Anything you can do, I can do meta!”
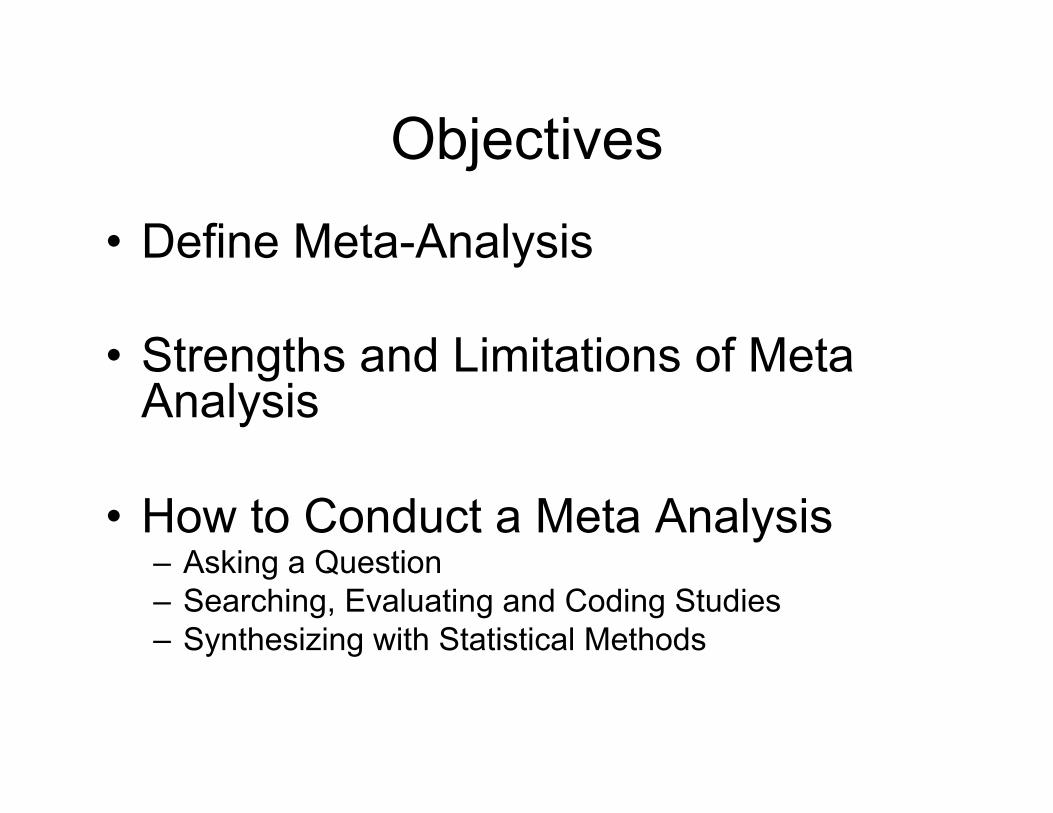
Objectives
• Define Meta-Analysis
• Strengths and Limitations of Meta Analysis
• How to Conduct a Meta Analysis – Asking a Question – Searching, Evaluating and Coding Studies – Synthesizing with Statistical Methods

What is meta-analysis? “an exercise in mega-silliness!”
Eyesnack, 1978 “a new bete noire (which represents) the unacceptable
face of staticism (and) should be stifled at birth” Oakes, 1986
“Meta-Analysis, Shmeta-Analysis.”
Shapiro 1994

What is meta-analysis? “A statistical analysis that combines or integrates the
results of several independent clinical trials considered by the analyst to be combinable” ASA, 1988
“Meta-analysis clearly has advantages over conventional
narrative reviews and carries considerable promise as a tool in clinical research” Eggers, Davey Smith, 1997
“!now widely accepted as a method of summarizing the
results of empirical studies within the behavioral, social and health sciences” Lipsey and Wilson, 2000

The votes are in!
From: Basu, A. How to do meta-analysis, www.pitt.edu/~super7/19011-20001/19431.ppt
King of the hill!

A working definition
• A set of methods to systematically and reproducibly search, sample and (statistically) synthesize evidence from studies.

Strengths of Meta-Analysis
• Imposes Discipline – Makes process explicit and systematic – Organized way of combining a lot of information – More differentiated and sophisticated than
traditional reviews
• Combining studies increases power – Find ‘significant’ results

Weaknesses of Meta-Analysis • Heterogeneity – “apples and oranges”
• Biases – Missing Studies
• May differ from published studies (publication bias)
• Quality of Studies (‘GIGO’) – What constitutes quality?
• Requires a lot of effort and substance-area expertise • Mechanics of statistics may obscure theory • Good for closed-ended questions only

Meta-Analysis: A 12-Step Program • I. Specify Problem • II. Search for and Identify Studies • III. Enter studies into database • IV. Select Studies for Review • V. Review Studies • VI. Develop Coding Scheme • VII. Abstract / Code Studies • VIII. Select Effect Size Statistic • IX. Transform and Weight Effect Sizes • X. Assess heterogeneity • XI. Assess Bias • XII. Synthesize and Present Results

I. Problem Specification “What are the types and magnitudes of behavioral health
disturbances such as depressive symptomotology, post traumatic stress, and somatization seen after terrorist incidents. Do responses vary by variables such as rural vs. urban, developed vs. developing, blast or explosive injuries vs. biological incidents, number injured, and level of publicity. Do terrorist incidents have quantifiable effects on local health care system utilization such as outpatient and emergency department visits, prescription seeking? Are effects sustained and for how long? What social behaviors result from terrorist incidents? Are they adaptive or maladaptive? What community (ecologic) level features are associated with adaptive behaviors?”

II. Identify Studies • Has a meta-analysis been done already?
– PubMed Clinical Queries • Electronic / Online Resources
– PubMed, Medline, Cumulative Index of Nursing and Allied Health Literature (CINAHL), Allied and Complementary Medicine (AMED), PsychINFO, Health and Psychosocial Instruments, ProQuest Digital Dissertation Database, Papers First, Cochrane Reviews, ACP Journal Club, Database of Abstracts of Reviews of Effectiveness (DARE), the Cochrane Controlled Trials Register (CCTR), Sociologic Abstracts and Web of Science
– Search Terms • alcohol*’, ‘epidem*’, ‘risk’, ‘protect*’, ‘cohort’, ‘case control’, ‘longitudinal’
• Hand Search – References of electronically identified articles – Contact investigators
• Ask a Librarian!

III. Enter Studies
• Endnote / Zotero / Bookends – Search and enter directly through program – Remove duplicates – Review titles and remove non-relevant studies – Review abstracts and remove non-relevant studies
• Retrieve pdf’s – Attach to citation – Review full text – Divide into main categories

IV. / V. Review and Select Studies
Search
Review
Select
Review
Select

VI. Develop Coding Scheme • “Interviewing” a Study • Conceptually
– Effect Size (outcome) ! populations, methods, procedures, designs study methods, designs, procedures (explanatory)
• Examples of Data Elements – Identifying information (authors, journal, etc!) – Sample size – Type of population – Type of effect (e.g. odds ratio, prevalence) – Result

VII. Abstract the Data • Meta-analytic data is inherently hierarchical
– Multiple outcomes per study – Multiple measurement points per outcome – Sub-samples per study population
• End up with multiple effect sizes per study • Analyses almost always are of a subset of coded effect
sizes. Data structure needs to allow for the selection and creation of those subsets
• To maintain statistical independence, specific analyses can only include one effect size per study (or one effect size per sub-sample within a study)

Example of Relational Data Structure (Multiple Related Flat Files)
Practical Meta-Analysis -- Lipsey and Wilson

VIII. The Effect Statistic (ES) – makes meta-analysis possible
• Comparable, standardized numeric scale for evidence across disparate studies
• Amenable to calculation of standard error – Allows weighting of study’s contribution to evidence
based on sample size
• Different ES’s for different kind of outcomes
• Different statistical methods for same ES

Kinds of Effect Statistics • Proportion
– Central tendencies • Standardized mean difference (d)
– Group contrasts of continuous measures • Correlation coefficient (r)
– Linear associations • Odds-ratio
– Group contrasts of dichotomous measures

IX. Transform and Weight the Effect Statistic
• Transform – magnitude and direction of the effect – same scale for all studies
• Weight – inverse variance gives more ‘weight’ to larger
studies – sample size is key ("n = "precision) – standard error
• means, correlations, proportions, odds – not well-suited to complex procedures like multiple logistic regression

Why Weight Effect Sizes? • Studies vary in size.
• ES based on 100 subjects assumed more “precise” estimate of population ES than ES based on 10 subjects.
• Larger studies should carry more “weight”.
• Weighting by the inverse variance optimal approach
Practical Meta-Analysis -- Lipsey and Wilson

An example of not weighting! Day care and the risk of being left back a grade (“retained”)
less likely to be left back
less likely to be left back
more likely to be left back?
(Simpson’s Paradox)
Cochrane Collaborative (http://www.cochrane-net.org/openlearning/HTML/mod12-2.htm)
+
=

Why weight by inverse variance?
• The standard error (SE) is a direct index of ES precision. – influenced by sample size – used to create confidence intervals.
• The smaller the SE, the more precise the ES.
• Optimal weights for meta-analysis (Hedges):

Transforming a Continuous Measure: The Standardized Mean Difference (d or g)
• standardized group contrast on an continuous measure
• uses a pooled standard deviation

Weighting a Continuous Measure
• SE for a standardized mean difference:
• Weight for standardized mean difference:

Methods for Dichotomous Effect Sizes
• Variance-Based Method – transform and work on log scale – Lipsey and Wilson, CMA – AKA “Inverse Variance Methods” – Can be applied to OR’s, RR’s, RD’s – Can be applied when don’t have complete 2x2 table info
• Mantel-Haenszel – work on original scale – Cochrane, Petitti, R packages – Long history of experience – Statistically optimal – “Fixed Effects” – vs. Peto Method
• DerSimonian and Laird – Cochrane, R packages – “Random Effects”

Variance Method for Dichotomous Outcomes
1. Transform the result to the log scale 2. Weight the result by inverse variance 3. Calculate the weighted mean effect size 4. Calculate the standard error of the
weighted mean effect size 5. Calculate a confidence interval for the
weighted mean effect size

Variance Method for Odds Ratios
OR
Logit
1. Transform the Odds Ratio to Log Scale

2. Weight the Logit
• s.e. for a Logit
• Weight for a Logit
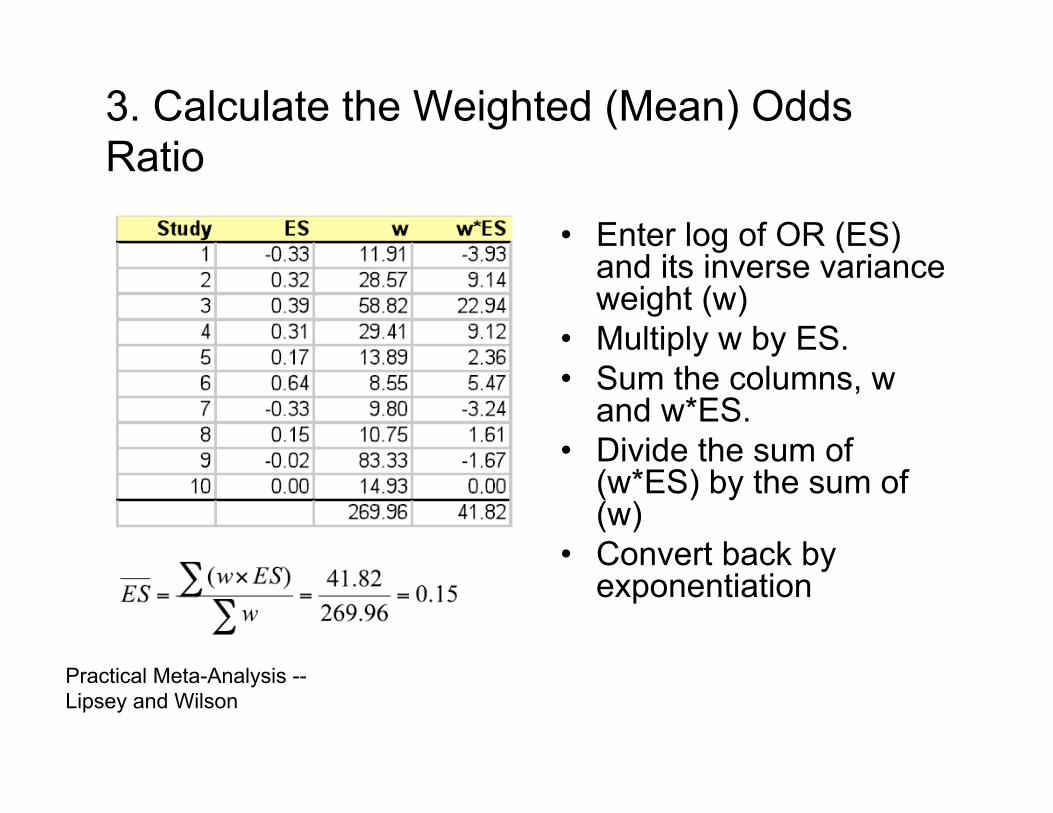
3. Calculate the Weighted (Mean) Odds Ratio
• Enter log of OR (ES) and its inverse variance weight (w)
• Multiply w by ES. • Sum the columns, w
and w*ES. • Divide the sum of
(w*ES) by the sum of (w)
• Convert back by exponentiation
Practical Meta-Analysis -- Lipsey and Wilson

4. Calculate the Standard Error of the (Mean) Odds Ratio
Practical Meta-Analysis -- Lipsey and Wilson

Variance Method: Mean, Standard Error, Z-test and Confidence Intervals for an
Odds Ratio
Practical Meta-Analysis -- Lipsey and Wilson

Mantel-Haenszel Method • For Fixed Effects Models • Better than variance methods when rare events and
small trials (otherwise similar results)
ORmh = # (wi * ORi) / # wi ORi = (ai * di) / (bi * ci) weighti = 1 / vari OR.vari = ni / (bi * ci) RR.vari = ni / ((ai+bi ) * ci) RD.vari = ni / n1i * n2i

Mantel-Haenszel 95 % CI
exp(ln(ORmh) ± 1.96 * $Var[ln(ORmh )]
Source: Robins J, Breslow N, Greenland S. A general estimator for the variance of the Mantel-Haenszel odds ratio. Am J Epidemiol. 1986 Nov;124(5):719-23.

Heterogeneity

Heterogeneity vs. Bias and Confounding
• Studies differ due to recruitment, bias, confounding, etc! (Observational studies more so than experimental studies.
• There are no statistical methods to account or control for bias and confounding in the original studies
• Some epidemiologists believe any summary measure of effect is likely to be misleading. Goal of M-A should be to explore and explain differences, rather than smooth over them.

Fixed Effects vs. Random Effects • Two statistical approaches to calculating the
variance for the weighted mean effect statistic.
• Fixed Effects – Variance of synthesized effect statistic based only on
studies included in the analysis
• Random Effects – Variance of synthesized effect statistic based on idea
that studies included in the analysis are a random sample of all possible studies that could have been included
• “conservative” vs. “abstruse and uninformative”

Fixed Effects Model • “What is the effect size based solely on the evidence of
the studies included in the meta-analysis?”
• Total variance measured only on basis of within-study variance
• Studies weighted on basis of their inverse variance (sample size)
• Approach recommended by Sir Richard Peto and others.

Random Effects Model • “What is the average effect size based on the studies
included in the meta-analysis as a sample of all possible studies?”
• Total variance includes between-study as well as within-study variance
• As between-study variance becomes larger (heterogeneity) dominates, swamps within-study variance and all studies weighted equally – collection of separate studies vs. sample from underlying
population of studies!

Fixed Effects vs. Random Effects
• When there is little or no heterogeneity, essentially return the same results
• Random effects models do not ‘control’ for heterogeneity, rather they are assuming a different underlying model.
• Some researchers believe that when there is evidence of heterogeneity, shouldn‘t’combine studies at all.
• Caution if random effects return meaningfully different results from fixed effects

X. Assessing Heterogeneity • Test the assumption that all effect sizes are measuring a
single, underlying mean.
• Look at effect size CI’s. If don’t overlap, likely heterogeneity.
• Chi square statistic (“Q test”) – Q = #wi (ESi-meanES)2 , df = #ES-1 – small p % heterogeneity
• few studies % low power (set p=0.10) • many studies% statistical significance vs.
meaningful heterogeneity (“too much power”)

Q - The Homogeneity Statistic
Practical Meta-Analysis -- Lipsey and Wilson

Calculating Q
Practical Meta-Analysis -- Analysis -- D.B. Wilson
• Calculated Q (14.76) is less than chi square critical value of 16.92 • fail to reject the null hypothesis of homogeneity • Thus, the variability across effect sizes does not exceed what would
be expected based on sampling error.

I2
• percentage of variation due to heterogeneity (vs. chance)
• (Q-df)/Q*100 • e.g. (14.76-9)/14.76*100=39% • methods available for 95% CI for I2

So your studies are heterogeneous!
• a) There are ‘real’ differences between studies, i.e. more than one underlying population mean.
– Single mean ES not a good measure of the distribution.
– Model between study differences (ANOVA)
• b) Assume heterogeneity is random % Random Effects Model

Random Effect Model
• Additional variance component, based on Q, added to weight
• Run analysis with new weights

Calculating the Random Effects Variance Component
• The total Q for example data was 14.76 • k is the number of effect sizes (10) • The sum of w = 269.96 • The sum of w2 = 12,928.21
Practical Meta-Analysis -- Lipsey and Wilson

DerSimonian and Laird Method
DerSimonian and Laird Summary OR
Additional component to weight
(S is number of studies)

DerSimonian-Laird Random Effects Model(for M-H approach)
Dersimonian and Laird Summary OR
Additional Component “D” to weight
(S= # studies)

XI. Assessing Bias • Some biases are peculiar to meta-analysis.
• Positive results are more likely to be! – Published (publication bias) – Published quickly (time lag bias) – Published in English (language bias) – Published more than once – Be cited by others (citation bias)
• Will be present to some extent in all meta analyses. Need to assess how much of a problem it is.

Funnel Plots • Vertical Axis is measure of ES precision • Horizontal Axis is measure of ES magnitude • Expect more-precise estimates to cluster together
near top of plot and less-precise estimates to fan out near bottom of plot

Possible Publication Bias
Outlier from less precise study?
Pattern of less precise studies showing more positive effect.

XII. Presenting Results • QUOROM statement (Moher D et al (1999) Lancet 354: 1896-1900) • Abstract
– Background (include statement of the main research question) – Methodology/Principal Findings – Conclusions/Significance
• Introduction • Methods
– Searching - describe information sources, restrictions – Selection - inclusion and exclusion criteria – Data abstraction – Validity Assessment – Study characteristics e.g. type of study designs, participants’ characteristics – Quantitative data synthesis - measures of effect, method of combining results, missing data; how
statistical heterogeneity was assessed • Results
– Flow of included studies – Study characteristics – Quantitative data synthesis- agreement on the selection and validity assessment, simple summary
results, Funnel plots, Forest plots • Discussion • Limitations

Odds Ratio & 95% Cr I
0.5 1 2 4 8
STUDY ESTIMATE
Predictive 1.9, (0.6, 4.7)
Synthesis 1.6 (1.2, 2.1)
Wazana, 2000 3.5 (3.0, 4.1)
Testerm 2004 1.8 (1.0, 3.5)
Stevenson, 1996 3.0 (1.8, 4.8)
Shephard, 2010 1.9 (1.0, 3.4)
Roberts2, 1995 2.9 (1.3, 6.5)
Mutto, 2002 10.1 (2.0, 50.5)
Mueller, 1990 1.7 (0.4, 7.2)
Leden2, 2006 1.8 (0.8, 4.2)
Jones,2005 2.1 (1.5, 2.9)
Johansson, 2007 3.6 (2.3, 5.6)
Donroe, 2008 1.6 (0.7, 3.6)
Damsere, 2010 0.5 (0.3, 1.0)
Bunn, 2003(k) 1.5 (1.0, 2.1)
Bunn, 2003(j) 1.0 (0.6, 1.5)
Bunn, 2003(i) 1.1 (0.7, 1.5)
Bunn, 2003(g) 0.9 (0.6, 1.3)
Bunn, 2003(f) 1.2 (0.2, 6.8)
Bunn, 2003(e) 1.0 (0.7, 1.4)
Bunn, 2003(d) 0.6 (0.2, 1.9)
Bunn, 2003(c) 1.3 (0.7, 2.1)
Bunn, 2003(b) 1.4 (0.6, 3.4)
Agran, 1996 1.5 (0.7, 3.4)
Forest Plot

Software Considerations • Comprehensive Meta-Analysis
– does all calculations for you; user-friendly interface; convenient – Little control over approaches, calculations, figures – Still need some kind of DBMS – $$
• MS Access % MS Excel – “easy” interface, wide availability for collaboration – Either write all formulas or use (“free”) add-on apps, e.g.
MIX (http://www.mix-for-meta-analysis.info/) Lipsey (http://mason.gmu.edu/~dwilsonb/ma.html) MetaEasy(http://www.jstatsoft.org/v30/i07)
• R – rmeta, meta, metafor – really, and truly free – Explicit programming and reproducibility – Learning curve
• SAS, SPSS, Stata, etc! – $$$$$

R Code for Forest Plot
vs.
meta package: forest(x)

Sources and Resources • Lipsey and Wilson. Practical Meta-Analysis. (Sage,
2001)
• Petitti. Meta-Analysis, Decision Analysis and Cost- Effectiveness Analysis. (Oxford, 2000)
• Cochrane Collaboration Open Learning Material (http://www.cochrane-net.org/openlearning/HTML/ mod0.htm)