Introduction to Investment Grade Private Credit
18
Introduction to Investment Grade Private Credit Market Overview and Analysis INVESTMENT MANAGEMENT For qualified institutional investor use only. Not for inspection by, distribution or quotation to, the general public.
Transcript of Introduction to Investment Grade Private Credit

Introduction to Investment Grade Private CreditMarket Overview and Analysis
INVESTMENT MANAGEMENT
For qualified institutional investor use only. Not for inspection by, distribution or quotation to, the general public.

Market Overview and AnalysisIntroduction to Investment Grade Private Credit
2
Table of Contents
3
3
4
5
6
8
8
9
9
10
Introduction
Private Credit Defined
Characteristics of Borrowers
Size of the Market
Distinguishing Private Credit from Public Bonds
Ways to Invest
Diversification and Suitability
Advantages for Institutional Investors
Stable Value Applications
Insurance Company Portfolio Applications
12Conclusion
13Appendix 1
15Appendix 2

Introduction
Large institutional investors allocate a significant amount of their total assets to fixed income, which is intended to provide consistent income and lower volatility than equity. Insurance companies, pension funds and certain other long-term investors seek assets that provide both long duration and potentially lower losses than other investment choices. Many of these investors now realize that the fixed income asset class which can provide the duration they need along with potentially higher returns and lower losses is “private credit,” also known as “private placements” (in this paper we use both terms interchangeably).
The purpose of this paper is to introduce the asset class and explain its nature, characteristics and distinctions and explore some of the advantages and risks of investing in private credit.
Private Credit Defined
There are several investment types that fall into private credit including private placements, senior loans, distressed debt and mezzanine finance. What we will discuss is the private placement section of the private credit market. Private placements are essentially long-term loans to corporations, 90% of which are investment grade. Borrowers utilize the private placement market for a variety of reasons: to maintain confidentiality of their financials, to obtain more flexible terms than offered by the public market or to borrow money when their credit histories are more complex in nature. The borrowers use the proceeds to finance acquisitions, refinance existing debt, support business expansions and other general business purposes.
The debt offerings are private because the notes are sold only to qualified institutional buyers1 (QIBs) and as such do not have to be registered with the U.S. Securities and Exchange Commission (SEC). For purposes of this paper, the terms private credit and private placements refer to Regulation D securities2 and do not include securities issued under Rule 144A.3
Functionally, a private placement is a hybrid of a public bond and a traditional bank loan. Characteristics shared with public bonds include a fixed rate structure and term length. Similarities with bank loans include greater upfront due diligence, priority debt and financial covenant protection and a more engaged relationship with borrowers.
Primarily originated by large investment and commercial banks, some investments are direct transactions with either a single investor or a “club deal” with several large investors. When a new private placement is offered, the deal is typically purchased by five to twenty institutional investors. The asset class tends to be a good fit for portfolios with long-term liabilities and less need for liquidity, such as insurance companies and pension plans.
Private placements are by definition privately issued and not traded on any public exchange. Instead, they are directly traded among institutional investors in a private secondary market. Although the perception persists that private placements are illiquid, it is actually a byproduct of the fact that the primary investors (mainly life insurance companies) are “buy-and-hold” investors. Although there is limited ability to buy holdings, the liquidity to sell is very good. For example, the prices for bonds sold during the 2009 financial crisis averaged 98% of par and 99.9% of prior month-end prices (based on Voya Investment Management’s market experience during that time).
Introduction to Investment Grade Private Credit Market Overview and Analysis
1 Qualified institutional buyers are large institutional investors, e.g., insurance companies with at least $100 million of investable assets. 2 The Securities Act of 1933 (“Securities Act”) requires that all securities must be registered with the U.S. Securities and Exchange Commission (SEC) unless covered by an exemption to Regulation D. The exemptions allow issuers to borrow an unlimited amount of debt without registration. Generally in these types of transactions, issuers provide audited financial statements, are responsive to potential investors’ questions and restrict trading the offerings to “accredited investors” as defined under Reg D. The investors directly negotiate the terms of the transaction with the issuer.3 Rule 144A securities are also sold to qualified institutional buyers (QIBs) and are exempt from registration under the Securities Act, but unlike traditional Reg D securities, there is less access to information, less time to review the transaction and less opportunity to influence term
3

Private credit investments are known for their flexible structure with respect to maturity dates, delayed drawdowns and multiple fundings for a given borrower. Most are fixed-rate offerings, but they also may be structured with floating rates. This flexibility gives the private market an important advantage over the public market and results in increased opportunities for active private lenders.
When an investment bank launches a new transaction into the marketplace, it is generally reviewed by the largest participants in the market. Each investor then places a bid on the transaction; if the borrower accepts the proposed pricing and terms submitted, the investors are included in the deal. Often, investors will have comments on the legal documents or covenants, making each transaction a uniquely negotiated deal. Figure 1 illustrates the minimum and maximum bid sizes allocated to each private credit investor based on the overall deal size; Voya Investment Management is consistently ranked in the top tier of allocations versus peers.
Figure 1. U.S. Private Credit Largest Investor Bid Sizes
($ Millions, as of 2020)
Minimum Maximum
Met Life 50 175
Prudential 50 150
Nuveen 50 150
New York Life 50 125
AIG 50 150
Barings 50 150
NML 50 150
Voya 50 150
Source: Credit Agricole
Once the various deal points are negotiated, the investors commit or “circle” the transaction. After that, the investors conduct further due diligence — generally an on-site visit, touring key facilities of the company and meeting the next line of operational management. In certain cases — repeat issuers to the private market, a directly originated deal with an existing borrower or a project finance deal that is not yet under construction — a conference call with senior management may suffice. With a project finance deal, an analyst will make an on-site review once significant construction progress is achieved. After due diligence is completed, investors will finalize the documentation.
Characteristics of Borrowers
The average size of a private placement issue is approximately $300 million, but it can range from $50 million to over $1 billion. The private placement space is diversified across industries and geographies. Many non-U.S. issuers tend to be larger-capitalized firms, which may or may not be rated and do not want to undergo SEC registration. While private placements are available in all rating categories, the majority of issuance is done by borrowers with credit quality between A- and BBB-. The size of the borrowers varies, with revenue of issuing companies generally ranging from $250 million to over $10 billion.
Introduction to Investment Grade Private Credit Market Overview and Analysis
4
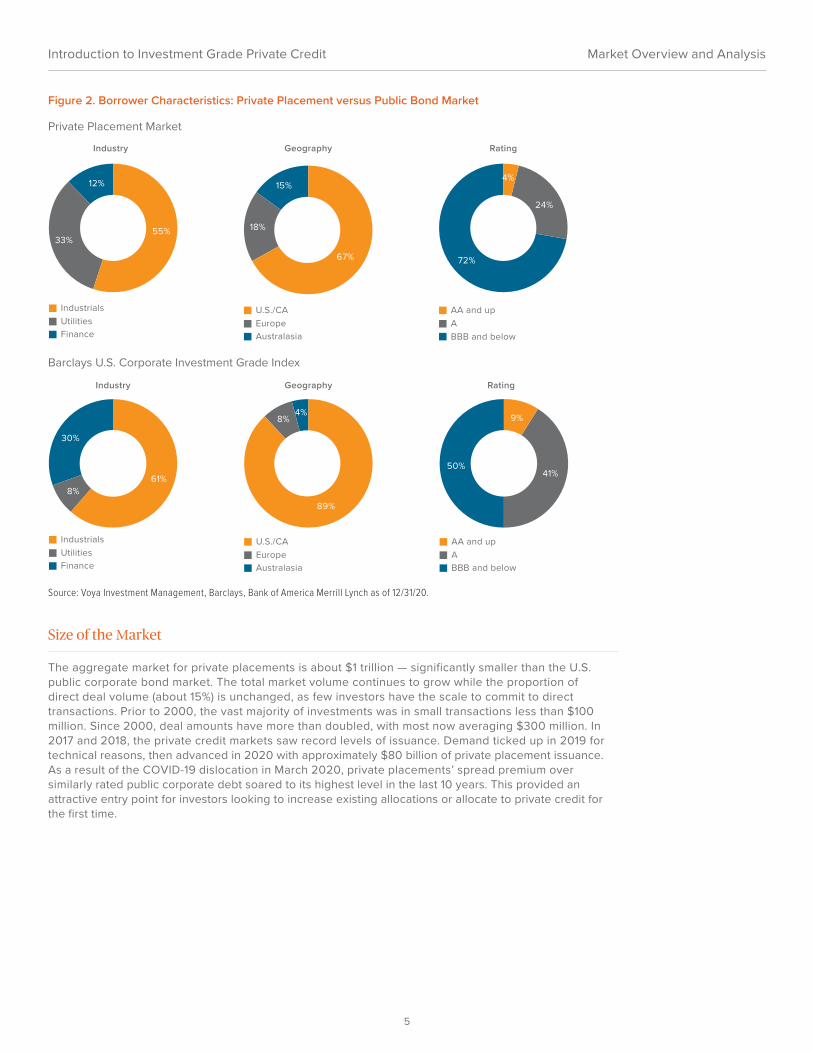
Figure 2. Borrower Characteristics: Private Placement versus Public Bond Market
Private Placement Market
Rating
AA and upABBB and below
72%
24%
4%
Geography
U.S./CAEuropeAustralasia
67%
15%
18%
Industry
IndustrialsUtilitiesFinance
55%33%
12%
Barclays U.S. Corporate Investment Grade Index
Rating
AA and upABBB and below
50%41%
9%
Geography
U.S./CAEuropeAustralasia
89%
4%8%
Industry
IndustrialsUtilitiesFinance
61%8%
30%
Source: Voya Investment Management, Barclays, Bank of America Merrill Lynch as of 12/31/20.
Size of the Market
The aggregate market for private placements is about $1 trillion — significantly smaller than the U.S. public corporate bond market. The total market volume continues to grow while the proportion of direct deal volume (about 15%) is unchanged, as few investors have the scale to commit to direct transactions. Prior to 2000, the vast majority of investments was in small transactions less than $100 million. Since 2000, deal amounts have more than doubled, with most now averaging $300 million. In 2017 and 2018, the private credit markets saw record levels of issuance. Demand ticked up in 2019 for technical reasons, then advanced in 2020 with approximately $80 billion of private placement issuance. As a result of the COVID-19 dislocation in March 2020, private placements’ spread premium over similarly rated public corporate debt soared to its highest level in the last 10 years. This provided an attractive entry point for investors looking to increase existing allocations or allocate to private credit for the first time.
Introduction to Investment Grade Private Credit Market Overview and Analysis
5
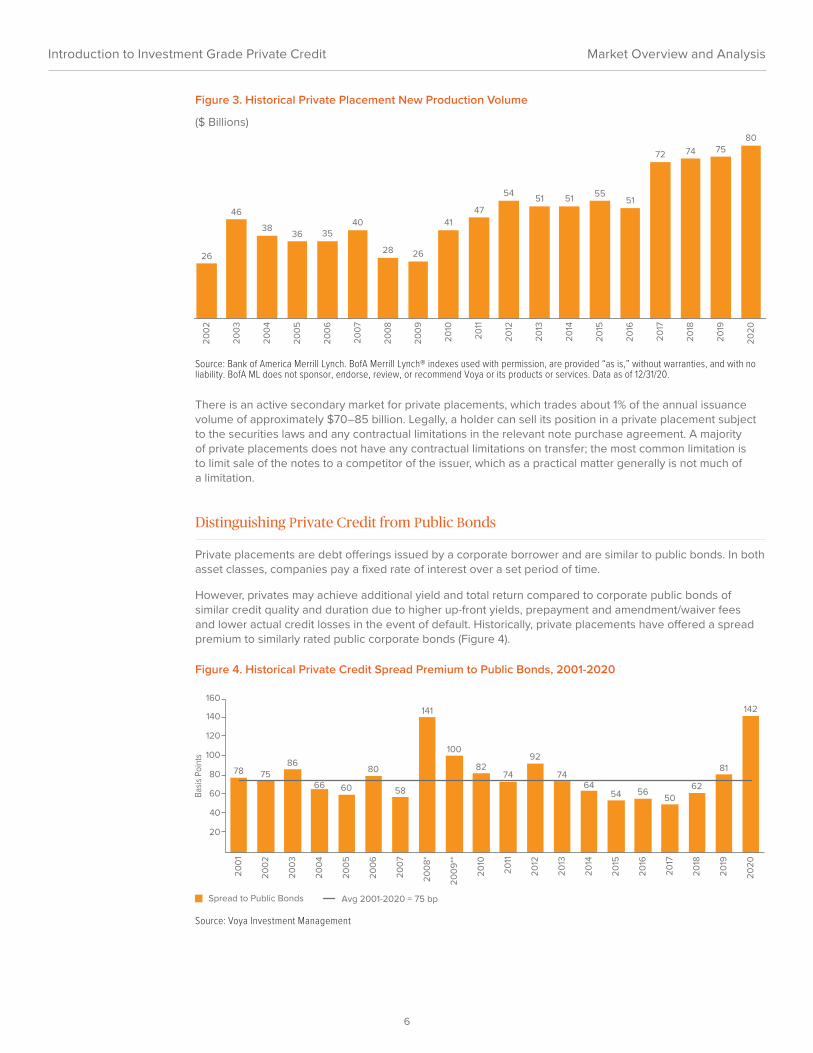
Figure 3. Historical Private Placement New Production Volume
($ Billions)
26
46
3836 35
40
28 26
4147
5451 51 55
51
72 74 7580
200
2
200
3
200
4
200
5
200
6
200
7
200
8
200
9
2010
2011
2012
2013
2014
2015
2016
2017
2018
2019
2020
Source: Bank of America Merrill Lynch. BofA Merrill Lynch® indexes used with permission, are provided “as is,” without warranties, and with no liability. BofA ML does not sponsor, endorse, review, or recommend Voya or its products or services. Data as of 12/31/20.
There is an active secondary market for private placements, which trades about 1% of the annual issuance volume of approximately $70–85 billion. Legally, a holder can sell its position in a private placement subject to the securities laws and any contractual limitations in the relevant note purchase agreement. A majority of private placements does not have any contractual limitations on transfer; the most common limitation is to limit sale of the notes to a competitor of the issuer, which as a practical matter generally is not much of a limitation.
Distinguishing Private Credit from Public Bonds
Private placements are debt offerings issued by a corporate borrower and are similar to public bonds. In both asset classes, companies pay a fixed rate of interest over a set period of time.
However, privates may achieve additional yield and total return compared to corporate public bonds of similar credit quality and duration due to higher up-front yields, prepayment and amendment/waiver fees and lower actual credit losses in the event of default. Historically, private placements have offered a spread premium to similarly rated public corporate bonds (Figure 4).
Figure 4. Historical Private Credit Spread Premium to Public Bonds, 2001-2020
78 7586
66 60
80
58
141
100
8274
92
7464
54 5650
62
81
142
20
40
60
80
100
120
140
160
Basi
s Po
ints
Spread to Public Bonds Avg 2001-2020 = 75 bp
200
1
200
2
200
3
200
4
200
5
200
6
200
7
200
8*
200
9**
2010
2011
2012
2013
2014
2015
2016
2017
2018
2019
2020
Source: Voya Investment Management
Introduction to Investment Grade Private Credit Market Overview and Analysis
6

Figure 5. Private Credits are Offered in a Variety of Countries and Credit Ratings
Investment Grade Private Credit Debt 144As Investment Grade Public Bonds
Income Fixed Fixed Fixed
Security Secured/ Unsecured Secured/Unsecured Unsecured
Ranking Senior and cannot be subordinated Can be subordinated Can be subordinated
Covenants Maintenance / comprehensive Limited None
Prepayment Callable with Treasury +50 bp "make whole" premium
Callable with Treasury +50 bp "make whole" premium Some callable at par
Tenor Flexible 2–30 years Flexible up to 30 years 5, 7, 10, and 30 yrs
Liquidity Actively traded private market Traded on private and public markets Actively traded public market
Recoveries 92%* 40% 46%
Source: Moody’s Annual Global Corporate Issuance Default Study. *Voya Private Credit Strategy recovery rate, as of 12/31/19.
Below we discuss some of the unique features of private placements.
Contractual Protections. Private placements are made under the terms of a written contract — the note purchase agreement — which sets the interest rate to be paid by the borrower and limitations on a borrower’s business operations designed to enhance the probability that the lenders will be repaid. Such limitations, called covenants, are designed to monitor the financial health of a borrower and limit the ability of the borrower to incur additional debt.
If the borrower violates these restrictions the note purchase agreement gives lenders the right to take certain actions against the borrower, ranging from increasing the interest rate on the note to calling the notes and requiring the immediate repayment in full.
Covenants. Covenants are unique to each transaction, can vary widely depending on circumstances and are virtually nonexistent among investment grade public bonds. The covenants are designed to maintain pari passu (or equal) treatment with other senior creditors and to force prepayment while the credit is still finance able by its banks or other lenders. When an exit is not possible, terms can be renegotiated to improve recovery rates if payment default ultimately occurs or increase the yield via fees and coupon rate increases. Generally, there are three types of covenants: 1) those that protect the note holder’s position in the capital structure, 2) those that protect against credit deterioration and 3) those that protect against “event risk,” such as the company favoring its equity holders over its debt.
Private placements are callable at any time; however, the call is at a “make-whole” price. While technically complex, the make-whole concept allows the investor to maintain the initial yield of the investment over the remaining term regardless of whether interest rates have increased or decreased since funding. Hence, while privates are fully callable, they are not negatively convex.
We estimate the long-term excess value of covenants to be approximately 25 bp versus non-covenanted public bonds. Value comes from amendment and waiver fees, pre-payment fees, coupon increases and lower losses in the event of default.
Spread. The interest rate on a private placement is expressed as a nominal spread over a base rate, namely, the comparable maturity U.S. Treasury. Borrowers choose a wide variety of maturities, including five, seven, ten, 12, 15 and 30 years. Borrowers sometimes will also offer unique maturities (e.g., 22 years or amortizing schedules) depending on their borrowing needs.
The nominal spread is the amount of interest that a borrower will pay in addition to the base rate. This spread is typically a fixed amount, and it is usually expressed in basis points. The spread differs across industries depending on the creditworthiness of the particular borrower.
Introduction to Investment Grade Private Credit Market Overview and Analysis
7

To understand the interest rate locked in by a borrower on a private placement, if the ten-year U.S. Treasury was currently at 1.50%, a borrower whose spread was 200 bp above the ten-year rate would pay interest at a rate of 3.50%. The spread is higher than a similarly rated public bond due to an illiquidity premium. In our experience, the historical spread to publics averaged 72 bp for the seven years prior to 2008. It widened to 121 bp in 2008 and 2009 and has averaged approximately 78 bp since 2009.
Prepayment. The standard provision in the U.S. private placement market is that notes are callable at the greater of the “make-whole” premium or par. The make-whole premium is calculated as the value of the notes being prepaid discounted at a rate equal to the sum of (a) the current rate of the U.S. Treasury with the same average life as the notes and (b) 50 bp. This formulation protects the note holders during times of declining interest rates. In theory, the note holder can take the returned principal, interest and make-whole premium and invest it in a security with the same average life as the prepaid notes, yielding U.S. Treasurys plus 50 bp and remain “whole” with respect to the original yield on the investment. In rising interest rate conditions, note holders can “sell” the notes at par, which still provides a premium, because the bond is worth less in the higher interest rate environment, and then reinvest at higher yields. Private placement notes are callable at any time but because of the make-whole provision are not negatively convex.
Make-whole fees as a percentage of the total portfolio will vary because companies may choose to prepay loans on an ad hoc basis.
Tenor. Issuers in this market typically issue notes with maturities between three and thirty years; the most common maturities are seven, ten and twelve years. Currently, the attainable spread to public bonds is higher in the shorter tranches due to 1) demand for longer-duration product from many investors and 2) the low absolute level of interest rates. Private investors have held to minimum yield hurdles more stringently than their public counterparts.
Recoveries. The private credit asset class has an inherent advantage over public bonds due to its negotiated covenant structures that are tailored to each credit. Private placements generally are pari passu with bank loans and ahead of unsecured bondholders. As a result, if a company becomes distressed and falls into bankruptcy, private placements are in line to be repaid with the banks and typically get paid back before public bondholders, preferred shareholders or holders of a company’s equity. This has led to significantly higher recoveries on defaulted private placements in comparison to recoveries on defaulted public bonds.
From 2003 to 2020 at Voya, private placements demonstrated a recovery rate of about 92% compared to unsecured public bonds, which have historically recovered approximately 46%. A 2016 Society of Actuaries study found industry average recovery rates of 63.4%.
Ways to Invest
Due to the unique nature of the asset class, clients can invest in the market through portfolio mandates with the largest purchasers in the private placement market. These direct mandates are flexible and can be tailored to specific client needs.
Diversification and Suitability
Because of the long-duration, fixed-liability needs of insurance companies, pension plans and certain other institutional clients, privates tend to fit well in that portion of investors’ portfolios that are managed on a buy-and-hold basis. The asset class provides diversification at the credit and country level but little overlap with public bond holdings. There are also multicurrency fundings, so clients interested in non-U.S. dollar exposure can find investment opportunities. An example of this diversification appears in Figure 6, which shows the credit and country allocations for the Voya private credit portfolio.
Introduction to Investment Grade Private Credit Market Overview and Analysis
8
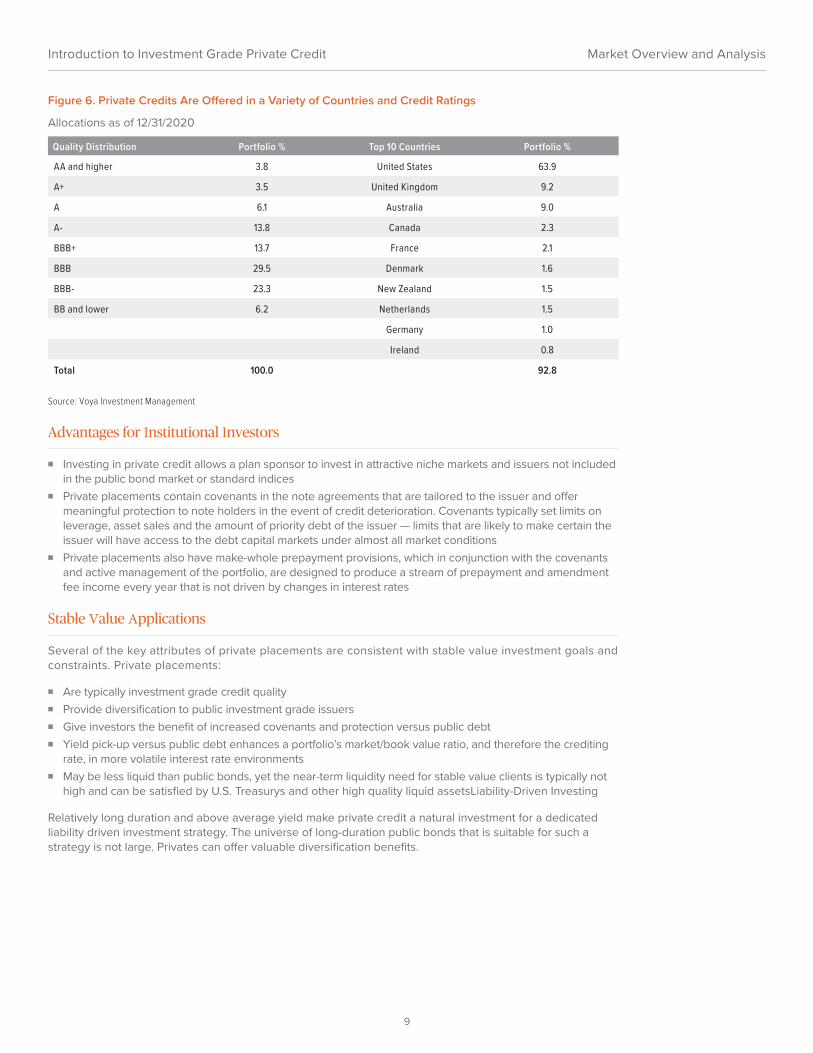
Figure 6. Private Credits Are Offered in a Variety of Countries and Credit Ratings
Allocations as of 12/31/2020
Quality Distribution Portfolio % Top 10 Countries Portfolio %
AA and higher 3.8 United States 63.9
A+ 3.5 United Kingdom 9.2
A 6.1 Australia 9.0
A- 13.8 Canada 2.3
BBB+ 13.7 France 2.1
BBB 29.5 Denmark 1.6
BBB- 23.3 New Zealand 1.5
BB and lower 6.2 Netherlands 1.5
Germany 1.0
Ireland 0.8
Total 100.0 92.8
Source: Voya Investment Management
Advantages for Institutional Investors
■ Investing in private credit allows a plan sponsor to invest in attractive niche markets and issuers not includedin the public bond market or standard indices
■ Private placements contain covenants in the note agreements that are tailored to the issuer and offermeaningful protection to note holders in the event of credit deterioration. Covenants typically set limits onleverage, asset sales and the amount of priority debt of the issuer — limits that are likely to make certain theissuer will have access to the debt capital markets under almost all market conditions
■ Private placements also have make-whole prepayment provisions, which in conjunction with the covenantsand active management of the portfolio, are designed to produce a stream of prepayment and amendmentfee income every year that is not driven by changes in interest rates
Stable Value Applications
Several of the key attributes of private placements are consistent with stable value investment goals and constraints. Private placements:
■ Are typically investment grade credit quality■ Provide diversification to public investment grade issuers■ Give investors the benefit of increased covenants and protection versus public debt■ Yield pick-up versus public debt enhances a portfolio’s market/book value ratio, and therefore the crediting
rate, in more volatile interest rate environments■ May be less liquid than public bonds, yet the near-term liquidity need for stable value clients is typically not
high and can be satisfied by U.S. Treasurys and other high quality liquid assetsLiability-Driven Investing
Relatively long duration and above average yield make private credit a natural investment for a dedicated liability driven investment strategy. The universe of long-duration public bonds that is suitable for such a strategy is not large. Privates can offer valuable diversification benefits.
Introduction to Investment Grade Private Credit Market Overview and Analysis
9

Insurance Company Portfolio Applications
For many decades, private placement loans have been a mainstay of insurance company portfolios. The long-term nature of their obligations, predictable cash flow, conservative risk posture, financial and legal sophistication and regulatory environment make insurers suitable investors in the asset class. Historically, large life insurers have been the dominant participants in the market; however, new investment vehicles and the willingness of life insurers to accept sub-advisory assignments have brought private placements within reach of a broader range of property and casualty (P&C) companies and other insurers of all sizes.
In terms of risk exposure, the credit quality of life insurers’ private placement holdings is very high, with over 90% rated investment grade, as reflected by designations in the top two NAIC categories. The risk-based capital requirements for privates are exactly the same as public corporate bonds so no extra risk capital is tied up for insurance companies when they shift assets from public bonds to privates.
From a pricing perspective a broadly diversified private credit portfolio will closely track the experience of public corporate bonds and offer similar cross-correlation characteristics with respect to other assets in portfolios. This is because 90% of a typical private portfolio is “matrix priced,” with the biggest input to spread on the matrix being comparable public yield spreads at any given point in time (normally available on a monthly basis). The major differentiator in overall experience emerges when real credit losses occur in portfolios. In that event, privates produce much lower actual credit losses (higher recovery rates) due to the structural protection derived from the private covenants (both financial and priority-based) in the various loan documents — which cannot be duplicated in publicly traded bonds regardless of credit quality rating.
To quantify the effects investing in private credit can have on insurance portfolios, we considered three different hypothetical scenarios: one each for an average life insurer, property-casualty insurer and health insurer. The portfolio allocation data were sourced from the National Association of Insurance Commissioners as of year-end 2017. The historical monthly return and risk data from 2004 to 2017 were based on the published NAIC average asset allocations using the indexes in Figure 7 as proxies for each asset class. The published allocations were adjusted to eliminate assets (such as receivables) that could not be modeled in a historical investment simulation. We maintained the 2016 allocations for the entire simulation period.
Figure 7. Assets and Indexes Used in the Historical Simulations
Asset Type Indexes
Corporate Bonds Bloomberg Barclays U.S. Corporate Investment Grade Index
Private Credit Voya Private Credit Historical Return Series
Municipal Bonds Bloomberg Barclays U.S. Municipal Index
US Government Bloomberg Barclays U.S. Government Index
RMBS/Mortgages Bloomberg Barclays U.S. MBS Index
CMBS Bloomberg Barclays CMBS Index
ABS Bloomberg Barclays ABS Index
Stocks Russell 1000 Index
Real Estate Bloomberg Barclays Investment Grade REIT Index
Cash Three-Month U.S. Treasury Bill
Source: National Association of Insurance Commissioners, Voya Investment Management
In each scenario, an assumed baseline portfolio based on the NAIC portfolio data was used to determine the initial allocations. We then made a series of allocation adjustments to incorporate the private credit investments. Our initial portfolio (Portfolio 1) had 0% allocated to private credit. We then increased the allocation to private credit in 5% increments up to a maximum of 30%. For the life insurance portfolios, the first 15% of the private credit allocations were financed by a reduction in the assumed corporate bond allocation; thereafter, additional allocations were funded by pro-rata reduction of all other asset types in the portfolio. For the P&C and health insurance company portfolios, only the 5% and 10% allocations to private credit were funded by reductions from the corporate bond allocation. Beyond the 10% private credit allocation level, all asset types were reduced on a prorated basis. This approach produced seven hypothetical portfolio allocations for each of the three insurance portfolio types. Portfolio details appear in the Appendix.
Introduction to Investment Grade Private Credit Market Overview and Analysis
10
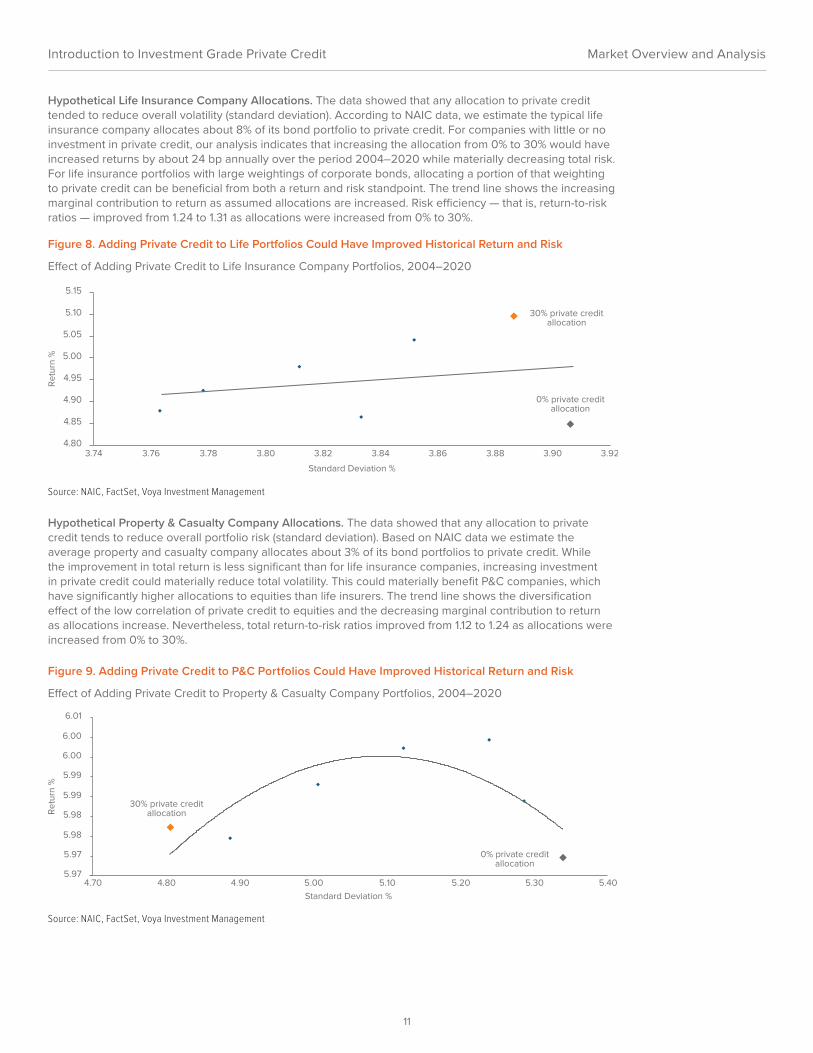
Hypothetical Life Insurance Company Allocations. The data showed that any allocation to private credit tended to reduce overall volatility (standard deviation). According to NAIC data, we estimate the typical life insurance company allocates about 8% of its bond portfolio to private credit. For companies with little or no investment in private credit, our analysis indicates that increasing the allocation from 0% to 30% would have increased returns by about 24 bp annually over the period 2004–2020 while materially decreasing total risk. For life insurance portfolios with large weightings of corporate bonds, allocating a portion of that weighting to private credit can be beneficial from both a return and risk standpoint. The trend line shows the increasing marginal contribution to return as assumed allocations are increased. Risk efficiency — that is, return-to-risk ratios — improved from 1.24 to 1.31 as allocations were increased from 0% to 30%.
Figure 8. Adding Private Credit to Life Portfolios Could Have Improved Historical Return and Risk
Effect of Adding Private Credit to Life Insurance Company Portfolios, 2004–2020
4.80
4.85
4.90
4.95
5.00
5.05
5.10
5.15
3.74 3.76 3.78 3.80 3.82 3.84 3.86 3.88 3.90 3.92
Ret
urn
%
Standard Deviation %
0% private credit allocation
30% private credit allocation
Source: NAIC, FactSet, Voya Investment Management
Hypothetical Property & Casualty Company Allocations. The data showed that any allocation to private credit tends to reduce overall portfolio risk (standard deviation). Based on NAIC data we estimate the average property and casualty company allocates about 3% of its bond portfolios to private credit. While the improvement in total return is less significant than for life insurance companies, increasing investment in private credit could materially reduce total volatility. This could materially benefit P&C companies, which have significantly higher allocations to equities than life insurers. The trend line shows the diversification effect of the low correlation of private credit to equities and the decreasing marginal contribution to return as allocations increase. Nevertheless, total return-to-risk ratios improved from 1.12 to 1.24 as allocations were increased from 0% to 30%.
Figure 9. Adding Private Credit to P&C Portfolios Could Have Improved Historical Return and Risk
Effect of Adding Private Credit to Property & Casualty Company Portfolios, 2004–2020
30% private credit allocation
0% private credit allocation
5.97
5.97
5.98
5.98
5.99
5.99
6.00
6.00
6.01
4.70 4.80 4.90 5.00 5.10 5.20 5.30 5.40
Ret
urn
%
Standard Deviation %
Source: NAIC, FactSet, Voya Investment Management
Introduction to Investment Grade Private Credit Market Overview and Analysis
11
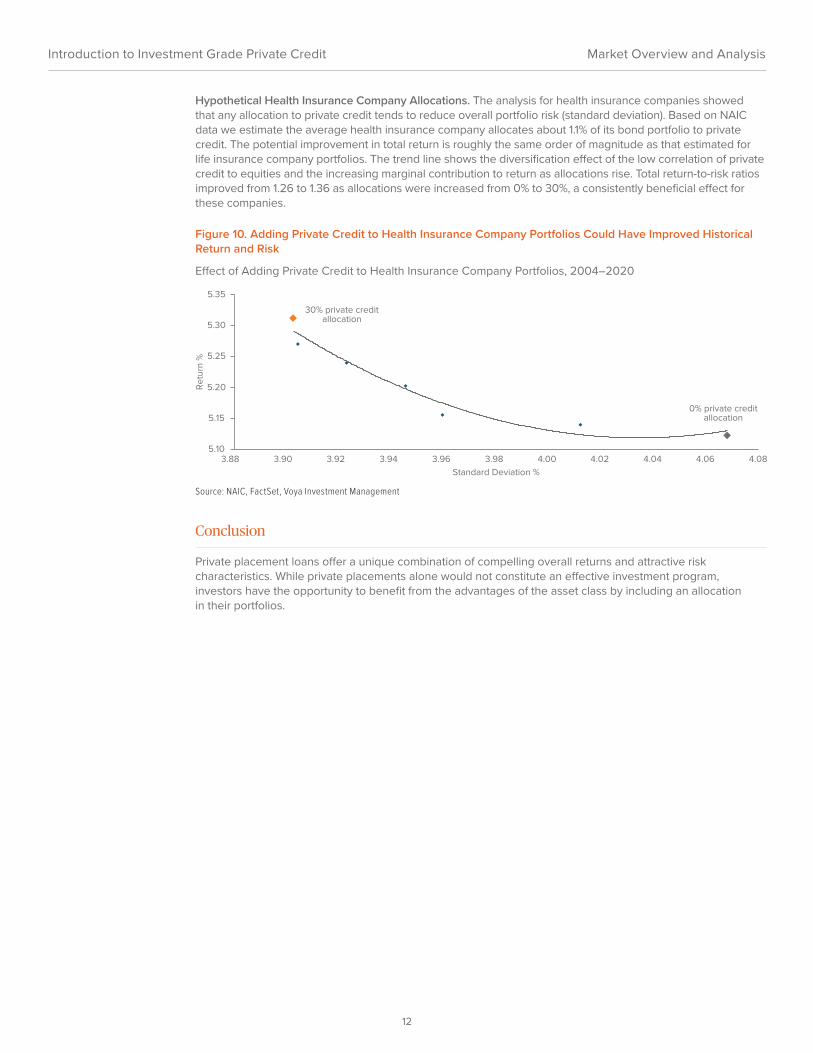
Hypothetical Health Insurance Company Allocations. The analysis for health insurance companies showed that any allocation to private credit tends to reduce overall portfolio risk (standard deviation). Based on NAIC data we estimate the average health insurance company allocates about 1.1% of its bond portfolio to private credit. The potential improvement in total return is roughly the same order of magnitude as that estimated for life insurance company portfolios. The trend line shows the diversification effect of the low correlation of private credit to equities and the increasing marginal contribution to return as allocations rise. Total return-to-risk ratios improved from 1.26 to 1.36 as allocations were increased from 0% to 30%, a consistently beneficial effect for these companies.
Figure 10. Adding Private Credit to Health Insurance Company Portfolios Could Have Improved Historical Return and Risk
Effect of Adding Private Credit to Health Insurance Company Portfolios, 2004–2020
5.10
5.15
5.20
5.25
5.30
5.35
3.88 3.90 3.92 3.94 3.96 3.98 4.00 4.02 4.04 4.06 4.08
Ret
urn
%
Standard Deviation %
30% private credit allocation
0% private credit allocation
Source: NAIC, FactSet, Voya Investment Management
Conclusion
Private placement loans offer a unique combination of compelling overall returns and attractive risk characteristics. While private placements alone would not constitute an effective investment program, investors have the opportunity to benefit from the advantages of the asset class by including an allocation in their portfolios.
Introduction to Investment Grade Private Credit Market Overview and Analysis
12

Introduction to Investment Grade Private Credit
Appendix 1
Risks of Investing in Private CreditPrivate placements are generally investment-grade assets, and like all investments, there are risks associated with investing in a portfolio of private placements.
Below is a description of the primary risks of investing in private placements. The description is not all-inclusive, and before making an investment in a portfolio of private placements, investors should carefully consider such an investment.
The primary risk to an investment in private placements is credit risk. Credit risk is the risk of non-payment of scheduled interest or principal payments on a debt instrument. In the event a borrower fails to pay scheduled interest or principal payments on its debt, a portfolio of private placements would experience a reduction in its income and a decline in market value.
Private placements generally involve less risk than unsecured or subordinated debt and equity instruments of the same issuer because the payment of principal and interest on private placements is a contractual obligation of the issuer that, in most instances, takes precedence over the payment of dividends or the return of capital to the borrower’s shareholders and payments to public bond holders.
In the event of the bankruptcy of a borrower, a creditor could experience delays in receiving regular payments of interest and principal and may not receive the full repayment of its principal.
As described above, portfolios of private placements are also subject to interest rate risk. One risk related to interest rates is the potential for changes in the interest rate spreads for private placements in general. To the extent that changes in market rates of interest are reflected not in a change to the base rate, the U.S. Treasury, but in a change in the spread over the base rate which is payable on loans of the type and quality in which a portfolio invests, a portfolio of private placements could also be adversely affected. This is because the value of a debt is partially a function of whether it is paying what the market perceives to be a market rate of interest, given its individual credit profile and other characteristics.
However, unlike changes in market rates of interest for which there is only a temporary lag before a portfolio reflects those changes, changes in a placement’s value based on changes in the market spreads on loans may be of longer duration.
If spreads rise as described above, for example, in response to deteriorating overall economic conditions and/or excess supply of new loans, the principal value of private placements may decrease in response. On the other hand, if market spreads fall, the value of private placements may increase in response, but borrowers also may renegotiate lower interest rates on their debts or pay off their debts by refinancing at such lower rates. In that case, the borrowers would be required to pay a make-whole amount, which would mitigate the risk.
Private placements trade in a private, unregulated market directly between loan market participants; although most transactions are facilitated by broker-dealers affiliated with large commercial and investment banks. As a result, purchases and sales of private placements typically take longer to settle than similar purchases of bonds and equity securities. In addition, because private placement transactions are directly between investors, there can be greater counterparty risk.
Market Overview and Analysis
13

Moreover, despite the increase in the size and liquidity of the private placement market, the market is still relatively illiquid, particularly when compared to the markets for bonds and equities. As a result, portfolios invested in private placements may experience difficulties and delays in purchasing or selling private placements, with resulting adverse impacts upon the prices obtained. During periods of severe market dislocation, such as occurred at the end of 2007 and during 2008, the market can experience severe illiquidity and significantly depressed prices.
Finally, many borrowers are private companies and/or companies that have not issued other debt that is rated by rating agencies such as Moody’s Investors Service, Standard & Poor, or Fitch Ratings. As a result, investment decisions related to private placements may be based largely on the credit analysis performed by the adviser to the fund or portfolio making the investments, and not on rating agency evaluation. This analysis may be difficult to perform.
Information about a private placement and the related borrower generally is not in the public domain, since private companies and companies that have not issued public debt or securities are not subject to reporting requirements under federal securities laws. However, borrowers are required to regularly provide financial information to lenders, typically in much greater detail than is available in the public markets. Furthermore, information about borrowers may be available from other private placement participants or agents who originate or administer private placements.
This review has been prepared by Voya Investment Management for informational purposes. Nothing contained herein should be construed as (i) an offer to sell or solicitation of an offer to buy any security or (ii) a recommendation as to the advisability of investing in, purchasing or selling any security. The materialpresented is compiled from sources thought to be reliable, but accuracy and completeness cannot beguaranteed. Any opinions expressed herein reflect our judgment and are subject to change. Certain of thestatements contained herein are statements of future expectations and other forward looking statementsthat are based on management’s current views and assumptions and involve known and unknown risks anduncertainties that could cause actual results, performance or events to differ materially from those expressedor implied in such statements. Actual results, performance or events may differ materially from thosein such statements due to, without limitation, (1) general economic conditions, (2) performance of financialmarkets, (3) interest rate levels, (4) increasing defaults, (5) changes in laws and regulations, and (6) changesin the policies of governments and/orregulatory authorities.
Introduction to Investment Grade Private Credit Market Overview and Analysis
14

Appendix 2
Life Insurance, Property & Casualty and Health Insurance Company Portfolio Data
Life Insurance Portfolio (%)Bonds 80.5Stocks 5.0Mortgages 10.9Real Estate 0.7Cash 2.9Total 100.0
Life Insurance Portfolio 7Corporate Bonds Bloomberg Barclays U.S. Corp. Inv’t Grade Index 29.8Private Credit Voya Private Credit Historical Return Series 30.0Municipal Bonds Bloomberg Barclays U.S. Municipal Index 3.9US Government Bloomberg Barclays U.S. Government Index 3.3RMBS/Mortgages Bloomberg Barclays U.S. MBS Index 14.8CMBS Bloomberg Barclays CMBS Index 3.7ABS Bloomberg Barclays ABS Index 4.7Stocks Russell 1000 Index 3.5
Real Estate Bloomberg Barclays Investment Grade REITs Index 0.5
Cash U.S. Treasury Bill 3 Month 5.9Total 100.0
Life Insurance Portfolio 3Corporate Bonds Bloomberg Barclays U.S. Corp. Inv’t Grade Index 38.3Private Credit Voya Private Credit Historical Return Series 10.0Municipal Bonds Bloomberg Barclays U.S. Municipal Index 5.0US Government Bloomberg Barclays U.S. Government Index 4.2RMBS/Mortgages Bloomberg Barclays U.S. MBS Index 19.1CMBS Bloomberg Barclays CMBS Index 4.7ABS Bloomberg Barclays ABS Index 6.1Stocks Russell 1000 Index 4.5
Real Estate Bloomberg Barclays Investment Grade REITs Index 0.6
Cash U.S. Treasury Bill 3 Month 7.6Total 100.0
Life Insurance Portfolio 6Corporate Bonds Bloomberg Barclays U.S. Corp. Inv’t Grade Index 31.9Private Credit Voya Private Credit Historical Return Series 25.0Municipal Bonds Bloomberg Barclays U.S. Municipal Index 4.1US Government Bloomberg Barclays U.S. Government Index 3.5RMBS/Mortgages Bloomberg Barclays U.S. MBS Index 15.9CMBS Bloomberg Barclays CMBS Index 3.9ABS Bloomberg Barclays ABS Index 5.0Stocks Russell 1000 Index 3.8
Real Estate Bloomberg Barclays Investment Grade REITs Index 0.5
Cash U.S. Treasury Bill 3 Month 6.3Total 100.0
Life Insurance Portfolio 2Corporate Bonds Bloomberg Barclays U.S. Corp. Inv’t Grade Index 43.3Private Credit Voya Private Credit Historical Return Series 5.0Municipal Bonds Bloomberg Barclays U.S. Municipal Index 5.0US Government Bloomberg Barclays U.S. Government Index 4.2RMBS/Mortgages Bloomberg Barclays U.S. MBS Index 19.1CMBS Bloomberg Barclays CMBS Index 4.7ABS Bloomberg Barclays ABS Index 6.1Stocks Russell 1000 Index 4.5
Real Estate Bloomberg Barclays Investment Grade REITs Index 0.6
Cash U.S. Treasury Bill 3 Month 7.6Total 100.0
Life Insurance Portfolio 5Corporate Bonds Bloomberg Barclays U.S. Corp. Inv’t Grade Index 34.0Private Credit Voya Private Credit Historical Return Series 20.0Municipal Bonds Bloomberg Barclays U.S. Municipal Index 4.4US Government Bloomberg Barclays U.S. Government Index 3.7RMBS/Mortgages Bloomberg Barclays U.S. MBS Index 17.0CMBS Bloomberg Barclays CMBS Index 4.1ABS Bloomberg Barclays ABS Index 5.4Stocks Russell 1000 Index 4.0
Real Estate Bloomberg Barclays Investment Grade REITs Index 0.5
Cash U.S. Treasury Bill 3 Month 6.8Total 100.0
Life Insurance Portfolio 1Corporate Bonds Bloomberg Barclays U.S. Corp. Inv’t Grade Index 48.3Municipal Bonds Bloomberg Barclays U.S. Municipal Index 5.0US Government Bloomberg Barclays U.S. Government Index 4.2RMBS/Mortgages Bloomberg Barclays U.S. MBS Index 19.1CMBS Bloomberg Barclays CMBS Index 4.7ABS Bloomberg Barclays ABS Index 6.1Stocks Russell 1000 Index 4.5
Real Estate Bloomberg Barclays Investment Grade REITs Index 0.6
Cash U.S. Treasury Bill 3 Month 7.6Total 100.0
Bond AllocationCorporate Bonds 62.8Municipal Bonds 6.5US Government 5.4RMBS 11.7CMBS 6.2ABS 7.4Total 100.0
Life Insurance Portfolio 4Corporate Bonds Bloomberg Barclays U.S. Corp. Inv’t Grade Index 36.1Private Credit Voya Private Credit Historical Return Series 15.0Municipal Bonds Bloomberg Barclays U.S. Municipal Index 4.7US Government Bloomberg Barclays U.S. Government Index 4.0RMBS/Mortgages Bloomberg Barclays U.S. MBS Index 18.1CMBS Bloomberg Barclays CMBS Index 4.4ABS Bloomberg Barclays ABS Index 5.7Stocks Russell 1000 Index 4.2
Real Estate Bloomberg Barclays Investment Grade REITs Index 0.6
Cash U.S. Treasury Bill 3 Month 7.3Total 100.0
Introduction to Investment Grade Private Credit Market Overview and Analysis
15
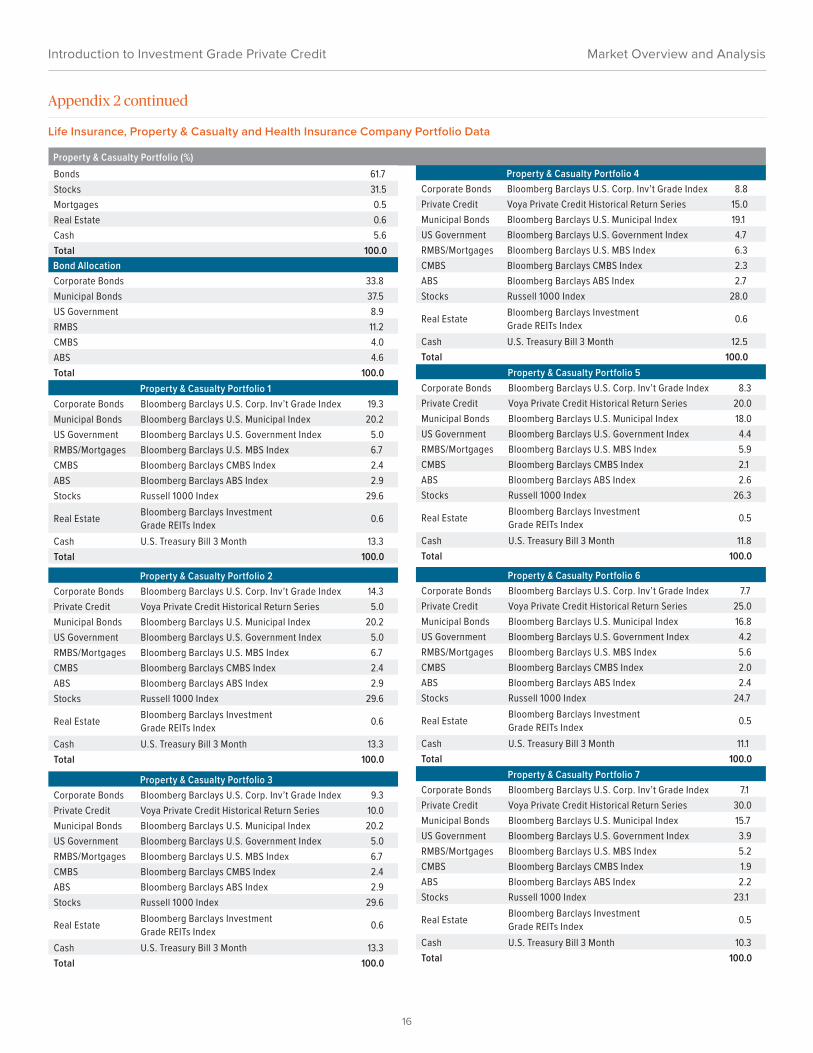
Property & Casualty Portfolio (%)Bonds 61.7Stocks 31.5Mortgages 0.5Real Estate 0.6Cash 5.6Total 100.0
Appendix 2 continued
Life Insurance, Property & Casualty and Health Insurance Company Portfolio Data
Property & Casualty Portfolio 7Corporate Bonds Bloomberg Barclays U.S. Corp. Inv’t Grade Index 7.1Private Credit Voya Private Credit Historical Return Series 30.0Municipal Bonds Bloomberg Barclays U.S. Municipal Index 15.7US Government Bloomberg Barclays U.S. Government Index 3.9RMBS/Mortgages Bloomberg Barclays U.S. MBS Index 5.2CMBS Bloomberg Barclays CMBS Index 1.9ABS Bloomberg Barclays ABS Index 2.2Stocks Russell 1000 Index 23.1
Real Estate Bloomberg Barclays Investment Grade REITs Index 0.5
Cash U.S. Treasury Bill 3 Month 10.3Total 100.0
Property & Casualty Portfolio 6Corporate Bonds Bloomberg Barclays U.S. Corp. Inv’t Grade Index 7.7Private Credit Voya Private Credit Historical Return Series 25.0Municipal Bonds Bloomberg Barclays U.S. Municipal Index 16.8US Government Bloomberg Barclays U.S. Government Index 4.2RMBS/Mortgages Bloomberg Barclays U.S. MBS Index 5.6CMBS Bloomberg Barclays CMBS Index 2.0ABS Bloomberg Barclays ABS Index 2.4Stocks Russell 1000 Index 24.7
Real Estate Bloomberg Barclays Investment Grade REITs Index 0.5
Cash U.S. Treasury Bill 3 Month 11.1Total 100.0
Property & Casualty Portfolio 5Corporate Bonds Bloomberg Barclays U.S. Corp. Inv’t Grade Index 8.3Private Credit Voya Private Credit Historical Return Series 20.0Municipal Bonds Bloomberg Barclays U.S. Municipal Index 18.0US Government Bloomberg Barclays U.S. Government Index 4.4RMBS/Mortgages Bloomberg Barclays U.S. MBS Index 5.9CMBS Bloomberg Barclays CMBS Index 2.1ABS Bloomberg Barclays ABS Index 2.6Stocks Russell 1000 Index 26.3
Real Estate Bloomberg Barclays Investment Grade REITs Index 0.5
Cash U.S. Treasury Bill 3 Month 11.8Total 100.0
Property & Casualty Portfolio 4Corporate Bonds Bloomberg Barclays U.S. Corp. Inv’t Grade Index 8.8Private Credit Voya Private Credit Historical Return Series 15.0Municipal Bonds Bloomberg Barclays U.S. Municipal Index 19.1US Government Bloomberg Barclays U.S. Government Index 4.7RMBS/Mortgages Bloomberg Barclays U.S. MBS Index 6.3CMBS Bloomberg Barclays CMBS Index 2.3ABS Bloomberg Barclays ABS Index 2.7Stocks Russell 1000 Index 28.0
Real Estate Bloomberg Barclays Investment Grade REITs Index 0.6
Cash U.S. Treasury Bill 3 Month 12.5Total 100.0
Property & Casualty Portfolio 3Corporate Bonds Bloomberg Barclays U.S. Corp. Inv’t Grade Index 9.3Private Credit Voya Private Credit Historical Return Series 10.0Municipal Bonds Bloomberg Barclays U.S. Municipal Index 20.2US Government Bloomberg Barclays U.S. Government Index 5.0RMBS/Mortgages Bloomberg Barclays U.S. MBS Index 6.7CMBS Bloomberg Barclays CMBS Index 2.4ABS Bloomberg Barclays ABS Index 2.9Stocks Russell 1000 Index 29.6
Real Estate Bloomberg Barclays Investment Grade REITs Index 0.6
Cash U.S. Treasury Bill 3 Month 13.3Total 100.0
Property & Casualty Portfolio 2Corporate Bonds Bloomberg Barclays U.S. Corp. Inv’t Grade Index 14.3Private Credit Voya Private Credit Historical Return Series 5.0Municipal Bonds Bloomberg Barclays U.S. Municipal Index 20.2US Government Bloomberg Barclays U.S. Government Index 5.0RMBS/Mortgages Bloomberg Barclays U.S. MBS Index 6.7CMBS Bloomberg Barclays CMBS Index 2.4ABS Bloomberg Barclays ABS Index 2.9Stocks Russell 1000 Index 29.6
Real Estate Bloomberg Barclays Investment Grade REITs Index 0.6
Cash U.S. Treasury Bill 3 Month 13.3Total 100.0
Property & Casualty Portfolio 1Corporate Bonds Bloomberg Barclays U.S. Corp. Inv’t Grade Index 19.3Municipal Bonds Bloomberg Barclays U.S. Municipal Index 20.2US Government Bloomberg Barclays U.S. Government Index 5.0RMBS/Mortgages Bloomberg Barclays U.S. MBS Index 6.7CMBS Bloomberg Barclays CMBS Index 2.4ABS Bloomberg Barclays ABS Index 2.9Stocks Russell 1000 Index 29.6
Real Estate Bloomberg Barclays Investment Grade REITs Index 0.6
Cash U.S. Treasury Bill 3 Month 13.3Total 100.0
Bond AllocationCorporate Bonds 33.8Municipal Bonds 37.5US Government 8.9RMBS 11.2CMBS 4.0ABS 4.6Total 100.0
Introduction to Investment Grade Private Credit Market Overview and Analysis
16
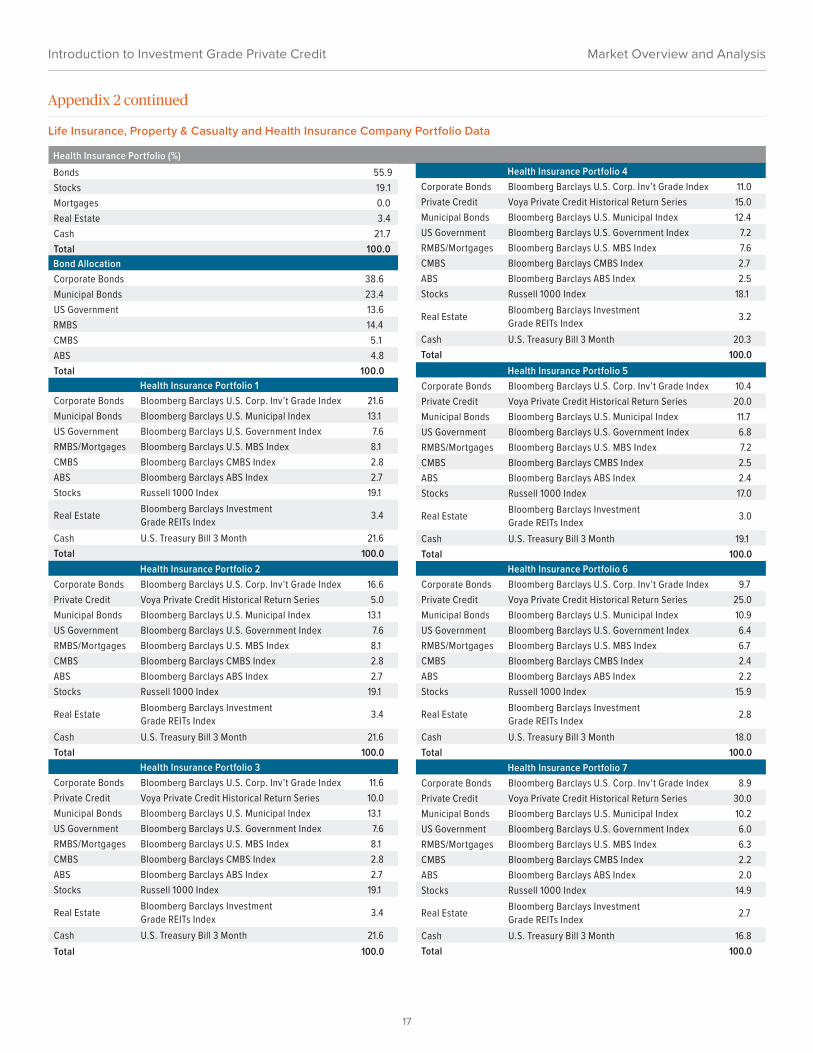
Health Insurance Portfolio (%)Bonds 55.9Stocks 19.1Mortgages 0.0Real Estate 3.4Cash 21.7Total 100.0
Appendix 2 continued
Life Insurance, Property & Casualty and Health Insurance Company Portfolio Data
Health Insurance Portfolio 7Corporate Bonds Bloomberg Barclays U.S. Corp. Inv’t Grade Index 8.9Private Credit Voya Private Credit Historical Return Series 30.0Municipal Bonds Bloomberg Barclays U.S. Municipal Index 10.2US Government Bloomberg Barclays U.S. Government Index 6.0RMBS/Mortgages Bloomberg Barclays U.S. MBS Index 6.3CMBS Bloomberg Barclays CMBS Index 2.2ABS Bloomberg Barclays ABS Index 2.0Stocks Russell 1000 Index 14.9
Real Estate Bloomberg Barclays Investment Grade REITs Index 2.7
Cash U.S. Treasury Bill 3 Month 16.8Total 100.0
Health Insurance Portfolio 6Corporate Bonds Bloomberg Barclays U.S. Corp. Inv’t Grade Index 9.7Private Credit Voya Private Credit Historical Return Series 25.0Municipal Bonds Bloomberg Barclays U.S. Municipal Index 10.9US Government Bloomberg Barclays U.S. Government Index 6.4RMBS/Mortgages Bloomberg Barclays U.S. MBS Index 6.7CMBS Bloomberg Barclays CMBS Index 2.4ABS Bloomberg Barclays ABS Index 2.2Stocks Russell 1000 Index 15.9
Real Estate Bloomberg Barclays Investment Grade REITs Index 2.8
Cash U.S. Treasury Bill 3 Month 18.0Total 100.0
Health Insurance Portfolio 5Corporate Bonds Bloomberg Barclays U.S. Corp. Inv’t Grade Index 10.4Private Credit Voya Private Credit Historical Return Series 20.0Municipal Bonds Bloomberg Barclays U.S. Municipal Index 11.7US Government Bloomberg Barclays U.S. Government Index 6.8RMBS/Mortgages Bloomberg Barclays U.S. MBS Index 7.2CMBS Bloomberg Barclays CMBS Index 2.5ABS Bloomberg Barclays ABS Index 2.4Stocks Russell 1000 Index 17.0
Real Estate Bloomberg Barclays Investment Grade REITs Index 3.0
Cash U.S. Treasury Bill 3 Month 19.1Total 100.0
Health Insurance Portfolio 4Corporate Bonds Bloomberg Barclays U.S. Corp. Inv’t Grade Index 11.0Private Credit Voya Private Credit Historical Return Series 15.0Municipal Bonds Bloomberg Barclays U.S. Municipal Index 12.4US Government Bloomberg Barclays U.S. Government Index 7.2RMBS/Mortgages Bloomberg Barclays U.S. MBS Index 7.6CMBS Bloomberg Barclays CMBS Index 2.7ABS Bloomberg Barclays ABS Index 2.5Stocks Russell 1000 Index 18.1
Real Estate Bloomberg Barclays Investment Grade REITs Index 3.2
Cash U.S. Treasury Bill 3 Month 20.3Total 100.0
Health Insurance Portfolio 3Corporate Bonds Bloomberg Barclays U.S. Corp. Inv’t Grade Index 11.6Private Credit Voya Private Credit Historical Return Series 10.0Municipal Bonds Bloomberg Barclays U.S. Municipal Index 13.1US Government Bloomberg Barclays U.S. Government Index 7.6RMBS/Mortgages Bloomberg Barclays U.S. MBS Index 8.1CMBS Bloomberg Barclays CMBS Index 2.8ABS Bloomberg Barclays ABS Index 2.7Stocks Russell 1000 Index 19.1
Real Estate Bloomberg Barclays Investment Grade REITs Index 3.4
Cash U.S. Treasury Bill 3 Month 21.6Total 100.0
Health Insurance Portfolio 2Corporate Bonds Bloomberg Barclays U.S. Corp. Inv’t Grade Index 16.6Private Credit Voya Private Credit Historical Return Series 5.0Municipal Bonds Bloomberg Barclays U.S. Municipal Index 13.1US Government Bloomberg Barclays U.S. Government Index 7.6RMBS/Mortgages Bloomberg Barclays U.S. MBS Index 8.1CMBS Bloomberg Barclays CMBS Index 2.8ABS Bloomberg Barclays ABS Index 2.7Stocks Russell 1000 Index 19.1
Real Estate Bloomberg Barclays Investment Grade REITs Index 3.4
Cash U.S. Treasury Bill 3 Month 21.6Total 100.0
Health Insurance Portfolio 1Corporate Bonds Bloomberg Barclays U.S. Corp. Inv’t Grade Index 21.6Municipal Bonds Bloomberg Barclays U.S. Municipal Index 13.1US Government Bloomberg Barclays U.S. Government Index 7.6RMBS/Mortgages Bloomberg Barclays U.S. MBS Index 8.1CMBS Bloomberg Barclays CMBS Index 2.8ABS Bloomberg Barclays ABS Index 2.7Stocks Russell 1000 Index 19.1
Real Estate Bloomberg Barclays Investment Grade REITs Index 3.4
Cash U.S. Treasury Bill 3 Month 21.6Total 100.0
Bond AllocationCorporate Bonds 38.6Municipal Bonds 23.4US Government 13.6RMBS 14.4CMBS 5.1ABS 4.8Total 100.0
Introduction to Investment Grade Private Credit Market Overview and Analysis
17

DisclosuresInvestment RisksThere are no guarantees a diversified portfolio will outperform a non-diversified portfolio. Past performance is no guarantee of future results.
All investments in bonds are subject to market risks. Bonds have fixed principal and return if held to maturity, but may fluctuate in the interim. Generally, when interest rates rise, bond prices fall. Bonds with longer maturities tend to be more sensitive to changes in interest rates.
Past performance does not guarantee future results. This market insight has been prepared by Voya Investment Management for informational purposes. Nothing contained herein should be construed as (i) an offer to sell or solicitation of an offer to buy any security or (ii) a recommendation as to the advisability of investing in, purchasing or selling any security. Any opinions expressed herein reflect our judgment and are subject to change. Certain of the statements contained herein are statements of future expectations and other forward-looking statements that are based on management’s current views and assumptions and involve known and unknown risks and uncertainties that could cause actual results, performance or events to differ materially from those expressed or implied in such statements. Actual results, performance or events may differ materially from those in such statements due to, without limitation, (1) general economic conditions, (2) performance of financial markets, (3) interest rate levels, (4) increasing levels of loan defaults (5) changes in laws and regulations and (6) changes in the policies of governments and/or regulatory authorities.
The opinions, views and information expressed in this commentary regarding holdings are subject to change without notice. The information provided regarding holdings is not a recommendation to buy or sell any security. Fund holdings are fluid and are subject to daily change based on market conditions and other factors.
The distribution in the United Kingdom of this Market Insight and any other marketing materials relating to portfolio management services of the investment vehicle is being addressed to, or directed at, only the following persons: (i) persons having professional experience in matters relating to investments, who are “Investment Professionals” as defined in Article 19(5) of the Financial Services and Markets Act 2000 (Financial Promotion) Order 2005 (the “Financial Promotion Order”); (ii) persons falling within any of the categories of persons described in Article 49 (“High net worth companies, unincorporated associations etc.”) of the Financial Promotion Order; and (iii) any other person to whom it may otherwise lawfully be distributed in accordance with the Financial Promotion Order. The investment opportunities described in this Market Insight are available only to such persons; persons of any other description in the United Kingdom should not act or rely on the information in this Market Insight.
The Capital Markets Authority and all other Regulatory Bodies in Kuwait assume no responsibility whatsoever for the contents of this Market Insight and do not approve the contents thereof or verify their validity and accuracy. The Capital Markets Authority and all other Regulatory Bodies in Kuwait assume no responsibility whatsoever for any damages that may result from relying on the contents of this Market Insight either wholly or partially. It is recommended to seek the advice of an Investment Advisor.
Voya Investment Management does not carry on a business in a regulated activity in Hong Kong and is not licensed by the Securities and Futures Commission. This Market Insight is issued for information purposes only. It is not to be construed as an offer or solicitation for the purchase or sale of any financial instruments. It has not been reviewed by the Securities and Futures Commission.
Voya Investment Management accepts no liability whatsoever for any direct, indirect or consequential loss arising from or in connection with any use of, or reliance on, this insight which does not have any regard to the particular needs of any person. Voya Investment Management takes no responsibility whatsoever for any use, reliance or reference by persons other than the intended recipient of this insight. Any prices referred to herein are indicative only and dependent upon market conditions. Past performance is not indicative of future results. Unless otherwise specified, investments are not bank deposits or other obligations of a bank, and the repayment of principal is not insured or guaranteed. They are subject to investment risks, including the possibility that the value of any investment (and income derived thereof, if any) can increase, decrease or in some cases, be entirely lost and investors may not get back the amount originally invested. The contents of this insight have not been reviewed by any regulatory authority in the countries in which it is distributed. The opinions and views herein do not take into account your individual circumstances, objectives, or needs and are not intended to be recommendations of particular financial instruments or strategies to you. This insight does not identify all the risks (direct or indirect) or other considerations which might be material to you when entering any financial transaction. You are advised to exercise caution in relation to any information in this document. If you are in doubt about any of the contents of this insight, you should seek independent professional advice.
This material may not be reproduced in whole or in part in any form whatsoever without the prior written permission of Voya Investment Management.
For financial professional or qualified institutional use only. Not for inspection by, distribution or quotation to, the general public.
©2021 Voya Investments Distributor, LLC • 230 Park Ave, New York, NY 10169 • All rights reserved.
Not FDIC Insured | May Lose Value | No Bank Guarantee
BSWP-PP 033121 • IM1571223 • WLT250007774
voyainvestments.com
Introduction to Investment Grade Private Credit Market Overview and Analysis