Introduction to Information Storage and Management, … · 1.1.2 Types of Data Data can be...
25
STORAGE AREA NETWORKS (10CS765) Janardhan C N Assistant Professor, Dept. of CSE, JIT Davanagere 2015-16 1 Unit No.: 01 – STORAGE AREA NETWORKS (10CS765) Introduction to Information Storage and Management, Storage System Environment Introduction Information is increasingly important in our daily lives. We have become information dependents of the twenty- first century, living in an on-command, on-demand world that means we need information when and where it is required. We access the Internet every day to perform searches, participate in social networking, send and receive e-mails, share pictures and videos, and scores of other applications. Equipped with a growing number of content-generating devices, more information is being created by individuals than by businesses. Information created by individuals gains value when shared with others. Figure 1-1 depicts this virtuous cycle of information. Chapter Objective This chapter describes the evolution of information storage architecture from simple direct-attached models to complex networked topologies. It introduces the information lifecycle management (ILM) strategy, which aligns the information technology (IT) infrastructure with business priorities. 1.1 Information Storage Businesses use data to derive information that is critical to their day-to-day operations. Storage is a repository that enables users to store and retrieve this digital data.
Transcript of Introduction to Information Storage and Management, … · 1.1.2 Types of Data Data can be...

STORAGE AREA NETWORKS (10CS765)
Janardhan C N
Assistant Professor,
Dept. of CSE, JIT Davanagere 2015-16 1
Unit No.: 01 – STORAGE AREA NETWORKS (10CS765)
Introduction to Information Storage and Management, Storage System Environment
Introduction
Information is increasingly important in our daily lives. We have become information dependents of the twenty-
first century, living in an on-command, on-demand world that means we need information when and where it is
required. We access the Internet every day to perform searches, participate in social networking, send and
receive e-mails, share pictures and videos, and scores of other applications. Equipped with a growing number of
content-generating devices, more information is being created by individuals than by businesses.
Information created by individuals gains value when shared with others. Figure 1-1 depicts this virtuous cycle
of information.
Chapter Objective This chapter describes the evolution of information storage architecture from simple direct-attached models to
complex networked topologies. It introduces the information lifecycle management (ILM) strategy, which
aligns the information technology (IT) infrastructure with business priorities.
1.1 Information Storage Businesses use data to derive information that is critical to their day-to-day operations. Storage is a repository
that enables users to store and retrieve this digital data.

STORAGE AREA NETWORKS (10CS765)
Janardhan C N
Assistant Professor,
Dept. of CSE, JIT Davanagere 2015-16 2
1.1.1 Data
Data is a collection of raw facts from which conclusions may be drawn. Handwritten letters, a printed book, a
family photograph, a movie on video tape, printed and duly signed copies of mortgage papers, a bank’s ledgers,
and an account holder’s passbooks are all examples of data.
The data can be generated using a computer and stored in strings of 0s and 1s, as shown in Figure 1-2. Data in
this form is called digital data and is accessible by the user only after it is processed by a computer.
The following is a list of some of the factors that have contributed to the growth of digital data:
1. Increase in data processing capabilities: Modern-day computers provide a significant increase in
processing and storage capabilities. This enables the conversion of various types of content and media from
conventional forms to digital formats.
2. Lower cost of digital storage: Technological advances and decrease in the cost of storage devices have
provided low-cost solutions and encouraged the development of less expensive data storage devices. This cost
benefit has increased the rate at which data is being generated and stored.
3. Affordable and faster communication technology: The rate of sharing digital data is now much faster than
traditional approaches. A handwritten letter may take a week to reach its destination, whereas it only takes a few
seconds for an e‑mail message to reach its recipient.
The importance and the criticality of data vary with time. Most of the data created holds significance in the
short-term but becomes less valuable over time. This governs the type of data storage solutions used.
Individuals store data on a variety of storage devices, such as hard disks, CDs, DVDs, or Universal Serial
Bus (USB) flash drives.
1.1.2 Types of Data
Data can be classified as structured or unstructured (see Figure 1-3) based on how it is stored and managed.
Structured data is organized in rows and columns in a rigidly defined format so that applications can retrieve
and process it efficiently. Structured data is typically stored using a database management system (DBMS).
Data is unstructured if its elements cannot be stored in rows and columns, and is therefore difficult to query and
retrieve by business applications. For example, customer contacts may be stored in various forms such as sticky
notes, e-mail messages, business cards, or even digital format files such as .doc, .txt, and .pdf.

STORAGE AREA NETWORKS (10CS765)
Janardhan C N
Assistant Professor,
Dept. of CSE, JIT Davanagere 2015-16 3
1.1.3 Information
Information is the intelligence and knowledge derived from data. Data, whether structured or unstructured, does
not fulfill any purpose for individuals or businesses unless it is presented in a meaningful form. Businesses need
to analyze data for it to be of value.
Effective data analysis not only extends its benefits to existing businesses, but also creates the potential for new
business opportunities by using the information in creative ways.
Example: Job portal. In order to reach a wider set of prospective employers, job seekers post their résumés on
various websites offering job search facilities. These websites collect the résumés and post them on centrally
accessible locations for prospective employers. In addition, companies post available positions on job search
sites. Job-matching software matches keywords from résumés to keywords in job postings. In this manner, the
job search engine uses data and turns it into information for employers and job seekers.
1.1.4 Storage
Data created by individuals or businesses must be stored so that it is easily accessible for further processing. In
a computing environment, devices designed for storing data are termed storage devices or simply storage.
Devices such as memory in a cell phone or digital camera, DVDs, CD-ROMs, and hard disks in personal
computers are examples.
1.2 Evolution of Storage Technology and Architecture Historically, organizations had centralized computers (mainframe) and information storage devices (tape reels
and disk packs) in their data center. The evolution of open systems and the affordability and ease of deployment
that they offer made it possible for business units/departments to have their own servers and storage. In earlier
implementations of open systems, the storage was typically internal to the server.
Originally, there were very limited policies and processes for managing the servers and the data created. To
overcome these challenges, storage technology evolved from non-intelligent internal storage to intelligent
networked storage (see Figure 1-4).

STORAGE AREA NETWORKS (10CS765)
Janardhan C N
Assistant Professor,
Dept. of CSE, JIT Davanagere 2015-16 4
The technology evolution includes:
1. Redundant Array of Independent Disks (RAID): This technology was developed to address the cost,
performance, and availability requirements of data. It continues to evolve today and is used in all storage
architectures such as DAS, SAN, and so on.
2. Direct-attached storage (DAS): This type of storage connects directly to a server (host) or a group of
servers in a cluster. Storage can be either internal or external to the server. External DAS alleviated the
challenges of limited internal storage capacity.
3. Storage area network (SAN): This is a dedicated, high-performance Fibre Channel (FC) network to
facilitate block-level communication between servers and storage. Storage is partitioned and assigned to a server
for accessing its data. SAN offers scalability, availability, performance, and cost benefits compared to DAS.
4. Network-attached storage (NAS): This is dedicated storage for file serving applications. Unlike a SAN, it
connects to an existing communication network (LAN) and provides file access to heterogeneous clients.
Because it is purposely built for providing storage to file server applications, it offers higher scalability,
availability, performance, and cost benefits compared to general purpose file servers.
5. Internet Protocol SAN (IP-SAN): One of the latest evolutions in storage architecture, IP-SAN is a
convergence of technologies used in SAN and NAS. IP-SAN provides block-level communication across a
local or wide area network (LAN or WAN), resulting in greater consolidation and availability of data.
1.3 Data Center Infrastructure Organizations maintain data centers to provide centralized data processing capabilities across the enterprise.
Data centers store and manage large amounts of mission-critical data.
The data center infrastructure includes 1) computers, 2) storage systems, 3) network devices, 4) dedicated
power backups, 5) and environmental controls (such as air conditioning and fire suppression).

STORAGE AREA NETWORKS (10CS765)
Janardhan C N
Assistant Professor,
Dept. of CSE, JIT Davanagere 2015-16 5
1.3.1 Core Elements
Five core elements are essential for the basic functionality of a data center:
1. Application: An application is a computer program that provides the logic for computing operations.
Applications, such as an order processing system, can be layered on a database, which in turn uses operating
system services to perform read/write operations to storage devices.
2. Database: More commonly, a database management system (DBMS) provides a structured way to store data
in logically organized tables that are interrelated. A DBMS optimizes the storage and retrieval of data.
3. Server and operating system: A computing platform that runs applications and databases.
4. Network: A data path that facilitates communication between clients and servers or between servers and
storage.
5. Storage array: A device that stores data persistently for subsequent use.
Example: Figure 1-5 shows an order processing system that involves the five core elements of a data center and
illustrates their functionality in a business process.
Figure 1-5: Example of an order processing system
Step 1: A customer places an order through the AUI of the order processing application software located on the
client computer.
Step 2: The client connects to the server over the LAN and accesses the DBMS located on the server to update
the relevant information such as the customer name, address, payment method, products ordered, and quantity
ordered.
Step 3: The DBMS uses the server operating system to read and write this data to the database located on
physical disks in the storage array.
Step 4: The Storage Network provides the communication link between the server and the storage array and
transports the read or write commands between them.
Step 5: The storage array, after receiving the read or write commands from the server, performs the necessary
operations to store the data on physical disks.
1.3.2 Key Requirements for Data Center Elements
Uninterrupted operation of data centers is critical to the survival and success of a business. It is necessary to
have a reliable infrastructure that ensures data is accessible at all times. While the requirements, shown in
Figure 1-6, are applicable to all elements of the data center infrastructure, our focus here is on storage systems.

STORAGE AREA NETWORKS (10CS765)
Janardhan C N
Assistant Professor,
Dept. of CSE, JIT Davanagere 2015-16 6
1 Availability: All data center elements should be designed to ensure accessibility. The inability of users to
access data can have a significant negative impact on a business.
2 Security: Polices, procedures, and proper integration of the data center core elements that will prevent
unauthorized access to information must be established. In addition to the security measures for client access,
specific mechanisms must enable servers to access only their allocated resources on storage arrays.
3 Scalability: Data center operations should be able to allocate additional processing capabilities or storage on
demand, without interrupting business operations. Business growth often requires deploying more servers, new
applications, and additional databases. The storage solution should be able to grow with the business.
4 Performance: All the core elements of the data center should be able to provide optimal performance and
service all processing requests at high speed. The infrastructure should be able to support performance
requirements.
5 Data integrity: Data integrity refers to mechanisms such as error correction codes or parity bits which ensure
that data is written to disk exactly as it was received. Any variation in data during its retrieval implies
corruption, which may affect the operations of the organization.
6 Capacity: Data center operations require adequate resources to store and process large amounts of data
efficiently. When capacity requirements increase, the data center must be able to provide additional capacity
without interrupting availability, or, at the very least, with minimal disruption.
Capacity may be managed by reallocation of existing resources, rather than by adding new resources.
7 Manageability: A data center should perform all operations and activities in the most efficient manner.
Manageability can be achieved through automation and the reduction of human (manual) intervention in
common tasks.
1.3.3 Managing Storage Infrastructure
Managing a modern, complex data center involves many tasks. Key management activities include:
1 Monitoring is the continuous collection of information and the review of the entire data center infrastructure.
The aspects of a data center that are monitored include security, performance, accessibility, and capacity.

STORAGE AREA NETWORKS (10CS765)
Janardhan C N
Assistant Professor,
Dept. of CSE, JIT Davanagere 2015-16 7
2 Reporting is done periodically on resource performance, capacity, and utilization. Reporting tasks help to
establish business justifications and chargeback of costs associated with data center operations.
3 Provisioning is the process of providing the hardware, software, and other resources needed to run a data
center. Provisioning activities include capacity and resource planning. Capacity planning ensures that the user’s
and the application’s future needs will be addressed in the most cost-effective and controlled manner. Resource
planning is the process of evaluating and identifying required resources, such as personnel, the facility (site),
and the technology.
1.4 Key Challenges in Managing Information In order to frame an effective information management policy, businesses need to consider the following key
challenges of information management:
1 Exploding digital universe: The rate of information growth is increasing exponentially. Duplication of data
to ensure high availability and repurposing has also contributed to the multifold increase of information growth.
2 Increasing dependency on information: The strategic use of information plays an important role in
determining the success of a business and provides competitive advantages in the marketplace.
3 Changing value of information: Information that is valuable today may become less important tomorrow.
The value of information often changes over time.
1.5 Information Lifecycle The information lifecycle is the “change in the value of information” over time. When data is first created, it
often has the highest value and is used frequently. As data ages, it is accessed less frequently and is of less value
to the organization.
For example, in a sales order application, the value of the information changes from the time the order is
placed until the time that the warranty becomes void (see Figure 1-7). The value of the information is highest
when a company receives a new sales order and processes it to deliver the product.
After order fulfillment, the customer or order data need not be available for real-time access. The company can
transfer this data to less expensive secondary storage with lower accessibility and availability requirements
unless or until a warranty claim or another event triggers its need.

STORAGE AREA NETWORKS (10CS765)
Janardhan C N
Assistant Professor,
Dept. of CSE, JIT Davanagere 2015-16 8
1.5.1 Information Lifecycle Management
Today’s business requires data to be protected and available 24 × 7. Data centers can accomplish this with the
optimal and appropriate use of storage infrastructure.
Information lifecycle management (ILM) is a proactive strategy that enables an IT organization to effectively
manage the data throughout its lifecycle, based on predefined business policies. This allows an IT organization
to optimize the storage infrastructure for maximum return on investment.
An ILM strategy should include the following characteristics:
1 Business-centric: It should be integrated with key processes, applications, and initiatives of the business to
meet both current and future growth in information.
2 Centrally managed: All the information assets of a business should be under the purview of the ILM
strategy.
3 Policy-based: The implementation of ILM should not be restricted to a few departments. ILM should be
implemented as a policy and encompass all business applications, processes, and resources.
4 Heterogeneous: An ILM strategy should take into account all types of storage platforms and operating
systems.
5 Optimized: Because the value of information varies, an ILM strategy should consider the different storage
requirements and allocate storage resources based on the information’s value to the business.
1.5.2 ILM Implementation
The process of developing an ILM strategy includes four activities—classifying, implementing, managing, and
organizing:
1 Classifying data and applications on the basis of business rules and policies to enable differentiated treatment
of information
2 Implementing policies by using information management tools, starting from the creation of data and ending
with its disposal
3 Managing the environment by using integrated tools to reduce operational complexity
4 Organizing storage resources in tiers to align the resources with data classes, and storing information in the
right type of infrastructure based on the information’s current value.
Implementing ILM across an enterprise is an ongoing process. Figure 1-8 illustrates a three-step road map to
enterprise-wide ILM.
Step 1 the goal is to implement a storage networking environment. Storage architectures offer varying levels of
protection and performance and this acts as a foundation for future policy-based information management in
Steps 2 and 3. The value of tiered storage platforms can be exploited by allocating appropriate storage resources
to the applications based on the value of the information processed.
Step 2 takes ILM to the next level, with detailed application or data classification and linkage of the storage
infrastructure to business policies. These classifications and the resultant policies can be automatically executed
using tools for one or more applications, resulting in better management and optimal allocation of storage
resources.
Step 3 of the implementation is to automate more of the applications or data classification and policy
management activities in order to scale to a wider set of enterprise applications.

STORAGE AREA NETWORKS (10CS765)
Janardhan C N
Assistant Professor,
Dept. of CSE, JIT Davanagere 2015-16 9
1.5.3 ILM Benefits
Implementing an ILM strategy has the following key benefits that directly address the challenges of information
management:
1 Improved utilization by using tiered storage platforms and increased visibility of all enterprise information.
2 Simplified management by integrating process steps and interfaces with individual tools and by increasing
automation.
3 A wider range of options for backup, and recovery to balance the need for business continuity.
4 Maintaining compliance by knowing what data needs to be protected for what length of time.
5 Lower Total Cost of Ownership (TCO) by aligning the infrastructure and management costs with information
value. As a result, resources are not wasted, and complexity is not introduced by managing low-value data at the
expense of high-value data.
2 Storage System Environment Storage, as one of the core elements of a data center, is recognized as a distinct resource and it needs focus and
specialization for its implementation and management. The data flows from an application to storage through
various components collectively referred as a storage system environment. The three main components in this
environment are the host, connectivity, and storage. These entities, along with their physical and logical
components, facilitate data access.
Chapter Objective
This chapter details the storage system environment and focuses primarily on storage. It provides details on
various hardware components of a disk drive, disk geometry, and the fundamental laws that govern disk
performance. The connectivity between the host and storage facilitated by bus technology and interface
protocols is also explained.

STORAGE AREA NETWORKS (10CS765)
Janardhan C N
Assistant Professor,
Dept. of CSE, JIT Davanagere 2015-16 10
2.1 Components of a Storage System Environment
2.1.1 Host
Users store and retrieve data through applications. The computers on which these applications run are referred
to as hosts. Hosts can range from simple laptops to complex clusters of servers.
Physical Components
A host has three key physical components:
■ Central processing unit (CPU)
■ Storage, such as internal memory and disk devices
■ Input/Output (I/O) devices
CPU
The CPU consists of four main components:
■Arithmetic Logic Unit (ALU): This is the fundamental building block of the CPU. It performs arithmetical
and logical operations such as addition, subtraction, and Boolean functions (AND, OR, and NOT).
■ Control Unit: A digital circuit that controls CPU operations and coordinates the functionality of the CPU.
■ Register: A collection of high-speed storage locations. The registers store intermediate data that is required
by the CPU to execute an instruction and provide fast access because of their proximity to the ALU. CPUs
typically have a small number of registers.
■ Level 1 (L1) cache: Found on modern day CPUs, it holds data and program instructions that are likely to be
needed by the CPU in the near future. The L1 cache is slower than registers, but provides more storage space.
Storage
Memory and storage media are used to store data, either persistently or temporarily. Memory modules are
implemented using semiconductor chips, whereas storage devices use either magnetic or optical media.
There are two types of memory on a host:
■ Random Access Memory (RAM): This allows direct access to any memory location and can have data
written into it or read from it. RAM is volatile; this type of memory requires a constant supply of power to
maintain memory cell content. Data is erased when the system’s power is turned off or interrupted.
■ Read-Only Memory (ROM): Non-volatile and only allows data to be read from it. ROM holds data for
execution of internal routines, such as system startup.
I/O Devices
I/O devices enable sending and receiving data to and from a host. This communication may be one of the
following types:
■User to host communications: Handled by basic I/O devices, such as the keyboard, mouse, and monitor.
These devices enable users to enter data and view the results of operations.
■Host to host communications: Enabled using devices such as a Network Interface Card (NIC) or modem.
■Host to storage device communications: Handled by a Host Bus Adaptor (HBA). HBA is an application-
specific integrated circuit (ASIC) board that performs I/O interface functions between the host and the storage,
relieving the CPU from additional I/O processing workload.
2.1.2 Connectivity
Connectivity refers to the interconnection between hosts or between a host and any other peripheral devices,
such as printers or storage devices. The components of connectivity in a storage system environment can be
classified as physical and logical. The physical components are the hardware elements that connect the host to
storage and the logical components of connectivity are the protocols used for communication between the host
and storage.
Physical Components of Connectivity
The three physical components of connectivity between the host and storage are Bus, Port, and Cable.

STORAGE AREA NETWORKS (10CS765)
Janardhan C N
Assistant Professor,
Dept. of CSE, JIT Davanagere 2015-16 11
1. The bus is the collection of paths that facilitates data transmission from one part of a computer to another,
such as from the CPU to the memory.
2. The port is a specialized outlet that enables connectivity between the host and external devices.
3. Cables connect hosts to internal or external devices using copper or fiber optic media.
Physical components communicate across a bus by sending bits (control, data, and address) of data between
devices.
These bits are transmitted through the bus in either of the following ways:
■ Serially: Bits are transmitted sequentially along a single path. This transmission can be unidirectional or
bidirectional.
■ In parallel: Bits are transmitted along multiple paths simultaneously. Parallel can also be bidirectional.
Buses, as conduits of data transfer on the computer system, can be classified as follows:
■ System bus: The bus that carries data from the processor to memory.
■ Local or I/O bus: A high-speed pathway that connects directly to the processor and carries data between the
peripheral devices, such as storage devices and the processor.
Logical Components of Connectivity
PCI
PCI is a specification that standardizes how PCI expansion cards, such as network cards or modems, exchange
information with the CPU. PCI provides the interconnection between the CPU and attached devices. The plug-
and-play functionality of PCI enables the host to easily recognize and configure new cards and devices. The
width of a PCI bus can be 32 bits or 64 bits. A 32-bit PCI bus can provide a throughput of 133 MB/s. PCI
Express is an enhanced version of PCI bus with considerably higher throughput and clock speed.
IDE/ATA
IDE/ATA is the most popular interface protocol used on modern disks. This protocol offers excellent
performance at relatively low cost. Details of IDE/ATA are provided in Chapter 5.
SCSI
SCSI has emerged as a preferred protocol in high-end computers. This interface is far less commonly used than
IDE/ATA on personal computers due to its higher cost. SCSI was initially used as a parallel interface, enabling
the connection of devices to a host. SCSI has been enhanced and now includes a wide variety of related
technologies and standards. Chapter 5 provides details of SCSI.
2.1.3 Storage
A storage device uses magnetic or solid state media.
1. Disks, tapes, and diskettes use magnetic media.

STORAGE AREA NETWORKS (10CS765)
Janardhan C N
Assistant Professor,
Dept. of CSE, JIT Davanagere 2015-16 12
2. CD-ROM is an example of a storage device that uses optical media
3. Removable flash memory card is an example of solid state media.
4. Tapes are a popular storage media used for backup because of their relatively low cost. Tape has the
following limitations:
■ Data is stored on the tape linearly along the length of the tape. Search and retrieval of data is done
sequentially, invariably taking several seconds to access the data. As a result, random data access is slow and
time consuming. This limits tapes as a viable option for applications that require real-time, rapid access to data.
■ In a shared computing environment, data stored on tape cannot be accessed by multiple applications
simultaneously, restricting its use to one application at a time.
■On a tape drive, the read/write head touches the tape surface, so the tape degrades or wears out after repeated
use.
■ The storage and retrieval requirements of data from tape and the overhead associated with managing tape
media are significant.
5. Optical disk storage is popular in small, single-user computing environments. It is frequently used by
individuals to store photos or as a backup medium on personal/laptop computers. It is also used as a distribution
medium for single applications, such as games, or as a means of transferring small amounts of data from one
self-contained system to another. Optical disks have limited capacity and speed, which limits the use of optical
media as a business data storage solution.
2.2 Disk Drive Components
A disk drive uses a rapidly moving arm to read and write data across a flat platter coated with magnetic
particles. Data is transferred from the magnetic platter through the R/W head to the computer. Several platters
are assembled together with the R/W head and controller, most commonly referred to as a hard disk drive
(HDD). Data can be recorded and erased on a magnetic disk any number of times.
Key components of a disk drive are platter, spindle, read/write head, actuator arm assembly, and controller
(Figure 2-2)
2.2.1 Platter
A typical HDD consists of one or more flat circular disks called platters (Figure 2-3). The data is recorded on
these platters in binary codes (0s and 1s). The set of rotating platters is sealed in a case, called a Head Disk
Assembly (HDA). The data is encoded by polarizing the magnetic area, or domains, of the disk surface. Data can
be written to or read from both surfaces of the platter.
STORAGE AREA NETWORKS (10CS765)
Janardhan C N
Assistant Professor,
Dept. of CSE, JIT Davanagere 2015-16 13
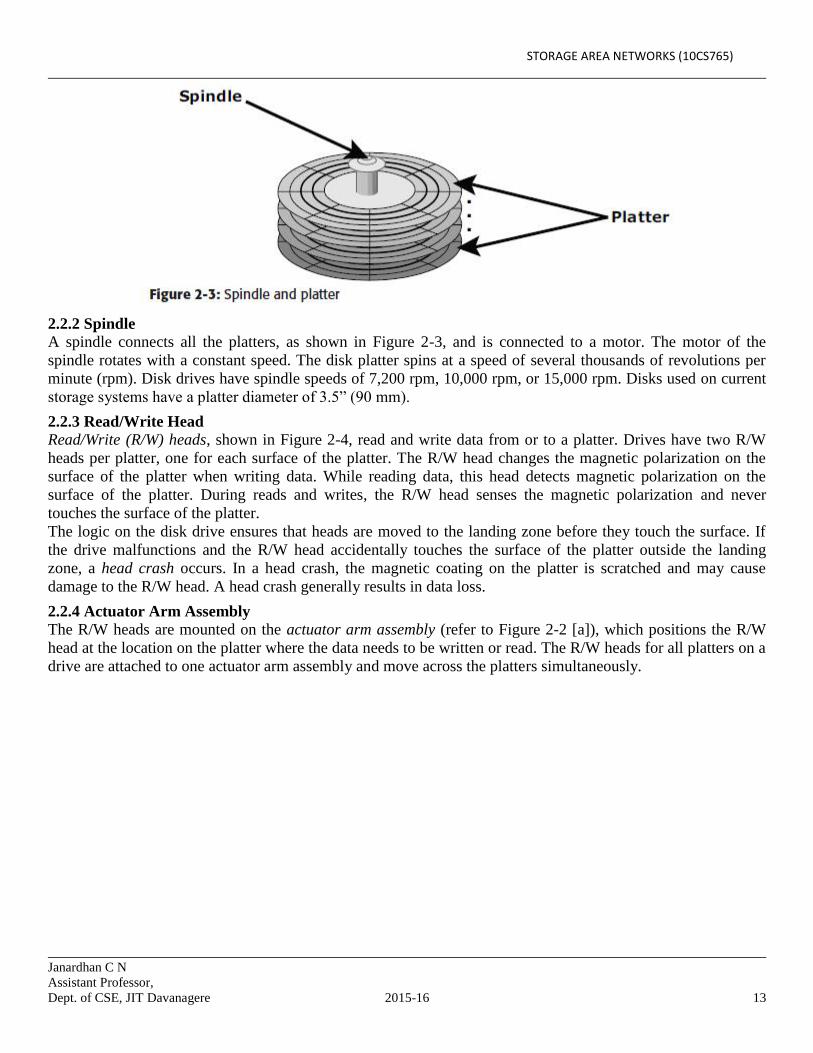
2.2.2 Spindle
A spindle connects all the platters, as shown in Figure 2-3, and is connected to a motor. The motor of the
spindle rotates with a constant speed. The disk platter spins at a speed of several thousands of revolutions per
minute (rpm). Disk drives have spindle speeds of 7,200 rpm, 10,000 rpm, or 15,000 rpm. Disks used on current
storage systems have a platter diameter of 3.5” (90 mm).
2.2.3 Read/Write Head
Read/Write (R/W) heads, shown in Figure 2-4, read and write data from or to a platter. Drives have two R/W
heads per platter, one for each surface of the platter. The R/W head changes the magnetic polarization on the
surface of the platter when writing data. While reading data, this head detects magnetic polarization on the
surface of the platter. During reads and writes, the R/W head senses the magnetic polarization and never
touches the surface of the platter.
The logic on the disk drive ensures that heads are moved to the landing zone before they touch the surface. If
the drive malfunctions and the R/W head accidentally touches the surface of the platter outside the landing
zone, a head crash occurs. In a head crash, the magnetic coating on the platter is scratched and may cause
damage to the R/W head. A head crash generally results in data loss.
2.2.4 Actuator Arm Assembly
The R/W heads are mounted on the actuator arm assembly (refer to Figure 2-2 [a]), which positions the R/W
head at the location on the platter where the data needs to be written or read. The R/W heads for all platters on a
drive are attached to one actuator arm assembly and move across the platters simultaneously.

STORAGE AREA NETWORKS (10CS765)
Janardhan C N
Assistant Professor,
Dept. of CSE, JIT Davanagere 2015-16 14
2.2.5 Controller
The controller (see Figure 2-2 [b]) is a printed circuit board, mounted at the bottom of a disk drive. It consists
of a microprocessor, internal memory, circuitry, and firmware. The firmware controls power to the spindle
motor and the speed of the motor. It also manages communication between the drive and the host.
2.2.6 Physical Disk Structure
Data on the disk is recorded on tracks, which are concentric rings on the platter around the spindle, as shown in
Figure 2-5. The tracks are numbered, starting from zero, from the outer edge of the platter. The number of
tracks per inch (TPI) on the platter (or the track density) measures how tightly the tracks are packed on a
platter. Each track is divided into smaller units called sectors. A sector is the smallest, individually addressable
unit of storage.

STORAGE AREA NETWORKS (10CS765)
Janardhan C N
Assistant Professor,
Dept. of CSE, JIT Davanagere 2015-16 15
2.2.7 Zoned Bit Recording
Zone bit recording utilizes the disk efficiently. As shown in Figure 2-6 (b), this mechanism groups tracks into
zones based on their distance from the center of the disk. The zones are numbered, with the outermost zone
being zone 0. An appropriate number of sectors per track are assigned to each zone, so a zone near the center of
the platter has fewer sectors per track than a zone on the outer edge.
2.2.8 Logical Block Addressing Earlier drives used physical addresses consisting of the cylinder, head, and sector (CHS) number to refer to
specific locations on the disk, as shown in Figure 2-7 (a), and the host operating system had to be aware of the
geometry of each disk being used. Logical block addressing (LBA), shown in Figure 2-7 (b), simplifies
addressing by using a linear address to access physical blocks of data. The disk controller translates LBA to a
CHS address, and the host only needs to know the size of the disk drive in terms of the number of blocks.
In Figure 2-7 (b), the drive shows eight sectors per track, eight heads, and four cylinders. This means a total of 8
× 8 × 4 = 256 blocks, so the block number ranges from 0 to 255. Each block has its own unique address.

STORAGE AREA NETWORKS (10CS765)
Janardhan C N
Assistant Professor,
Dept. of CSE, JIT Davanagere 2015-16 16
Assuming that the sector holds 512 bytes, a 500 GB drive with a formatted capacity of 465.7 GB will have in
excess of 976,000,000 blocks.
2.3 Disk Drive Performance A disk drive is an electromechanical device that governs the overall performance of the storage system
environment.
The various factors that affect the performance of disk drives are discussed in this section.
2.3.1 Disk Service Time
Disk service time is the time taken by a disk to complete an I/O request. Components that contribute to service
time on a disk drive are seek time, rotational latency, and data transfer rate.
1. Seek Time
The seek time (also called access time) describes the time taken to position the R/W heads across the platter
with a radial movement (moving along the radius of the platter). In other words, it is the time taken to reposition
and settle the arm and the head over the correct track. The lower the seek time, the faster the I/O operation. Disk
vendors publish the following seek time specifications:
■Full Stroke: The time taken by the R/W head to move across the entire width of the disk, from the innermost
track to the outermost track.
■Average: The average time taken by the R/W head to move from one random track to another, normally listed
as the time for one-third of a full stroke.
■Track-to-Track: The time taken by the R/W head to move between adjacent tracks.
2. Rotational Latency
To access data, the actuator arm moves the R/W head over the platter to a particular track while the platter spins
to position the requested sector under the R/W head. The time taken by the platter to rotate and position the data
under the R/W head is called rotational latency. This latency depends on the rotation speed of the spindle and is
measured in milliseconds.
3. Data Transfer Rate

STORAGE AREA NETWORKS (10CS765)
Janardhan C N
Assistant Professor,
Dept. of CSE, JIT Davanagere 2015-16 17
The data transfer rate (also called transfer rate) refers to the average amount of data per unit time that the drive
can deliver to the HBA. In a read operation, the data first moves from disk platters to R/W heads, and then it
moves to the drive’s internal buffer. Finally, data moves from the buffer through the interface to the host HBA.
In a write operation, the data moves from the HBA to the internal buffer of the disk drive through the drive’s
interface. The data then moves from the buffer to the R/W heads. Finally, it moves from the R/W heads to the
platters.
Internal transfer rate is the speed at which data moves from a single track of a platter’s surface to internal
buffer (cache) of the disk. Internal transfer rate takes into account factors such as the seek time.
External transfer rate is the rate at which data can be moved through the interface to the HBA. External
transfer rate is generally the advertised speed of the interface, such as 133 MB/s for ATA.
2.4 Fundamental Laws Governing Disk Performance To understand the laws of disk performance, a disk can be viewed as a black box consisting of two elements:
■Queue: The location where I/O request waits before it is processed by the I/O controller.
■Disk I/O Controller: Processes I/Os that are waiting in the queue one by one.
The I/O requests arrive at the controller at the rate generated by the application. This rate is also called the
arrival rate. These requests are held in the I/O queue, and the I/O controller processes them one by one, as
shown in Figure 2-9. The I/O arrival rate, the queue length, and the time taken by the I/O controller to process
each request determines the performance of the disk system, which is measured in terms of response time.
Little’s Law is a fundamental law describing the relationship between the number of requests in a queue and the
response time. The law states the following relation (numbers in parentheses indicate the equation number for
crossreferencing):
N = a × R ------------------ (1)
where
“N” is the total number of requests in the queuing system (requests in the queue + requests in the I/O controller)
“a” is the arrival rate, or the number of I/O requests that arrive to the system per unit of time

STORAGE AREA NETWORKS (10CS765)
Janardhan C N
Assistant Professor,
Dept. of CSE, JIT Davanagere 2015-16 18
“R” is the average response time or the turnaround time for an I/O request — the total time from arrival to
departure from the system
The utilization law is another important law that defines the I/O controller utilization. This law states the
relation:
U = a × Rs ---------------- (2)
where
“U” is the I/O controller utilization
“Rs“ is the service time, or the average time spent by a request on the controller. 1/RS is the service rate.
From the arrival rate “a”, the average inter-arrival time, Ra, can be computed as:
Ra = 1/a ------------------ (3)
Consequently, utilization can be defined as the ratio of the service time to the
average inter-arrival time, and is expressed as:
U = Rs /Ra --------------- (4)
The value of this ratio varies between 0 and 1.
In the following equation, the term average response rate (S) can be defined as the reciprocal of the average
response time (R), and is derived as follows:
S = service rate – arrival rate
Consequently,
R = 1 / (service rate – arrival rate)
R = 1 / (1/Rs - 1/Ra)
= 1 / (1/Rs-a) (from eq. 3)
= Rs / (1-a × Rs)
R = Rs / (1-U) -------------- (5) (from eq. 2)
As a result,
Average response time (R) = service time / (1 – utilization) (from equation 2)
Utilization (U) can also be used to represent the average number of I/O requests on the controller, as shown in
the following:
Number of requests in the queue (NQ) = Number of requests in the system (N)
– Number of requests on the controller or utilization (U). Number of requests in a queue is also referred to as
average queue size.
Nq = N – U
= a × R – U (from eq. 1)
= a × (Rs / (1 – U)) – U (from eq. 5)
= (Rs /Ra) / (1 – U) – U (from eq. 3)
= U / (1 – U) – U (from eq. 4)
= U (1 / (1 –U) – 1)
= U2 / (1–U) ------------- (6)
The time spent by a request in the queue is equal to the time spent by a request in the system, or the average
response time minus the time spent by a request on the controller for processing:
= Rs / (1 – U) – Rs (from eq. 5)
= U × RS / (1 – U)
= U × avg. response time
= Utilization × R --------------- (7)

STORAGE AREA NETWORKS (10CS765)
Janardhan C N
Assistant Professor,
Dept. of CSE, JIT Davanagere 2015-16 19
Ex: Consider a disk I/O system in which an I/O request arrives at a rate of 100 I/Os per second. The service
time, Rs, is 8 ms. The following measures of disk performance can be computed using the relationships
developed above — utilization of I/O controller (U), total response time (R), average queue size [ U2 / (1 – U)]
and total time spent by a request in a queue (U × R), as follows:
Arrival rate (a) = 100 I/O/s; consequently, the arrival time
Ra = 1/a = 10 ms
Rs = 8 ms (given)
1. Utilization (U) = Rs / Ra = 8 / 10 = 0.8 or 80%
2. Response time (R) = Rs /(1 – U) = 8 / (1 – 0.8) = 40 ms
3. Average queue size = U2 / (1 – U) = (0.8)2 / (1 – 0.8) = 3.2
4. Time spent by a request in a queue = U × R, or the total response timeservice time = 32 ms
Now, if controller power is doubled, the service time is halved; consequently, Rs = 4 ms in this scenario.
1. Utilization (U) = 4 / 10 = 0.4 or 40%
2. Response time (R) = 4 / (1 – 0.4) = 6.67 ms
3. Average queue size = (0.4)2 / (1 – 0.4) = 0.26
4. Time spent by a request in a queue = 0.4 × 6.67 = 2.67 ms
As a result, it can be concluded that by reducing the service time (the sum of seek time, latency, and internal
transfer rate) or utilization by half, the response time can be reduced drastically (almost six times in the
preceding example). The relationship between utilization and response time is shown in Figure 2-10.
2.5 Logical Components of the Host The logical components of a host consist of the software applications and protocols that enable data
communication with the user as well as the physical components. Following are the logical components of a
host:
■ Operating system
■ Device drivers
■ Volume manager
■ File system
■ Application
2.5.1 Operating System

STORAGE AREA NETWORKS (10CS765)
Janardhan C N
Assistant Professor,
Dept. of CSE, JIT Davanagere 2015-16 20
An operating system controls all aspects of the computing environment. It works between the application and
physical components of the computer system. One of the services it provides to the application is data access.
The operating system also monitors and responds to user actions and the environment. It organizes and controls
hardware components and manages the allocation of hardware resources.
2.5.2 Device Driver
A device driver is special software that permits the operating system to interact with a specific device, such as a
printer, a mouse, or a hard drive. A device driver enables the operating system to recognize the device and to
use a standard interface (provided as an application programming interface, or API) to access and control
devices. Device drivers are hardware dependent and operating system specific.
2.5.3 Volume Manager
Disk partitioning was introduced to improve the flexibility and utilization of HDDs. In partitioning, an HDD is
divided into logical containers called logical volumes (LVs) (see Figure 2-11).
Concatenation is the process of grouping several smaller physical drives and presenting them to the host as one
logical drive (see Figure 2-11).
The evolution of Logical Volume Managers (LVMs) enabled the dynamic extension of file system capacity and
efficient storage management. LVM is software that runs on the host computer and manages the logical and
physical storage. LVM is an optional, intermediate layer between the file system and the physical disk. It can
aggregate several smaller disks to form a larger virtual disk or to partition a larger-capacity disk into virtual,
smaller-capacity disks, which are then presented to applications. The LVM provides optimized storage access
and simplifies storage resource management. It hides details about the physical disk and the location of data on
the disk; and it enables administrators to change the storage allocation without changing the hardware, even
when the application is running.
The basic LVM components are the physical volumes, volume groups, and logical volumes. In LVM
terminology, each physical disk connected to the host system is a physical volume (PV). LVM converts the
physical storage provided by the physical volumes to a logical view of storage, which is then used by the
operating system and applications. A volume group is created by grouping together one or more physical
STORAGE AREA NETWORKS (10CS765)
Janardhan C N
Assistant Professor,
Dept. of CSE, JIT Davanagere 2015-16 21
volumes. A unique physical volume identifier (PVID) is assigned to each physical volume when it is initialized
for use by the LVM.
Logical volumes are created within a given volume group. A logical volume can be thought of as a virtual disk
partition, while the volume group itself can be thought of as a disk. A volume group can have a number of
logical volumes. The size of a logical volume is based on a multiple of the physical extents.
2.5.4 File System
A file is a collection of related records or data stored as a unit with a name. A file system is a hierarchical
structure of files. File systems enable easy access to data files residing within a disk drive, a disk partition, or a
logical volume. A file system needs host-based logical structures and software routines that control access to
files. It provides users with the functionality to create, modify, delete, and access files. A file system organizes
data in a structured hierarchical manner via the use of directories, which are containers for storing pointers to
multiple files. All file systems maintain a pointer map to the directories, subdirectories, and files that are part of
the file system. Some of the common file systems are as follows:
■ FAT 32 (File Allocation Table) for Microsoft Windows
■ NT File System (NTFS) for Microsoft Windows
■ UNIX File System (UFS) for UNIX
■ Extended File System (EXT2/3) for Linux
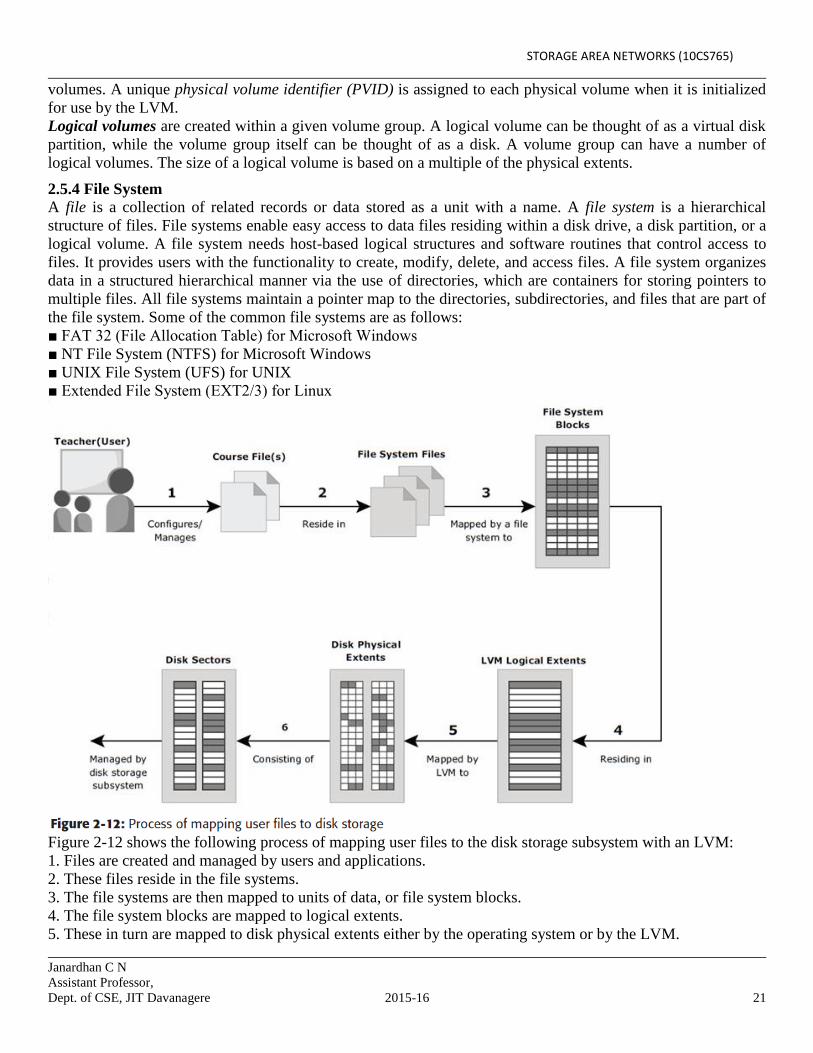
Figure 2-12 shows the following process of mapping user files to the disk storage subsystem with an LVM:
1. Files are created and managed by users and applications.
2. These files reside in the file systems.
3. The file systems are then mapped to units of data, or file system blocks.
4. The file system blocks are mapped to logical extents.
5. These in turn are mapped to disk physical extents either by the operating system or by the LVM.
STORAGE AREA NETWORKS (10CS765)
Janardhan C N
Assistant Professor,
Dept. of CSE, JIT Davanagere 2015-16 22
6. These physical extents are mapped to the disk storage subsystem.
2.5.5 Application
An application is a computer program that provides the logic for computing operations. It provides an interface
between the user and the host and among multiple hosts. Conventional business applications using databases
have a three-tiered architecture — the application user interface forms the front-end tier; the computing logic
forms, or the application itself is, the middle tier; and the underlying databases that organize the data form the
back-end tier. The application sends requests to the underlying operating system to perform read/ write (R/W)
operations on the storage devices. Applications can be layered on the database, which in turn uses the OS
services to perform R/W operations to storage devices. These R/W operations (I/O operations) enable
transactions between the front-end and back-end tiers.
Data access can be classified as block-level or file-level depending on whether the application uses a logical
block address or the file name and a file record identifier to read from and write to a disk.
Block-Level Access
Block-level access is the basic mechanism for disk access. In this type of access, data is stored and retrieved
from disks by specifying the logical block address. The block address is derived based on the geometric
configuration of the disks. Block size defines the basic unit of data storage and retrieval by an application.
Databases, such as Oracle and SQL Server, define the block size for data access and the location of the data on
the disk in terms of the logical block address when an I/O operation is performed.
File-Level Access
File-level access is an abstraction of block-level access. File-level access to data is provided by specifying the
name and path of the file. It uses the underlying block-level access to storage and hides the complexities of
logical block addressing (LBA) from the application and the DBMS.
2.6 Application Requirements and Disk Performance The analysis of application storage requirements conventionally begins with determining storage capacity. This
can be easily estimated by the size and number of file systems and database components that will be used by
applications. The application I/O size and the number of I/Os the application generates are two important
measures affecting disk performance and response time.
Consequently, the storage design and layout for an application commences with the following:
1. Analyzing the number of I/Os generated at peak workload
2. Documenting the application I/O size or block size.
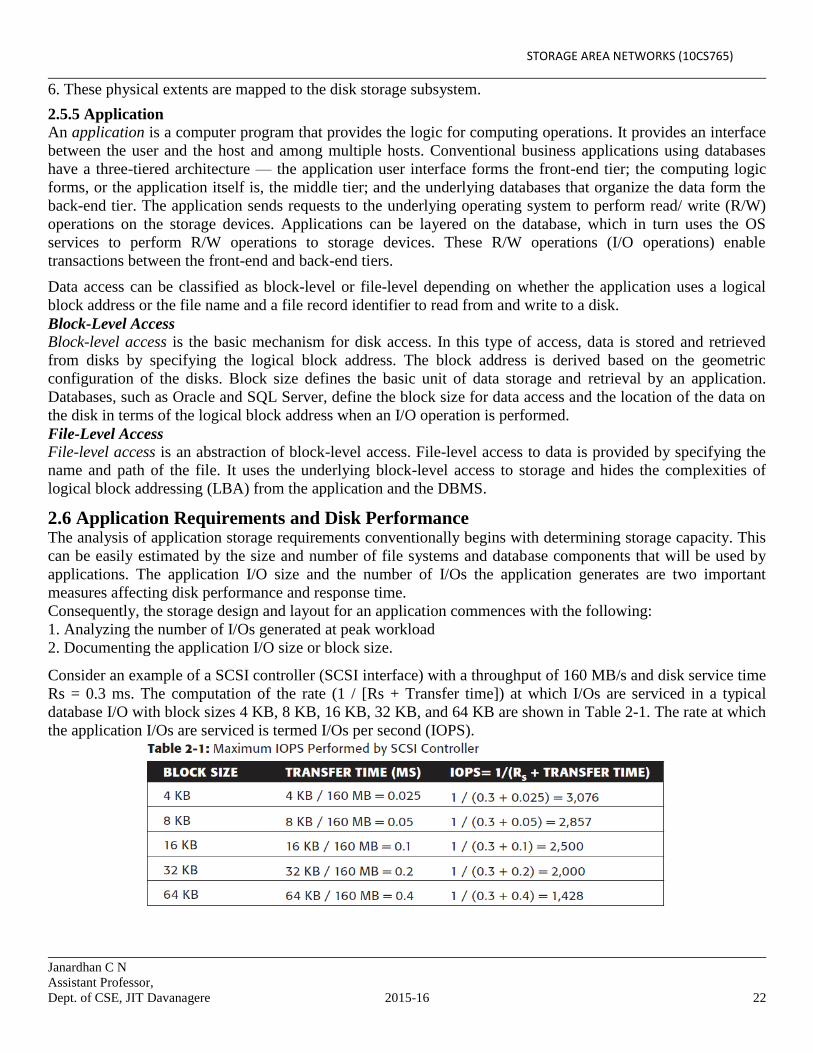
Consider an example of a SCSI controller (SCSI interface) with a throughput of 160 MB/s and disk service time
Rs = 0.3 ms. The computation of the rate (1 / [Rs + Transfer time]) at which I/Os are serviced in a typical
database I/O with block sizes 4 KB, 8 KB, 16 KB, 32 KB, and 64 KB are shown in Table 2-1. The rate at which
the application I/Os are serviced is termed I/Os per second (IOPS).
STORAGE AREA NETWORKS (10CS765)
Janardhan C N
Assistant Professor,
Dept. of CSE, JIT Davanagere 2015-16 23
As a result, the number of IOPS per controller depends on the I/O block size and ranges from 1,400 (for 64 KB)
to 3,100 (for 4 KB).
The disk service time (RS) is a key measure of disk performance; Rs along with disk utilization rate (U)
determines the I/O response time for applications. As shown earlier in this chapter, the total disk service time
(RS) is the sum of seek time (E), rotational latency (L), and the internal transfer time (X):
Rs = E + L + X
E is determined based on the randomness of the I/O request. L and X are measures provided by disk vendors as
technical specifications of the disk.
Consider an example with the following specifications provided for a disk:
■ Average seek time of 5 ms in a random I/O environment, or E = 5 ms.
■ Disk rotation speed of 15,000 rpm — from which rotational latency (L) can be determined, which is one half
of the time taken for a full rotation or L = (0.5 / 15,000 rpm expressed in ms).
■ 40 MB/s internal data transfer rate, from which the internal transfer time
(X) is derived based on the block size of the I/O — for example, an I/O with a block size of 32 KB or X = 32
KB / 40 MB.
Consequently, Rs = 5 ms + (0.5 / 15,000) + 32 KB / 40 MB = 7.8 ms.
The maximum number of I/Os serviced per second or IOPS = 1/ RS.
In other words, for an I/O with a block size of 32 KB and RS = 7.8 ms, the maximum IOPS will be 1 / (7.8 ×
10-3) = 128 IOPS.
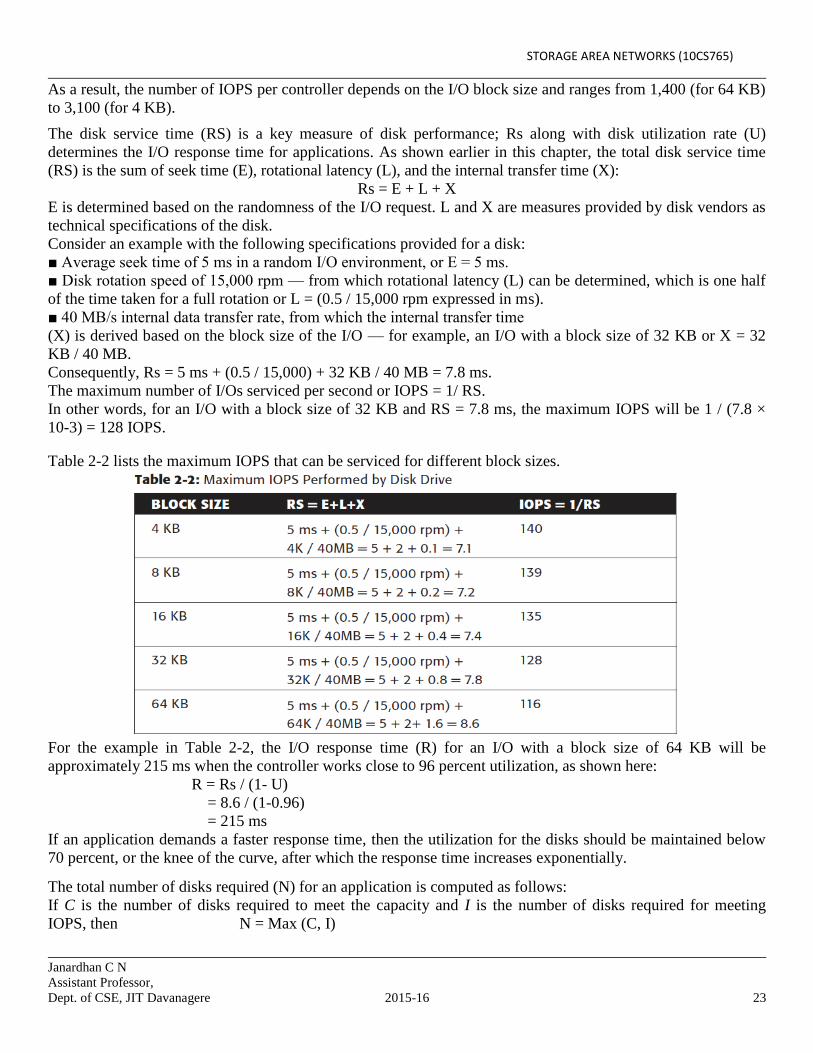
Table 2-2 lists the maximum IOPS that can be serviced for different block sizes.
For the example in Table 2-2, the I/O response time (R) for an I/O with a block size of 64 KB will be
approximately 215 ms when the controller works close to 96 percent utilization, as shown here:
R = Rs / (1- U)
= 8.6 / (1-0.96)
= 215 ms
If an application demands a faster response time, then the utilization for the disks should be maintained below
70 percent, or the knee of the curve, after which the response time increases exponentially.
The total number of disks required (N) for an application is computed as follows:
If C is the number of disks required to meet the capacity and I is the number of disks required for meeting
IOPS, then N = Max (C, I)

STORAGE AREA NETWORKS (10CS765)
Janardhan C N
Assistant Professor,
Dept. of CSE, JIT Davanagere 2015-16 24
Disk vendors publish the disk potential in terms of IOPS based on the benchmark they carry out for different
block sizes and application environments.
Consider an example in which the capacity requirements for an application are 1.46 TB. The peak workload
generated by the application is estimated at 9,000 IOPS. The vendor specifies that a 146 GB, 15,000-rpm drive
is capable of a maximum of 180 IOPS (U = 70%).
In this example, the number of disks required to meet the capacity requirements will be only 1.46 TB / 146 GB
= 10 disks. To meet 9,000 IOPS, 50 disks will be required (9,000 / 180). As a result, the number of disks
required to meet the application demand will be Max (10, 50) = 50 disks.

STORAGE AREA NETWORKS (10CS765)
Janardhan C N
Assistant Professor,
Dept. of CSE, JIT Davanagere 2015-16 25
STORAGE AREA NETWORKS (10CS765)
UNIT – 1 - QUESTION BANK
Introduction to Information Storage and Management, Storage System Environment
5 marks Questions
1. Define data. List and explain the factors that contribute to the growth of data.
2. Explain with neat diagram, Evolution of Storage Technology and its architecture.
3. Explain the order processing system and list its core elements.
4. Write a note on ILM implementation.
5. List and explain physical and logical components of connectivity.
6. Explain the different types of storage media utilized in storage systems.
7. Write a note on Disk Drive Performance.
8. Consider an example of a SCSI controller (SCSI interface) with a throughput of 160 MB/s and disk
service time Rs = 0.3 ms. Compute the rate at which I/Os are serviced in a typical database I/O with
block sizes 4 KB, 8 KB, 16 KB, 32 KB, and 64 KB. Also determine the IOPS.
9. Consider the capacity requirements for an application are 1.46 TB. The peak workload generated by the
application is estimated at 9,000 IOPS. The vendor specifies that a 146 GB, 15,000-rpm drive is capable
of a maximum of 180 IOPS (U = 70%). Calculate the maximum number of disks required to meet the
application demand.
10 marks Questions
10. With a neat diagram, explain the key characteristics of data center elements.
11. Explain about Information Lifecycle. Discuss ILM strategy characteristics.
12. With neat diagram, explain the main disk drive components.
13. Form the two fundamental laws, derive:
a. Average response time,
b. Average queue length, and
c. Time spent by a request in queue.
14. Consider a disk I/O system, I/O request arrives at a rate of 100 I/Os per second. The service time Rs is
8ms. Compute the following measures of disk performance:
a. Utilization of I/O controller,
b. Total response time,
c. Average Queue size, &
d. Total time spent by request in a queue.
Now, if controller power is doubled, the service time is halved; consequently, Rs = 4ms. In this scenario,
determine the above measures.
15. Write a note on a) LVM b) File System.