

Introduction to Google Analytics
69
Introduction to Google Analytics @buyukgokcesu BoostingConversion.com Cemal Buyukgokcesu Analytics and Conversion Consultant
-
Upload
cemal-buyukgokcesu -
Category
Presentations & Public Speaking
-
view
462 -
download
2
Transcript of Introduction to Google Analytics
Introduction to Google Analytics
@buyukgokcesu
BoostingConversion.com
Cemal Buyukgokcesu
Analytics and Conversion Consultant
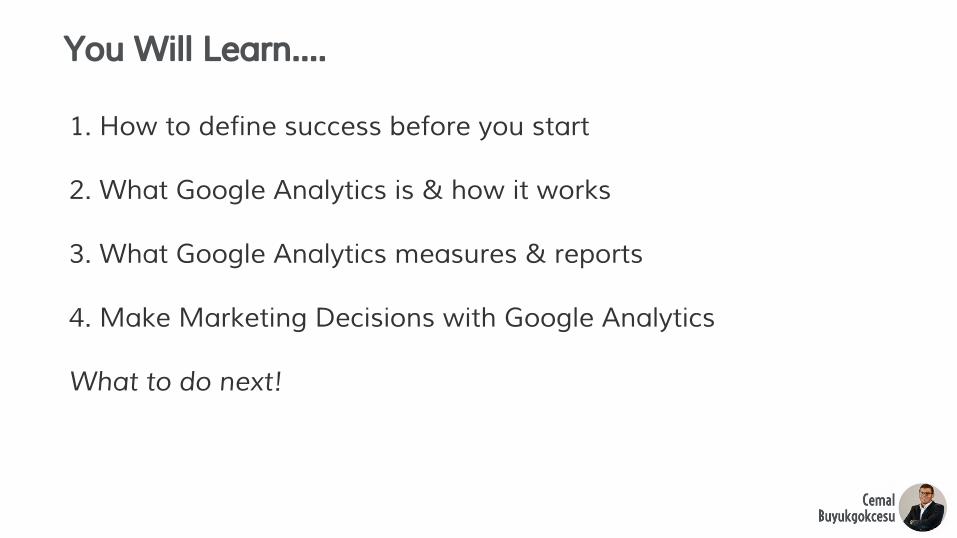
1. How to define success before you start
2. What Google Analytics is & how it works
3. What Google Analytics measures & reports
4. Make Marketing Decisions with Google Analytics
What to do next!
You Will Learn….

Let’s begin with some stories…..

GOOGLE ANALYTICSBefore You Start:Measurement Planning1

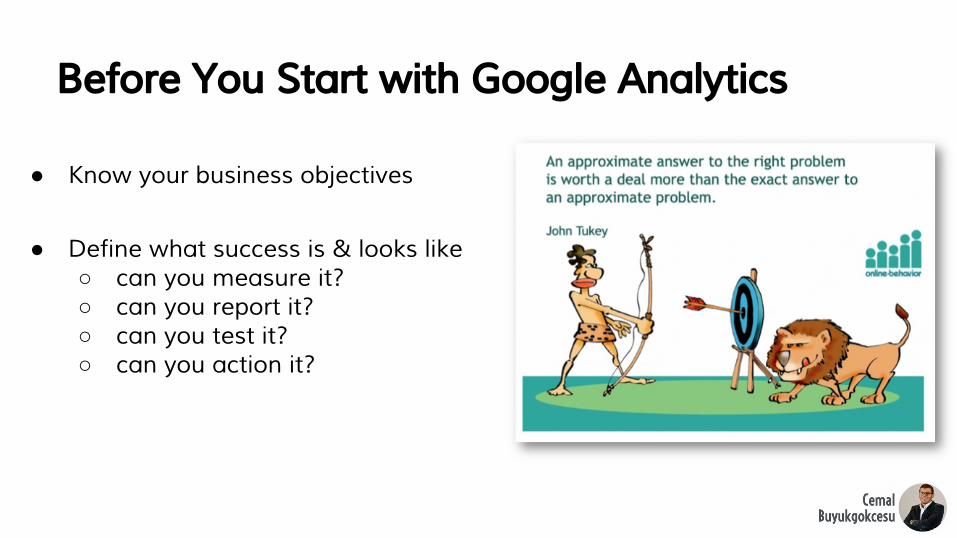
Before You Start with Google Analytics
● Know your business objectives
● Define what success is & looks like○ can you measure it?○ can you report it?○ can you test it?○ can you action it?

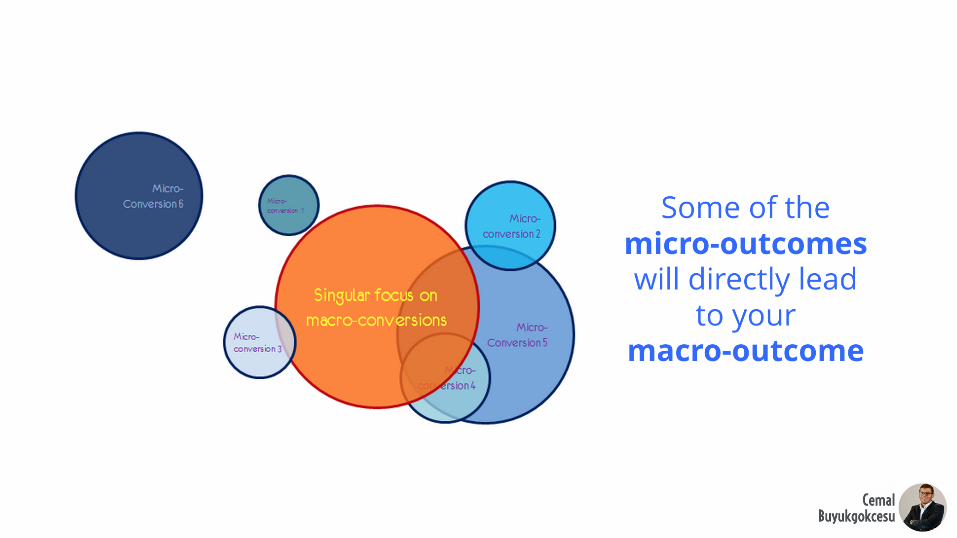
Optimizing for the Global Maxima

● Sell ProductsEcommerce
● Record contact info for sales prospectsLead Generation
● Drive awareness & engagementBranding
● GoalBusiness Objective
Start by Defining your Business Objective & Measure your Success with Goals

In Analytics, you can define specific Goals
● Ecommerce: transactionsEcommerce
● Event: downloaded a form / clicked to call / form fillLead Generation
● Goal: watched a video / viewed a key pageBranding
● Goal, Events, EcommerceBusiness Objective
So before you start….
Know your business objectives
Have a definition of success
Have a metric to measure & report this
Consider how you can test & action it!

CMOs feel unprepared for...
source: IBM CMO Research

GOOGLE ANALYTICSHow it all works!2

What is Google Analytics?
Google Analytics is an online Google platform that generates detailed statistics about a website's traffic and traffic sources and measures website conversions and sales.

How does Google Analytics work?
Google Analytics works by means of a small snippet of code that you include on your website pages.
This code snippet activates Google Analytics tracking for your site, which collects and sends data to your Google Analytics account.
SITE
AD
AW CT
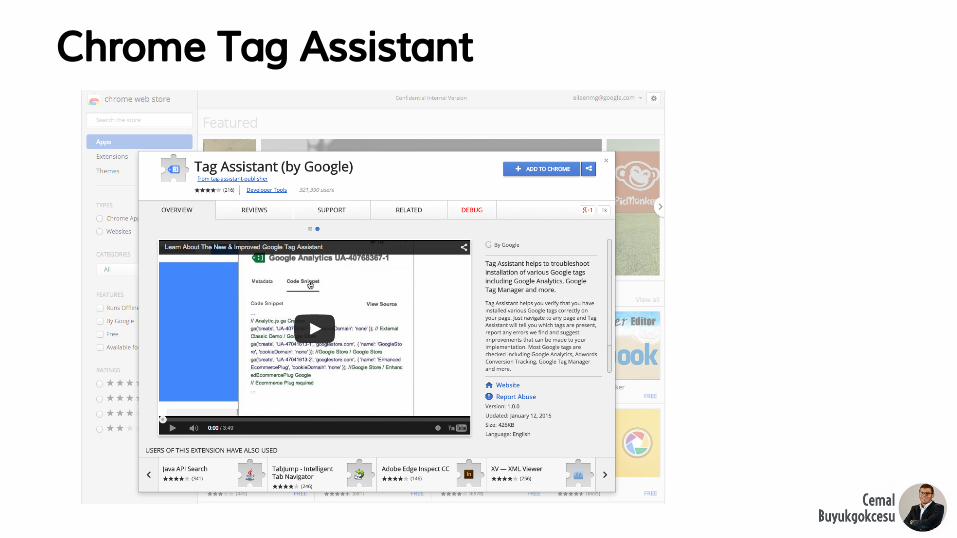
Chrome Tag Assistant

How to check if a site has Google Analytics installed

What can I track with Google Analytics?
You automatically track visits when you set up Analytics.
You can customize your tracking code to collect data that isn't automatically tracked by Google Analytics:
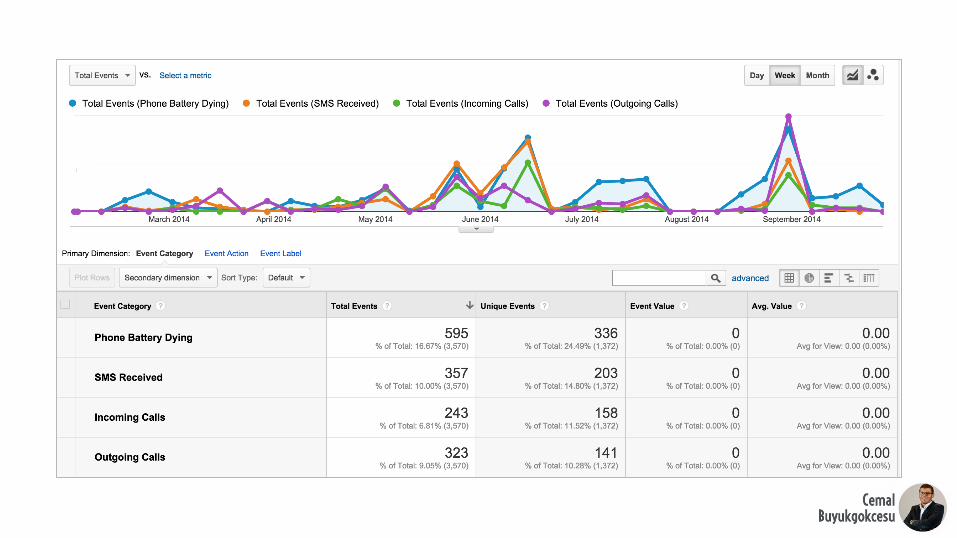
We recommend setting up Event tracking, which lets you track how users interact with content like videos, buttons, downloads, outbound links, and other interactive elements.
If you sell anything, we also recommend you set up Ecommerce tracking to integrate product and sales data with the other data you collect using Google Analytics.

Creating Conversion Goals

Select the Goal Type

Google Analytics also reports where your traffic comes from
You will need to take some steps to ensure all your traffic sources are reported correctly

● Campaign● Ad Group● Keyword● Matched Search Query
Link AdWords to understand ad performanceIn a few simple steps, AdWords and GA can share data
● Impressions● Clicks● Cost● ROI● Margin
● You must have an email address with Admin access to both your AdWords & GA Account
● Then Log into your Analytics account and complete a few simple steps to link your accounts
● You must also turn on Auto-tagging to track AdWords Campaign information

Linking AdWords & Analytics Accounts

Manually tag 3rd party referrers for display, email, social, etc. to accurately categorize your other campaigns.
site / cpc
$
Customized traffic sources in Google Analytics
site.com / referral source / display source / email
@
source / social source / affiliate
Manually tag non-Google paid search campaigns (e.g. Bing, Yahoo) to separate paid and organic search traffic.site / organic

Benefits of campaign tagging
1. Make advertising accountable● Measure the effectiveness of your advertising efforts● Map to ad cost data for “Return on Ad Spend”
2. See all “post-click” performance in one place● Common metrics allow for an “apples to apples” comparison● Integrated reporting means campaign data is available in all GA reports

Frequently asked troubleshooting questions
Self-referrals - seeing your own domain as a traffic source- Exclude your domain in Admin > Tracking Info > Referral Exclusion
Traffic missing or very low- Check the GA code is correctly implemented on all pages and has not been altered
Linking problems with AdWords- Check you are using the same email address for both accounts

Analytics Notifications

GOOGLE ANALYTICSMeasurement & Reporting3

Difference between hits & sessions
source: http://www.kaushik.net/avinash/google-analytics-visitor-segmentation-users-sequences-cohorts/


Reporting: Dimensions & Metrics
Analytics reports are built using:
Dimensions: Describe Data
- Browser, Exit Page, Screens, and Session Duration are all examples of dimensions that appear by default in Google Analytics.
Metrics: Measure Data
- Metrics are individual elements of a dimension that can be measured as a sum or a ratio.
- Screenviews, Page per Visit, and Average Visit Duration are examples of metrics in Google Analytics.

Reporting: Traffic Sources
Every referral (visit) to a website has:
(1) Source / Origin:
Possible sources include: “google” (the name of a search engine), “facebook.com” (the name of a referring site), “spring_newsletter” (the name of one of your newsletters), and “direct”.
(2) Medium:
Possible mediums include: “organic” (unpaid search), “cpc” (cost per click, i.e. paid search), “referral” (referral), “email” (the name of a custom medium you have created), “none” (direct visits have a medium of “none”).

The hierarchy of accounts, users, properties, and views
Account:
Your access point for Analytics, and the topmost level of organization.
Property:
Website, mobile application, blog, etc. An account can contain one or more properties.
View:
Your access point for reports.
Users:
You add users to an account. You can assign four different permissions to.

All data in aggregate is
"useless"

• Users who reach to last step of the funnel and then abandon the site• Users whose Days to Convert is >5 • Users who interact via chat • Users checking homepage promotions but not converting• Users doing site search but not converting
Customize strategies for different segments

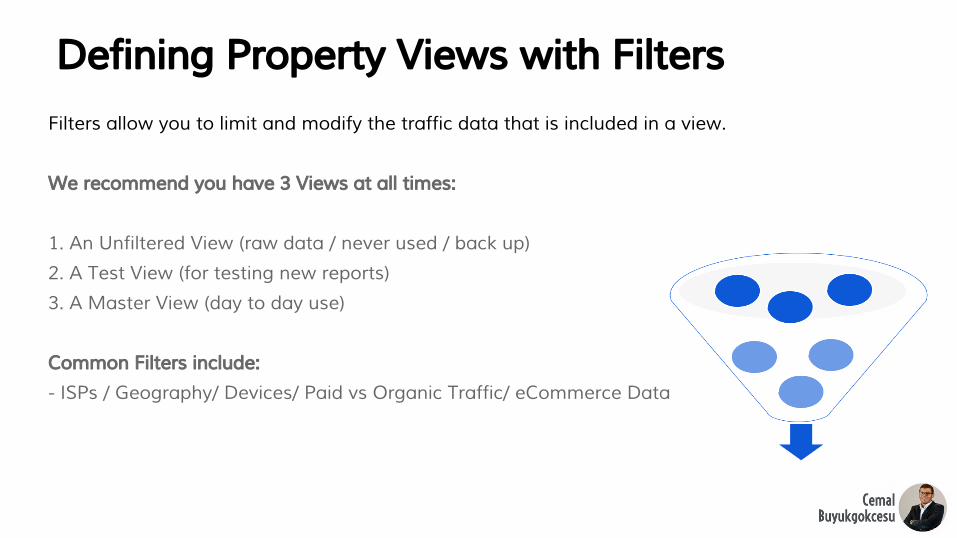
Defining Property Views with FiltersFilters allow you to limit and modify the traffic data that is included in a view.
We recommend you have 3 Views at all times:
1. An Unfiltered View (raw data / never used / back up)
2. A Test View (for testing new reports)
3. A Master View (day to day use)
Common Filters include:
- ISPs / Geography/ Devices/ Paid vs Organic Traffic/ eCommerce Data

“If you torture the data long enough, it will confess.”Ronald CoaseProfessor Emeritus of EconomicsUniversity of Chicago Law School
GOOGLE ANALYTICSMaking Marketing Decisions4

Google Analytics reports at a glance
AudienceWho are you reaching?
AcquisitionWhere are they coming from?
BehaviourHow are they reacting to your messages?
ConversionsAre they taking action?

Audience reports allow you to analyze the demographic and behavioral composition of your site visitors and quantify their propensity to complete various site actions:
Demographics & Interests: contains information on basic demographics (age, gender) and top interest categories
Geo: contains information on browser language and location (based on IP) of site visitors
Behavior: contains information new vs. returning users, frequency of visits and engagement with site content
Technology: contains information on users’ ISP, browser and operating system
Mobile: contains information on mobile visitors including device model and operating system
Custom: allows you to set define custom segmentation for deeper analysis
Users Flow: contains site-flow information broken down by campaign / geography / demographics and more
AudienceWho are you reaching?
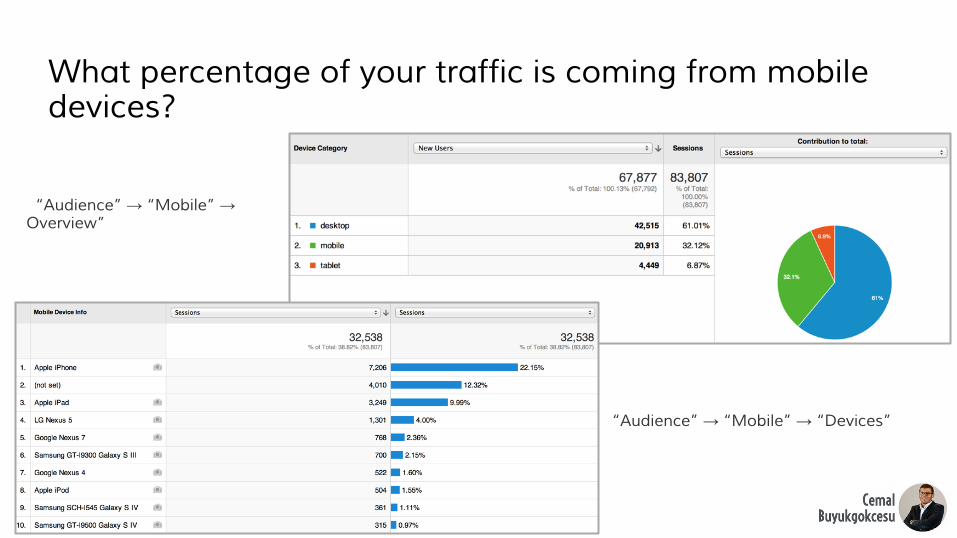
What percentage of your traffic is coming from mobile devices?
“Audience” → “Mobile” → Overview”
“Audience” → “Mobile” → “Devices”

Which screen resolution is more engaging?“Audience” → “Mobile” → “Devices”
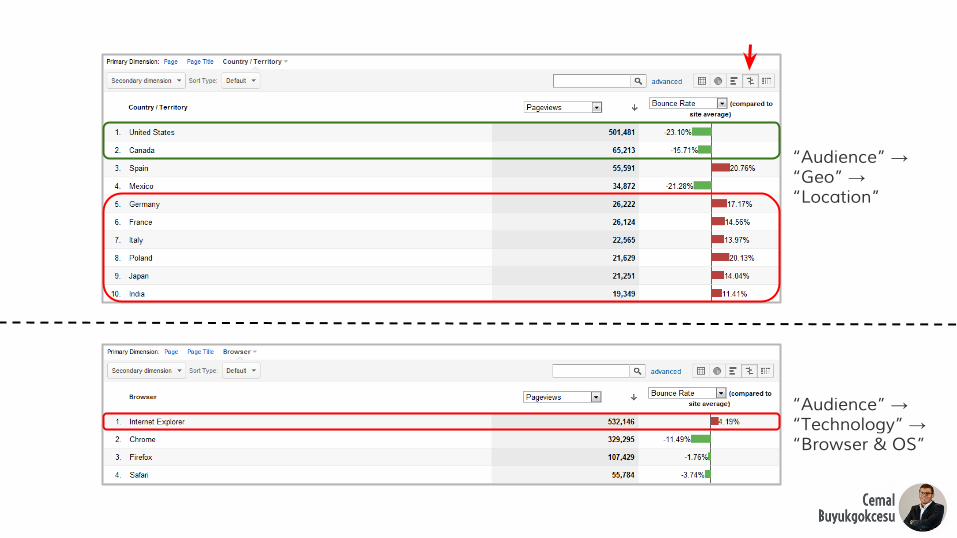
“Audience” → “Technology” → “Browser & OS”
“Audience” → “Geo” → “Location”

What are the most common user paths through your site?
“Audience” → “Users Flow”

AcquisitionWhere are they coming from?
Traffic Source Reports allow you to analyze the referring sources of website traffic and evaluate impact of marketing efforts on site visitation:
Sources: contains information on specific sites and marketing campaigns navigating users to your landing pages
SEO (Search Engine Optimization): (requires webmaster tools) – shows SEO queries, landing pages and geographical information
Social: contains information on Social media referrals, trackbacks (shares) of your links, user engagement with social content (+1, likes) and more
Cost Analysis: (requires data import) – shows ROI information on your marketing efforts
Advertising: integrated with AdWords and DFA for in depth KW and campaign level information

Quickly view how your traffic sources are performing

See how people are talking about your site with Social reports
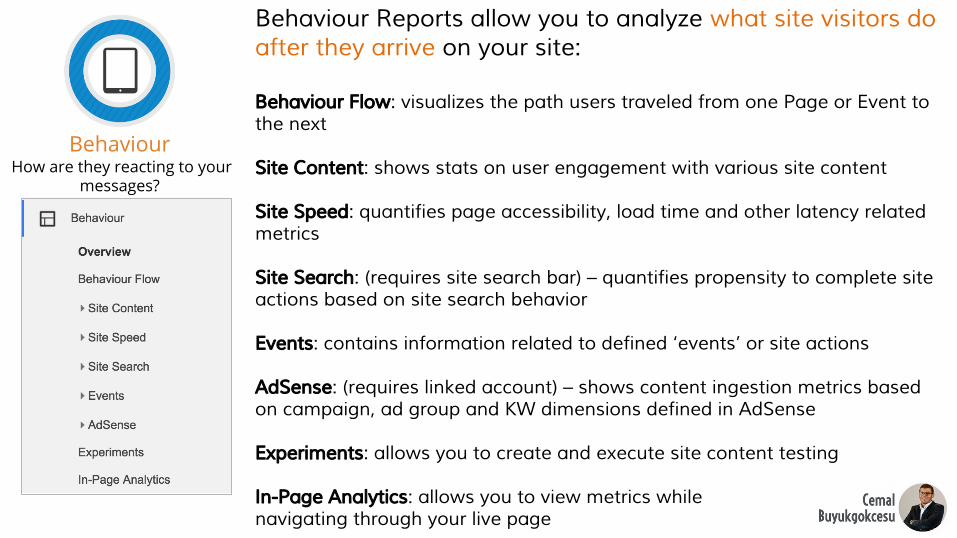
Behaviour Reports allow you to analyze what site visitors do after they arrive on your site:
Behaviour Flow: visualizes the path users traveled from one Page or Event to the next
Site Content: shows stats on user engagement with various site content
Site Speed: quantifies page accessibility, load time and other latency related metrics
Site Search: (requires site search bar) – quantifies propensity to complete site actions based on site search behavior
Events: contains information related to defined ‘events’ or site actions
AdSense: (requires linked account) – shows content ingestion metrics based on campaign, ad group and KW dimensions defined in AdSense
Experiments: allows you to create and execute site content testing
In-Page Analytics: allows you to view metrics while navigating through your live page
Behaviour How are they reacting to your
messages?

Google Confidentialsource: http://econsultancy.com/at/blog/10936-site-speed-case-studies-tips-and-tools-for-improving-your-conversion-ratehttp://blog.kissmetrics.com/loading-time/?wide=1
● Amazon demonstrated that every 100 milliseconds of latency results in a 1% loss in sales
● Walmart showed that every second of improvement in their website loading time would increase conversion by 2%
Speeding up sites increases conversions

Check speed suggestions in Google Analytics

In-page Analytics: Focus on areas with higher user attention
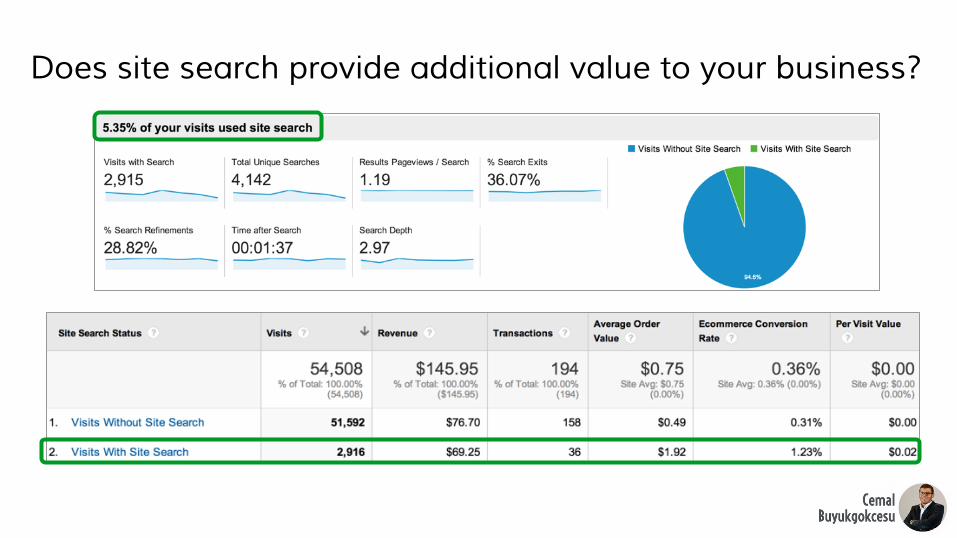
Does site search provide additional value to your business?
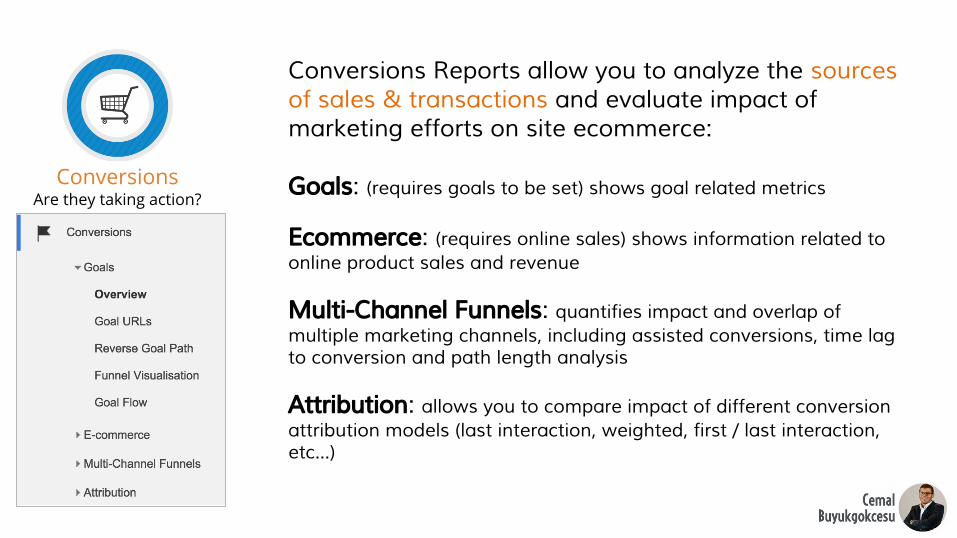
Conversions Reports allow you to analyze the sources of sales & transactions and evaluate impact of marketing efforts on site ecommerce:
Goals: (requires goals to be set) shows goal related metrics
Ecommerce: (requires online sales) shows information related to online product sales and revenue
Multi-Channel Funnels: quantifies impact and overlap of multiple marketing channels, including assisted conversions, time lag to conversion and path length analysis
Attribution: allows you to compare impact of different conversion attribution models (last interaction, weighted, first / last interaction, etc…)
ConversionsAre they taking action?
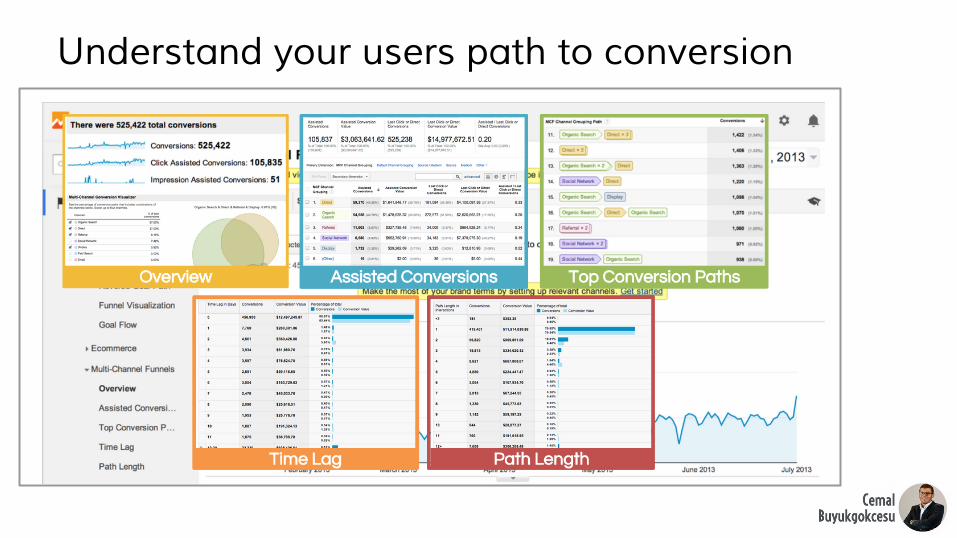
Understand your users path to conversion

Understand how different channels overlap
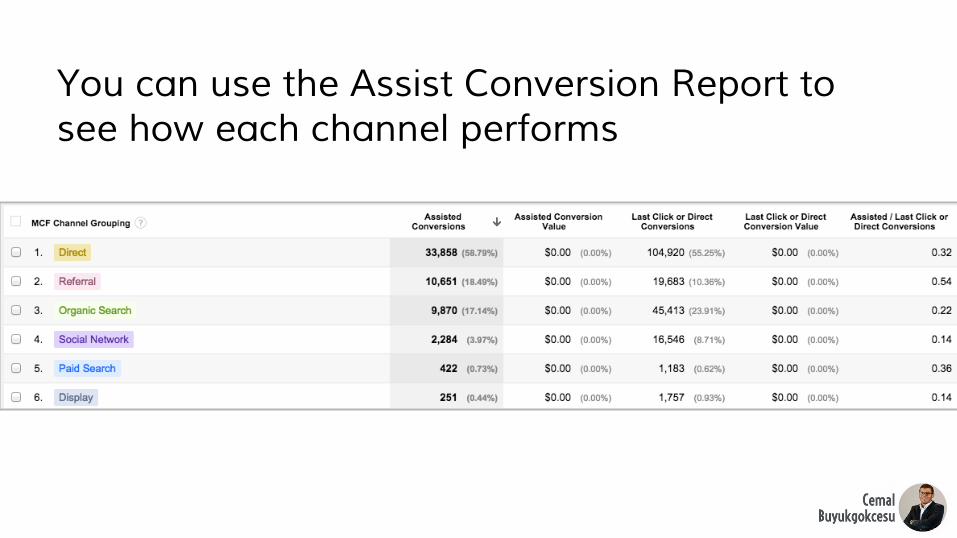
You can use the Assist Conversion Report to see how each channel performs

GOOGLE ANALYTICSWhat Next?5
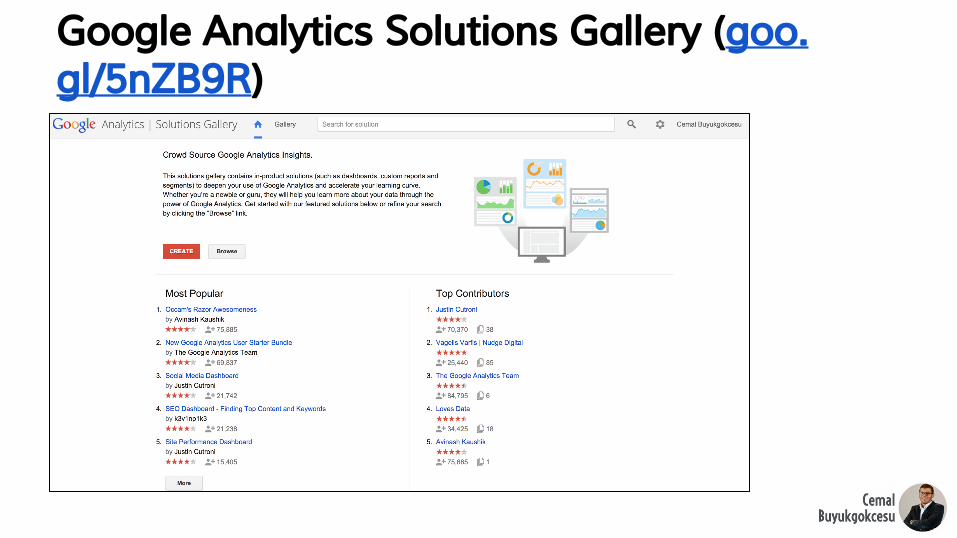
Google Analytics Solutions Gallery (goo.gl/5nZB9R)

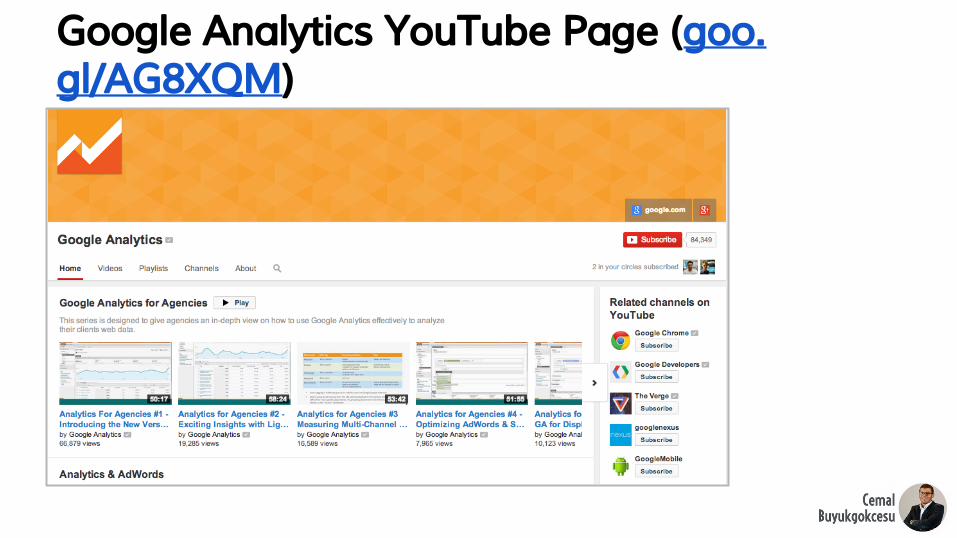
Google Analytics YouTube Page (goo.gl/AG8XQM)
Thanks!
Cemal Buyukgokcesu
Analytics and Conversion Consultant
@buyukgokcesu
BoostingConversion.com