Introduction to GIS and ARCVIEW OC3030 What is a GIS? A means of storing, retrieving, sorting, and...
59
Introduction to Introduction to GIS and ARCVIEW GIS and ARCVIEW OC3030
-
Upload
wilfrid-hampton -
Category
Documents
-
view
216 -
download
0
Transcript of Introduction to GIS and ARCVIEW OC3030 What is a GIS? A means of storing, retrieving, sorting, and...

Introduction to GIS and Introduction to GIS and ARCVIEWARCVIEW
OC3030

What is a GIS?What is a GIS?
A means of storing,
retrieving, sorting,
and comparing
spatial dataspatial data
to support some
analytic process.
++
Information SystemInformation System
Geographic PositionGeographic Position

S&GIGIS
Geospatial Information and Geospatial Information and Services (GI&S)Services (GI&S)
“Geospatial Information and Services is the collection, information extraction, storage, dissemination, and exploitation of geodetic, geomagnetic, imagery, gravimetric, aeronautical, topgraphic, hydrographic, littoral, cultural, and toponymic data accurately referenced to a precise location on the earth’s surface.”
Joint Publication 2-03 -- Joint Tactics, Techniques and Procedures for Geospatial Information and Services Support to Joint Operations, 31 March 1999

GIS links graphical features (entities) to tabular data (attributes)
What is a GIS?What is a GIS?
GEOGRAPHIC Information System

MODELLING AND STRUCTURING DATA
(How we represent features or spatial elements)

Representing Spatial Representing Spatial ElementsElements
• RASTER
• VECTOR
• Real World

Representing Spatial Representing Spatial ElementsElements
RasterStores images as rows and columns of numbers with a Digital Value/Number (DN) for each cell.
Units are usually represented as square grid cells that are uniform in size.
Data is classified as “continuous” (such as in an image), or “thematic” (where each cell denotes a feature type.
Numerous data formats (TIFF, GIF, ERDAS.img etc)

VectorAllows user to specify specific spatial locations and assumes that geographic space is continuous, not broken up into discrete grid squares
We store features as sets of X,Y coordinate pairs.
Representing Spatial Representing Spatial ElementsElements

Entity RepresentationsEntity Representations
Points - simplest element
Lines (arcs) - set of connected points
Polygons - set of connected lines
We typically represent objects in space as three distinct spatial elements:
We use these three spatial elements to represent real world features and attach locational information to them.
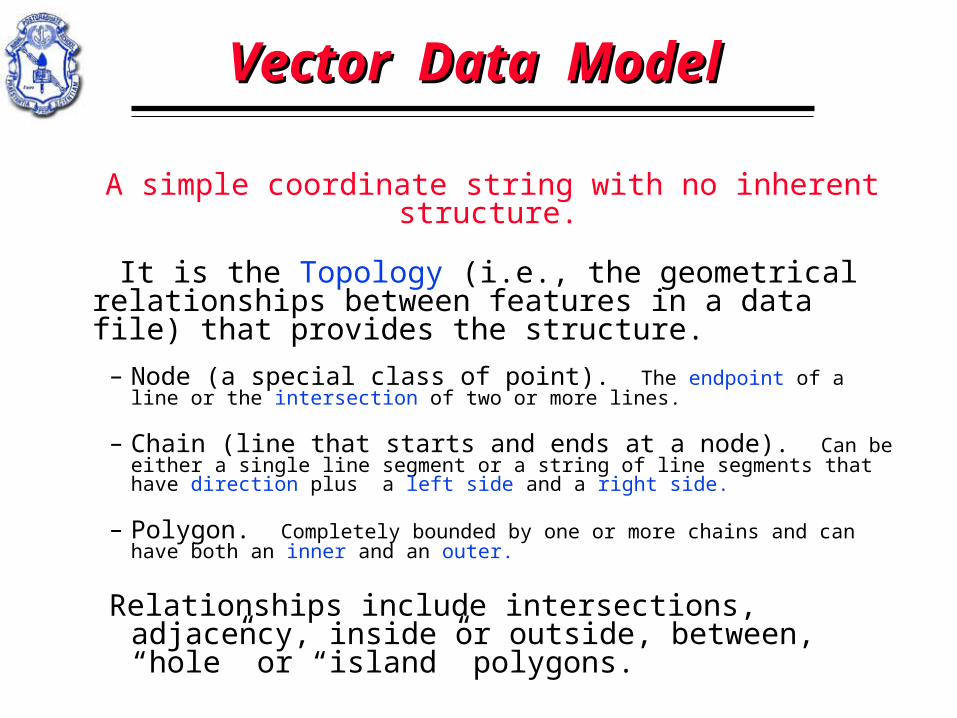
Vector Data ModelVector Data Model
A simple coordinate string with no inherent structure.
It is the Topology (i.e., the geometrical relationships between features in a data file) that provides the structure.
– Node (a special class of point). The endpoint of a line or the intersection of two or more lines.
– Chain (line that starts and ends at a node). Can be either a single line segment or a string of line segments that have direction plus a left side and a right side.
– Polygon. Completely bounded by one or more chains and can have both an inner and an outer.
Relationships include intersections, adjacency, inside or outside, between, “hole” or “island” polygons.

AttributesAttributes
• In the raster data model, the cell value (Digital Number) is the attribute. Examples: brightness, landcover code, SST, etc.
• For vector data, attribute records are linked to point, line & polygon features. Can store multiple attributes per feature. Vector features are linked to attributes by a unique feature number.

Raster vs. VectorRaster vs. Vector
Raster AdvantagesThe most common data format
Easy to perform mathematical and overlay operations
Satellite information is easily incorporated
Better represents “continuous”- type data
Vector Advantages
Accurate positional information that is best for storing discrete thematic features (e.g., roads, shorelines, sea-bed features.
Compact data storage requirements
Can associate unlimited numbers of attributes with specific features

Raster vs. VectorRaster vs. Vector
Raster Disadvantages
Huge data storage requirements for high resolution data.
Depiction of features limited by grid cell size (i.e. by the resolution)
Only one attribute (or data value) per cell
Vector Disadvantages
Poor at representing continuous type data; “fuzzy” boundaries need to be generalized.
Complex data structures that lead to computational intensity.
A number of vector formats => the need for conversion routines.

Geographical EntitiesGeographical Entities
• What is it?
Attributes
• Where is it?
Geographical coordinates
• What is its relation to other entities?
Topology

• Data Assembly
• Data Storage
• Spatial Data Analysis and Manipulation
• Spatial Data Output
GIS FunctionsGIS Functions

Data Analysis Operations on EntitiesData Analysis Operations on Entities
• Attributes:- Operation on attribute of single entity- Operation on attributes of multiple entities that
overlap in space- Operations on attributes of linked entities (object
orientation)- Operations on attributes of entities contained by
other entities
• Distance/location operations- Operations to locate entities with respect to
distance or location criteria- Operations to create buffer zones around entities
• Spatial Topology Operations

Spatial AnalysisSpatial Analysis
• Overlay function creates new “layers” to solve spatial problems

SOME EXAMPLES
AND APPLICATIONS
Naval Oceanographic OfficeNaval Oceanographic Office
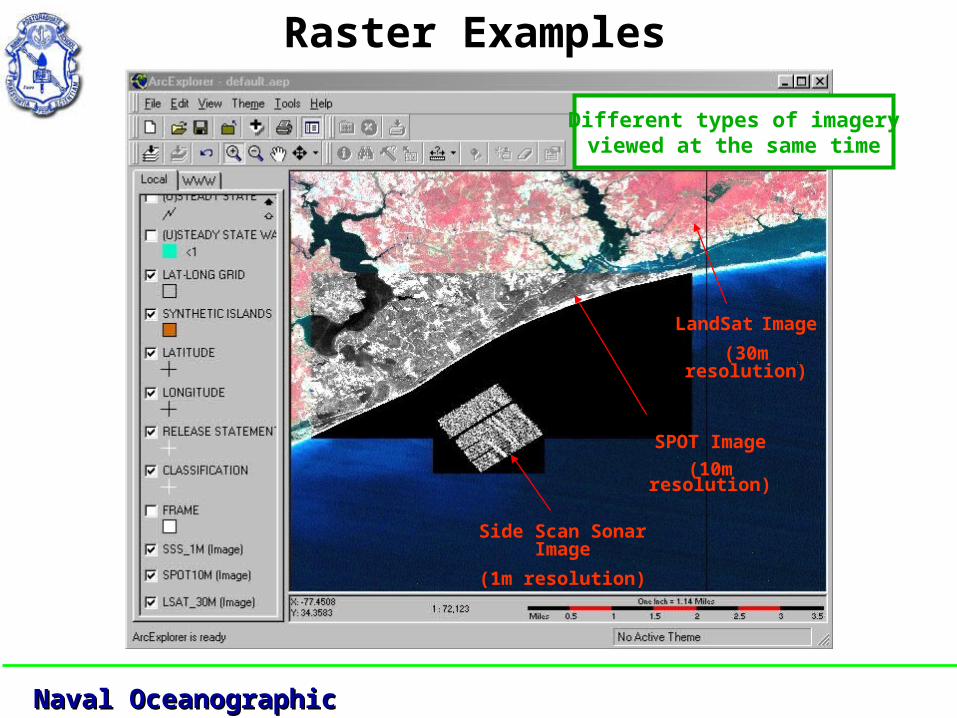
Raster Examples
LandSat Image
(30m resolution)
SPOT Image
(10m resolution)
Side Scan Sonar Image
(1m resolution)
Different types of imageryviewed at the same time

Naval Oceanographic OfficeNaval Oceanographic Office
Raster Examples
AVHRR Image
Naval Oceanographic OfficeNaval Oceanographic Office
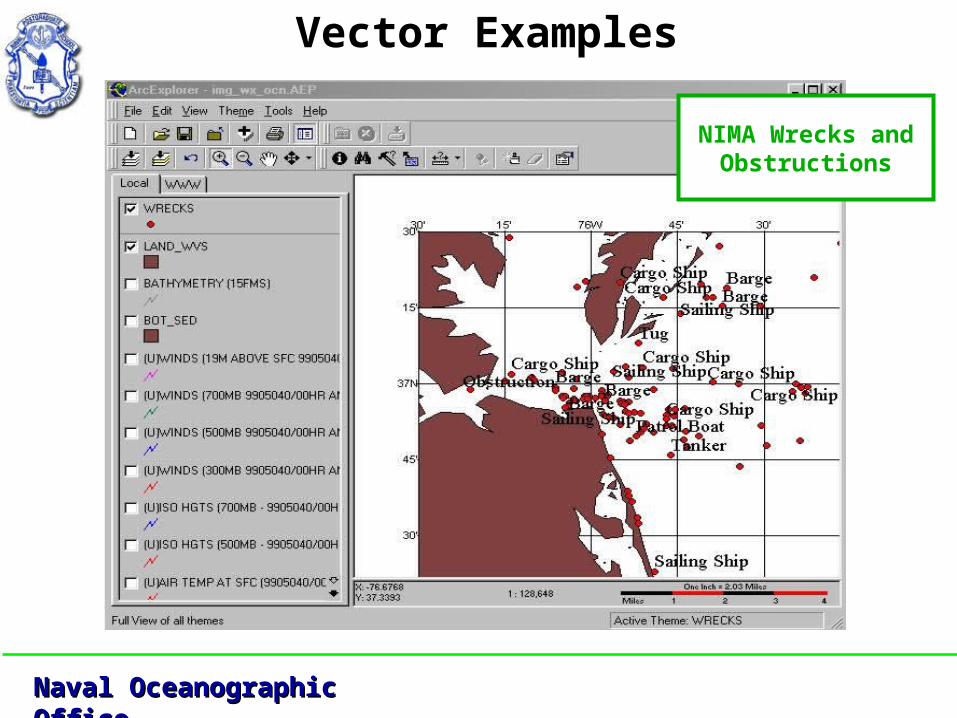
Vector Examples
NIMA Wrecks andObstructions

Naval Oceanographic OfficeNaval Oceanographic Office
Vector Examples
Wave Models fromNAVO N2

… user creates a query on a selectedtheme, such as MODAS in this case
Building aData Query

… user zooms to areaof interest

Use unique value of the theme for
display association


Helicopter Landing ZonesHelicopter Landing Zones
HLZ sites

Flight Planning/FlythroughsFlight Planning/Flythroughs

Facilities ManagementFacilities Management

CCM AnalysisCCM Analysis
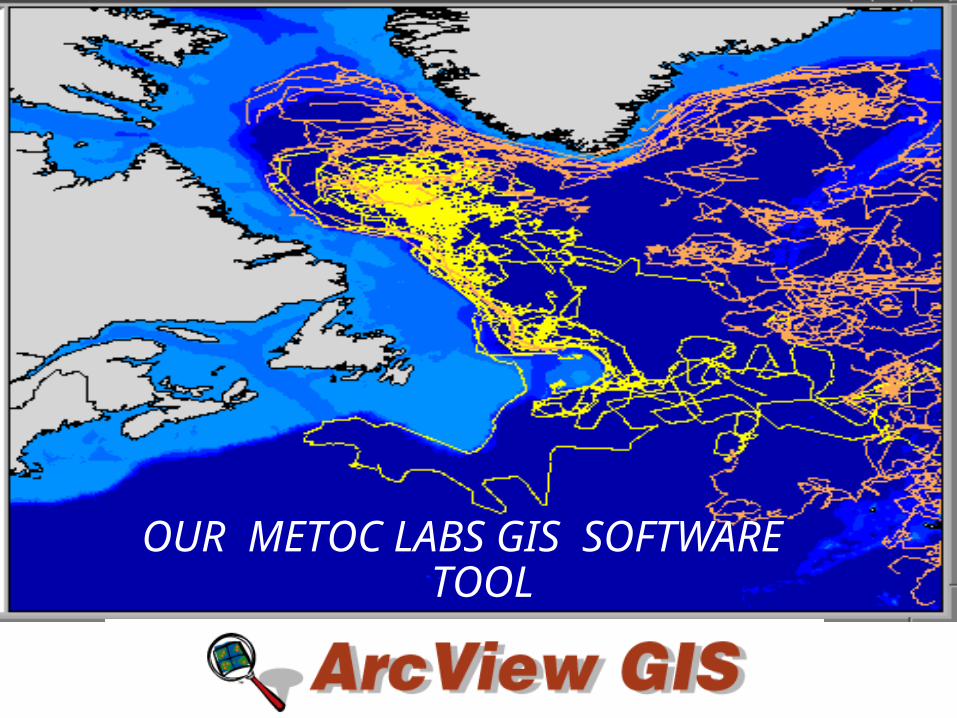
OUR METOC LABS GIS SOFTWARE TOOL
What is ArcView?What is ArcView?
• Premier or (predominant) commercial GIS.
• As an Microsoft is to Computer Operating Systems … ArcView is to GIS
• Other commercial systems abound … also some DoD, Government, University freeware

ArcView currently used in….ArcView currently used in….
• OC3030 – Oceanographic Computing and Data Display
• OC/MR 3520 – Remote Sensing
• OC3902 – Fundamentals of GI&S
• OC3266 – Operational Acoustic Forecasting

What is ArcView GIS?What is ArcView GIS?
• It is a desktop Geographic Information System – a data base that links information to location (i.e., the what to where).
• The ARCVIEW user interface consists of windows that present information in different ways. Rows of menus, buttons, and tools at the top of the main application window allow the user to view and perform analytical operations on the data in the database.

Menus, Buttons & Tools Menus, Buttons & Tools
Located at the top of the main application window. Also known as the Graphical User Interface (GUI)
Menu Bar
Button Bar
Tool Bar

ArcView ProjectsArcView Projects
ArcView projectsprojects are used to organize and store a collection of associated documents that work together during an ArcView session.
Project information is stored in a project fileproject file. (.apr)
The project windowproject window displays the names of all project documents.
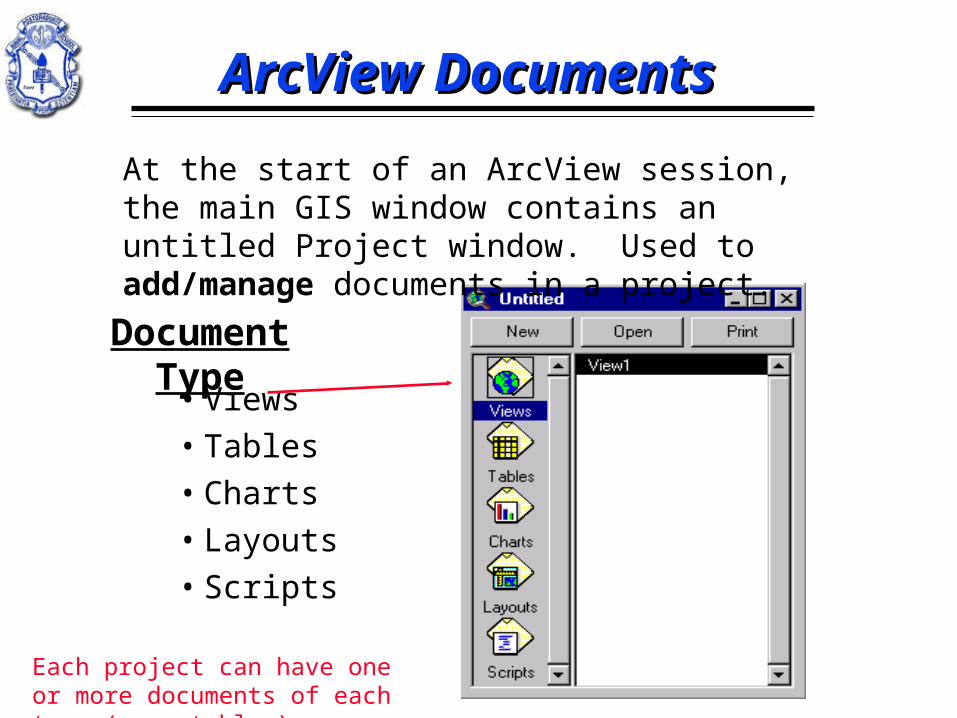
ArcView DocumentsArcView Documents
• Views
• Tables
• Charts
• Layouts
• Scripts
At the start of an ArcView session, the main GIS window contains an untitled Project window. Used to add/manage documents in a project.
Document Type
Each project can have one or more documents of each type (e.g. tables)

ViewsViews
• Display collections of geographic data files (themesthemes)), that cover the same geographic area
• Provides an interactive map display
• Contains a Table of Contents.
Note: Each theme in the Table of Contents has a check box next to its name. If the box is checked, the theme is displayed. If it is not checked, the theme is not displayed. The user controls the theme displays – simply check or uncheck the box.
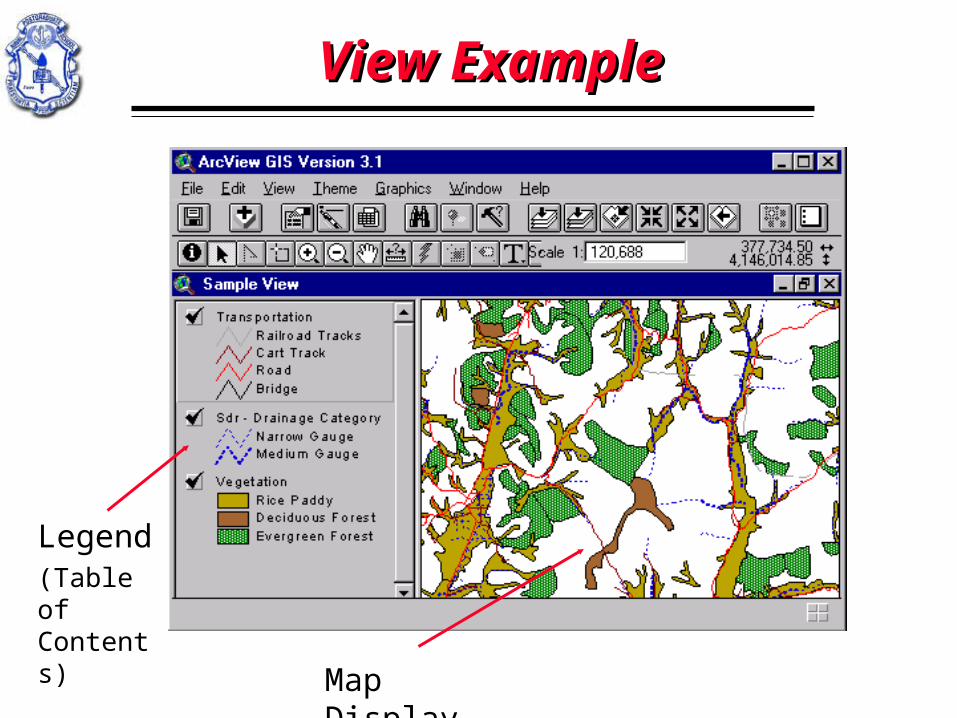
View ExampleView Example
Legend(Table of Contents)
Map Display

TablesTables
• Display tabular information in a spreadsheet type format
• Formats data into records (rows) and fields (columns).
• Each record represents a single feature and each field a single attribute for that feature.
• Tables can be edited to add, change, or delete records and fields.

Table ExampleTable Example
ChartsCharts
• Provide a visual representation of a table
• Graphically summarize information in tables
• Allow you to interactively query tables
• ArcView supports area, bar, column, line, pie and x,y scatter charts.

Chart ExampleChart Example

LayoutsLayouts
• Documents on which you can arrange views, tables, charts and images as graphic elements.
• Used to compile a product (map) for printing and exporting.
Note: Cartographic map components such as neatlines, north arrows, scale bars and legends can be placed on layouts.

Layout ExampleLayout Example

ScriptsScripts
• Used to customize almost any aspect of the standard ArcView interface
• Written using the Avenue application development language
Note: Avenue code is written in a Script editor document. The script editor allows you to create, modify, compile, execute, and debug Avenue script.
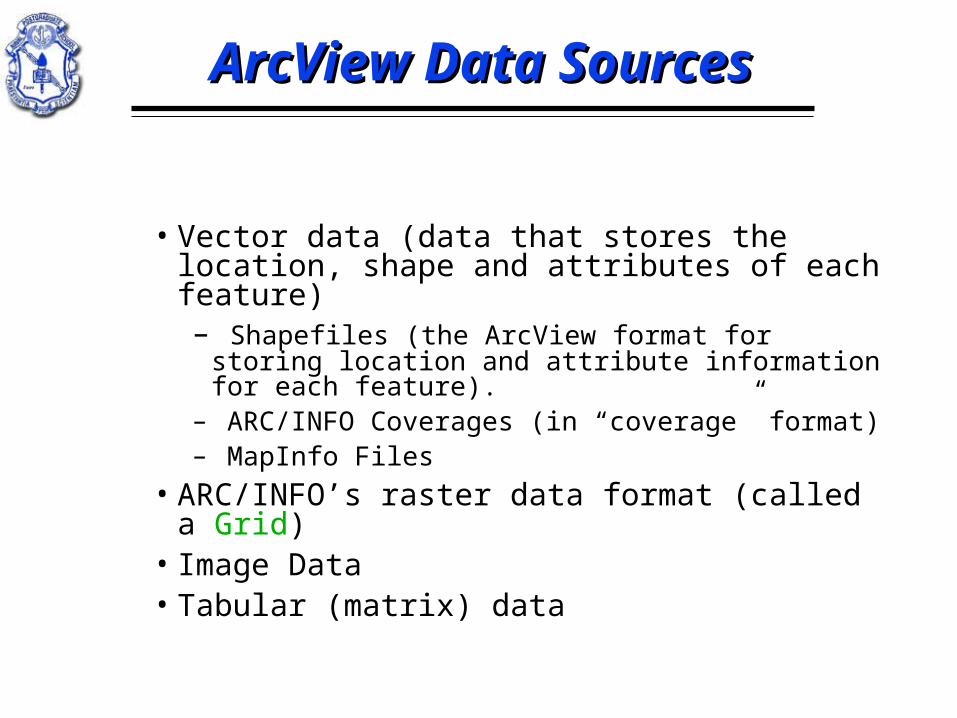
ArcView Data SourcesArcView Data Sources
• Vector data (data that stores the location, shape and attributes of each feature)– Shapefiles (the ArcView format for storing
location and attribute information for each feature).
– ARC/INFO Coverages (in “coverage” format)– MapInfo Files
• ARC/INFO’s raster data format (called a Grid)
• Image Data• Tabular (matrix) data

Vector DataVector Data
• A shapefile is the native ArcView format that is used for vector data
• Each shapefile is a collection of files– Spatial data (shape geometry) .shp
– Spatial data index .shx
– Attribute data .dbf

Raster DataRaster Data
• ArcView themes (known as image themes) can be created from image data (e.g., satellite images, aerial photographs, scanned documents).
• Image Themes do not have attribute tables. Can be manipulated by using the Image Legend editor.
• ArcView supported image types:
- Erdas IMAGINE (with IMAGINE Image extension)
- JPEG files (with JPEG extension)
- National Image Transfer Files (with NITF extension for military users)
- Hot Linking to GIF & MacPaint
- Other image types (BMP, BSQ, BIL, & BIP, MrSID, Image Catelogs,
Sun rasterfiles, TIFF, GeoTIFF, & TIFF/LZW compressed

Matrix Data*Matrix Data*
• USGS DEM– Spatial Analyst or 3D Analyst
Extensions
• NIMA DTED– Spatial Analyst or 3D Analyst
Extensions
* ArcView Import* ArcView Import

Creating Hot LinksCreating Hot Links
Can be linked to:–An image
–An Avenue script
–A Word document
–A video application
–The Web
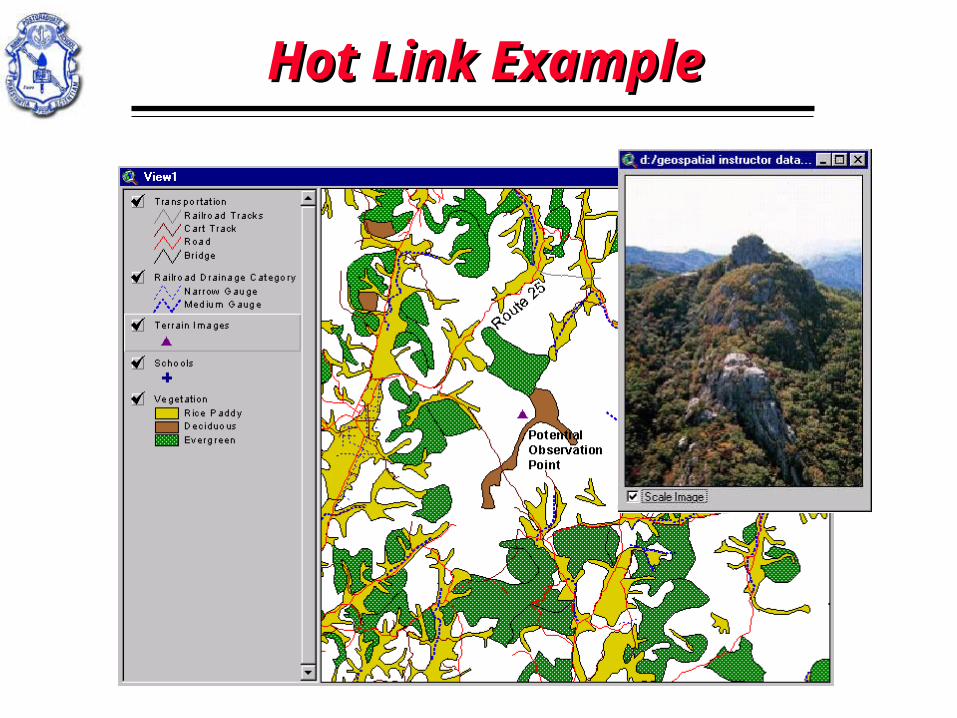
Hot Link ExampleHot Link Example

Referencing Views to Referencing Views to the Real Worldthe Real World
Requires a map projection – a formula that converts positional data (lat., long.) on an ellipsoidal surface to
(x,y) coordinates on a planar surface.

Map ProjectionsMap Projections
• Original data must be in decimal degrees to be projected
• Only the view of the data is changed, the source coordinates are unchanged
• Projection units can be specified
• Image and grid themes are unaffected by the projection properties specified for a view – they are assumed to be in the correct projection already. Always use the image/grid theme projection for the view!!
When Working with a View :

ArcView ExtensionsArcView Extensions
• Provide additional capabilities
• User interface changes to reflect the additional capabilities
• May be loaded and unloaded during a session and will load automatically when required.
• Include:ArcView Spatial Analyst (converts
features themes to grid themes, contours, does cell-based analysis
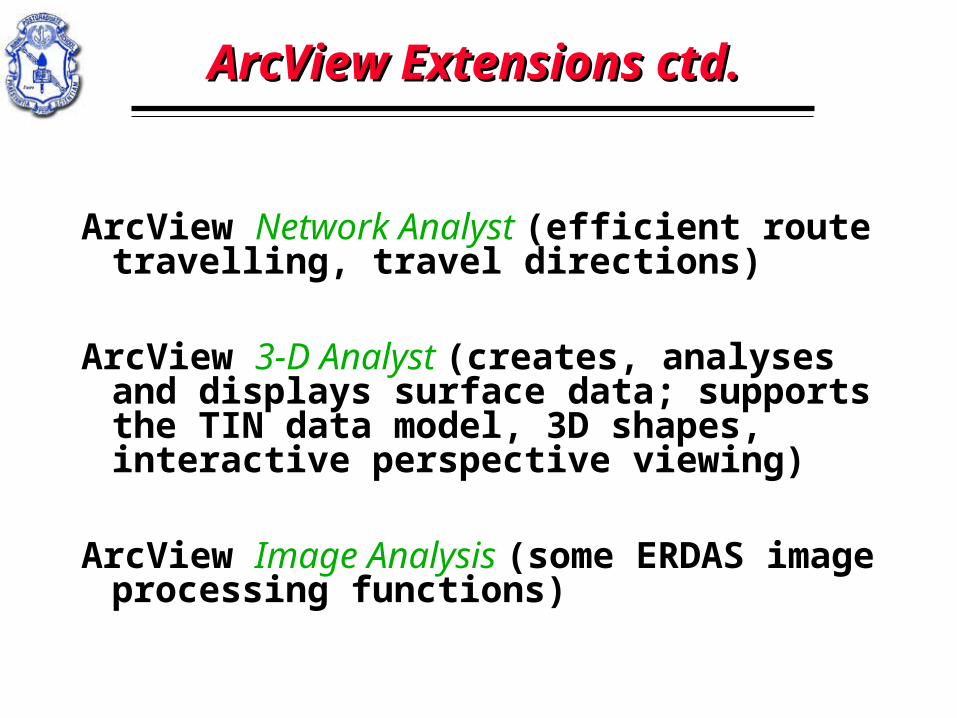
ArcView Extensions ctd.ArcView Extensions ctd.
ArcView Network Analyst (efficient route travelling, travel directions)
ArcView 3-D Analyst (creates, analyses and displays surface data; supports the TIN data model, 3D shapes, interactive perspective viewing)
ArcView Image Analysis (some ERDAS image processing functions)

ArcView Upgrades

SummarySummary
• Examined GIS concepts.
• Looked at data types (raster/vector) and data sources
• Reviewed some examples
• Introduced to Lab GIS tool -- ArcView