Introduction to Gene Expression Analysis Phillip Lord.
25
Introduction to Gene Expression Analysis Phillip Lord
-
date post
19-Dec-2015 -
Category
Documents
-
view
216 -
download
3
Transcript of Introduction to Gene Expression Analysis Phillip Lord.

Introduction to Gene Expression Analysis
Phillip Lord

Resources
http://www.ebi.ac.uk/microarray/biology_intro.html
http://www.mged.org/
http://www.tigr.org/tdb/microarray/
Microarray Bioinformatics Dov StekelProduct Details:
Paperback 280 pages (September 8, 2003) Publisher: Cambridge University Press Language: English ISBN: 052152587X

How do we measure gene expression?
• Oldest technique is to look at a phenotype.
• In this case, the ura4+ gene from S.pombe
• Most other techniques based on hybridisation. – Northern Blot– Quantative RT-PCR
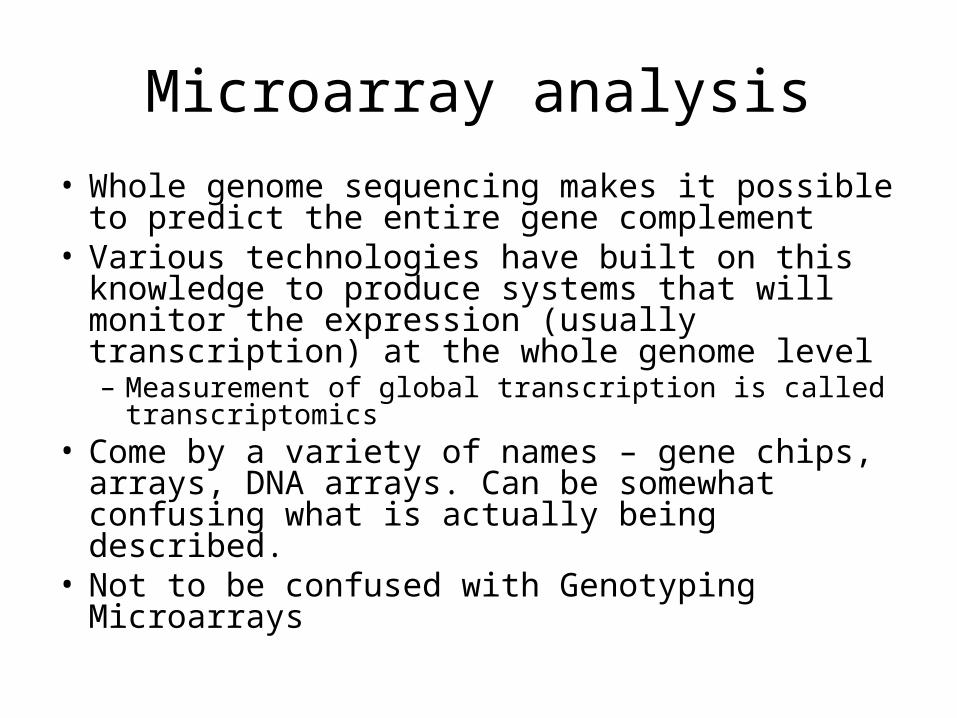
Microarray analysis
• Whole genome sequencing makes it possible to predict the entire gene complement
• Various technologies have built on this knowledge to produce systems that will monitor the expression (usually transcription) at the whole genome level– Measurement of global transcription is called
transcriptomics• Come by a variety of names – gene chips,
arrays, DNA arrays. Can be somewhat confusing what is actually being described.
• Not to be confused with Genotyping Microarrays
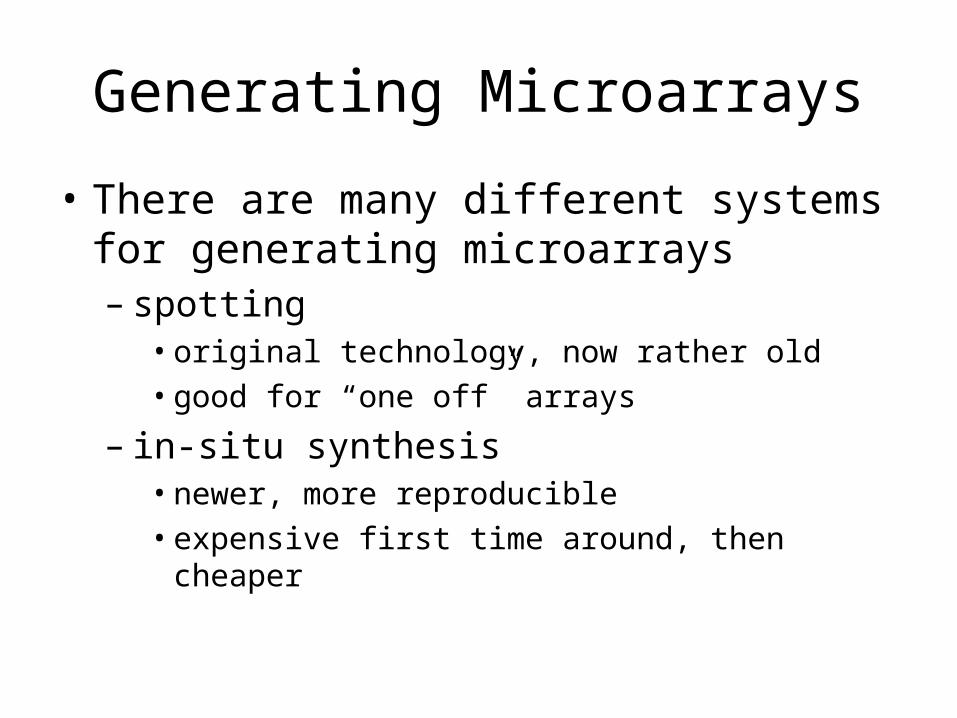
Generating Microarrays
• There are many different systems for generating microarrays– spotting
• original technology, now rather old• good for “one off” arrays
– in-situ synthesis• newer, more reproducible• expensive first time around, then cheaper

Spotting
• Synthesize DNA, spot onto glass slides, fix.
A Spotting Robot The headA Spotting Pin
taken from Stekel, 2003
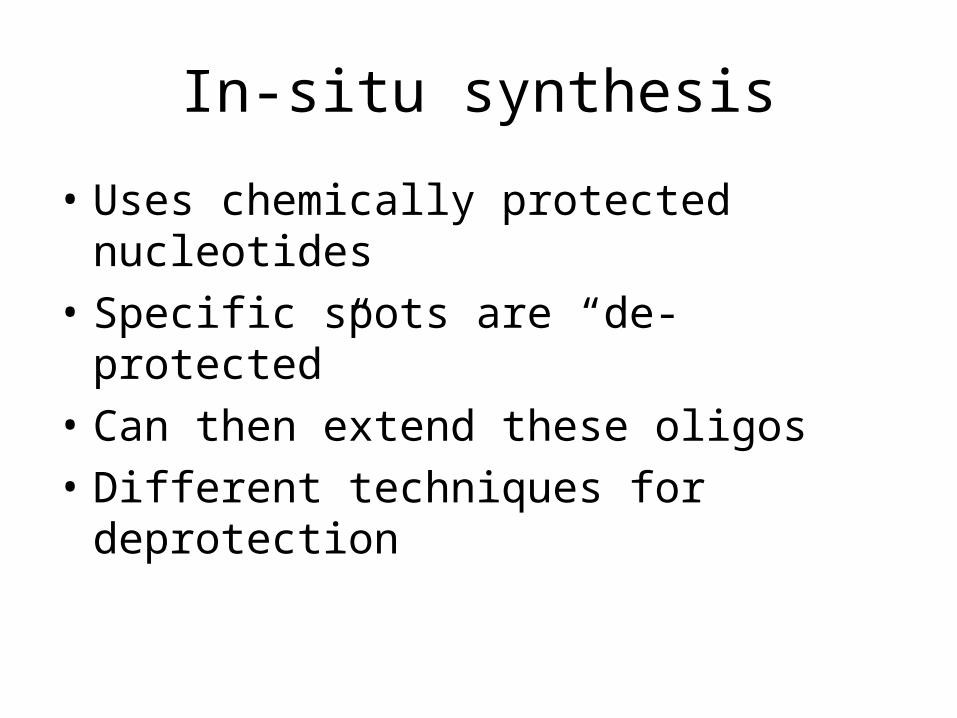
In-situ synthesis
• Uses chemically protected nucleotides
• Specific spots are “de-protected”
• Can then extend these oligos
• Different techniques for deprotection
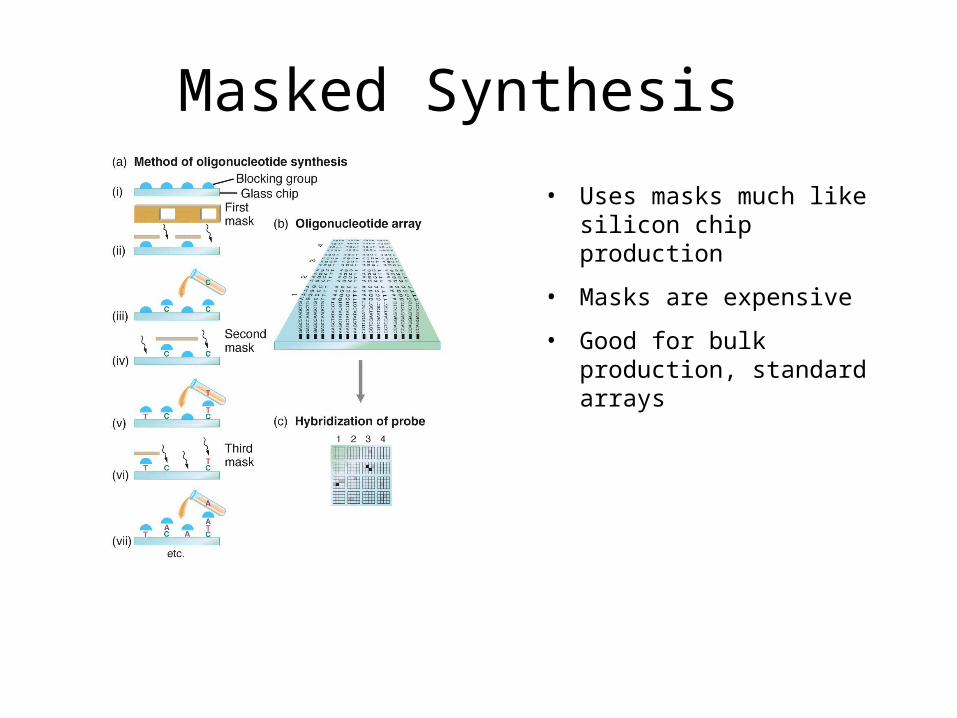
Masked Synthesis
• Uses masks much like silicon chip production
• Masks are expensive
• Good for bulk production, standard arrays
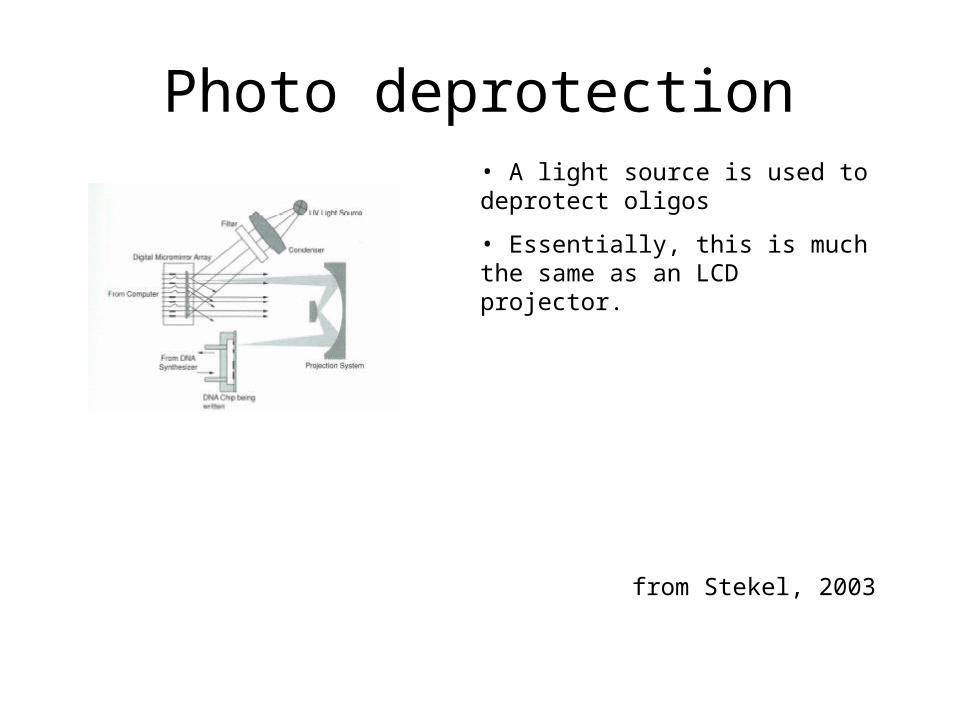
Photo deprotection
from Stekel, 2003
• A light source is used to deprotect oligos
• Essentially, this is much the same as an LCD projector.

InkJet Synthesis• An InkJet head is used to place nucleotides at the appropriate place on the array
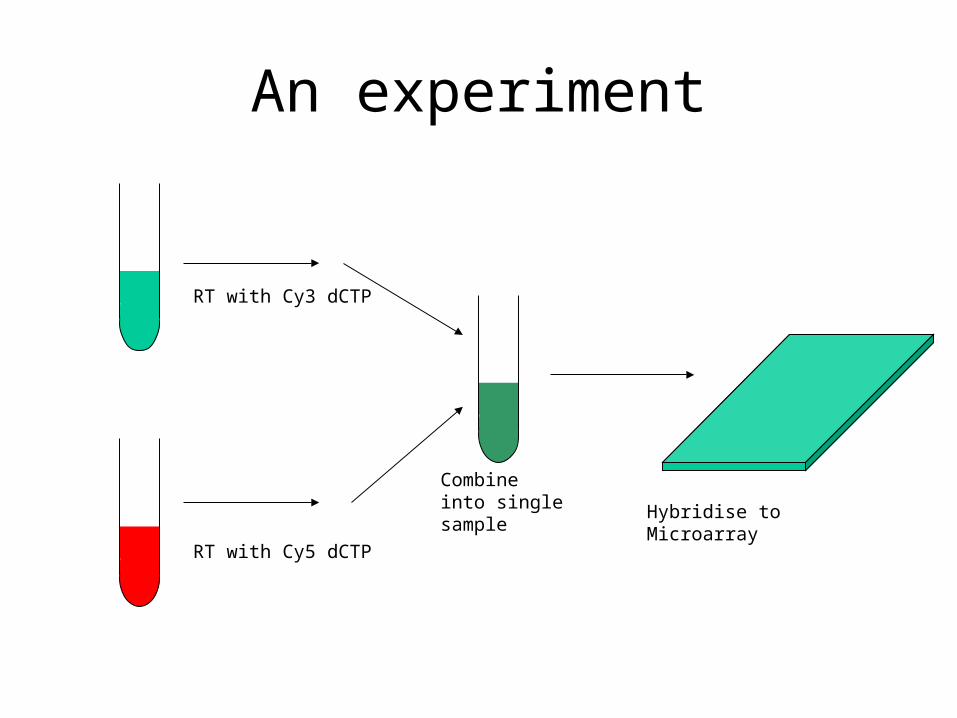
An experiment
Two Samples
RT with Cy3 dCTP
RT with Cy5 dCTP
Combine into single sample Hybridise to Microarray

Hybridisation
from Stekel, 2003

Detection
• Finally, the hybridisation extract must be detected
• The technology is related to desktop scanners, but more sensitive.
• Usually produces a TIFF file
from Stekel, 2003

The end result
from Stekel, 2003
Problems
• We are looking for variability between the expression of different genes.
• There are many (many!) other sources of variability
• Most microarray analysis is about trying to normalise these sources of variability, leaving biological variability

The Jolly Green Giant
The Yellow Splodge Peril
Space Invaders
Artifacts

Solutions
• Removing Sections
• Background Subtraction
• Start Again

Feature Recognition
• Not all spots are equal – different sizes, different shapes.
• Identifying the exact scope of the spot on an array can therefore be hard.
• Often solved in the initial detection of spots.
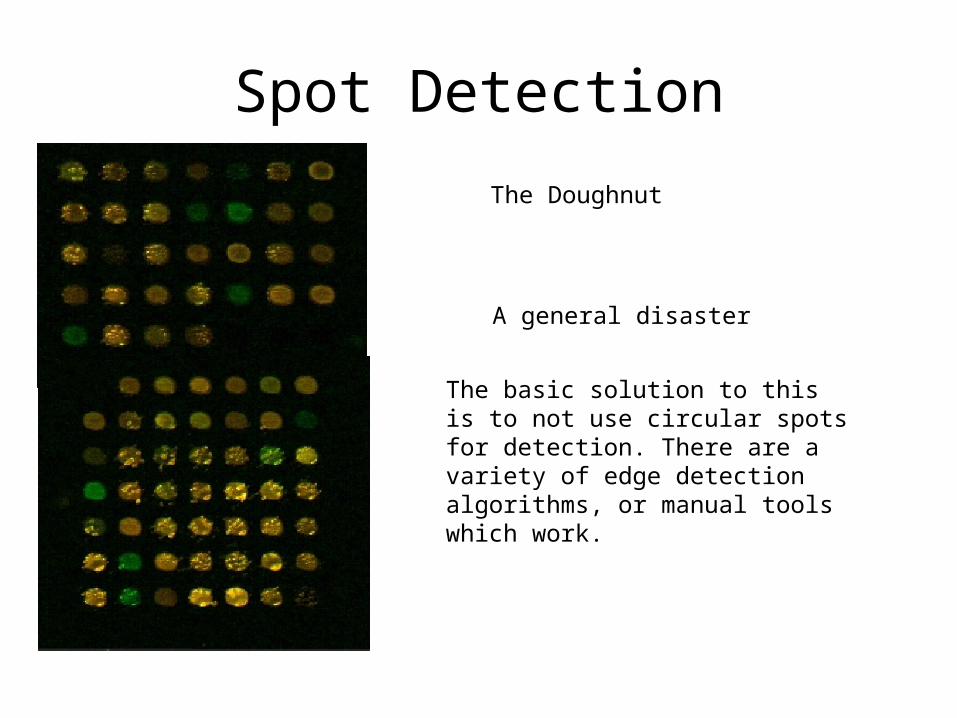
Spot Detection
The Doughnut
A general disaster
The basic solution to this is to not use circular spots for detection. There are a variety of edge detection algorithms, or manual tools which work.

An experiment
Two Samples
RT with Cy3 dCTP
RT with Cy5 dCTP
Combine into single sample Hybridise to Microarray

Channel Variability
• Cy3/Cy5 dyes have different properties.
• So do the lasers at different frequencies.
• So do the photomultipliers which detect them.

Within Slide Variability
• Slides often have imperfections, either from spots, or background
• Gaps are not uncommon, neither are chromatic effects
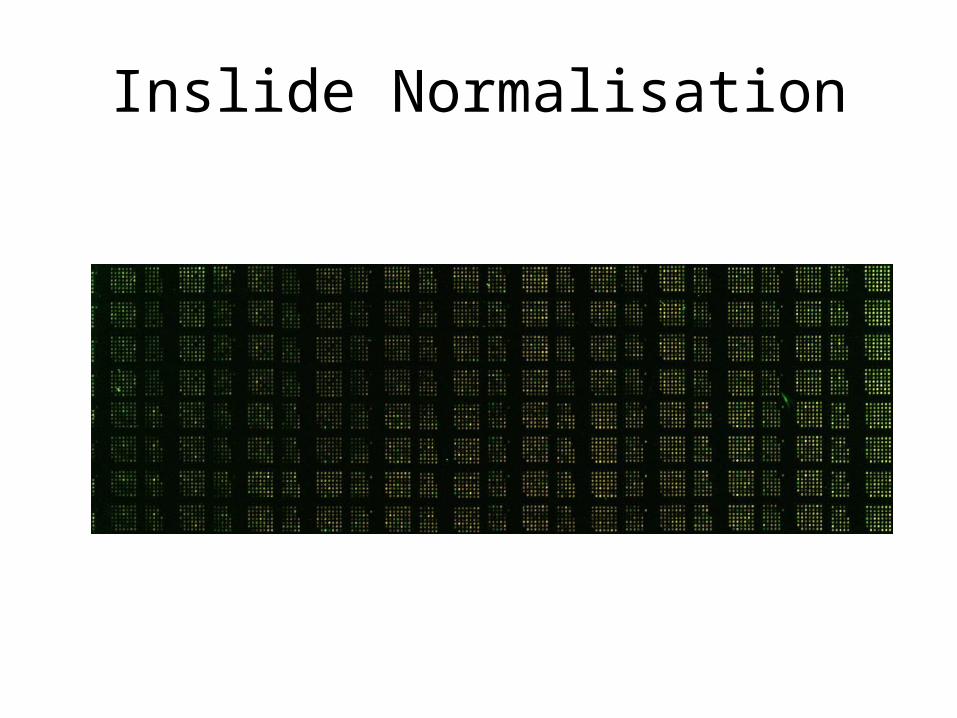
Inslide Normalisation
Between slide variability
• Results between different slides are not directly comparable.
• Results between different experiments are not directly comparable.
Further work
Smith JR, Choi D, Chipps TJ et al. Unique gene expression profiles of
donor matched human retinal and choroidal vascular endothelial cells.
Invest Ophthalmol Vis Sci 2007;48:2676-2684.
Chi JT, Chang HY, Haraldsen G et al. Endothelial cell diversity
revealed by global expression profiling. Pro Nat Acad Sci
2003;100:10623-10628.