Flicker Analysis and Methods for Electric Arc Furnace Flicker (EAF) Mitigation (A Survey).pdf

© 2017 Rensselaer Polytechnic Institute. All rights reserved.
Introduction to Flicker Concepts and Effects
John D. Bullough, Ph.D.Lighting Research Center, Rensselaer Polytechnic Institute
ENERGY STAR® Flicker Testing TutorialSeptember 22, 2017

© 2017 Rensselaer Polytechnic Institute. All rights reserved.3
Introduction
Visual sensitivity to flicker can be characterized in two ways:› Direct perception of light modulation› Indirect perception of stroboscopic effects (phantom array, wagon‐wheel effect)
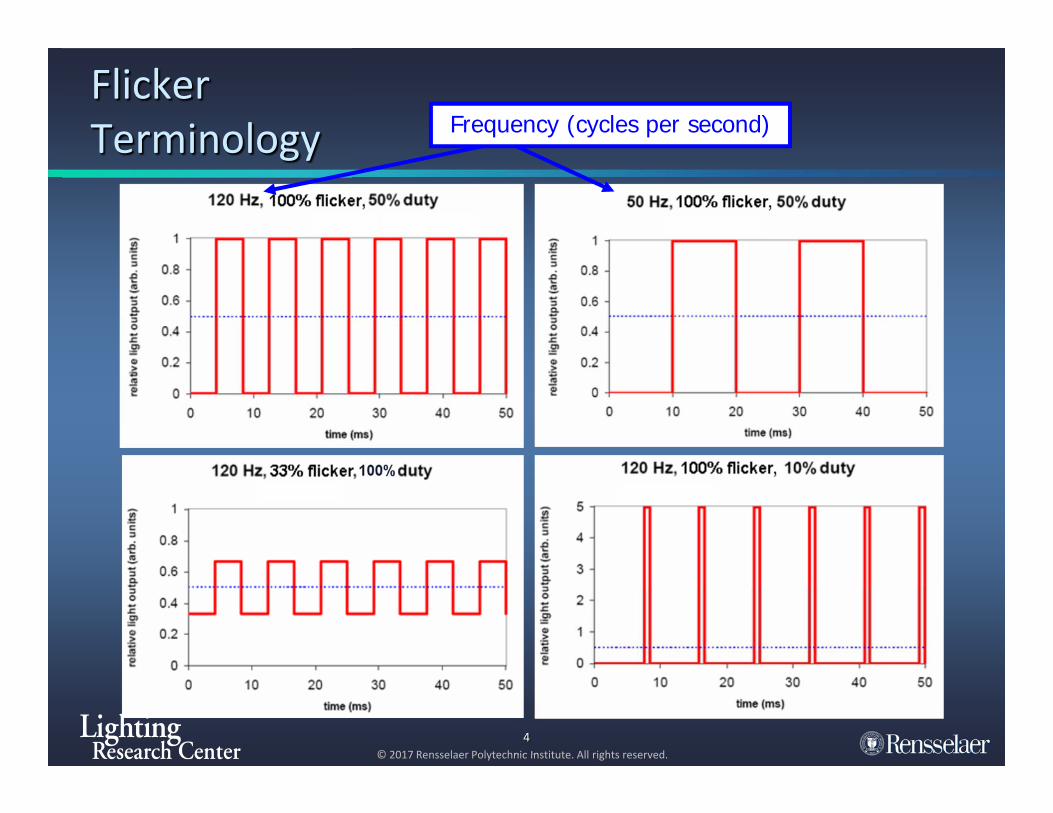
Characteristics of flicker that might influence perception include:› Frequency› Modulation depth› Duty cycle› Waveform shape
© 2017 Rensselaer Polytechnic Institute. All rights reserved.4
FlickerTerminology Frequency (cycles per second)

© 2017 Rensselaer Polytechnic Institute. All rights reserved.5
FlickerTerminology
Modulation amount(Percent flicker:
[max-min]/[max+min])

© 2017 Rensselaer Polytechnic Institute. All rights reserved.6
FlickerTerminology
Modulation amount(Flicker index: area above
average/total area
flicker index: 0.5
flicker index: 0.9

© 2017 Rensselaer Polytechnic Institute. All rights reserved.7
FlickerTerminology
Duty cycle (% of time light output > 10% of max)

© 2017 Rensselaer Polytechnic Institute. All rights reserved.8
FlickerTerminology
Waveform shape(rectangular vs. sinusoidal)

© 2017 Rensselaer Polytechnic Institute. All rights reserved.9
Initial Study: Lighting Conditions Tested
Frequency: Conditions 1‐5 Modulation amount: Conditions 4, 7 Duty cycle: Conditions 4, 6 Waveform shape: Conditions 4, 8 CCT: Conditions 6, 9

© 2017 Rensselaer Polytechnic Institute. All rights reserved.10
Results: Frequencydetection (%) acceptability
Q: flicker while
looking at the wall (p<0.05) 0%
20%
40%
60%
80%
100%
0 50 100 150 200 250 300 350
flicker frequency (Hz)
flick
er p
erce
ptio
n (%
)
-2
-1
+0
+1
+2
0 50 100 150 200 250 300 350
flicker frequency (Hz)
acce
ptab
ility
ratin
g
100% Flicker (0.5 Flicker Index)50% Duty CycleRectangular Waveform Shape4000 K CCT
Limit: ~80 Hz (Kelly, large field)
Q: flicker while
waving hand under luminaire (p<0.05) 0%
20%
40%
60%
80%
100%
0 50 100 150 200 250 300 350
flicker frequency (Hz)
flick
er p
erce
ptio
n (%
)
-2
-1
+0
+1
+2
0 50 100 150 200 250 300 350
flicker frequency (Hz)
acce
ptab
ility
ratin
g

© 2017 Rensselaer Polytechnic Institute. All rights reserved.11
Results: Modulation Amount120 Hz Frequency50% Duty Cycle (modulation only)Rectangular Waveform Shape4000 K CCT
Q: flicker while
waving hand under luminaire (p<0.05)
detection (%)
0.0 0.1 0.2 0.3 0.4 0.5 0.6flicker index

© 2017 Rensselaer Polytechnic Institute. All rights reserved.12
Parametric Study: Detection/Acceptability of Stroboscopic Effects
Frequency →Percent flicker (flicker index) ↓
100 Hz
300 Hz
1000 Hz
3000 Hz
10000 Hz
100%(0.5)
54%(0.27)
25%(0.13)
5% (0.03)
100% flicker
0%
20%
40%
60%
80%
100%
0 1 2 3 4 5 6
rel. time
rel.
light
out
put
54% flicker
0%
20%
40%
60%
80%
100%
0 1 2 3 4 5 6
rel. time
rel.
light
out
put
25% flicker
0%
20%
40%
60%
80%
100%
0 1 2 3 4 5 6
rel. time
rel.
light
out
put
5% flicker
0%
20%
40%
60%
80%
100%
0 1 2 3 4 5 6
rel. time
rel.
light
out
put
Experimental Task: Waving a light‐colored rod against a dark background
(0.5 flicker index) (0.27 flicker index) (0.13 flicker index) (0.03 flicker index)

© 2017 Rensselaer Polytechnic Institute. All rights reserved.13
Results: Did You See It?
100 300 1000 3000 100005%
25%
54%
100%
Flicker Frequency (Hz)
Perc
ent F
licke
r (%
)
Detection of Stroboscopic Effects
80%-100%60%-80%40%-60%20%-40%0%-20%
0.5
0.27
0.13
0.03
Flic
ker I
ndex
d = [(25p + 140)/(f + 25p + 140)] × 100%(d=%detection, f=frequency in Hz, p=percent flicker=flicker index × 200)

© 2017 Rensselaer Polytechnic Institute. All rights reserved.14
Results: Was it Acceptable?
100 300 1000 3000 100005%
25%
54%
100%
Flicker Frequency (Hz)
Perc
ent F
licke
r (%
)
Acceptability of Stroboscopic Effects
-1-00-0.50.5-11-1.51.5-2
+2: very acceptable
+1: somewhat acceptable
0: neither acceptable nor unacceptable
–1: somewhat unacceptable
–2: very unacceptable
0.5
0.27
0.13
0.03
Flic
ker I
ndex
a = 2 – 4/[1 + f/(130 log p – 73)](a=rating value, f=frequency in Hz, p=percent flicker=flicker index × 200)

© 2017 Rensselaer Polytechnic Institute. All rights reserved.
Visual Performance Study
15
Three flickering lighting conditions:› 100 Hz/100% flicker (0.5 flicker index):
96% detection, ‐0.6 acceptability› 100 Hz/25% flicker (0.13 flicker index):
88% detection, ‐0.1 acceptability› 1000 Hz/100% flicker (0.5 flicker index):
73% detection, +1.4 acceptability
Participants performed a low‐contrast numerical verification task, identifying mismatched 5‐digit numbers over 30 minutes
Number of lines completed, number and rate of errors, and subjective comfort ratings were recorded
(Bullough et al. 2013)

© 2017 Rensselaer Polytechnic Institute. All rights reserved.
Visual Performance Study: Results
16
0.0%
0.5%
1.0%
1.5%
2.0%
2.5%
3.0%
3.5%
100 Hz/100% flicker 100 Hz/25% flicker 1000 Hz/100% flicker
Error P
ercentage (+/‐SEM)
Lighting Condition
*

© 2017 Rensselaer Polytechnic Institute. All rights reserved.
Task‐Dependent Response Study: Experimental Setup Horizontal illuminance on desktop:
300 lx Light‐colored surfaces Flicker frequencies (always at 33%
flicker, 0.17 flicker index):› 100, 200, 500, 1000 Hz
Questions: › Stroboscopic effects detected while
waving white rod?› Stroboscopic effects detected with
metronome (208 bpm)?› Acceptability of any flicker from lighting?
+2 Very acceptable+1 Somewhat acceptable0 Neither acceptable
nor unacceptable‐1 Somewhat
unacceptable‐2 Very unacceptable
17

© 2017 Rensselaer Polytechnic Institute. All rights reserved.
Experimental Threshold Results
Detection
162 666 985 (all Hz) 86 125 (all Hz)
Thresholds for detection (50%) and for acceptability (rating=0) occurred at systematically lower frequencies with lower contrast and slower movement speed. In other words, sensitivity to stroboscopic effects was reduced under the tested conditions (e.g., lower contrast, slower movement) relative to those used to
develop the predictions by Bullough et al. (2012)
18
Acceptability

© 2017 Rensselaer Polytechnic Institute. All rights reserved.
Other (Non‐Rectangular) Waveform Shapes
19
Bullough and Marcus (2015) evaluated different waveform shapes and duty cycle (60%‐90% or 100%) at 100, 120, 300 and 1000 Hz
Responses to waving a light‐colored rod against a dark background, and to a metronome operating at 208 bpm were assessed
[all waveforms above: 100% flicker]

© 2017 Rensselaer Polytechnic Institute. All rights reserved.
Experimental Results
20
Percent flicker and flicker index values cannot be compared across different frequencies; Perz et al. (2015) developed a stroboscopic visibility measure (SVM) based on Fourier analysis, which is independent of frequency properties
In their study of responses to 100‐1000 Hz flicker varying in waveform shape and duty cycle (Bullough and Marcus 2015), detection and acceptability were rectified at least as well as SVM by a modified flicker index defined as: › Modified flicker index = Flicker index × 100/f, where f is the frequency (Hz)

© 2017 Rensselaer Polytechnic Institute. All rights reserved.
Implications of Results
Data from Bullough and Marcus (2015) have several implications for specifications to limit perception of stroboscopic effects:› Metrics based on flicker index (such as modified flicker index) are superior to those based on percent flicker, such as IEEE 1789 and California Title 24
› For waveforms with more than onefundamental frequency component,modified flicker index is difficult to implement because no single frequency can be defined
21

© 2017 Rensselaer Polytechnic Institute. All rights reserved.22
Discussion
Stroboscopic effects can be visible at frequencies of 1000 Hz or higher› High contrast and rapid movement maximize detection
However, even when seen, stroboscopic effects are not necessarily unacceptable
Metrics based on percent flicker and flicker index are limited to waveforms with a single dominant frequency› Fourier‐based metrics would provide a more complete characterization of complex waveforms
© 2017 Rensselaer Polytechnic Institute. All rights reserved.
Thank you!
Acknowledgments› ASSIST program sponsors› US Environmental Protection Agency› LRC faculty, staff and students
Questions?http://www.lrc.rpi.edu/programs/solidstate/assist/recommends/flicker.asp
23