¾ Introduction to FirstRand Retail Cluster · PDF file ·...
198
Transcript of ¾ Introduction to FirstRand Retail Cluster · PDF file ·...

Introduction to FirstRand Retail Cluster Wendy Lucas-BullBrand Value and Advertising Efficiency Derek CarstensWesBank Ronnie WatsonFNB Segment Focus Michael Jordaan
eBucks Lezanne HumanHomeLoans Ed GrondelOne Account Gail Roberts
Expo TourFNB Credit Cards Jan Kleynhans
Transactional Bankingand Investments Galia DurbachInsurance Schoeman RudmanLoans Dave Dantu
Expo TourLunchFNB Service Network Peet van der Walt
Branch Banking Zweli ManyathiBanking Operations Leonie van Tonder
TeaFNB eDelivery Roland le Sueur
Self Service Channel Michael ArnoldTechnology Yatin NarsaiOUTsurance Willem RoosFinancial Services Charter Wendy Lucas-BullSummation Wendy Lucas-BullQuestions
AGENDA

Rand Merchant
Bank
FNB Corporate
RMB Private Bank
FNB Trust Services
FNB Retail
WesBank
FNB Africa
Momentum Life
FirstRand Limited
FirstRand Bank Holdings Limited Momentum Group Limited
Momentum Multi-
Managers
Discovery
Destiny
Discovery Life
VitalityRMB Unit Trusts
RMB Private Equity
RMB Properties
RMB Asset Managers
FirstRand Limited Structure
Insurance
Retail Corporate Wealth Health

Customer Solutions
• Transactional Banking
• Investments• Card• Insurance• International • Credit Compliance• Segment Growth
Strategies• Analytics & Data• Brand and
Communications• Hogan Technology
Retail Cluster Structure Financial Reporting
Ronnie Watson
Technology - Yatin Narsai
CFO & Support - Alan Hedding
EB Nieuwoudt
FNB Retail WesBank FNB Africa
Michael Jordaan Peet van der Walt
Retail ClusterWendy Lucas-Bull
Willem Roos & Howard Aron
OUTsurance
Keith Young
First Link
Insurance
• eBucks Rewards
Service Network
• Branch Banking• Direct Channel• eDelivery• Banking
Operations• Self-Service
Channels• SCION• dBusiness.tap• PayPeople• FNB Learning
• Business• Motor• Fleet Services• Cashpower• Collections
Solutions
• Botswana• Namibia• Swaziland• Lesotho
• Home Loans
• FNB Loans

Customer Solutions
• HomeLoans• Transactional
Banking• Investments• Card• Insurance• International
Banking• Credit Compliance• Segment Growth
Strategies• Analytics & Data• Brand and
Communications• Hogan Technology
Ronnie Watson
Technology - Yatin Narsai
CFO & Support - Alan Hedding
EB Nieuwoudt
FNB Retail WesBank FNB Africa
Michael Jordaan Peet van der Walt
Retail ClusterWendy Lucas-Bull
Willem Roos & Howard Aron
OUTsurance
Keith Young
First Link
Insurance
eBucks Rewards
Service Network
• Branch Banking• Direct Channel• eDelivery• Banking
Operations• Self-Service
Channels• SCION• dBusiness.tap• PayPeople• FNB Learning
• Business• Motor• Fleet Services• Cashpower• Collections
Solutions
• Botswana• Namibia• Swaziland• Lesotho
• FNB Loans
Retail Cluster Structure Recent Changes

The journey so far…

June1998
June2001
June2003
June2002
“Hands-off”
2004
*Saambou Deposits
*NBS HomeLoans
June1999
June2000
GrowthExternal Focus
New Strategy being
implemented
Get Basics Right
*Saambou Affordable Housing*Saambou Home Loans *Swabou
From an Internal to anExternal Focus…
*NBS Insurance
MetroBanking OperationsCardHomeLoansCredit ManagementTechnologyRuralAfrican SubsCost & Revenue Dynamics
CreditCollections SolutionsFNB LifeDatabasesEmbedded Value
Sharing:
*Saambou Insurance

Retail Cluster’s financial dynamics in perspective…

WesBank21%
HomeLoans20%
Other48%
FNB Africa5%
Credit Card2%
Transactional Banking
2%
Loans Division2%
Retail Cluster 52% Share of FirstRand Banking Group Advances
Retail Cluster Advances at Dec’03

Income Statement relative to FirstRand Banking Group
64% 70%
Operating Expenditure
67% 67%
Non-Interest RevenueNet Interest Income
(Dec ‘03)
NPBT

OUR BRANDSDerek Carstens
FirstRand Retail Cluster

Mission Statement
To passionately build & nurture the most compelling and innovative
range of financial service brands in the business

Brands – The Business Imperative
ROE
16,3% vs. 12,0%
EFFICIENCY
54,5% vs. 66,8%
Source: Council on Financial Competition 2003Source: Council on Financial Competition 2003

FNB Brand Report Card
Commitment LevelsDaily market perception tracking study
o Information segment basedo Metropolitan areas onlyo Banked populationo Reported quarterly
How we stando Mass – strongly committed (R60k)o Middle (Black/Coloured) – strongly committed (R60 – R350k)o Middle (White/Asian) – needs working ono Middle Upper – holding our own (R350k +)o Business – strongly represented (up to R20 million)
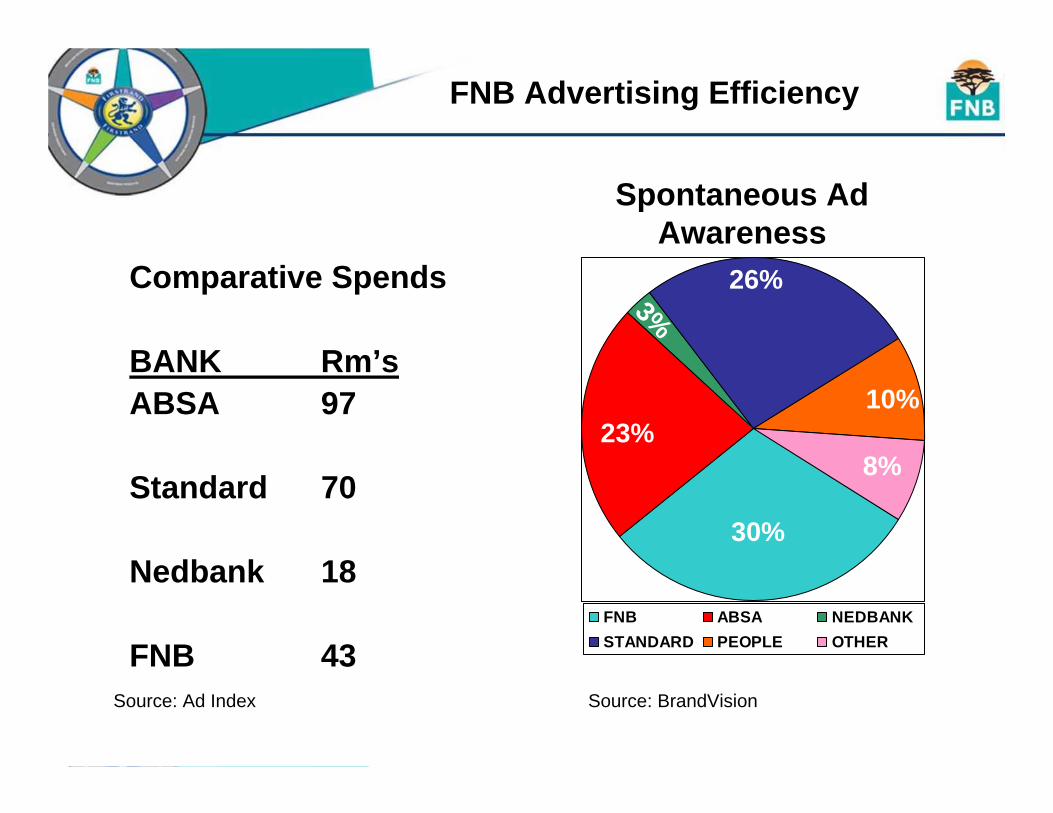
FNB Advertising Efficiency
Comparative Spends
BANK Rm’sABSA 97
Standard 70
Nedbank 18
FNB 43Source: Ad Index Source: BrandVision
23%8%
10%3%
30%
26%
FNB ABSA NEDBANKSTANDARD PEOPLE OTHER
Spontaneous Ad Awareness

Ronnie Watson

41%
NPBT up 35%
New business production up 24%
NPLs down to 0.78% (0.93% June 03)
NIR up 33.1%
22%
WesBank’s Share of Retail Cluster NPBT
WesBank Share of Retail Cluster Advances
WesBankKey Highlights … Dec ’03

Operational Improvement
Specific Bad Debts to Advances for the Financial Year ended June ‘03
00.20.40.60.8
11.21.4
1999 2000 2001 2002 2003
%
150
200
250
Bad Debt % Rand Values
Rm

0
5
10
15
20
25
30
35Ju
n-00
Sep
Dec Mar
Jun
Sep
Dec Mar
June
Sep
Dec
Mar
-03
Jun
Sep
Dec
%
WesBank FirstRand Group Standard Group
ABSA Group Nedcor Group Others
Source: DI900 - Collated to latest Reserve Bank totals + Toyota Financial Services Book
Market Share - Book Values
Instalment Sale and Leasing Book

New Vehicle Market Share
5
10
15
20
25
30
35Ja
n
Mar
-02
May Ju
l
Sep
Nov Ja
n
Mar
-03
May Ju
l
Sep
Nov Ja
n
Mar
-04
%
WesBank SBVAF AVAF Cash
Source: WesBank
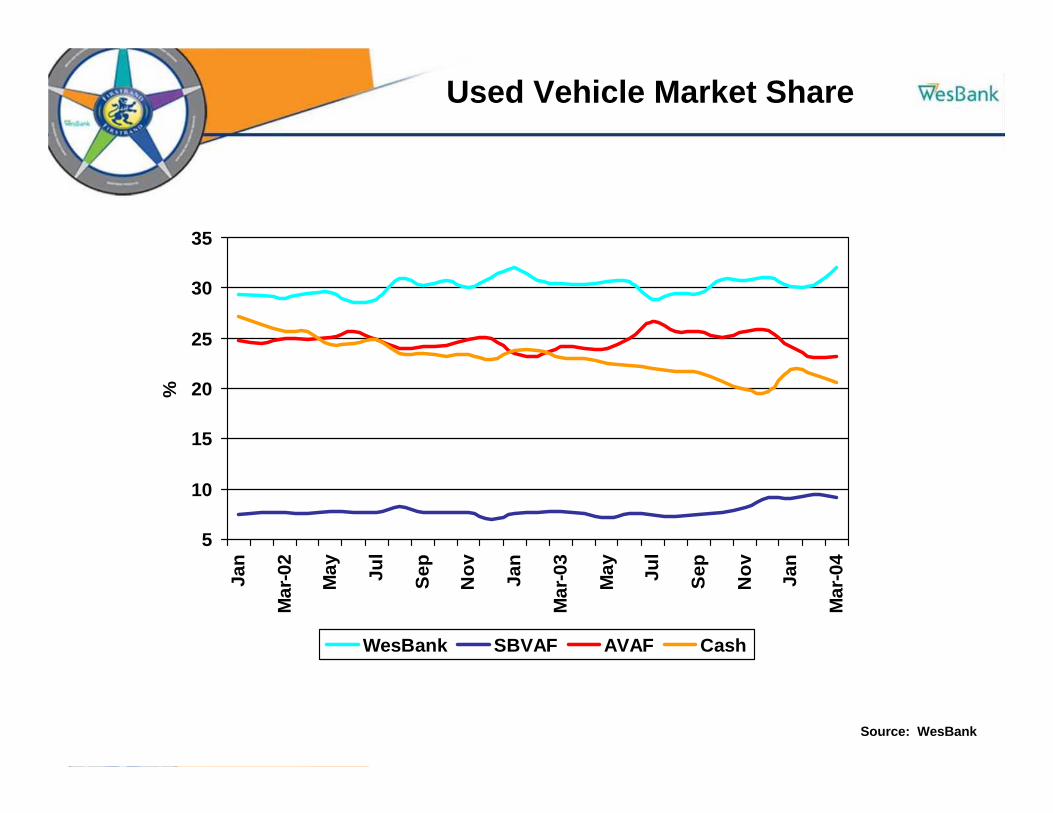
Used Vehicle Market Share
Source: WesBank
5
10
15
20
25
30
35Ja
n
Mar
-02
May Ju
l
Sep
Nov Jan
Mar
-03
May Ju
l
Sep
Nov Jan
Mar
-04
%
WesBank SBVAF AVAF Cash

Dec 2003Book R44bn
MotorDivisionBusinessDivision
Annual Growth
Rate 25%
Annual Growth
Rate 31%
Diversity

Supermarket Finance
Partnerships

Motor Motor FinanceFinance
Wholesale Wholesale FinanceFinance
Car Care Car Care ConsultantsConsultants
SewellsSewells & & BenchmarkingBenchmarking
F&I TrainingF&I Training
Motor Value-Adding Activities

Strategic Focus Areas
People
Customer Service
Efficiencies
Growth

Growth Opportunities
Organico SANTACO, InspectaCar, Private Leasing,
Business Division growth strategy, Islamic Finance and Collection Solutions External
Acquisitiono Actively looking for opportunities that will add
load e.g. Barloworld Equipment book
Greenfieldso Australia and other International Opportunities,
MotorOne, TFM
Collaborationo FNB Corporate and FNB Service Network
Customer SolutionsMichael Jordaan

Agenda
Segment Focus - Michael Jordaan
eBucks Reward Programme - Lezanne Human
HomeLoans - Ed Grondel
One Account - Gail Roberts
Credit Card - Jan KleynhansTransactional Banking &Investments - Gaila Durbach
Insurance - Schoeman Rudman
Loans - Dave Dantu

-
1
-160kMulti-banked
15.75m(18% banked)
10.95(54% banked)
2.25m(94% banked)
780k
Low IncomeR0k – R6k
MassR6k – R60k
Middle and UpperR60k – R350k
BusinessTurnover R60k toR20m pa
PremierR350K +
FNB share of BankingRelationships 2003 or latestavailable
25%25%
18%18%
21%21%
21%21%
17%17%
SA Banking Market

eBucks Reward ProgrammeLezanneLezanne HumanHuman

eBucks - Overview
Commenced operations 3+ years ago (Oct 2000)
Dedicated rewards programme – split from Internetbanking in January 2004
Customer base – 693,000 and growing
Voted best Financial Services Rewards Programme in 2003

Growth in Member Base
eBucks Rewards Programme - registered base
293,425
692,659
511,226
0100,000200,000300,000400,000500,000600,000700,000800,000
Nov
-00
Jan-
01M
ar-0
1M
ay-0
1Ju
l-01
Sep
-01
Nov
-01
Jan-
02M
ar-0
2M
ay-0
2Ju
l-02
Sep
-02
Nov
-02
Jan-
03M
ar-0
3M
ay-0
3Ju
l-03
Sep
-03
Nov
-03
Jan-
04M
ar-0
4

eBucks Earn Partners
…..Watch this space for more

Spend Channels
Interneto eBucks Shop (over 1,000 products)o Innovative offers (i.e. only online LOTTO supplier)o Payment Solution (click-through to merchants such
as Makro & Kalahari for even wider choice)
Call centre (Agents, IVR)
Dedicated eBucksTravel service centre
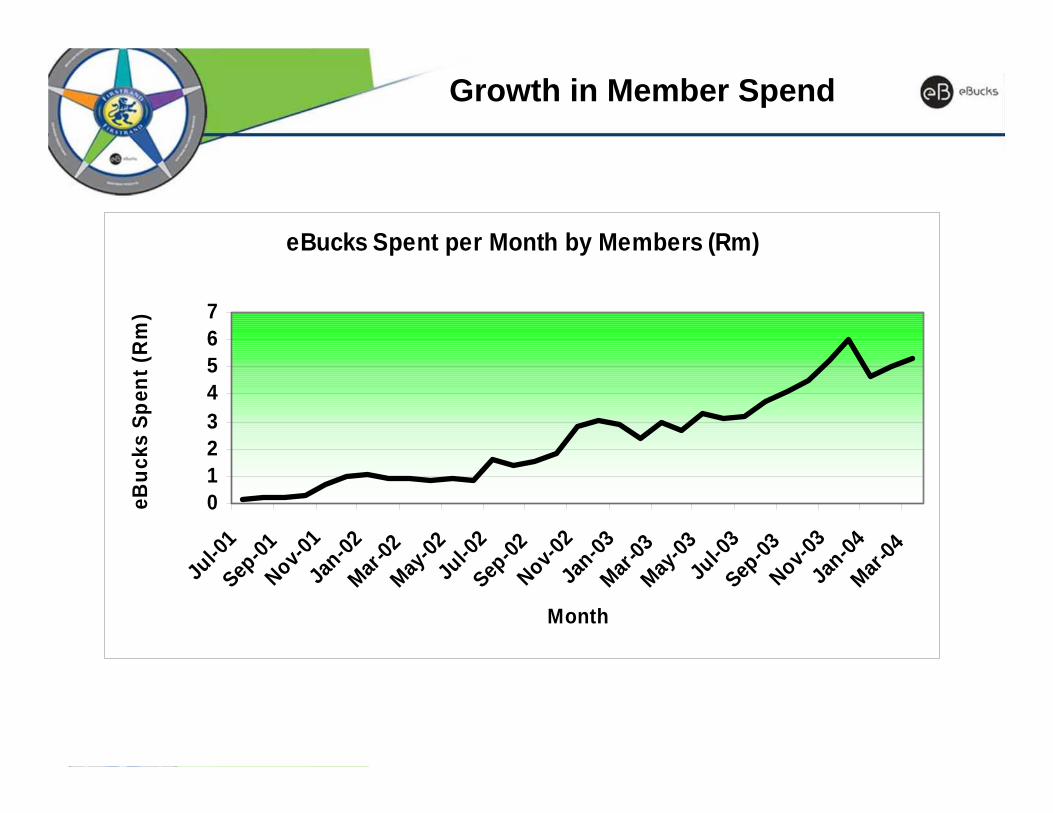
Growth in Member Spend
eBucks Spent per Month by Members (Rm)
01234567
Jul-0
1Sep
-01Nov-0
1Ja
n-02Mar-
02May
-02Ju
l-02
Sep-02
Nov-02
Jan-03
Mar-03
May-03
Jul-0
3Sep
-03Nov-0
3Ja
n-04Mar-
04
Month
eBuc
ks S
pent
(Rm
)
HomeLoansEd Ed Grondel
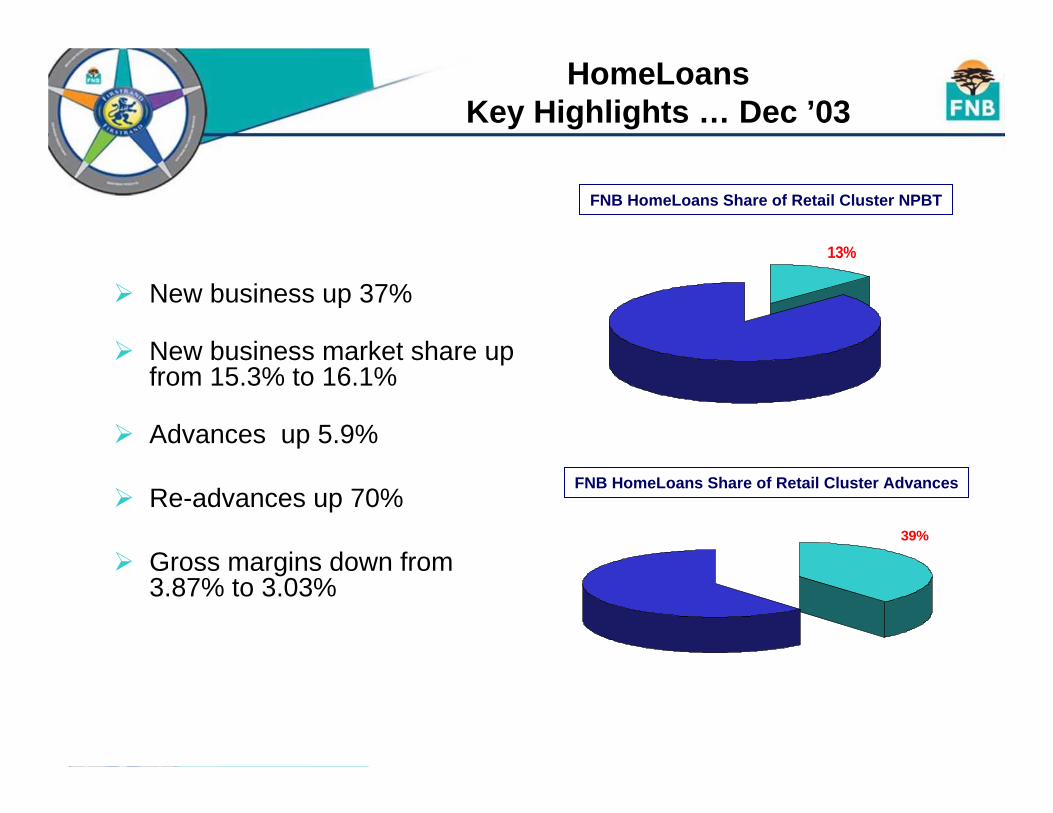
New business up 37%
New business market share up from 15.3% to 16.1%
Advances up 5.9%
Re-advances up 70%
Gross margins down from 3.87% to 3.03%
13%
FNB HomeLoans Share of Retail Cluster NPBT
39%
FNB HomeLoans Share of Retail Cluster Advances
HomeLoansKey Highlights … Dec ’03

Doing the right things,
AcquisitionDecline Turnaround Profitable Growth
Doing things right.
Time
21% M/S16% NB
8%Book Market Share
(M/S)6%
Share of New Business (NB)
1999 2001
11% M/S15% NB
2000 2002
+20% M/S+17% NB
2003
Mar
ket S
hare
2004 2005
JP MorganBest Home Loan
Operation
PWCBest Mortgage
Provider

HomeLoans Profits
R -400
R -200
R 0
R 200
R 400
R 600
1999 2000 2001 2002 2003 2004½ Year
Rural HomeLoans New acquisitionsPips once-off profits HomeLoans
R532m
R334m
-R333m
R132m
R272mR269m
Growing Profitably
-R271m
R343m
R196m

R10mR563mR56,270Standard *
R6mR447mR73,860ABSA *
Rand Profit / R’Billion
Financial Year Profit (2003)
Individual Mortgages (R’M)Bank
R13mR532mR39,610FNB HomeLoans
* Source: DI900 line 122
Profit Leader

Collections Excellence
NPL % of Gross advances
2%3%4%5%6%7%8%9%
Jun-99
Dec-99
Jun-00
Dec-00
Jun-01
Dec-01
Jun-02
Dec-02
Jun-03
Dec-03
1%0%

Volume Growth
-5,000
10,00015,00020,00025,00030,00035,00040,00045,000
98/99 99/00 00/01 01/02 02/03 1/2 Year2003/4
R‘M
illio
n
Loan Book
5,00015,00020,00025,00030,00035,00040,00045,00050,00060,000
Growth in no. of Registrations

Greater Efficiencies
Registrations per operational staff member
74
127 137162
202
0
50
100
150
200
250
99/00 00/01 01/02 02/03 03/04
No.

Bottom-line driven home loan focused unit
Centralization of processing
2 Hrs reply times
Individual pricing
Outsourcing model for valuations
Revolutionary Pips solution – HomeTraders
Embraced Mortgage Origination
Pioneered electronic origination
First from FNB HomeLoans

Boom not bubble
Strong and growing competition
Continued influence by market intermediaries
South African ResidentialMortgage Market 2004

Where do we get our business?
Branches & other Direct
23%Mortgage
Originators55%
Estate Agents22%
Estate Agents13%
Mortgage Originators
46%
Branches & other Direct
41%
2001/2 2003/4

Volume
Efficiencies
Variable commissions
Obtaining Value from Originators

Quality of Book
Risk Exposure of New Business Dec ‘03
0%5%
10%15%20%25%30%35%40%
Low Low-Med Medium High Very High
Ris
k Ex
posu
re

Meeting Customers’ Needs
Affordable Housing
Mass Upper
Middle
Upper
WealthyOne
Account
Foreign Choice
Segment Offer
BondPlus
Maternity Choice
EducationChoice
Single/Newly Weds
Full Nest Empty Nest Retirement
RepaymentChoice
InvestmentOffer
Life Stage Offer
Future Choice, Flexibond, Building Bond, Rate ChoicesGeneric Offer

Leverage Product and Marketing innovation
Process and Technology efficiency
Building embedded value o Focus on customer retention and re-advancing
o New business and profitable market share growth
Where Will Growth Come From?

Branch Network
Group Collaboration
Innovation in Service
Non-interest Income
Where will growth come from?
Presenting
theONE ACCOUNT
From FNB
Gail Roberts
Tadaah!!!
ConvenientA single banking solution for all primary needsProduct for life
AccessibleAll channels and 0860 FNB ONEChequebook and debit card, petrol card
Excellent value (savings)Single, low, tiered interest rateSalary into account = pay off the loan fasterSet-off balances to improve rate
What the One Account is

New in Middle Market
Up to 10% unsecured portion
Risk and Affordability managemento 4 repayment options o Individual risk rating
Real-timeo Truly integrated back-end o 24 hour access to credit, customer controlledo Single statement
Built for high volumes = source of growth for FNB
Differentiators

Breaking ranks with other banks
Existing concept in new markets
Intended to grow market share in middle market, retain upper segments
Profitable: rapid breakeven
New product enhancements every year
Touted as most exciting thing to happen to banking in many years
Why it’s so cool for FNB


EXPO TOUR

Credit Card IssuingJan Kleynhans

Card loans up 20.1%
Cardholder numbers up 7.5%
14.8% growth in cardholder turnover
Deposits up 11.6%
4%
FNB Card Share of Retail Cluster Advances
CardKey Highlights … Dec ‘03
Our Key Focus Areas
Thorough understanding of customer profitability and credit risk
Highly differentiated card products
Great prospects for growth.

Evolution of FNB Card
2000 - 2001 2001 - 2002 2002 - 2003 2003 - 2004
Split issuing and acquiring, to service segment.
Focussed on getting Balance transfers up and running.
Focussed on getting database mining sales going.
Settling down business and entrenching management.
More aggressive data base selling and cost management.

Advance balances per DI900
CREDIT CARD LOANS
16.0%
17.0%
18.0%
19.0%
20.0%
21.0%
22.0%
23.0%
24.0%
25.0%
26.0%
27.0%
28.0%
29.0%
30.0%
Jun-
01
Jul-0
1
Aug
-01
Sep
-01
Oct
-01
Nov
-01
Dec
-01
Jan-
02
Feb-
02
Mar
-02
Apr
-02
May
-02
Jun-
02
Jul-0
2
Aug
-02
Sep
-02
Oct
-02
Nov
-02
Dec
-02
Jan-
03
Feb-
03
Mar
-03
Apr
-03
May
-03
Jun-
03
Jul-0
3
Aug
-03
Sep
-03
Oct
-03
Nov
-03
Dec
-03
Jan-
04
Feb-
04
FNB before offset ABSA Nedcor Standard
Credit Card Loans

Advance balances per DI900 before deposit off-set
CREDIT CARD LOANS
16.0%
17.0%
18.0%
19.0%
20.0%
21.0%
22.0%
23.0%
24.0%
25.0%
26.0%
27.0%
28.0%
29.0%
Jun-
01
Jul-0
1
Aug
-01
Sep
-01
Oct
-01
Nov
-01
Dec
-01
Jan-
02
Feb-
02
Mar
-02
Apr-
02
May
-02
Jun-
02
Jul-0
2
Aug
-02
Sep
-02
Oct
-02
Nov
-02
Dec
-02
Jan-
03
Feb-
03
Mar
-03
Apr-
03
May
-03
Jun-
03
Jul-0
3
Aug
-03
Sep
-03
Oct
-03
Nov
-03
Dec
-03
Jan-
04
Feb-
04
FNB before offset ABSA Nedcor Standard
Credit Card Loans
Customer Growth
Reviewed SA credit card market and saw potential threat of international monolines into the market
International best practice and skills transfer from US-based Providian Financial (and hard lessons learned!)
Moved from reactive branch-only walk-in sales to proactive database marketing using own outbound call centre and direct mail
Successfully developed credit and analytical skills to manage rapid sales leverage.
Majority of credit card sales are through direct marketing channels.
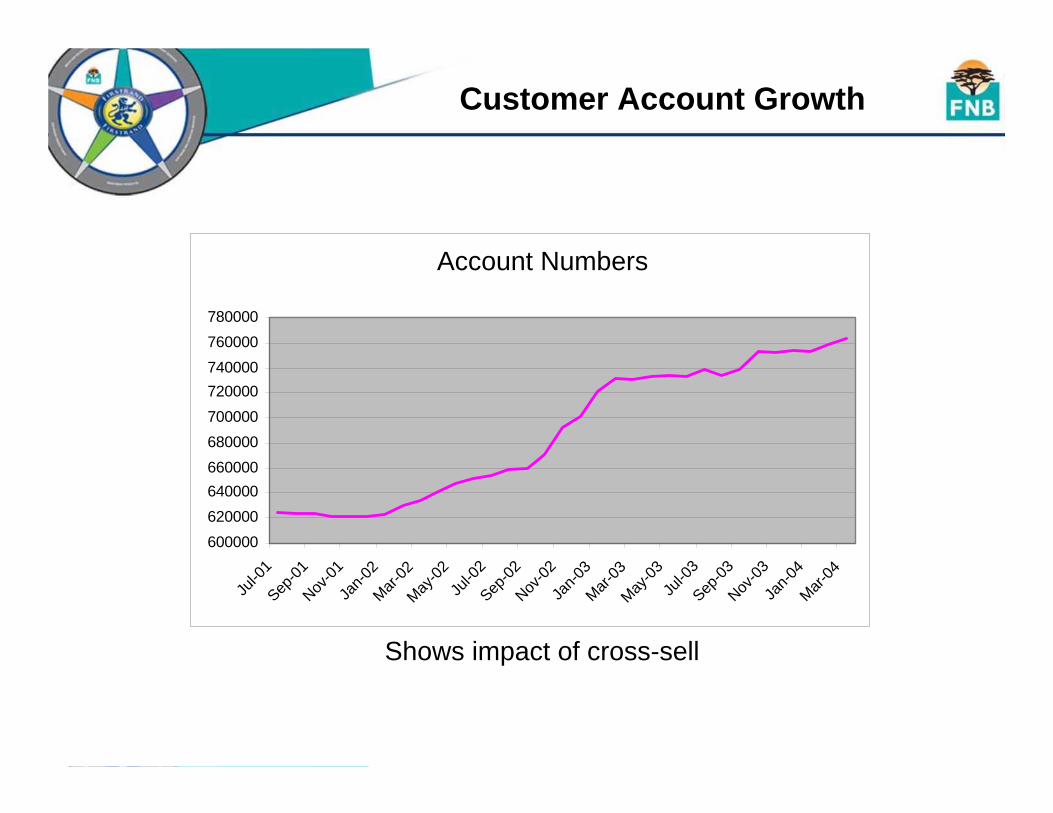
Customer Account Growth
Shows impact of cross-sell
Account numbers
600000620000640000660000680000700000720000740000760000780000
Jul-0
1Sep
-01Nov
-01Ja
n-02
Mar-02
May-02
Jul-0
2Sep
-02Nov
-02Ja
n-03
Mar-03
May-03
Jul-0
3Sep
-03Nov
-03Ja
n-04
Mar-04
Account Numbers

Customer Focused Marketing
Managing effective credit risk and account utilisation
Customer management is about increasing the economic value of each customer account.Active marketing means putting a better product or offer in front of the customer more often in the hope of attracting the customer at the right time.
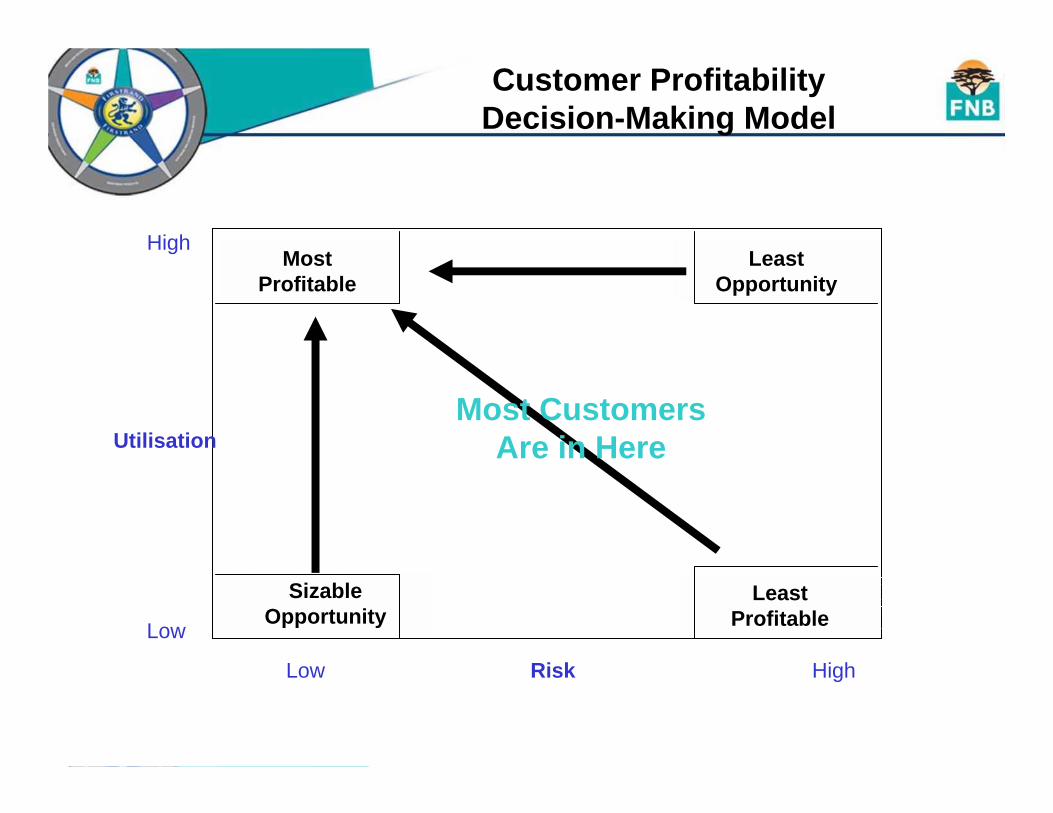
Customer Profitability Decision-Making Model
Low
High
Utilisation
LeastOpportunity
SizableOpportunity
Most Profitable
LeastProfitable
Low Risk High
Most CustomersAre in Here

Customer Risk Distribution
0%
5%
10%
15%
20%
25%
30%
35%
40%
FR0-20 FR21-30 FR31-40 FR41-50 FR51-60 FR61-70 FR71-80 FR81-100
Credit Risk Ratings
% o
f Cus
tom
ers
31-Dec-0230-Jun-0331-Dec-03

Customer Profitability Analysis
Lessthan -R100
-R100 toR0
R0 R0 toR50
R50 toR100
R100 toR200
R200 toR300
R300 toR400
R400 toR500
R500 toR600
R600 toR700
R700 toR800
R800 toR900
R900 toR1000
overR1000
Risk-adjusted Profit Bands
% o
f Tot
al P
rofit
31-Dec-02
31-Dec-03

Products Offered to Increase Economic Value
Balance Transfers
Limit increases and decreases
Add-On Product Sale e.g. Petro cards
Product Upgrade
Cash advances e.g. budget
Account closure
eBucks Rewards upgrade
Do Nothing

eBucks Rewards Driving Profitable Customer Behaviour
23% of customer base linked to eBucks Rewards programme
eBucks credit card customers areo 47% more profitable than non eBucks customerso 50% more likely to be retained as credit card customers o using their credit card 75% more than non - eBucks at point-
of-saleo spending 50% more than non eBucks customers at point-of-
sale o more likely to respond to marketing and sales campaigns
(e.g. electing to receive email statements, merchant promotional campaigns)

Card Product Differentiation
Credit Electron for low income, higher risk end of market
eBucks Rewards programme
Embedded Insurance featureso Debt Protectiono Comprehensive Global Travel Insuranceo AA Emergency Roadside Assistanceo Lost Card and Card replacement insurance
E-commerce products e.g. SABMiller Buying card

Growth Prospects
Leverage off 2 year investment in analytical and database mining skills
World-class credit application and behavioural scoring systems
New income estimation and pre-scoring database mining techniques leveraging off group investment in GIS
Credit Electron product for previously ignored and higher risk markets proving successful
Over 1 million FNB retail and business customer prospects
Leverage off investment in workflow automation and imaging systems
A few other rabbits….watch this space
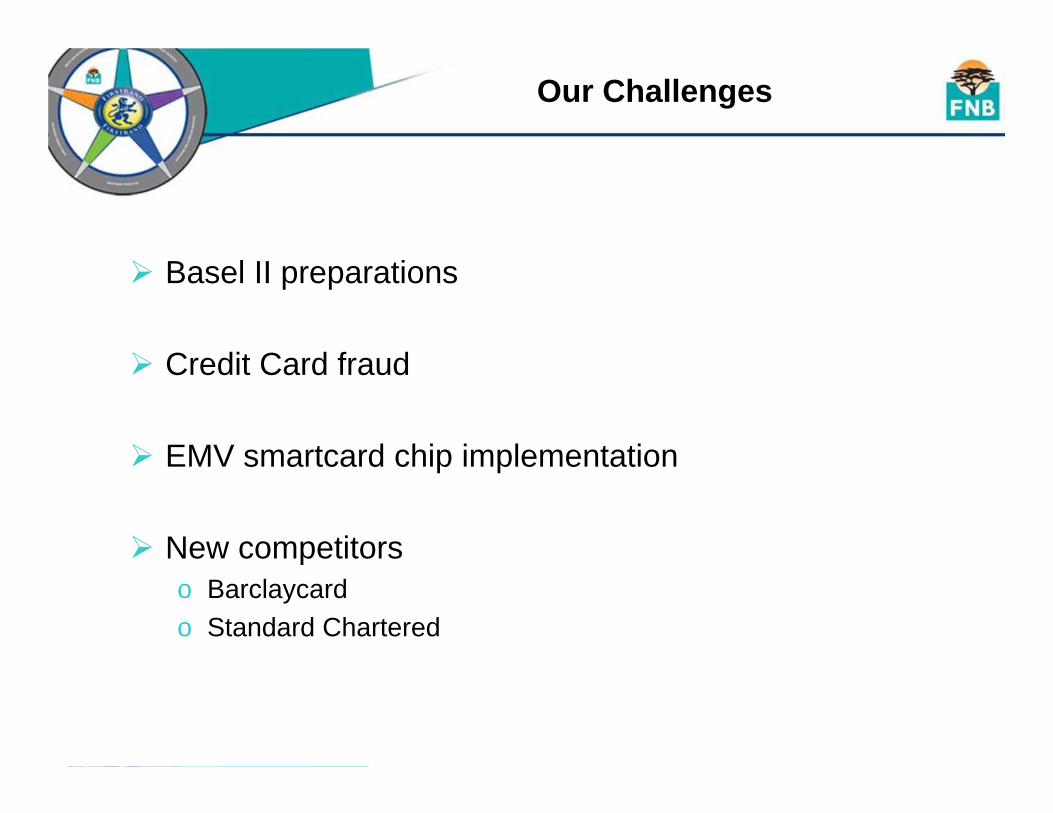
Our Challenges
Basel II preparations
Credit Card fraud
EMV smartcard chip implementation
New competitors o Barclaycardo Standard Chartered

Transactional Banking &
InvestmentsGalia Durbach

Transactional Banking and Investments
Key Highlights … Dec ‘03
Transactions up 8,3%
Debit card number growth o 60% in cheque cards o 140% in Visa Electron cards.
Transacting base up 7.2%
Deposit balances up 11%
Retention of the Saambou book at end December was 53%.
49%
Transactional Banking Share of Retail Cluster NIR
Transactional Banking and Investment Product HouseShare of Retail Cluster Deposits
85%

Cheque AccountsTransmission AccountsSavings Accounts
Call AccountsMoney Market AccountsNotice DepositsFixed DepositsUnit Trusts
ConsumerBusiness
Core Relationship Products
Investment Products
Segments
Who We Are

Core Teams, focused on:o Deep understanding of customers’ needso Product design and developmento Systems and processes, around selling and administering
productso Enabling and supporting frontline staffo Credit managemento Outsourced sales and service to delivery channels, e.g.
branches
Who We Are

2000 2001 2002 2003 2004
Laying the
foundation
The Journey

Fix the BasicsSystems and processes
o Building channel flexibilityo One central platform enabling changes/development
across channels
Products and pricingo Stem revenue leakageo Establish pricing philosophy & principles
• Match pricing approach to customer needs/channel usage
• Simplification• Alignment of pricing across products• Price appropriately to reflect channel costs• Transparency of pricing
Credit policies & basic processes addressed
Laying the Foundation

Building &Innovating
Laying the
foundation
The Journey
2000 2001 2002 2003 2004

Marketing/brand positioningo ‘Revitalize’ FNB’s product presence in the marketo Timed to coincide with branch readiness
Innovatingo Launch of FNB Internet Banking o Innovative, informative customer statements
Credit o Began laying foundations – automation & efficiencies
Building the team and intellectual capital
Building & Innovating

Leveraging
Laying the
foundation
Building &Innovating
The Journey
2000 2001 2002 2003 2004

‘Fixing the basics’ enabled rapid delivery of complex solutions
Ability to take on Saambou Deposit booko Take-on of over 400 000 customers in 90 dayso Conscious opportunity cost
put certain initiatives on hold – credit, payments enhancements
Launch of InContacto Integrated with core systemso 2 months to developo Exponential growth – now over 800 000 customers
Leveraging

0
100,000
200,000
300,000
400,000
500,000
600,000
700,000
Jul-0
2
Aug-
02
Sep-
02
Oct
-02
Nov
-02
Dec
-02
Jan-
03
Feb-
03
Mar
-03
Apr-
03
May
-03
Jun-
03
Jul-0
3
Aug-
03
Sep-
03
Oct
-03
Nov
-03
Dec
-03
Jan-
04
Feb-
04
Mar
-04
Reg
istra
tions
0.01.02.03.04.05.06.07.08.09.0
SMS'
Total registrations Total SMS' per month (Million)
Over 800 000 customers
May ‘04
Over 9m SMS’sent per month
Exponential growth in customers use of this service
Helping to combat fraud
inContact
Leveraging

Streamlined buying processo Cross-sell triggers at frontlineo Reduced time to sell by 50%
Technology is a key differentiator
Leveraging

Positioned for Future
Laying the
foundation
Building &Innovating
Leveraging
The Journey
2000 2001 2002 2003 2004

Delivery capability (physical and virtual)
o Real-Time Account Opening on the Internet
Systems and processes enable rapid automation / streamlining
Customer convenienceo Free Debit Order Switching (10 000 + customers assisted to
date)o Automated Renewal of Fixed Depositso Electronic account payments architecture
Positioned for the Future
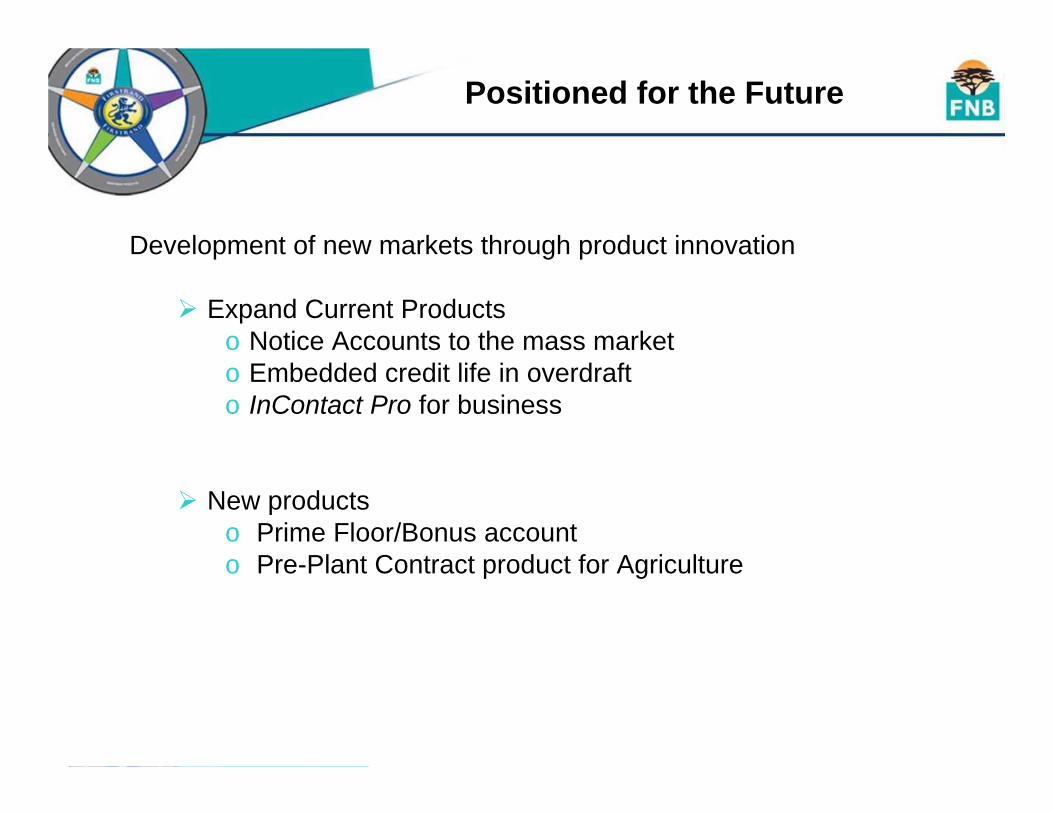
Development of new markets through product innovation
Expand Current Productso Notice Accounts to the mass marketo Embedded credit life in overdrafto InContact Pro for business
New productso Prime Floor/Bonus accounto Pre-Plant Contract product for Agriculture
Positioned for the Future

Improved Credit Processeso Application and Balanced Risk Scorecardso Dynamic Provisioningo Automated Management of Credit Excesseso Hubbing of Credit
eBucks rewards on Cheque accountso eBucks earners 23% less likely to close their accountso eBucks earners transact 90% more than non eBucks earners
Split Transactional and Investment products into two focused areas, operating on a shared infrastructure
Positioned for the Future

Low interest rate, low inflation environmento Product innovationo Cost containmento Continued re-engineeringo Active margin managemento Endowment hedge
0.00%
4.50%
9.00%
13.50%
18.00%
197019721974197619781980198219841986198819901992199419961998200020022004
Average Prime Rate Average Inflation
Growth Challenges

Electronic Cheques & Cash
16.63 % 22.21 %
-3.39 % -1.15 %
Overall growth in transaction volumes 8.3% in 2003 (6.4% in 2002)
Dec 01 Dec 02 Dec 03
Electronic Channels Driving Volume Growth
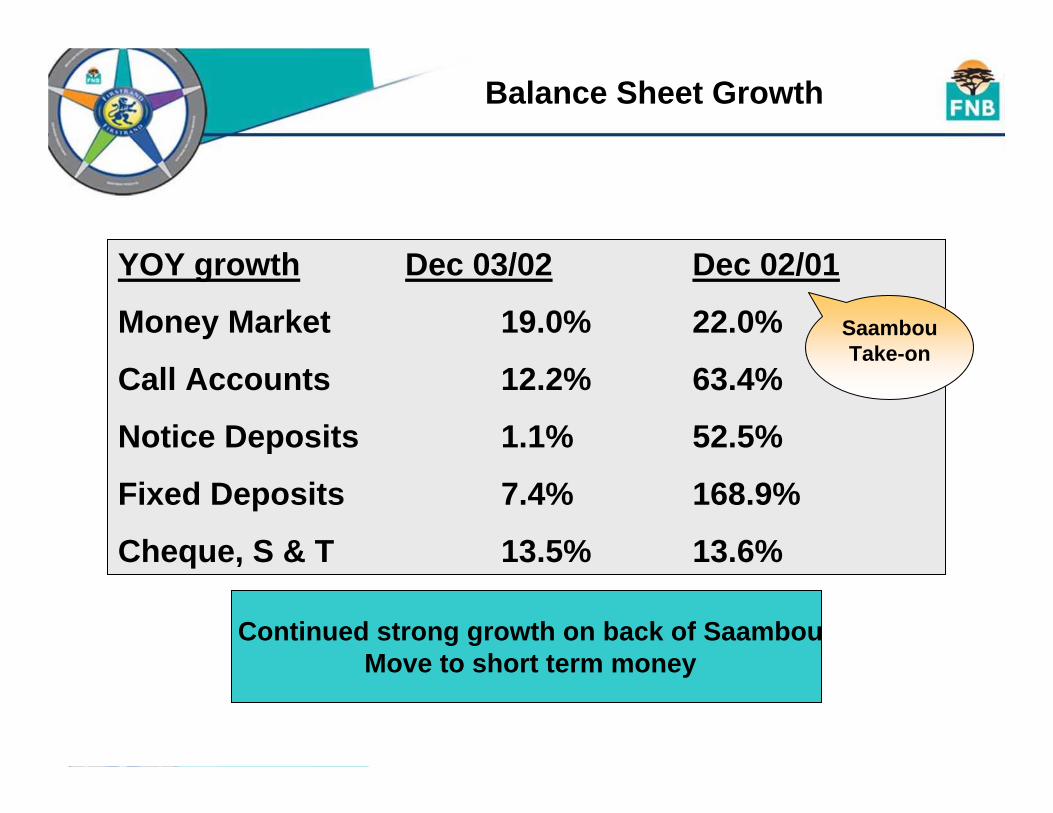
YOY growth Dec 03/02 Dec 02/01
Money Market 19.0% 22.0%
Call Accounts 12.2% 63.4%
Notice Deposits 1.1% 52.5%
Fixed Deposits 7.4% 168.9%
Cheque, S & T 13.5% 13.6%
SaambouTake-on
Continued strong growth on back of SaambouMove to short term money
Balance Sheet Growth

Applied intellectual capital to the whole book –manage interest rates on a highly skilled basis
Apply same techniques on a product basis to actively manage margin
Managing Interest Rate Risk & Pricing

Positioned for growth
Development of new markets through product innovation
Focus on customer convenience & efficiencies
Conclusion

FNB Insurance (Bancassurance)
Schoeman Rudman

What is FNB Insurance
Focus
FNB Insurance Brand
Utilisation of existing assets
More than Bancassurance – Total Collaboration
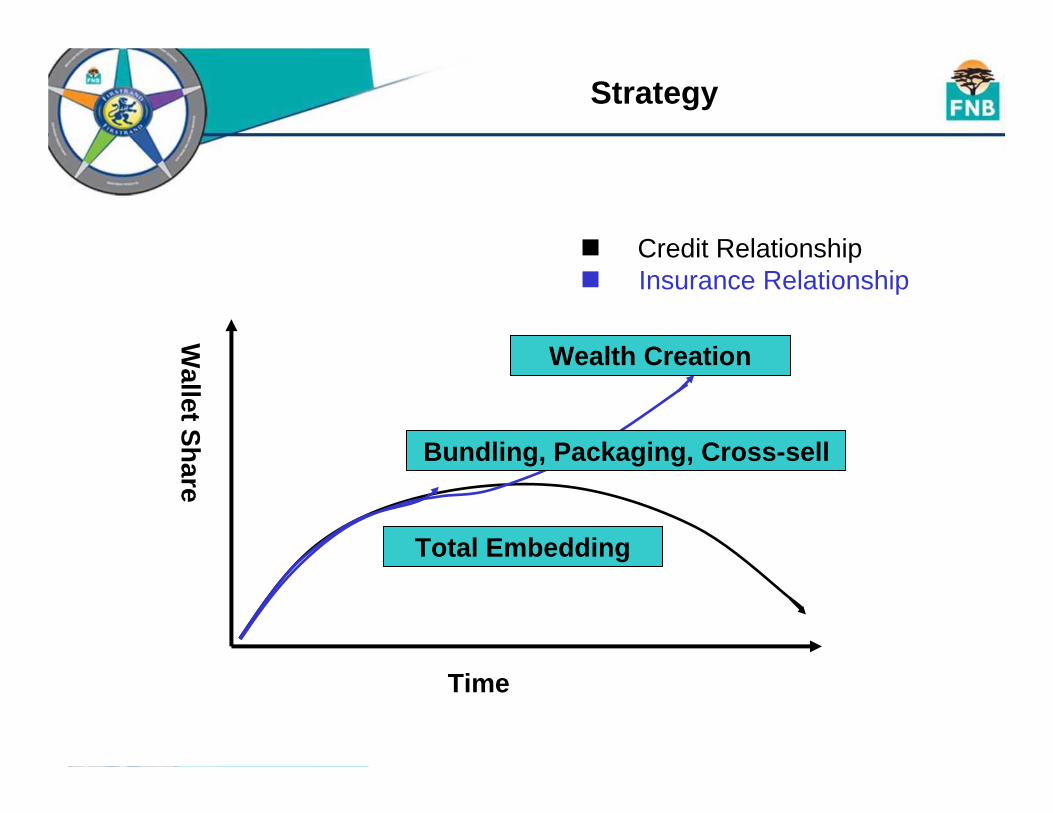
Time
Wallet Share
Credit RelationshipInsurance Relationship
Total Embedding
Bundling, Packaging, Cross-sell
Wealth Creation
Strategy

0
100000
200000
300000
400000
500000
600000
700000
800000
2001Q2
2001Q3
2001Q4
2002Q1
2002Q2
2002Q3
2002Q4
2003Q1
2003Q2
2003Q3
2003Q4
2004Q1
2004Q2
Scope & Build
Stem Leakage &Achieve Synergy
Bundle & Cross Sell
Embedment &Acquisition
Number of Active Policies
Strategy : Customer Base Growth

Branch Network Sales
Insurance Advisors
African Subsidiaries
Positioned for Growth

Retail income from insurance operations up 58% year-on-year
428
33
42
46
160
62
85June 03
58%267169Total
-6%1718FNB Consultants
22%2218FNB Life
n/a35-HomeLoans
34%10075WesBank
39%2518First Link
70%6840OUTsurance% ∆ HY/HYDec 03Dec 02R’m
Collaboration

We are doing well, but….
The potential is huge !
Lessons Learnt

LoansDave Dantu

We are the originator of non-asset backed loan products, within FNB and chosen
market segments!
Business
Agricultural
SME / BEE
Commercial
Mass
SmartSpend
Smart Housing Plan
Middle
CashPower
Student Loans
Positioning

Strategy
And
Branch NetworkFNB
WesBankFulfillmentAnd
Delivery
Strategy Support
THE LOANS CENTRETHE LOANS CENTRE
Collaboration at its Best!!

Consolidation
• Premises• Staff• Budgets• Financials• Vision/ Mission• Strategic
Business Plan• Systems
Product Focus
• Develop Value Propositions
• Structure• Pricing Models• Renegotiate
contracts• AC133• Flight Plan• Change Mngt
Process• MEI• Branding• Product
development
Segment Focus
• Development of TLC
• Cross-sell• Take on Rural• Develop SME
strategy• Develop Agric
strategy• Develop Micro
Loan strategy• Implement
Segment focus• Develop Channel
focus
Growth• Launch Micro
Loans strategy • Focus on
Retention Strategy
• Cross-Sell• Book Acquisition• Implement JV
strategy (i.e. Lekana & Momentum)
• Launch SME strategy
• Launch Agric strategy
November 2002 February 2003 November 2003 July 2004
Phase 1 Phase 2 Phase 3 Phase 4
Flight Plan Process

Return to profitability of FNB Instalment Loans from a prior loss of R104m
Micro LoansR400m book sizeNPLs down to 8,5% from 28%
Non-mortgage loans bookR344m book sizeNPLs down to 0.5% from 9%
3%
FNB Loans Share of Retail Cluster Advances
LoansKey Highlights … Dec ‘03

Market Share
Agricultural Loans - Market Share
R -
R 10.0
R 20.0
R 30.0
R 40.0
Total Market R 31.0 Total Banks R 13.8 FNB R 4.6
Total Market Total Banks FNB
Source: Shared Peer Information
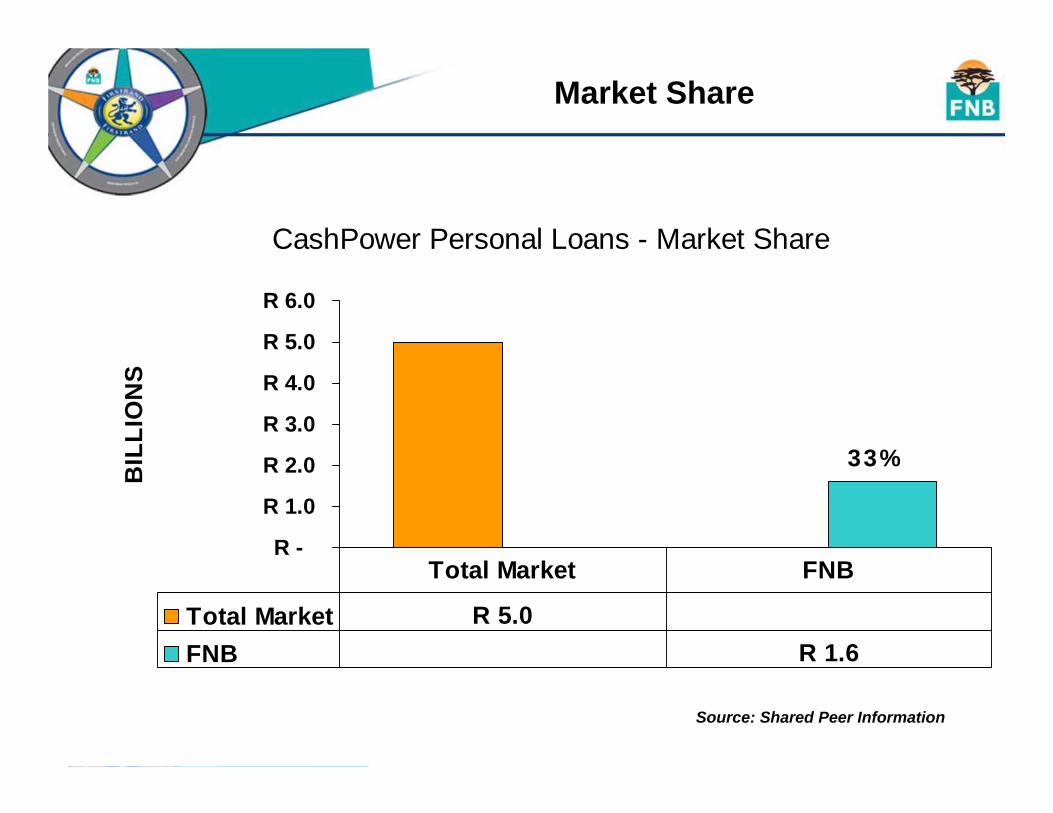
CashPower Personal Loans - Market Share
R -
R 1.0
R 2.0
R 3.0
R 4.0
R 5.0
R 6.0
BIL
LIO
NS
Total Market R 5.0 FNB R 1.6
Total Market FNB
33%
Market Share
Source: Shared Peer Information

Production/Rand Value
-1000
100200300400500600700
2003 2004 2005
Thou
sand
s
CashPowerBusiness LoansSmartSpendStudent LoansSmart Housing PlanAgriSME
Anticipated Growth

Strategic Focus Areas
Partnership opportunities
Cross-sell initiatives
Formalise Vanilla and Structured loan TLC structures
Single loan acquisition system
Improved efficiencies
Growth Opportunities
ORGANIC
FNB Branches sales drive.
Direct marketing including the pre-approval of customer base for the Middle and Mass markets.
Ongoing improvement in scorecards
Introduce an additional channel for the acquiring and fulfillment of personal loans – The ATM.

Greenfields
FNB Enterprise Solutions – well placed with risk sharing public partnerships and a world class, world first, AfterCare Programme – In support of the SME and BEE market
The Mass Market Drive
The aforementioned initiatives will underpin our Financial Charter drive helping us to achieve the required targets by June 2008
Select Acquisition

EXPO TOUR&
LUNCH

Service NetworkPeet van der Walt

Agenda
Service Network – Peet van der Walt
Branch Banking – Zweli Manyathi
Banking Operations – Leonie van Tonder
eDelivery – Roland le Sueur
Self Service Channel – Michael Arnold

The Custodian of all FNB Relationships
Through multiple channels, we strive to consistently deliver superior customer
experiences. We aim to get, keep and grow all FNB customer relationships.
What is the Service Network ?

People
Efficiencies
Sales
Innovation
Investments & Growth
Key Themes

VUKAProduct trainingService culture – No 1 since inception of SAS IndexTM
Improved productivityRecognition / incentivesLeadership developmentLearnerships o Bachelor in Management Leadership Programme:
• First intake - March 2003: 40 learners • Second intake – March 2004: 26 learners, 10 people with
disabilities• International Exchange Programme
o Letsema Learnership 2004• 1 year project• 200 learners, 10 people with disabilities
People

Branch / Back office restructure (no IT re-engineering)
Further centralization of branch admin
Sales efficiencies
Productivity improvement in all channels
Efficiencies

Integration of channels
Sales conversion ratio
Relationship management teams
Group schemes
Personal relationship banking
Sales

Culture
Innovation Units
Continuous Innovation
Innovation

Imaging ProjectATM software Increased Internet Banking capacity Branch automation Refurbishment of branchesRelocation and expansion of branchesATM Network expansionContact CentreDirect ChannelCustomer Experience project
Investments
Investments self-funded within financial years by collective efficiencies

5.5 million customers
223 000 Internet bankers
640 branches
2, 965 ATMso 2068 ATMs o 849 Mini-ATMs o 48 BOB Cats
Key Statistics(As at Dec ’03)
-
1,000
2,000
3,000
4,000
5,000
6,000
Dec 02 Dec 03 Dec 02 Dec 03
000'
s
01,0002,0003,0004,0005,0006,0007,0008,0009,00010,000
R M
illio
ns
Volumes Cash Value
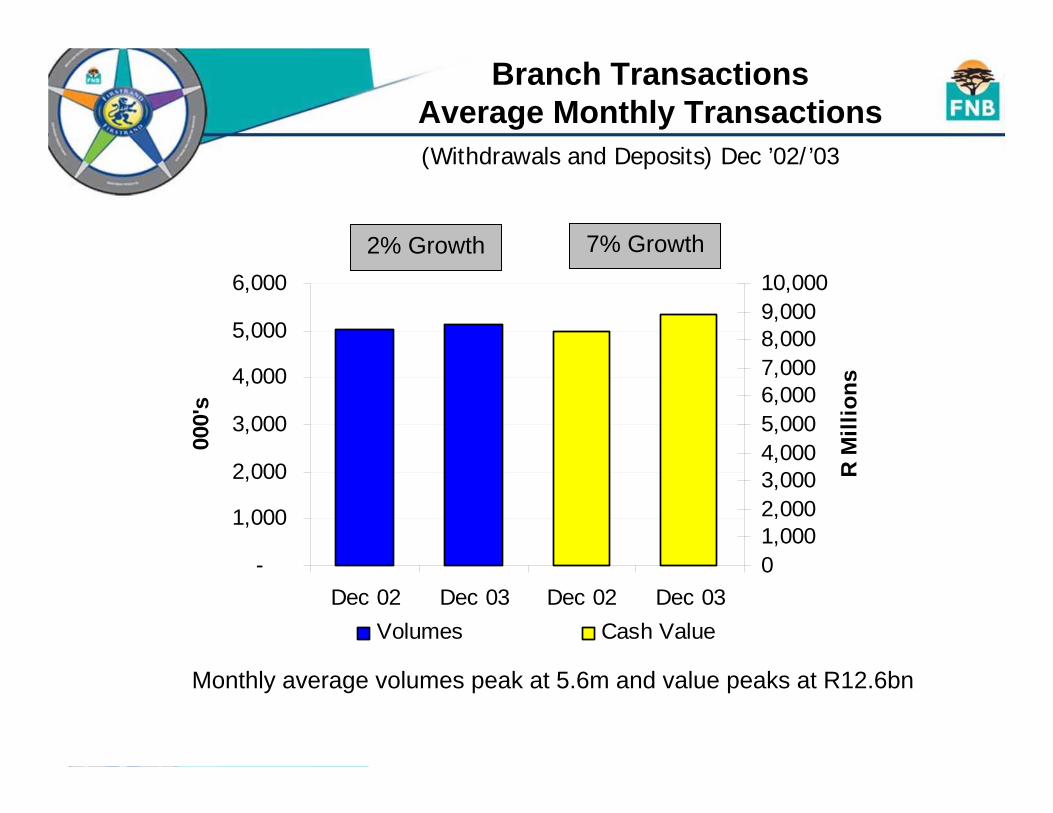
2% Growth 7% Growth
Monthly average volumes peak at 5.6m and value peaks at R12.6bn
Branch TransactionsAverage Monthly Transactions (Withdrawals and Deposits) Dec ’02/’03

FNB Internet BankingAverage Monthly Transactions
-
200
400
600
800
1,000
1,200
1,400
Dec 02 Dec 03 Dec 02 Dec 03
000'
s
01,0002,0003,0004,0005,0006,0007,0008,000
R M
illio
ns
Volumes Value
85% Growth 74% Growth
Monthly average volumes peak at 1.3m and value peaks at R7.2bn
(Payments & Transfers) Dec ’02/’03

ATMs AverageMonthly transactions
-2,0004,0006,0008,000
10,00012,00014,00016,00018,000
Dec 02 Dec 03 Dec 02 Dec 03
000'
s
Total Transactions Withdrawals
3% Growth 9% Growth
Monthly average volumes peak at 15.9m
(Total transactions ’02/’03)

Branch BankingZweli Manyathi

Our Journey
February: First Express, First Commerce, Personal Bank and FNB Rural Branch migrationJune: Head Office consolidation
November: Back Office centralisation and restructure of FNB Metro
2000
VUKA extensionFocus on local marketsMetro & Rural network mergerBalance sheet moved to appropriate product houses (i.e.HomeLoans)
2004
SAS IndexTM 2003 – FNB rated number 1 for Customer SatisfactionIncreased focus on sales (sales measurement)
March: Metro & Rural Head Office merger2003
VUKA introductionSAS IndexTM 2001 – FNB rated number 1 for Customer Satisfaction
2001
SAAMBOU take-onIntroduction of sales culture.
• `
2002

Vuka bedrock of our culture, Rural roll-out initiated
Similar (but not the same) structures in all
provinces
New measurements
Implement franchise model
What is new in Branch Banking?

Efficiencieso Capacity management o Franchise approach
Peopleo Creation of capacity
Saleso Sales effectiveness
Focus on the customero Consistent customer experience across outletso Customer Complaints Management Systemo Customer Portfolio Management Systemo Taking banking to under-serviced areas
Key Themes going Forward

Challenges
Compliance
o KYC
o FAIS

Banking OperationsLeonie van Tonder
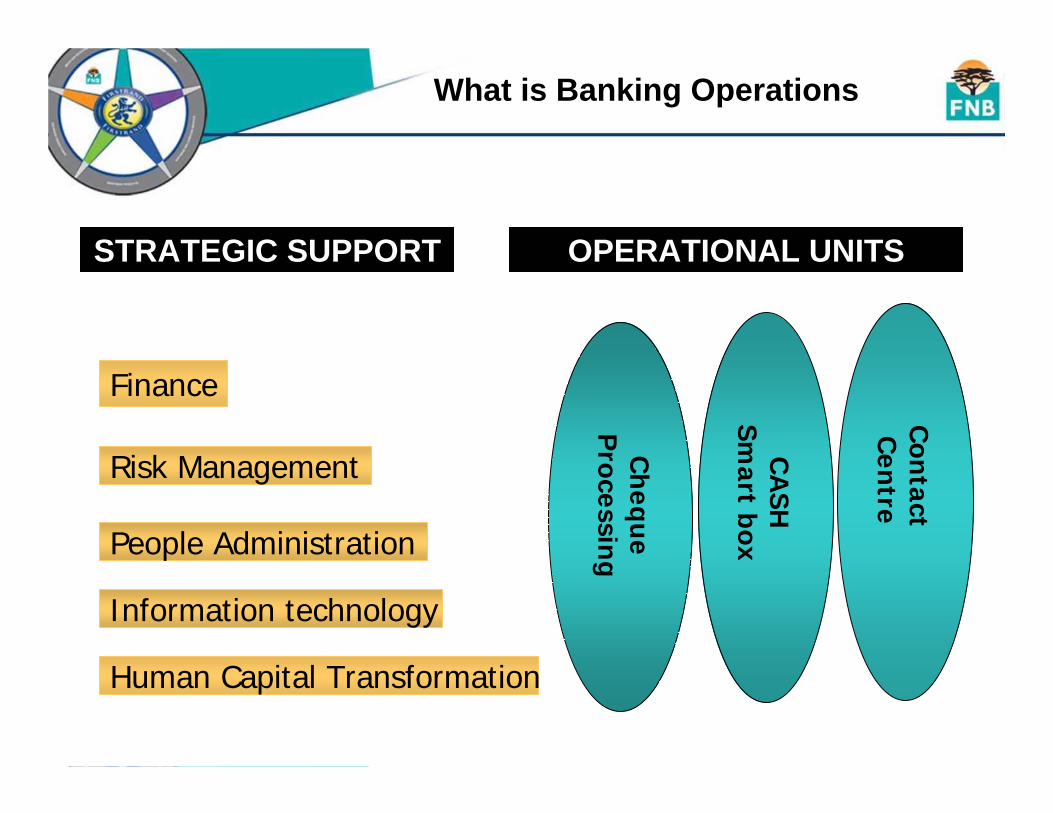
Finance
People Administration
Human Capital Transformation
Information technology
Risk Management
OPERATIONAL UNITSSTRATEGIC SUPPORT
Ch
eque
Processin
g
CA
SHSm
art box
Con
tact C
entre
What is Banking Operations

Focus
Historical
CentralisationEfficiency/ProductivityFraud PreventionCost controlCash Holding Management
Future
Image roll outContact Centreefficiencies

Productivity
Project Orchid target introduced in 2000 – a 300% increase
An additional 216% increase in productivity after the introduction of Project Orchid
0
50
100
150
200
250
300
350
Productivity 100 238 243 262 316
% Increase 138% 143% 162% 216%
Orchid Target Jun-01 Jun-02 Jun-03 Dec-03

Reduction in Overnight Cash Holdings
56 % Improvement on 2001
AVERAGE CASH TURNOVER DAYS
-
1.0
2.0
3.0
4.0
Days 3.4 2.7 1.9 1.5
Jun-01 Jun-02 Jun-03 Dec-03

Cheque Processing
41 % Improvement on 2000
COST PER ITEM - DAY 1
R -
R 0.20
R 0.40
R 0.60
R 0.80
R 1.00
R 1.20
Cost per Cheque R 1.01 R 0.75 R 0.65 R 0.58 R 0.60
Jun-00 Jun-01 Jun-02 Jun-03 Dec-03

79 % Improvement on 2000
COST PER CHEQUE - DAY 2
R -
R 1.00
R 2.00
R 3.00
R 4.00
R 5.00
Cost per Cheque R 4.50 R 1.81 R 1.01 R 1.04 R 0.95
Jun-00 Jun-01 Jun-02 Jun-03 Dec-03
Cheque Processing

Fraud
-
20
40
60
80
100
120
Jun-02 Jun-03 Dec-03
Fraud Prevented Fraud Incurred
78% Reduction in fraud incurred
50% Decrease in fraud attempts

Fraud Prevention Measures
Increased staff awareness
Introduction of new cheques with enhanced security features
Fraud prevention software
Participation in Vow of Vigilance (R1m annual draw)
Fraud

Future Focus
Contact CentreIntegrated sales and services platformLanguage options in Contact CentresVoice recognition
Cheque ProcessingCheque ImagingCentralised Statement renditionAutomated Signature Verification

TEA

eDeliveryRoland le Sueur

Internet banking (excluding corporates)
Mobile/cellphone banking
Banking by Telephone Products
Online sales
www.fnb.co.za
What Do We Do?

What happened?
Steps taken to address problem
Current status
Internet Banking IncidentOctober 2003
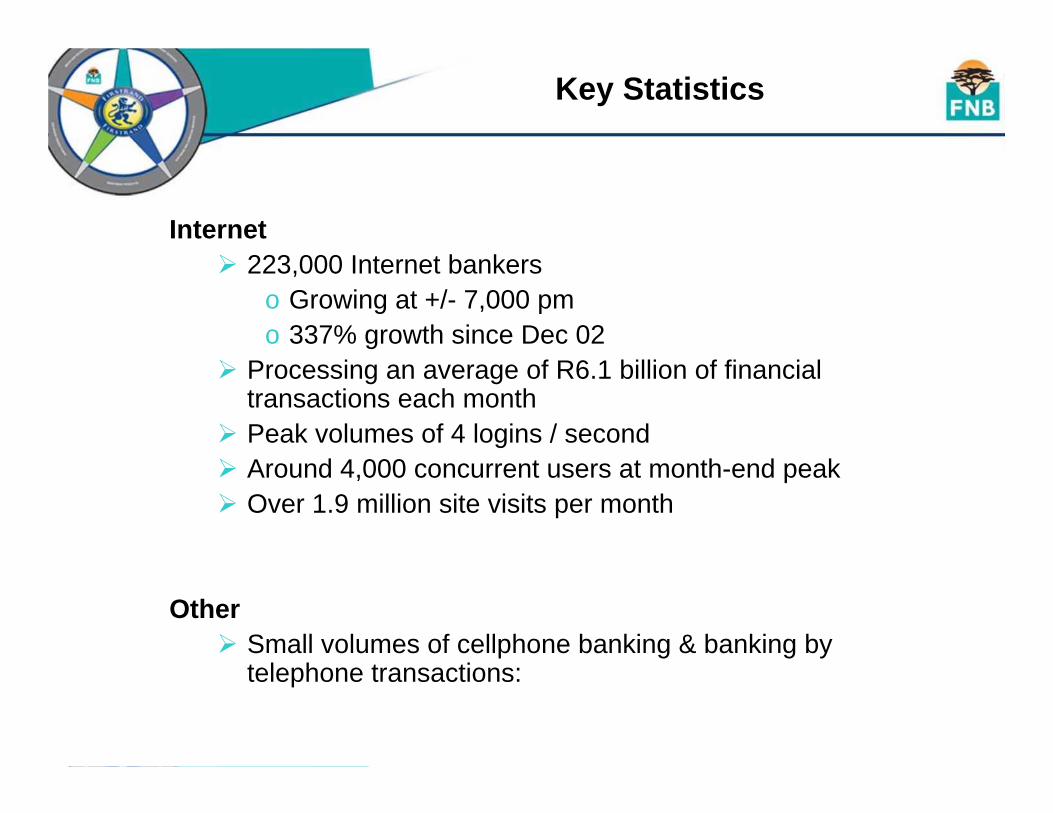
Internet223,000 Internet bankers
o Growing at +/- 7,000 pmo 337% growth since Dec 02
Processing an average of R6.1 billion of financial transactions each monthPeak volumes of 4 logins / secondAround 4,000 concurrent users at month-end peakOver 1.9 million site visits per month
OtherSmall volumes of cellphone banking & banking by telephone transactions:
Key Statistics

No monthly subscription fee
Very high security with DigiTag & InContact
Money back guarantee for fraud
FOREX online
eBucks rewards for transactions.
Very good response times o Industry average - 2.01 seconds / transactiono FNB’s response time - 1.06 seconds / transaction
All accounts available in one place.
Simple, immediate set-up of payment recipients
Our (competitive) Strengths

Internet Bankingo Increased penetration, currently 21% of all cheque
account base o Internet Kiosks in branches and ISP deals
321Contacto Pre-paid top-ups
Online sales opportunities
Future Growth
Self Service ChannelMike Arnold
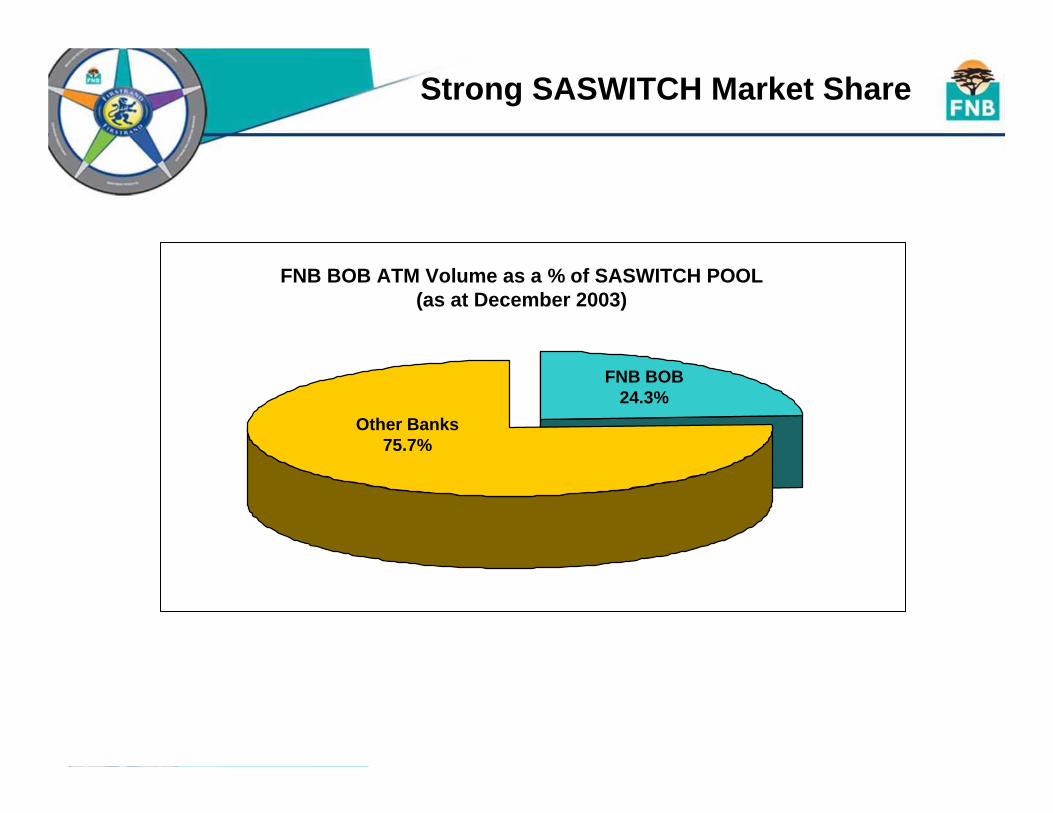
Strong SASWITCH Market Share
FNB BOB ATM Volume as a % of SASWITCH POOL(as at December 2003)
Other Banks75.7%
FNB BOB24.3%

FNB on BOB Transaction Growth
-4%
-2%
0%
2%
4%
6%
8%
10%
12%
14%
Jul Aug Sep Oct Nov Dec
GROWTH OF FNB ON BOB TRANSACTION VOLUMES(Jul-Dec 2002 vs Jul-Dec 2003)
% C
hang
e in
Tra
nsac
tion
Vol
ume

Strong Availability Performance(1 of 2)
SASWITCH TERMINAL AVAILABILITY (Dec 2003 – April 2004)
98.00%
98.25%
98.50%
98.75%
99.00%
99.25%
99.50%
99.75%
100.00%
Dec-03 Jan-04 Feb-04 Mar-04 Apr-04
ABSA - TermSTD - TermFNB - TermNED - Term
% A
vaila
bilit
y (2
4-H
our)

98.00%
98.25%
98.50%
98.75%
99.00%
99.25%
99.50%
99.75%
100.00%
Dec-03 Jan-04 Feb-04 Mar-04 Apr-04
ABSA - AuthSTD - AuthFNB - AuthNED - Auth
Strong Availability Performance(2 of 2)
SASWITCH AUTHORISOR AVAILABILITY(Dec 2003- March 2004)
Three outages caused by problems with the
mainframe disk. These have been resolved by the Japanese vendors.
Network problems on the mainframe and a cable fault
during a scheduled maintenance slot.
% A
vaila
bilit
y (2
4-H
our)

BOB Device Growth
Number of BOB Devices(July 2003 – Dec 2003)
Num
ber o
f Dev
ices
Dep
loye
d
0
500
1000
1500
2000
2500
3000
Jul Aug Sep Oct Nov Dec Jan Feb Mar April May June Jul Aug Sep Oct Nov Dec
Number of BOBMini-ATMs
Number of BOB'sand BOBCATS

BOB Mini-ATM
Allows ATM expansion into under represented areas.
Low volume business model enables extended reach.
Overcomes lack of infrastructure in rural areas.
Manages logistical and security issues.
Trades on the trusted BOB Brand.
Boosts local economies by recycling cash.

BOB Mini-ATM Transaction Volumes(July 2003 – March 2004)
BOB Mini-ATMs Create New Transactions
Tran
sact
ion
Vol
ume
(‘000
’s)
0
100
200
300
400
500
Jul Aug Sep Oct Nov Dec Jan Feb Mar Apr May Jun

Strong Pre-Paid Growth
Pre-Paid Transaction Volumes(July 2003- Dec 2003)
Tran
sact
ion
Vol
umes
0
20,000
40,000
60,000
80,000
100,000
120,000
140,000
July Aug Sept Oct Nov Dec

New Payment MethodNew Payment Methodo Concept proved with Intercape, Luxliner and Translux
Traffic Fine PaymentsTraffic Fine Payments
Transaction Innovation

Supporting Proudly Supporting Proudly South African: almost South African: almost
300 000 voter 300 000 voter registration registration
transactions processed!transactions processed!
IEC Voter Registration

Expansion of the Network
New Transactions
EMV: Hardware and Software Upgrade
Way Forward
TechnologyYatin Narsai
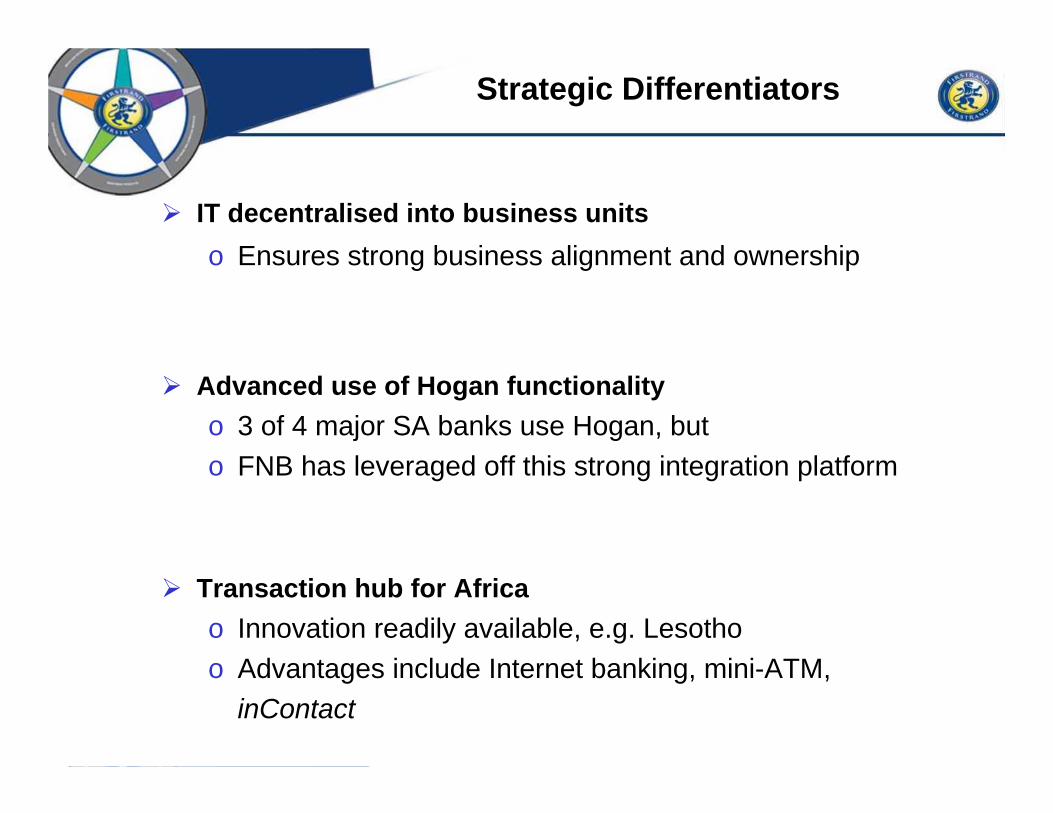
Strategic Differentiators
IT decentralised into business unitso Ensures strong business alignment and ownership
Advanced use of Hogan functionalityo 3 of 4 major SA banks use Hogan, buto FNB has leveraged off this strong integration platform
Transaction hub for Africao Innovation readily available, e.g. Lesothoo Advantages include Internet banking, mini-ATM,
inContact

Strategic Differentiators
Bank-wide implementation of middleware (VODS)o Reduced time to market on new products and channelso Multi-channel enablement
Ability to execute rapidlyo Multiple software releases per month versus per quarter
A ‘business’ IT cultureo Technology is a core competencyo Success measured through business

Business Value Delivered
inContact (2001)o Over 800,000 subscriberso Vital customer datao Fraud management and reduced
balance enquiries
Mini-ATMs (2001)o Over 1,000 installedo Un/underbanked market is serviced
Saambou/NBS/Swabou take-ons(2002-2003)o Over 600,000 new customer
accounts migrated to FNB systemso 2-3 months project

Business Value Delivered
Meaningful, A4 statements across all products
o Enhanced customer communication
Linear scalingo Incremental growth achieved with marginal
capacity increase
o Large cost advantage
Capacity and customer transaction growth
Jan-01 Jul-01 Jan-02 Jul-02 Jan-03 Jul-03 Jan-04
MIPS
Customer generated transactions

Recent & Planned Initiatives
DigiTag securityComprehensive sales architectureo Improved turnaround time
o Detailed measurement ability
Advanced credit managemento Account level approvals within seconds
o Transaction level credit management
FNB One Accounto True One Account (no sweeping)
321 inContactCheque Processing … a re-engineered approacho Imaging of cheques and signatures
Home loans back-office automation

IT Investment
How is IT investmentmeasured?
Business Value
? While Gartner recommends a SOA
for mainframe applications in future, FNB achieved this 3 years ago
A leading management consultancy
has shown FNB IT cost to revenue ratio to be better than world average but marginally higher than leading world banks
A leading system integrator
acknowledged FNB’s architecture to be world best practice

Willem Roos

What do we do?
• Personal OUTsurance– your car & house– direct– telephonically
• Direct response advertising inbound calls• Outbound calls FirstRand Bank client base
• Business OUTsurance• Homeowners OUTsurance
– FNB HomeLoans– RMB Private Bank
• Cell captive arrangement for WesBank– credit shortfall and motor warranty products sold with vehicle
finance

What makes us different?
• Actuarial rating
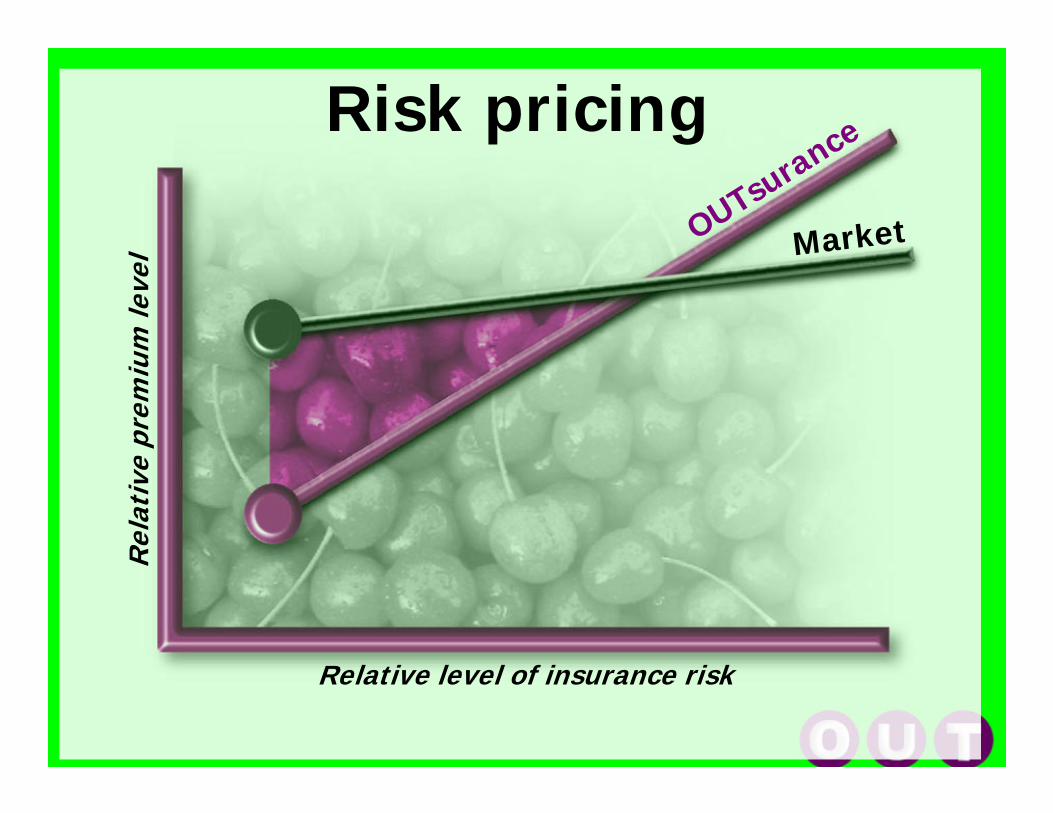
Risk pricing
Relative level of insurance risk
Rel
ativ
e pr
emiu
m le
vel MarketOUTsurance

What makes us different?
• Actuarial rating• Consumer focussed
– AWESOME service– risk management by product design
• Direct– enables execution of fundamentals– lower acquisition costs
• Claims management• Technology

Premium income
63.7
280.9
425.4
590.3
1007.6
670.4
100
200
300
400
500
600
700
800
900
1000
30 June 1999 30 June 2000 30 June 2001 30 June 2002 30 June 2003 6 months toDecember 2003
R m
illio
n

Headline Earnings
(28.8)
12.1
23.3
41.5
102.7
91.2
(40)
(20)
20
40
60
80
100
120
30 June 2000 30 June 2001 30 June 2002 30 June 2003 6 months to December2003
R m
illio
n
30 June 1999

OUTstanding Service!
0.0
1.0
2.0
3.0
4.0
5.0
6.0
7.0
2003-Q1 2003-Q2 2003-Q3 2003-Q4 2004-Q1
Ave
rage
cla
ims
sett
lem
ent
in d
ays
70.0%
75.0%
80.0%
85.0%
90.0%
95.0%
100.0%
Per
cen
tage
of
call
answ
ered
wit
hin
20
sec
onds
Buildings Vehicle Accidents Service Level
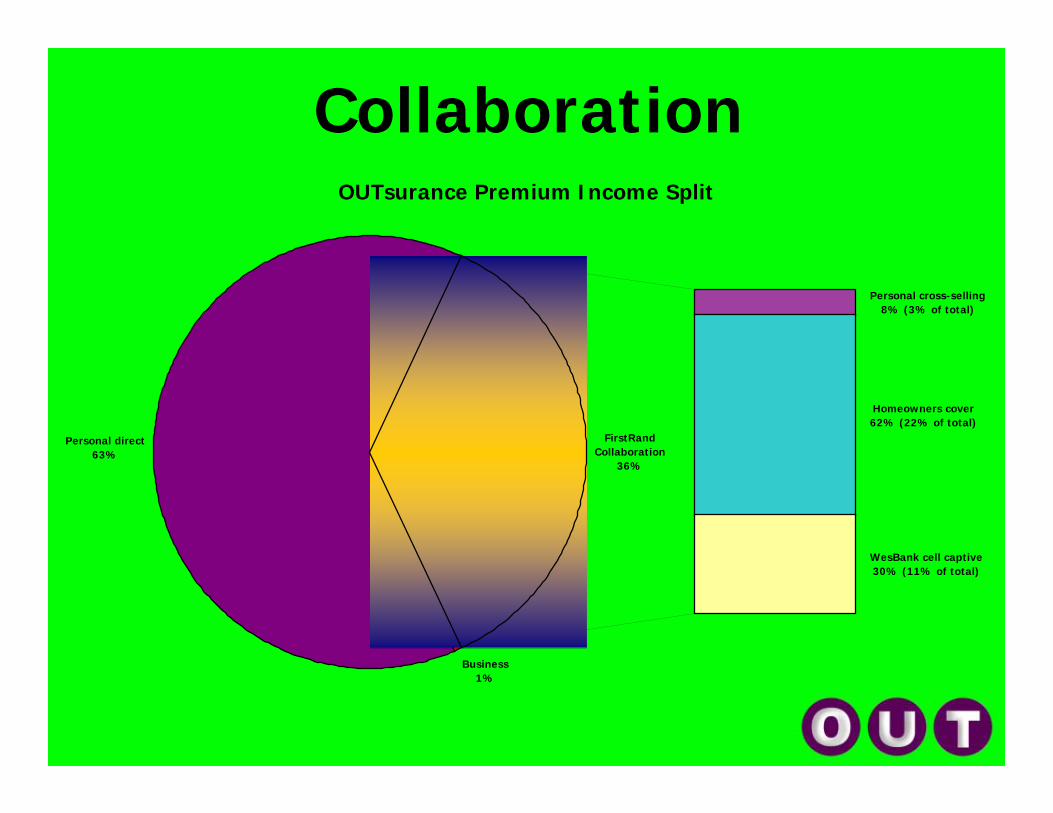
CollaborationOUTsurance Premium Income Split
Business1%
Personal direct63%
WesBank cell captive30% (11% of total)
Homeowners cover62% (22% of total)
Personal cross-selling8% (3% of total)
FirstRandCollaboration
36%

Future growth
• Still strong growth in Personal OUTsurance– expanding into other market segments– innovative products– greater cross-selling into FirstRand
• Business OUTsurance– gaining traction– FirstRand cross-selling

Financial CharterWendy Lucas-Bull

The Charter Scorecard
36.Corporate Social Investment
100TOTAL SCORE
148
5. Ownership & Control• Ownership• Control – board & executive
517
4. Empowerment Financing• BEE transactions• Targeted Investment
183. Access to Financial Services•Transactional Banking•Origination (SME, Housing, Agriculture)
152. Procurement & Enterprise Development
155
1. Human Resource Development• Employment Equity• Skills Development
MaxComponent
We are signatories to the Charter at the FirstRand Limited level
Retail Cluster is key to achieving 5 of the 6 Charter compliance areas

Not about complianceIt’s how we do businessBusiness-case driven within a framework of sustainability
We had already begun
Our Strategic Approach
Socio-economic Growth (Sustainable Growth)
Shareholder Value(Sustainable Profits)
Sustainability
Charter

Human Resource Development
Strategic partnership with CIDA in 2001
266 learners in Learnerships across the business
Well positioned to achieve the 1.5% training spend target
Integrated HR Database and Model as key enablers
VUKA

Retail EE Score 31 March 2004
30%21%Middle Management (250-450k)
4%4%Black Women as % of SM
159.89Score
1521%Black Women as % of JM
40-50%34%Junior Management (150-250k)
10%9%Black Women as % of MM
20-25%14%Senior Management (>450k)
Target 2008RETAILBlack as a % of:

Procurement
BuyIt
Empowerdex Accreditation Process
Facilitating BEE with our stakeholders
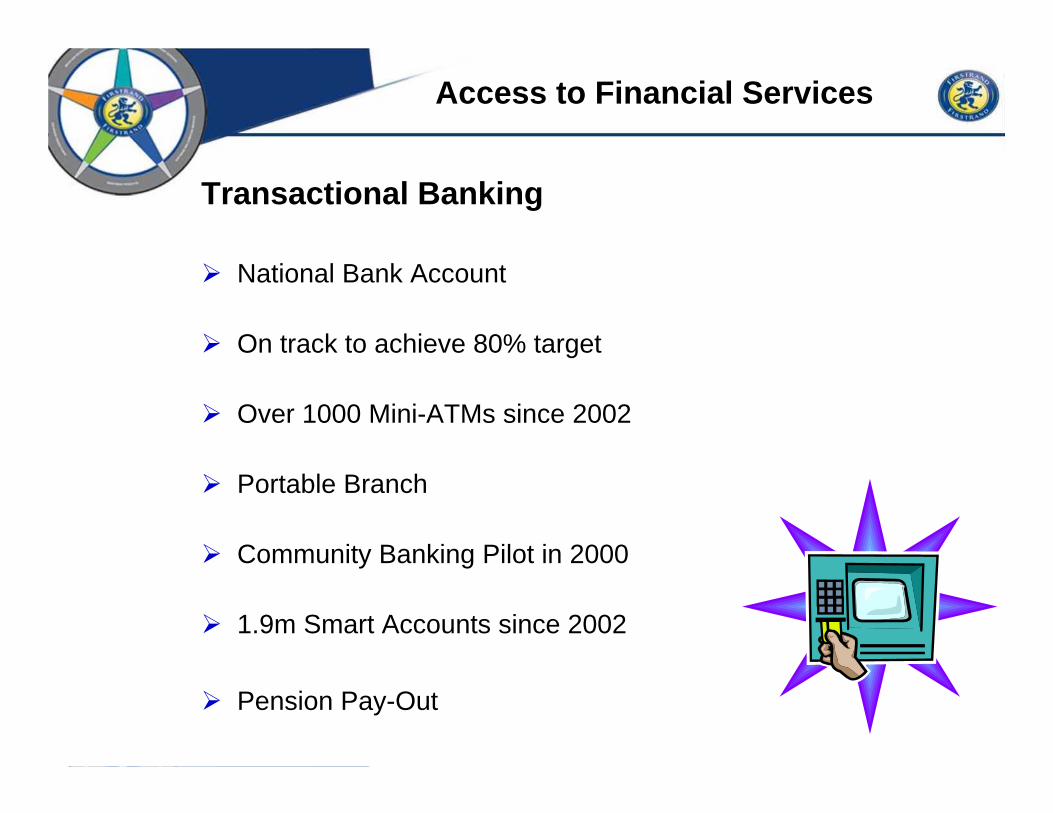
Access to Financial Services
Transactional Banking
National Bank Account
On track to achieve 80% target
Over 1000 Mini-ATMs since 2002
Portable Branch
Community Banking Pilot in 2000
1.9m Smart Accounts since 2002
Pension Pay-Out

Origination of SME Loans
Many alternatives tested
New innovative solution for responsible sustainable lending
Joint Initiative with Umsobomvu Youth Fund (UYF) established 2001
FNB Enterprise Solutions in FNB Loans o Small Business Financing Teamo Joint Enterprise Support Fund with UYF in development
• Aftercare programme
Ongoing and strengthening relationship with Khula Enterprises
Access to Financial Services

Origination of Agriculture Loans
Leverage off our strong track record in this sector
Well positioned to replicate our SME model for emerging agriculture
Specialised risk mitigation alternatives still being tested
Access to Financial Services

Origination of Low Income Housing
Range of products and offeringso Mortgage loano Pension-backed loanso Affordable Housing Model JV with RMB
Access to Financial Services

Empowerment Financing
Joint Fund with UYF
Joint Fund with UYF
Current Funds More in pipeline
Current Funds More in pipeline
Partnerships with black investment
co’s
Partnerships with black investment
co’s
R100,000 – R20mR100,000 – R20m > R20m> R20m > R50m> R50m
Medium Corp MBO/ESOP
R50m
Medium Corp MBO/ESOP
R50m
Listed and Unlisted
Usually vendor supported
Listed and Unlisted
Usually vendor supported
FNB LoansFNB Loans PE DebtPE DebtAsset Finance
Fleet Mgmnt
Asset Finance
Fleet Mgmnt
FNB Retail FNB CorpRMB Structured / Project FinanceWesBank
RMB Private EquitySME’s
EnterpriseSolutions
EnterpriseEnterpriseSolutionsSolutions

Empowerment Financing
SME’s
Joint Fund with UYF
Joint Fund with UYF
R100,000 – R20mR100,000 – R20m > R20m> R20m > R50m> R50m
FNB LoansFNB Loans Asset Finance
Fleet Mgmnt
Asset Finance
Fleet Mgmnt
FNB Retail WesBank
EnterpriseSolutions
EnterpriseEnterpriseSolutionsSolutions
•SA National Taxi Finance - JV with SANTAC0 •Kgwerano Asset Finance – JV with Kgwerano Investment Holdings 1999•InspectaCar•Job Creation Finance
CSI
R48m = 1% - double the target of 0.5% of after tax profit
Leverage our people - Volunteers

Charter = Opportunity
SummationWendy Lucas-Bull

WHAT HAS ALL THIS DELIVERED?

Domestic Retail NPBT % GrowthYear-on-Year (2001 – 2003)
0
500
1000
1500
2000
2500
3000
1 2 3 42001 2002 2003 2004
2 037
2 753 HY / HY = 22%
17%
35%
1 7451 831
R Millions

June1998
June2001
June2003
June2002
“Hands-off”
2004
*Saambou Deposits
*NBS HomeLoans
June1999
June2000
GrowthExternal Focus
New Strategy being
implemented
Get Basics Right
*Saambou Affordable Housing*Saambou Home Loans *Swabou
From an Internal to anExternal Focus…
*NBS Insurance
MetroBanking OperationsCardHomeLoansCredit ManagementTechnologyRuralAfrican SubsCost & Revenue Dynamics
CreditCollections SolutionsFNB LifeDatabasesEmbedded Value
Sharing:
*Saambou Insurance
Load AcquisitionGreen FieldsCollaborationContinuous Improvement (benchmarking)
Good to Great:

Questions