Introduction to Demand-side...
24
Introduction to Demand-side Research Nilusha Kapugama Nilusha Kapugama 19 August 2014 This work was carried out with the aid of a grant from the International Development Research Centre, Canada and the Department for International Development UK..
Transcript of Introduction to Demand-side...
Introduction to Demand-side
Research
Nilusha KapugamaNilusha Kapugama
19 August 2014
This work was carried out with the aid of a grant from the International Development Research Centre, Canada and
the Department for International Development UK..

Who are we and what do we do?
• LIRNEasia mission is
– Catalyzing policy change through research to improve
people’s lives in the emerging Asia Pacific by
facilitating their use of hard and soft infrastructures
through the use of knowledge, information and
technology.technology.
• Research done in multiple sectors: telecom,
agriculture, electricity, disaster management etc
• Engagement/Communicating with stakeholders in
multiple sectors is key for us
2
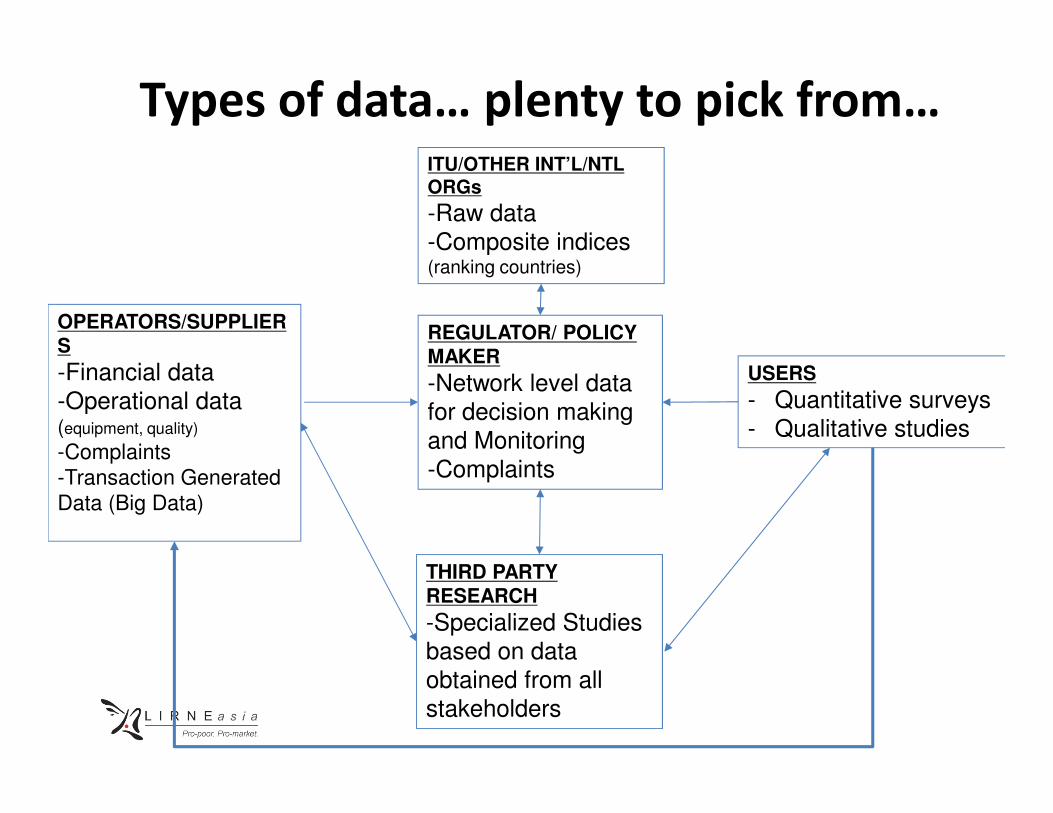
Types of data… plenty to pick from…
OPERATORS/SUPPLIERS
-Financial data
-Operational data
REGULATOR/ POLICY MAKER
-Network level data
for decision making
ITU/OTHER INT’L/NTL ORGs
-Raw data
-Composite indices (ranking countries)
USERS
- Quantitative surveys-Operational data (equipment, quality)
-Complaints
-Transaction Generated
Data (Big Data)
for decision making
and Monitoring
-Complaints
- Quantitative surveys
- Qualitative studies
THIRD PARTY RESEARCH
-Specialized Studies
based on data
obtained from all
stakeholders
What is demand-side research?
• Study of the end users/consumers or analysis
of data from customers or end users
– Quantitative Data
– Qualitative Data– Qualitative Data
– Transaction Generated Data (Big Data)
4
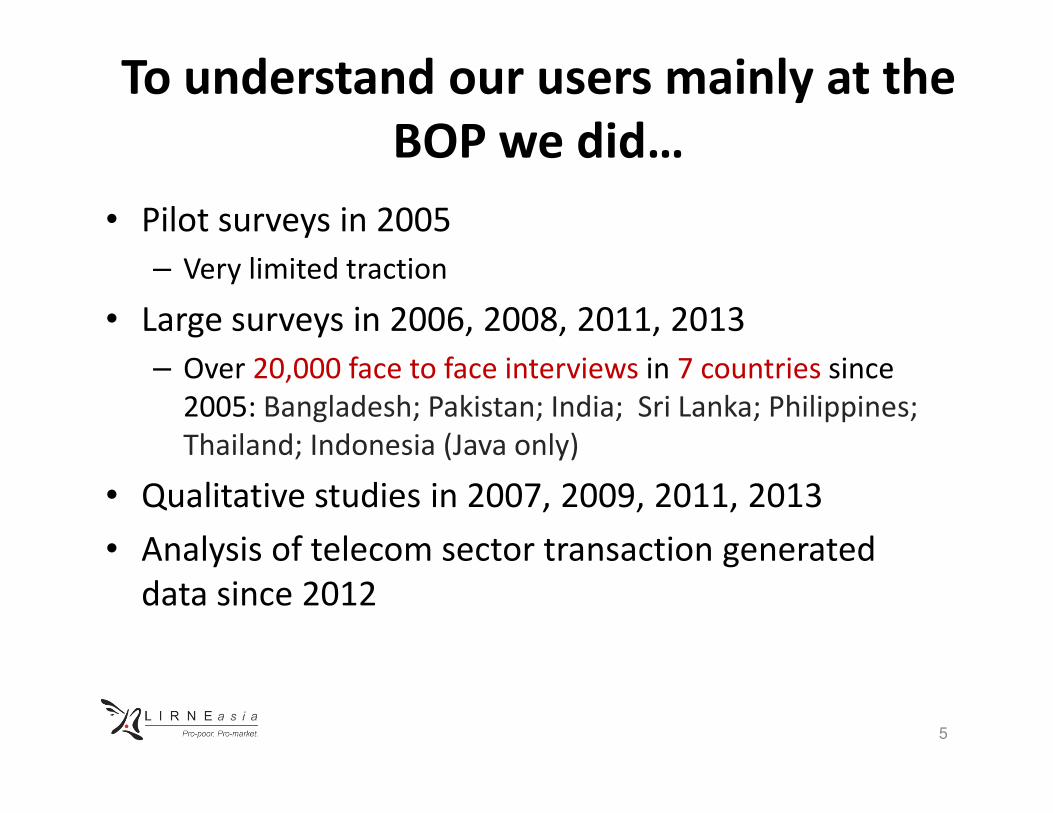
To understand our users mainly at the
BOP we did…
• Pilot surveys in 2005
– Very limited traction
• Large surveys in 2006, 2008, 2011, 2013
– Over 20,000 face to face interviews in 7 countries since
2005: Bangladesh; Pakistan; India; Sri Lanka; Philippines; 2005: Bangladesh; Pakistan; India; Sri Lanka; Philippines;
Thailand; Indonesia (Java only)
• Qualitative studies in 2007, 2009, 2011, 2013
• Analysis of telecom sector transaction generated
data since 2012
5
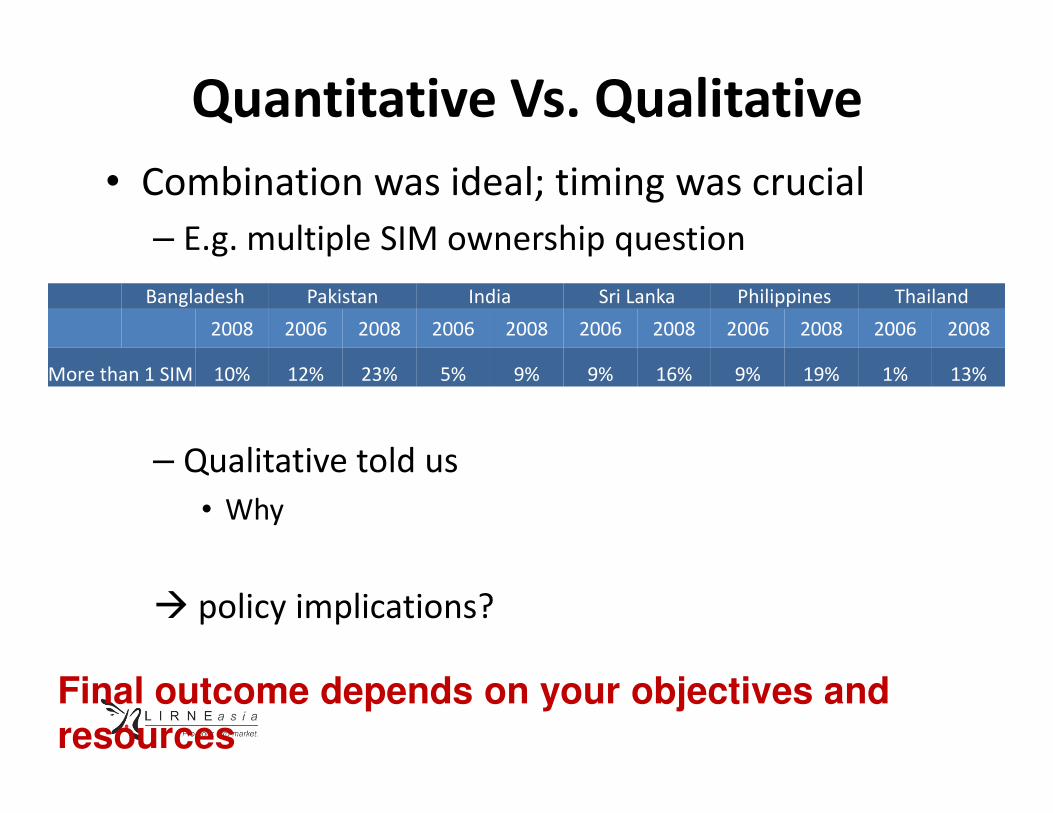
Quantitative Vs. Qualitative
• Combination was ideal; timing was crucial
– E.g. multiple SIM ownership question
Bangladesh Pakistan India Sri Lanka Philippines Thailand
2008 2006 2008 2006 2008 2006 2008 2006 2008 2006 2008
More than 1 SIM 10% 12% 23% 5% 9% 9% 16% 9% 19% 1% 13%
– Qualitative told us
• Why
� policy implications?
Final outcome depends on your objectives and resources

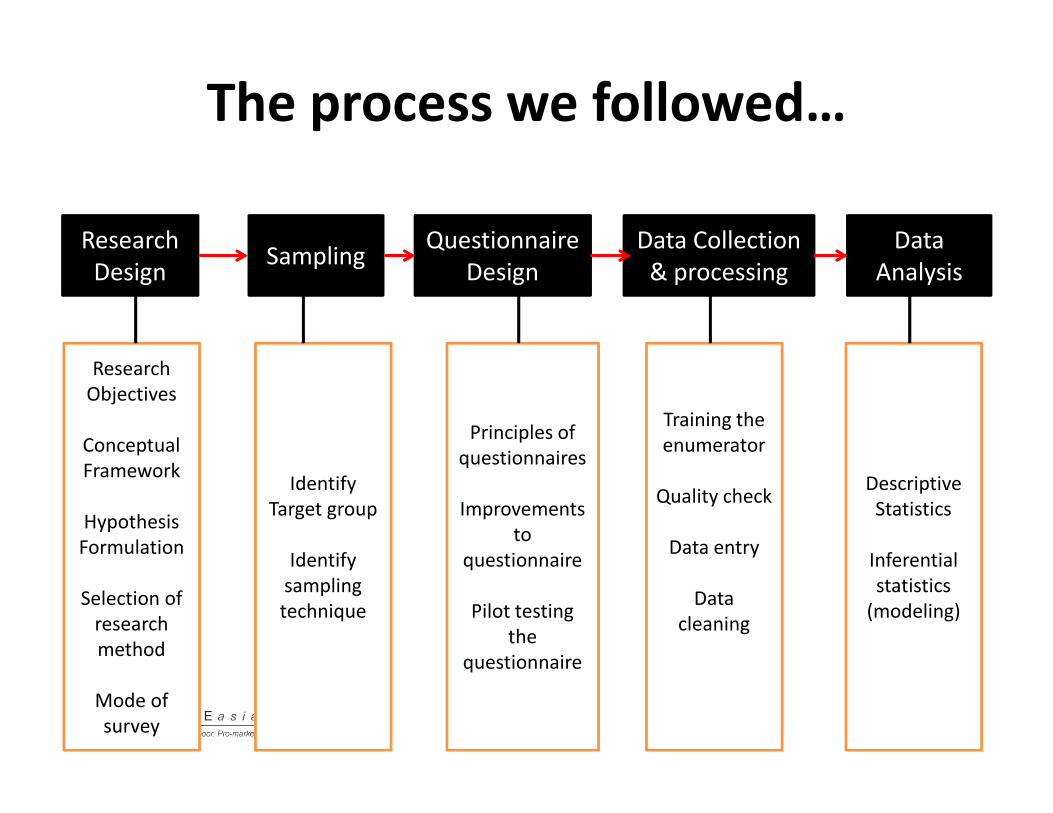
The process we followed…
Research
DesignSampling
Questionnaire
Design
Data Collection
& processing
Data
Analysis
Research
Objectives
Training the
Conceptual
Framework
Hypothesis
Formulation
Selection of
research
method
Mode of
survey
Identify
Target group
Identify
sampling
technique
Principles of
questionnaires
Improvements
to
questionnaire
Pilot testing
the
questionnaire
Training the
enumerator
Quality check
Data entry
Data
cleaning
Descriptive
Statistics
Inferential
statistics
(modeling)
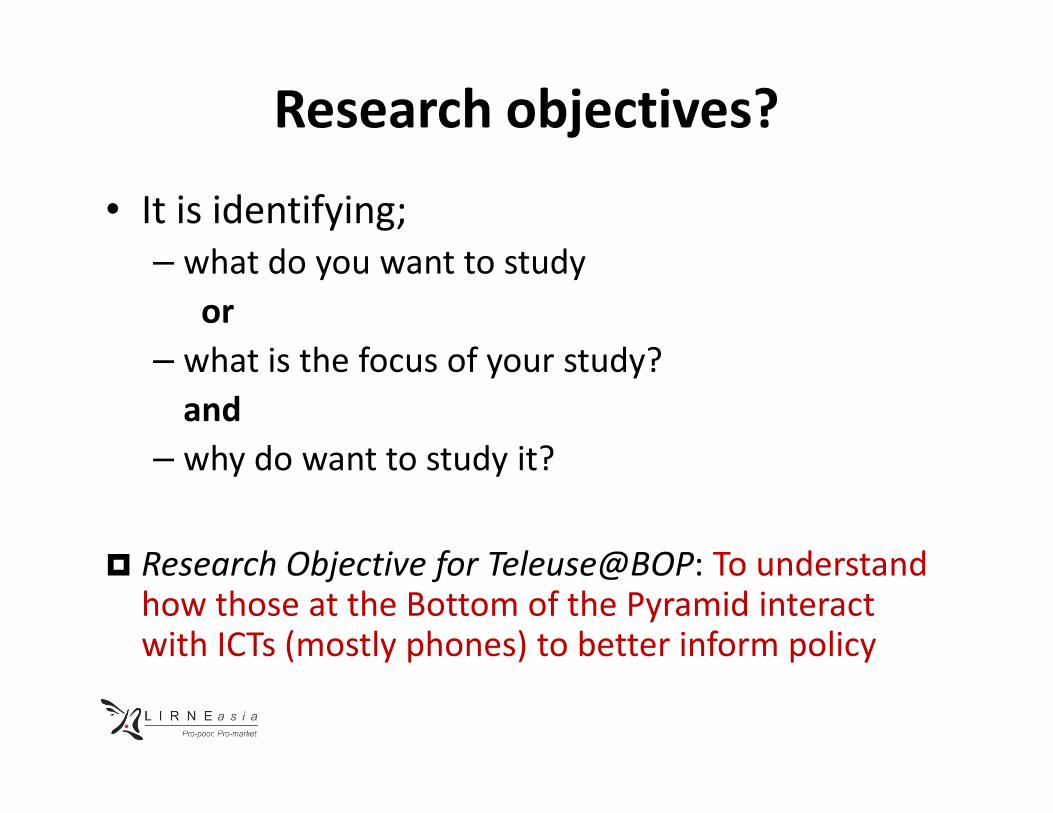
Research objectives?
• It is identifying;
– what do you want to study
or
– what is the focus of your study?
andand
– why do want to study it?
� Research Objective for Teleuse@BOP: To understand how those at the Bottom of the Pyramid interact with ICTs (mostly phones) to better inform policy
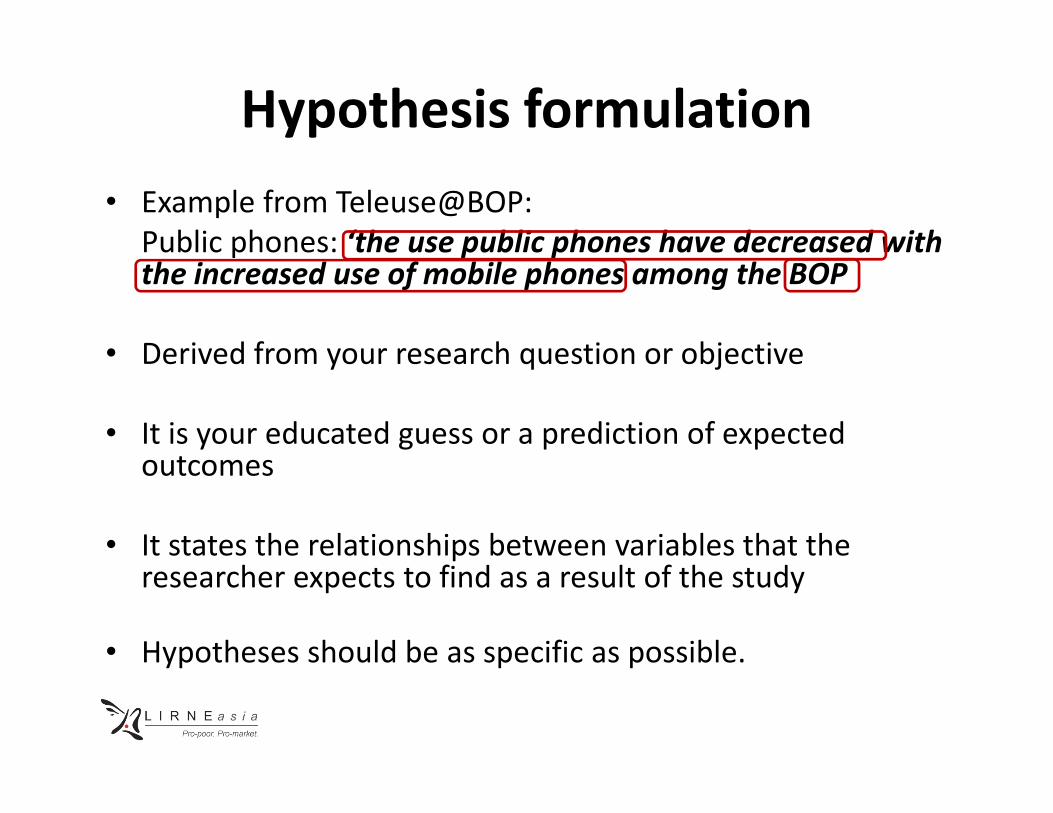
Hypothesis formulation
• Example from Teleuse@BOP:
Public phones: ‘the use public phones have decreased with the increased use of mobile phones among the BOP
• Derived from your research question or objective
• It is your educated guess or a prediction of expected outcomes
• It states the relationships between variables that the researcher expects to find as a result of the study
• Hypotheses should be as specific as possible.
The process we followed…
Research
DesignSampling
Questionnaire
Design
Data Collection
& processing
Data
Analysis
Research
Objectives
Training the
Conceptual
Framework
Hypothesis
Formulation
Selection of
research
method
Mode of
survey
Identify
Target group
Identify
sampling
technique
Principles of
questionnaires
Improvements
to
questionnaire
Pilot testing
the
questionnaire
Training the
enumerator
Quality check
Data entry
Data
cleaning
Descriptive
Statistics
Inferential
statistics
(modeling)
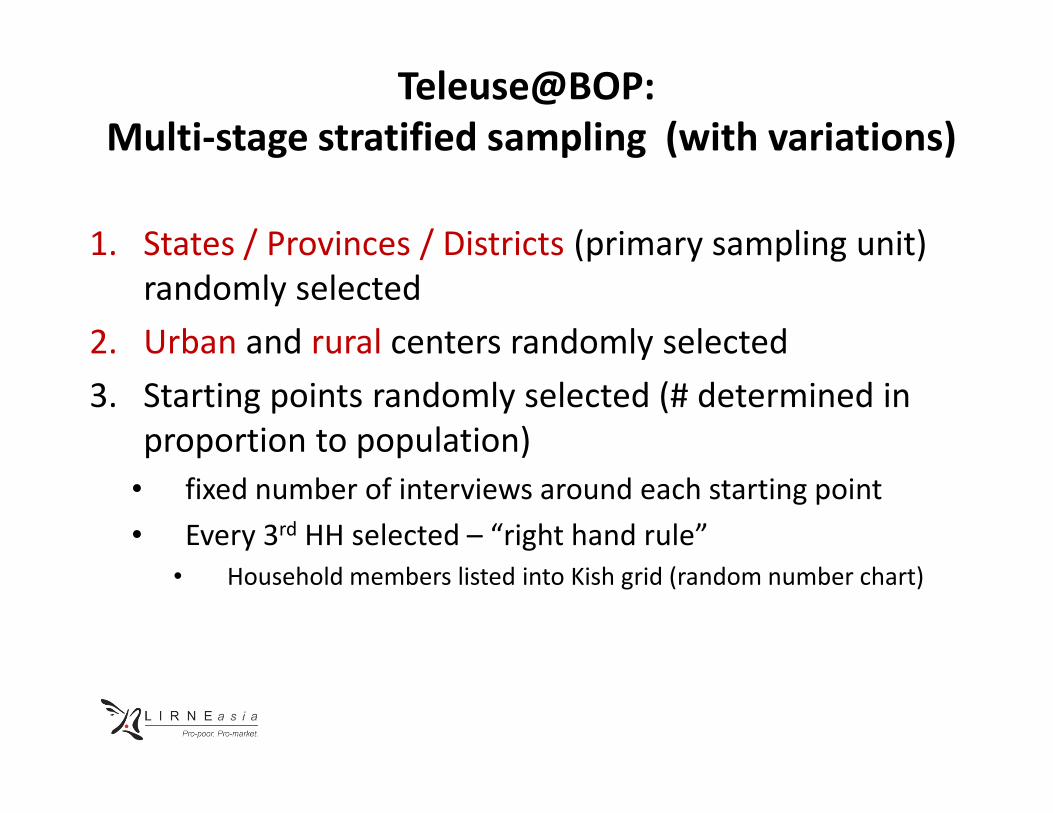
Teleuse@BOP:
Multi-stage stratified sampling (with variations)
1. States / Provinces / Districts (primary sampling unit)
randomly selected
2. Urban and rural centers randomly selected
3. Starting points randomly selected (# determined in 3. Starting points randomly selected (# determined in
proportion to population)
• fixed number of interviews around each starting point
• Every 3rd HH selected – “right hand rule”
• Household members listed into Kish grid (random number chart)

The process we followed…
Research
DesignSampling
Questionnaire
Design
Data Collection
& processing
Data
Analysis
Research
Objectives
Training the
Conceptual
Framework
Hypothesis
Formulation
Selection of
research
method
Mode of
survey
Identify
Target group
Identify
sampling
technique
Principles of
questionnaires
Improvements
to
questionnaire
Pilot testing
the
questionnaire
Training the
enumerator
Quality check
Data entry
Data
cleaning
Descriptive
Statistics
Inferential
statistics
(modeling)

Inferential Stats…
Coefficient Odds Ratio Significance
Age squared -0.01 0.99 0.00
Ln (monthly personal
income)0.50 1.64 0.00
Gender -0.26 0.77 0.04
Table 7: Logistic regression output for Model 1 (predicting probability of mobile Internet-only use)
Gender -0.26 0.77 0.04
Walk time to nearest town -0.03 0.97 0.09
% of phone-owning contacts 1.18 3.26 0.00
Mobile ownership 0.43 1.53 0.02
Secondary education 1.23 3.41 0.00
Tertiary education 2.36 10.59 0.00
Philippines 1.65 5.21 0.00
Thailand 1.93 6.90 0.00
Constant -6.34 0.00 0.00
n = 483; Nagelkerke R
Square: 0.429
QUALITATIVE APPROACHES
14
Qualitative research
• In-depth and detailed.
• Helps understand a research problem from the perspective of the ‘affected’ local population.
• Its never just about what they say, but also what they do.they do.
– Visual cues as important as verbal cues
• Effective in getting culturally specific information about particular populations:
– Values, opinions, attitudes, behaviors and social contexts
15

When do we use qualitative research?• When we don’t know enough about
– E.g. What are the information requirements of Micro-
entrepreneurs in Myanmar
– Could be a precursor to a quantitative study and/or be considered exploratory research
• When we want to know in detail why a certain phenomena occurs?phenomena occurs?
– E.g. Why do people in the ages 10-16 use their phones more
when they are at home and you want to know why?
– May be the phenomena was discovered during a previous quant study
– Could be considered as explanatory research
• Purely descriptive
– E.g. What are the attitudes of users to having off-peak time
start at 7pm. 16
Different ways of doing qualitative
research
Case studies
Focus groups
Unstructured interviews
17
Ethnographic studies
User personae
Photo novellas
Diary/ Journal method

Communicating with stakeholders
using user personae• Develop a profile of a specific type of user/
individual
• Could have been developed using multiple
approaches:
– Mini-ethnographies
– Case study
– Photo novella
• Back up the profile with data
18
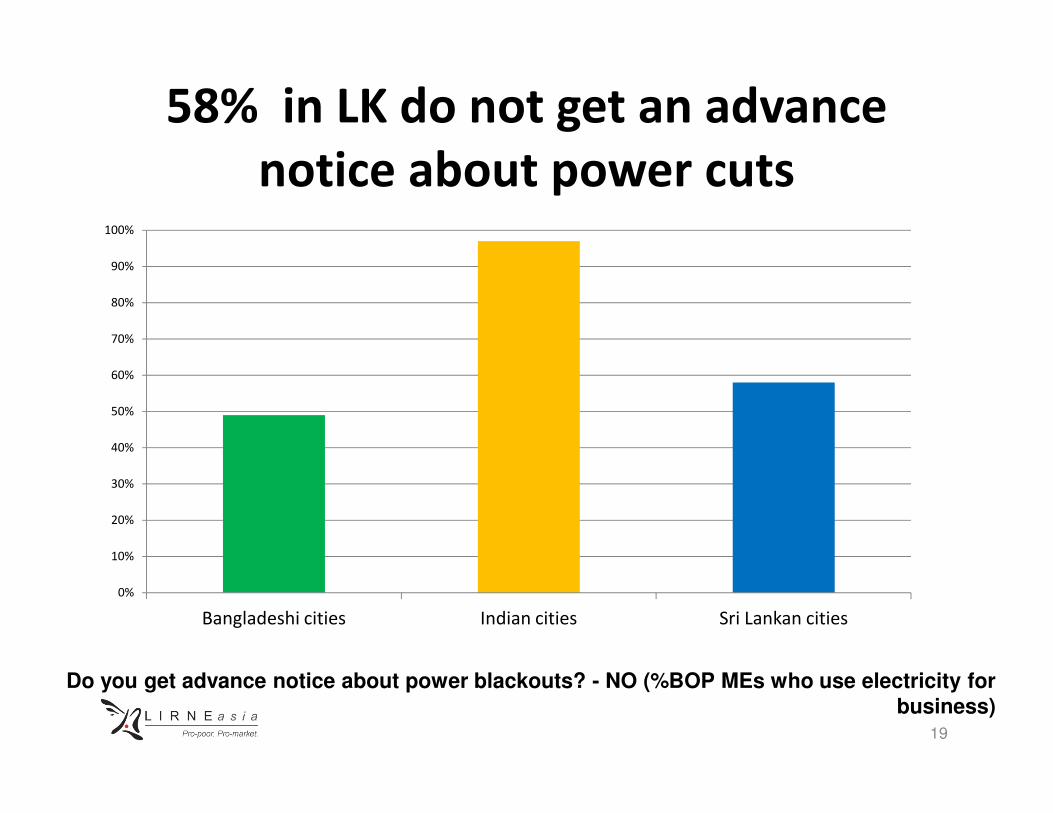
58% in LK do not get an advance
notice about power cuts
50%
60%
70%
80%
90%
100%
Do you get advance notice about power blackouts? - NO (%BOP MEs who use electricity for business)
0%
10%
20%
30%
40%
50%
Bangladeshi cities Indian cities Sri Lankan cities
19

Name: MihiriAge: 30 yearsEducation: Secondary EducationLocation: ColomboBusiness: Services– Beauty ParlorEmployees: NoneYears of Service: 3
• Runs her business from rented
Inside the Beauty Parlour
• Runs her business from rented accommodation
• Has an electricity connection.• Electricity is essential for her
business.• Unable to serve her clients if
there is no electricity. • Lack of information on power-
cuts has an adverse effect on her livelihood.
20

Ethics of demand side research
• Prevention of deception
– Why are you doing the study, what you want to talk them about, what you are hoping to achieve.
• Protection of privacy
– How will what they say or the visual information captured be used (what kind of identifiable captured be used (what kind of identifiable information will you use)
– E.g. is it ok to take photographs of them, their children
or their personal properties; what will the photos be
appearing in; will they be identifiable; do the faces
need to be blurred out?
• Obtain informed consent
– In the case of FGDs this may mean much before the actual event. 21
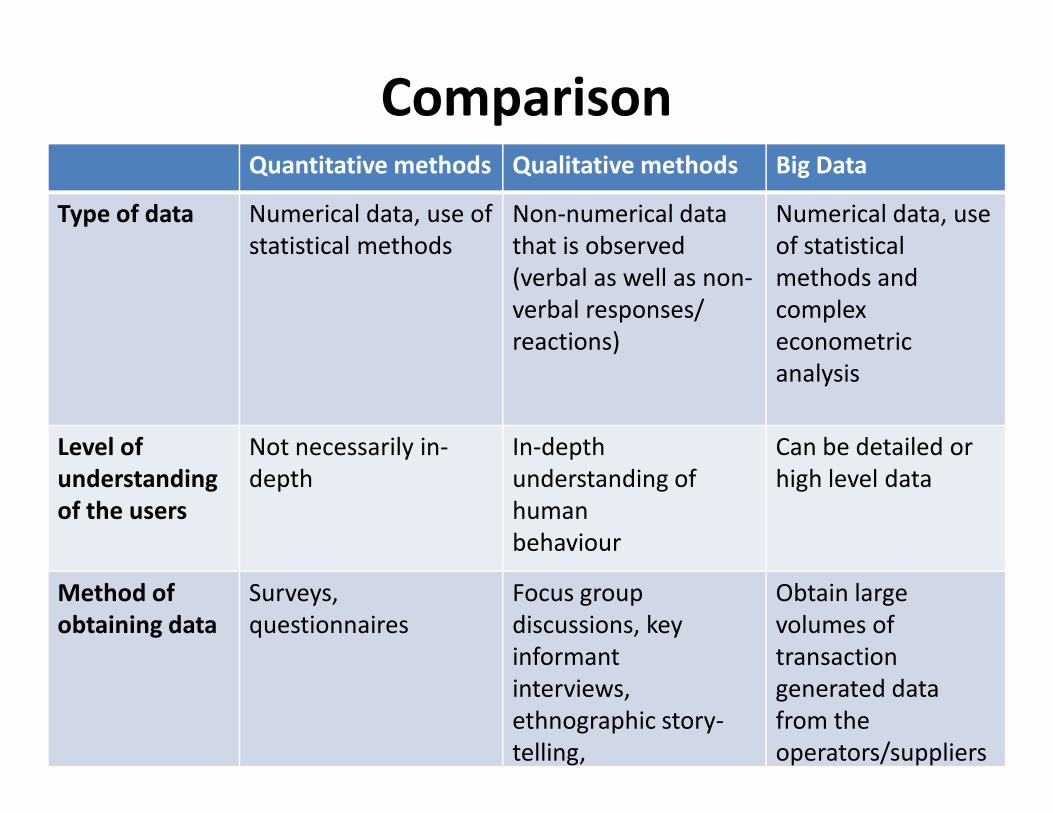
Comparison Quantitative methods Qualitative methods Big Data
Type of data Numerical data, use of
statistical methods
Non-numerical data
that is observed
(verbal as well as non-
verbal responses/
reactions)
Numerical data, use
of statistical
methods and
complex
econometric
analysis
Level of
understanding
of the users
Not necessarily in-
depth
In-depth
understanding of
human
behaviour
Can be detailed or
high level data
Method of
obtaining data
Surveys,
questionnaires
Focus group
discussions, key
informant
interviews,
ethnographic story-
telling,
Obtain large
volumes of
transaction
generated data
from the
operators/suppliers
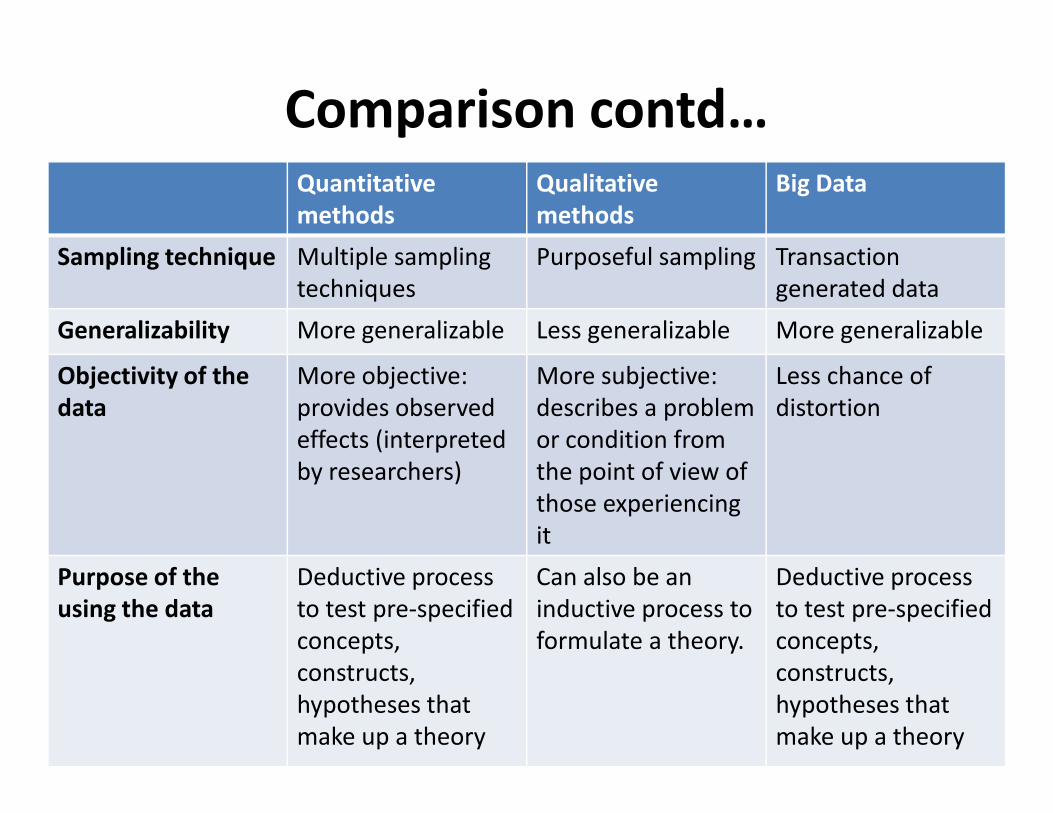
Quantitative
methods
Qualitative
methods
Big Data
Sampling technique Multiple sampling
techniques
Purposeful sampling Transaction
generated data
Generalizability More generalizable Less generalizable More generalizable
Objectivity of the
data
More objective:
provides observed
More subjective:
describes a problem
Less chance of
distortion
Comparison contd…
data provides observed
effects (interpreted
by researchers)
describes a problem
or condition from
the point of view of
those experiencing
it
distortion
Purpose of the
using the data
Deductive process
to test pre-specified
concepts,
constructs,
hypotheses that
make up a theory
Can also be an
inductive process to
formulate a theory.
Deductive process
to test pre-specified
concepts,
constructs,
hypotheses that
make up a theory

If demand-side, then what method do I
use?
• Depends on research requirements:
– Research goals/ questions
– Time and funds
– Researcher’s own skills, beliefs and valuesResearcher’s own skills, beliefs and values
24