Introduction to Cladistic Analysis - Grey...
21
3.0 Copyright © 2008 by Department of Integrative Biology, University of California-Berkeley Introduction to Cladistic Analysis - 1 Introduction to Cladistic Analysis tunicate lamprey Cladoselache † trout lungfish frog notochord skull jaws swimbladder or lung enamel four true limbs vertebrae
Transcript of Introduction to Cladistic Analysis - Grey...

3.0 Copyright © 2008 by Department of Integrative Biology, University of California-Berkeley
Introduction to Cladistic Analysis - 1 1
Introduction to Cladistic Analysis
tunicate lamprey Cladoselache †
trout lungfish frog
notochord
skull
jaws
swimbladder or lung
enamel
four
true
limbs
vertebrae

Copyright © 2008 by Department of Integrative Biology, University of California-Berkeley
Introduction to Cladistic Analysis - 2
CLADISTICS FOR BEGINNERS
Systematics is the branch of biology concerned with the study of organic diversity. One of the primary tasks of the systematist is phylogenetic reconstruction, i.e., piecing together the evolutionary history of life on earth. If you were an animal systematist, you might look at the six taxa (singular, taxon), or named groups of organisms, pictured below (Figure A) and ask the following question:
"How are these taxa related to each other?" Since you can't travel backwards in time, answering this question isn't as simple as you may think. In fact, since the appearance of Darwin's On the Origin of Species a century and a half ago, systematists have struggled to find the best way to determine the evolutionary relationships among taxa. Through the publication of his book in 1950 (Grundzüge einerTheorie der phylogenetischen Systematik), a German entomologist by the name of Willi Hennig introduced a revolutionary method for ascertaining geneologies. Nowadays, biologists refer to Hennig's unique approach as "cladistic analysis", "cladistics", or "phylogenetic systematics". Practitioners of Hennig's method are called "cladists" or "phylogenetic systematists".

Copyright © 2008 by Department of Integrative Biology, University of California-Berkeley
Introduction to Cladistic Analysis - 3
Cladistic view of evolution According to Hennig, evolutionary history (i.e., phylogeny) consists of a series of dichotomies. Each dichotomy marks the splitting and disappearance of an ancestral species and the formation of two daughter species. This process of species creation is known as cladogenesis, or branching evolution. The fundamental product of evolution is the clade, or monophyletic group, which is made up of an ancestral species and all of its descendants. In the branching diagram below (Figure B), a single hypothetical and unnamed ancestral species participated in a speciation event at the branch point, or node, to give rise to a pair of daughter species: rainbow trout (Oncorhynchus mykiss) and cutthroat trout (O. clarki). Rainbow trout, cutthroat trout, and the ancestral species together compose a clade (monophyletic group).
rainbow trout(Oncorhynchus mykiss)
cutthroat trout(Oncorhynchus clarki)
speciationevent
Figure B. Evolution.
ancestralspecies
daughterspecies
daughterspecies
Even if the taxa at the tips of the branches are higher taxa (e.g., genera, families, orders, classes, phyla, kingdoms), instead of species, a node still represents a speciation event, because higher taxa originated as species. Depicting phylogenetic history: cladograms A cladist presents her results in the form of a branching diagram called a "cladogram". All of the taxa under study are listed at the top of a cladogram. These taxa may be living or extinct*. The cladist draws intersecting lines, or branches, beneath them to illustrate their common ancestry relationships. The ancestors of these taxa are hypothetical and
* The special symbol † signifies an extinct taxon. For example, Cladoselache † from Figure A is an extinct taxon of sharks.

Copyright © 2008 by Department of Integrative Biology, University of California-Berkeley
Introduction to Cladistic Analysis - 4
unnamed, but any branch that connects two nodes (remember, a node represents a speciation event) corresponds to an ancestor (technically, an internodal branch may correspond to a series of ancestors). Figure B is a very small cladogram. The following cladogram (Figure C) was constructed for the six taxa from Figure A:
tunicate lamprey Cladoselache † trout lungfish frog
Figure C. A cladogram.
1
2
3
4
5
i
ii
iii
iv
v
Besides the six taxa of interest, this cladogram displays five speciation events (labeled i-v) and five hypothetical ancestors (labeled 1-5).
Ancestor 5 is the most recent common ancestor of lungfish and frog. Lungfish and frog are more closely related to each other than either is to any of the other four taxa under study. Ancestor 5, lungfish, and frog together compose a clade (monophyletic group).
Similarly, Ancestor 4 is the most recent common ancestor of trout, lungfish, and frog. Trout, lungfish, and frog are more closely related to each other than either is to any of the other three taxa included in the analysis. Ancestor 4, trout, lungfish, and frog together compose a second clade.
This cladogram contains three more clades (monophyletic groups). Can you identify them?
Cladograms and time A cladogram provides information about the relative timing of speciation events (and, thus, the relative antiquity of ancestors). Look again at the cladogram shown in Figure C.

Copyright © 2008 by Department of Integrative Biology, University of California-Berkeley
Introduction to Cladistic Analysis - 5
Speciation event i is the oldest (ancestor 1 evolved first); speciation event v is the youngest (ancestor 5 evolved last). However, because a cladogram lacks an absolute time axis, you can't tell in what year a speciation event occurred (or an ancestor evolved). Since branch length isn't equivalent to time, you can't tell speciation events.
A cladogram is an hypothesis You must be cautious about interpreting a cladogram: As any cladist will tell you, a cladogram is an hypothesis, not a fact. Ideas about evolutionary history change (hopefully, they get more refined) as new information becomes available.
Phylogenies versus cladograms A phylogeny is a diagram that superficially resembles a cladogram. A phylogeny provides information about the evolutionary relationships among taxa. It often expresses the geographical distributions or morphological similarities of taxa as well. Most importantly, a phylogeny, unlike a cladogram, has an absolute time axis. In a phylogeny, the taxa under study are not necessarily listed across the top of the diagram, as is mandatory in a cladogram. Instead, the taxa are ordered vertically to indicate when they lived. The phylogeny on the next page. (Figure D) includes the same taxa used to build the cladogram displayed in Figure C.

Copyright © 2008 by Department of Integrative Biology, University of California-Berkeley
Introduction to Cladistic Analysis - 6
Figure D. A phylogeny.
590 mya
248 mya
65 mya
0 mya
CE
NO
ZO
ICM
ES
OZ
OIC
PA
LE
OZ
OIC
?
?
?
tunicate
lam prey
Cladoselache †
trout
frog
lung fish
The solid rectangles indicate the range of each taxon in the fossil record (soft-bodied tunicates are rarely preserved as fossils, so the fossil range indicated for tunicate is pure conjecture). The narrow curves represent the ancestors of the labelled taxa.

Copyright © 2008 by Department of Integrative Biology, University of California-Berkeley
Introduction to Cladistic Analysis - 7
Evidence for common ancestry: a taxon's characters Where in the world do you look for the information necessary to construct a cladogram? Well, Hennig argued that the geneological relationships within a suite of taxa can be discovered indirectly by examining their characters.
Characters To begin, what is a character? A character is a feature that is an observable part or attribute of an organism. An example of a character is feet in tetrapods. Characters have different forms or appearances called character states. If the character is feet in tetrapods, then the character states can be the number of toes on the feet (1,2,3, etc.) or even the presence or absence of feet (feet are lost in snakes and other reptiles and amphibians). These character states are coded into a matrix by assigning a number to each character state. The presence of feet can be called the 0 state. The absence of feet can be called the 1 state. By looking at several organisms you will begin to see the different distributions of the character states. Look at the example below.
Character 1 is the presence or absence of limbs. State 1 of character 1 is the presence of limbs. State 0 is the absence of limbs. Character 2 is the number of digits on each limb. State 0 is 5 digits, state 1 is 3 digits, and state 2 is 4 digits. The question mark for fish is because fish don’t have limbs with digits. Therefore you can’t know how many digits they have. The characters used to construct the cladogram must be carefully chosen. the character has to be consistent in all the members of that type of organism. In selecting the suite of characters to be compared, each organism must have at least one character different from the other organisms. Table A contains a partial list of the morphological characters of the six animal taxa from Figure A**.
** Cladists routinely use morphological, molecular, and even behavioral characters in their analyses.

Copyright © 2008 by Department of Integrative Biology, University of California-Berkeley
Introduction to Cladistic Analysis - 8
Table A. Morphological characters of six taxa. An “x” indicates that the character is present while a “y” indicates the character is absent.
Plesiomorphies and apomorphies
A plesiomorphy is an "ancestral", "less specialized", or "primitive" character. An apomorphy is a "derived", "specialized", or "advanced" character. Every taxon possesses a mixture of plesiomorphies and apomorphies. At some point in time during the evolution of the taxa pictured in Figure A, vertebrae (serially arranged skeletal units that enclose the nerve cord) came into existence. "Absence of vertebrae" is one character state. "Presence of vertebrae" is another character state. These two character states are parts of a "transformation series" (the former was transformed, or evolved, into the latter). With reference to the six taxa shown in Figure A, the absence of vertebrae is a plesiomorphic character, and the presence of vertebrae is an apomorphic character. For these six taxa, having vertebrae represents an evolutionary advancement. Distinguishing plesiomorphies from apomorphies is tricky business. Luckily, Hennig developed a method called outgroup comparison for partitioning characters into these two basic types.
Outgroup comparison Outgroup comparison is a means of determining which character in a transformation series is a plesiomorphy and which is an apomorphy. IT IS IMPORTANT TO REMEMBER THAT THE OUTGROUP DEFINES THE CHARACTER STATE. FOR OUR PURPOSES, WE DEFINE THE OUTGROUP AS PLESIOMORPHIC. But please appreciate the selection of the proper outgroup usually requires a good deal of effort.
deuterostome development
notochord vertebrae jaws skull swimbladder or lung
enamel four true
limbs tunicate x x y y y y y y lamprey x x x y x y y y Cladoselache † x x x x x y y y trout x x x x x x y y lungfish x x x x x x x y frog x x x x x x x x

Copyright © 2008 by Department of Integrative Biology, University of California-Berkeley
Introduction to Cladistic Analysis - 9
An outgroup is the most closely related taxon to, but not the ancestor of, the set of taxa under study. The latter constitutes the "ingroup". To conduct a cladistic analysis of the animals shown in Figure A, the following six taxa make up the ingroup:
tunicate lamprey
Cladoselache † trout
lungfish frog
Previous research has revealed that the closest relative of the ingroup is the sea urchin (see Figure E).
Thus, the sea urchin will function as the outgroup in this cladistic analysis. The cladist assumes that the common ancestor of the ingroup and outgroup possessed only ancestral characters, and that they still are prevalent in the outgroup. Thus, any character that the outgroup displays must be a plesiomorphy, and any character that the outgroup lacks must be an apomorphy. Table B gives a list of some morphological characters possessed by the sea urchin. Table B. Morphological characters of the outgroup. An “x” indicates that the character is present while a “y” indicates the character is absent. deuterostome
development notochord vertebrae jaws skull swimbladder
or lung enamel four
true limbs
sea urchin x y y y y y y y

Copyright © 2008 by Department of Integrative Biology, University of California-Berkeley
Introduction to Cladistic Analysis - 10
By comparing the sea urchin's characters with those of the six ingroup taxa, you can revise the ingroup's data table (Table A) so as to distinguish plesiomorphies and apomorphies. See Table C. Table C. Plesiomorphies and apomorphies of six taxa. "0" indicates that the taxon possesses a plesiomorphic charcter state. “1” indicates that the taxon possesses an apomorphic character state. NOTE THAT “0” DOES NOT NECESSARILY INDICATE THE LACK OF A TRAIT AND “1” DOES NOT NECESSARILY INDICATE THE PRESENCE OF A TRAIT.
Once you've identified the apomorphies for each taxon, you're ready to assemble the taxa into clades (monophyletic groups) on the basis of special kinds of apomorphies called "synapomorphies".
Useful apomorphies: synapomorphies A synapomorphy, or "shared derived character", is an apomorphy that occurs in two or more taxa. Examination of the revised data table (Table C) indicates that, within our ingroup, six characters are synapomorphies. See Table D.
Table D. Synapomorphies and the taxa that share them.
Taxa
tunicate lamprey
Cladoselache † trout
lungfish frog
lamprey Cladoselache †
trout lungfish
frog
Cladoselache † trout
lungfish frog
lamprey Cladoselache †
trout lungfish
frog
trout lungfish
frog
lungfish frog
A given synapomorphy evolved in the most recent common ancestor of the taxa that possess it, and it was inherited by each taxon from that ancestor. The beauty of synapomorphies is that they point out clades (monophyletic groups) to the cladist. All of the taxa that possess a given synapomorphy, but not other taxa, belong to a clade.
deuterostome development
notochord vertebrae jaws skull swimbladder or lung
enamel four true
limbs tunicate 0 1 0 0 0 0 0 0 lamprey 0 1 1 0 1 0 0 0 Cladoselache † 0 1 1 1 1 0 0 0 trout 0 1 1 1 1 1 0 0 lungfish 0 1 1 1 1 1 1 0 frog 0 1 1 1 1 1 1 1
Synapomorphy
notochord vertebrae jaws skull swim- bladder or lung
enamel

Copyright © 2008 by Department of Integrative Biology, University of California-Berkeley
Introduction to Cladistic Analysis - 11
Table D discloses that two synapomorphies (skull and vertebrae) identify the same clade. Figure F shows the same cladogram as in Figure C, but the six synapomorphies and five nested clades (shown by circles) have been added.
tunicate lamprey Cladoselache † trout lungfish frog
notochord
skull
jaws
swimbladderor lung
enamel
Figure F. A cladogram showing synapomorphies and clades.
vertebrae

Copyright © 2008 by Department of Integrative Biology, University of California-Berkeley
Introduction to Cladistic Analysis - 12
Once the cladist has identified all of the clades, all she has to do is draw a cladogram that depicts how those clades fit together. First, though, beware of "autapomorphies"!
Unhelpful apomorphies: autapomorphies An autapomorphy is an apomorphy that occurs in only one taxon. Study of the revised data table (Table C) reveals that one character is an autapomorphy within our ingroup: four true limbs, a character that only frog possesses. Figure G shows the same cladogram as in Figure C, but six synapomorphies and the single autapomorphy have been added.
tunicate lamprey Cladoselache † trout lungfish frog
Figure G. A cladogram showing six synapomorphies and one autapomorphy.
notochord
skull
jaws
swimbladder or lung
enamel
four
true
limbs
vertebrae
Autapomorphies demonstrate the uniqueness of taxa, but they don't help the cladist identify clades (monophyletic groups).

Copyright © 2008 by Department of Integrative Biology, University of California-Berkeley
Introduction to Cladistic Analysis - 13
Drawing the cladogram Once you have identified the clades (monophyletic groups), you can put them together to form a cladogram that depicts the common ancestry relationships of the taxa that compose the ingroup. Nowadays, cladists use computers to perform outgroup comparison, to identify the clades, and especially, to draw the cladogram. However, the following simple procedure using an intermediate step of Venn Diagrams will let you construct a cladogram when your ingroup doesn't include too many taxa. Venn Diagram Method of converting a Data Matrix into a Cladogram: First, What is a Venn diagram? Venn diagrams are graphical representations of sets and subsets of data that are made by circling data points that have shared characters in nested boxes or circles. Venn diagrams are used here to group clades and subclades to show relationships. Branches can be drawn below the Venn diagram nested boxes to reflect these nested relationships in the form of a cladogram.
Circle the groups implied by synapomorphies
deuterostome development
notochord vertebrae jaws skull swimbladder or lung
enamel four true
limbs tunicate 0 1 0 0 0 0 0 0 lamprey 0 1 1 0 1 0 0 0 Cladoselache † 0 1 1 1 1 0 0 0 trout 0 1 1 1 1 1 0 0 lungfish 0 1 1 1 1 1 1 0 frog 0 1 1 1 1 1 1 1

Copyright © 2008 by Department of Integrative Biology, University of California-Berkeley
Introduction to Cladistic Analysis - 14
On the upper part of a piece of paper, identify taxa subsets. Starting with the most inclusive group(s),
place the taxa into nested boxes. Note the characters that support each grouping.
tunicate lamprey Cladoselache trout lungfish frog
Figure H. Taxa subsets in nested boxes
Next, draw a cladogram below the boxes to reflect the nested relationships.
tunicate lamprey Cladoselache trout lungfish frog
Figure I. Cladogram implied by nested subsets of taxa
notochord vertebrae; skull
jaws swimbladder or lung
enamel 4-limbs

Copyright © 2008 by Department of Integrative Biology, University of California-Berkeley
Introduction to Cladistic Analysis - 15
Draw a clean cladogram with all apomorphies and the outgroup The branching diagram that you drew below the nested boxes represents a complete cladogram of the ingroup. Nevertheless, redraw the cladogram to make it readable as in Figure J.
tunicate lamprey Cladoselache † trout lungfish frog
Figure J. A set of five interconnected clades (a cladogram).
Add the synapomorphies, autapomorphies, and outgroup to the cladogram (see Figure K).
tunicate lamprey Cladoselache† trout lungfish frog
notochord
skull
jaws
swimbladder or lung
enamel
four
true
limbs
vertebrae
sea urchin
Figure K. A cladogram with the synapomorphies, autapomorphy, and outgroup.

Copyright © 2008 by Department of Integrative Biology, University of California-Berkeley
Introduction to Cladistic Analysis - 16
SUMMARY: Venn-Diagram Method of converting a Data Matrix into a Cladogram 1. Complete your character analysis by determining the appropriate character state for all of the taxa and characters in the matrix. 2. Determine if a particular character state is derived or primitive, based on a comparison with an the outgroup. (see “Outgroup Comparison” section above) The character state of the outgroup is considered to be the primitive condition (ie., the plesiomorphic state). 3. In each column of your matrix, circle only groups of shared derived characters (synapomorphies). This will allow you to identify monophyletic groupings within your matrix. 4. Identify taxa subsets (= subclades and clades) based on their shared derived characters (synapomorphies). 5. Starting with the most inclusive group(s), place subclades and their larger (sub-)clades into “nested” boxes (see Venn Diagram above). 6. Draw cladogram branches below taxa boxes to reflect relationships depicted by these nested boxes (e.g., clades and subclades). 7. Label cladogram tips with taxa names and branches with supporting shared derived characters (synapomorphies).
Choosing among alternative cladograms: parsimony Sometimes you’ll discover that you can draw different, but nonequivalent, cladograms from a single set of clades, or previous research will suggest that your original cladogram is incorrect. For example, let's say that, based on your studies of comparative anatomy, you're sure that jaws evolved twice among the six animal taxa that make up our ingroup. Consequently, you propose that the following cladogram (Figure L) better reflects the common ancestry relationships within the ingroup than the original cladogram (Figure K).

Copyright © 2008 by Department of Integrative Biology, University of California-Berkeley
Introduction to Cladistic Analysis - 17
tunicate lamprey Cladoselache† trout lungfish frog
notochord
skull
jaws
swimbladder or lung
enamel
four
true
limbs
vertebrae
sea urchin
Figure L. Alternative, but less parsimonious cladogram.
swimbladder
or lung
jaws
Both cladograms accurately indicate the distribution of characters among taxa. We have no way of knowing which (if either) cladogram correctly depicts evolutionary history, but the Principle of Parsimony will allow us to decide which cladogram is more acceptable. Let's analyze our two candidates:
Original cladogram (Figure K). This cladogram implies that seven innovations have occurred during the evolution of the ingroup: Six synapomorphies and one autapomorphy. Alternative cladogram (Figure L). This cladogram implies that nine innovations have occurred during the evolution of the ingroup: Seven synapomorphies and two autapomorphies. Jaws and swimbladder or lung each evolved at two different times.
Please remember you can “flip” the branches of the cladogram and maintain the same relationsip among the organisms. Your GSI will give you several examples. The Principle of Parsimony states that the simplest explanation of the data is preferable over more complicated explanations. In cladistics it is assumed that the cladogram with the fewest branches is probably the most accurate because it suggests the fewest number of evolutionary innovations. Therefore, the original cladogram (Figure K) is more acceptable. It should be treated as the best explanation of your data until a more parsimonious cladogram (and one that still accurately portrays the distribution of characters among taxa) comes along.

Copyright © 2008 by Department of Integrative Biology, University of California-Berkeley
Introduction to Cladistic Analysis - 18
Note that in mapping the character data onto the cladogram, the most parsimonious explanation may require that you propose evolutionary reversals. A reversal is when an apomorphic or derived state evolves back into the ancestral or plesiomorphic state. This is also referred to as an ‘evolutionary loss’ (see diagram below).

Copyright © 2008 by Department of Integrative Biology, University of California-Berkeley
Introduction to Cladistic Analysis - 19
Interpreting the cladogram After you have constructed your cladogram, you can discuss the phylogenetic relationships among individual taxa or among groups of taxa.
Individual taxa By referring to the cladogram in Figure K, you can make statements about individual taxa like the following:
"Lungfish possesses enamel, a character (synapomorphy) that evolved in the most recent common ancestor of lungfish and frog." "Lungfish is more closely related to frog than to trout, Cladoselache †, lamprey, tunicate, or sea urchin."
Groups of taxa
Again, by referring to the cladogram in Figure K, you can talk about the evolutionary significance of a particular group of taxa. We can recognize three kinds of groups: "monophyletic groups", "paraphyletic groups", and "polyphyletic groups". Monophyletic groups. A monophyletic group consists of an ancestor and all of its descendants. A monophyletic group is a clade. It is defined by at least one synapomorphy (all group members have the synapomorphy or synapomorphies). Figure M gives an example of a monophyletic group.
tunicate lamprey Cladoselache † trout lungfish frog
notochord
skull
jaws
swimbladder or lung
enamel
fourtruelimbs
vertebbrae
sea urchin
Figure M. A monophyletic group (enclosed by the thick line).
Copyright © 2008 by Department of Integrative Biology, University of California-Berkeley
Introduction to Cladistic Analysis - 20
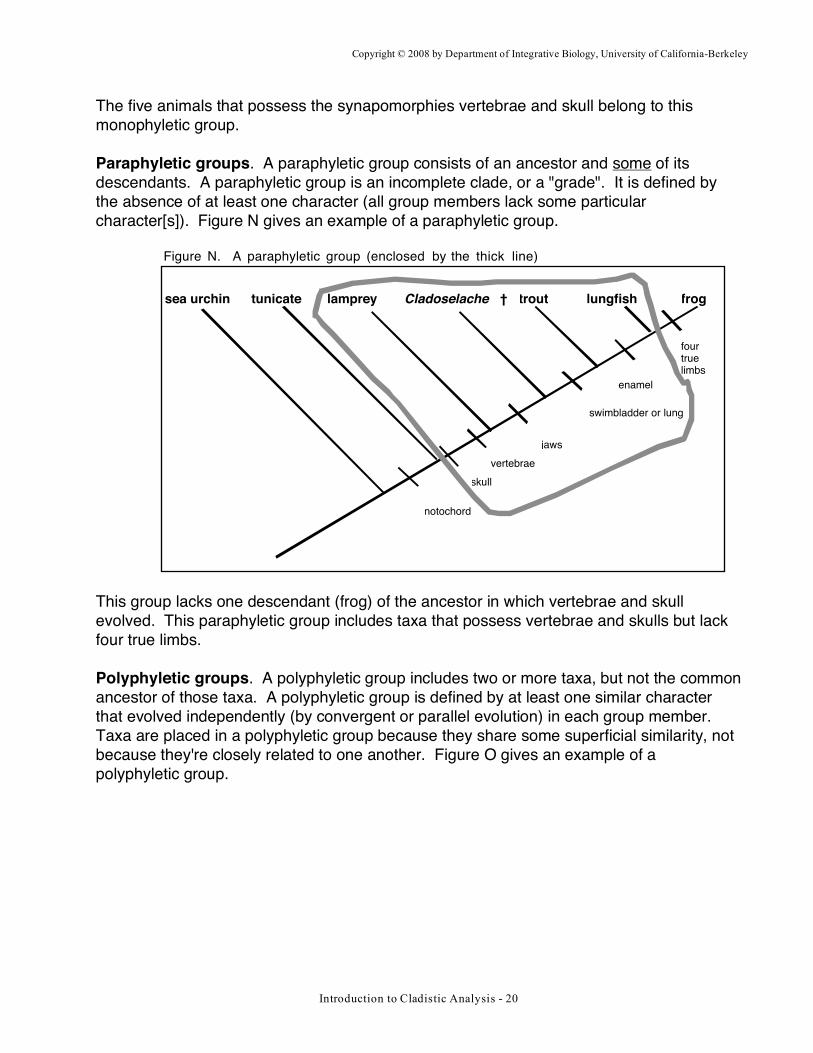
The five animals that possess the synapomorphies vertebrae and skull belong to this monophyletic group. Paraphyletic groups. A paraphyletic group consists of an ancestor and some of its descendants. A paraphyletic group is an incomplete clade, or a "grade". It is defined by the absence of at least one character (all group members lack some particular character[s]). Figure N gives an example of a paraphyletic group.
tunicate lamprey Cladoselache † trout lungfish frog
notochord
skull
jaws
swimbladder or lung
enamel
fourtruelimbs
vertebrae
sea urchin
Figure N. A paraphyletic group (enclosed by the thick line).
This group lacks one descendant (frog) of the ancestor in which vertebrae and skull evolved. This paraphyletic group includes taxa that possess vertebrae and skulls but lack four true limbs. Polyphyletic groups. A polyphyletic group includes two or more taxa, but not the common ancestor of those taxa. A polyphyletic group is defined by at least one similar character that evolved independently (by convergent or parallel evolution) in each group member. Taxa are placed in a polyphyletic group because they share some superficial similarity, not because they're closely related to one another. Figure O gives an example of a polyphyletic group.

Copyright © 2008 by Department of Integrative Biology, University of California-Berkeley
Introduction to Cladistic Analysis - 21
tunicate lamprey Cladoselache † trout lungfish frog
notochord
skull
jaws
swimbladder or lung
enamel
fourtruelimbs
vertebrae
sea urchin
Figure O. A polyphyletic group (enclosed by the thick line).
Tunicate and frog were put together in a polyphyletic group because each possesses a larva that looks like a tadpole. The larvae in these two taxa certainly evolved independently. The larval similarities do not provide evidence of a close phylogenetic relationship between tunicate and frog. Caution. When people talk about monophyletic groups, they sometimes mention the member taxa, but forget to include the ancestors. Here's an example of a sloppy, but common, way of referring to a monophyletic group:
"Lamprey, Cladoselache†, trout, lungfish, and frog compose a monophyletic group."
Although this sounds like a polyphyletic group, we know that it's really monophyletic because lamprey, Cladoselache†, trout, lungfish, and frog each possesses two synapomorphies (skull and vertebrae) that evolved in their most recent common ancestor. You must rely on context to make your judgement: Were the taxa put together on the basis of a superficial similarity (polyphyletic group) or a synapomorphy (monophyletic group)?