Introduction to China’s Scheme of Pollution Control … · Pollution Control and Emission...
28
Speech at Workshop on EGS on 24-25 September, 2009, Geneva Introduction to China’s Scheme of Pollution Control and Emission Reduction and Green Trade Promotion Ministry of Environmental Protection of P. R. China Sept 25,2009
-
Upload
truonglien -
Category
Documents
-
view
214 -
download
0
Transcript of Introduction to China’s Scheme of Pollution Control … · Pollution Control and Emission...
Speech at Workshop on EGS on 24-25 September, 2009, Geneva
Introduction to China’s Scheme of Pollution Control and Emission Reduction
and Green Trade Promotion
Ministry of Environmental Protection of P. R. China
Sept 25,2009
1. Background on Environmental Protection in China
2. Efforts and Achievements on Pollution Control and Emission Reduction in China
3. Promotion of Environmental Industry
4. Gain Co-benefits Following the Trends of Green Economy
5. China’s Efforts to Support CTESS
Contents
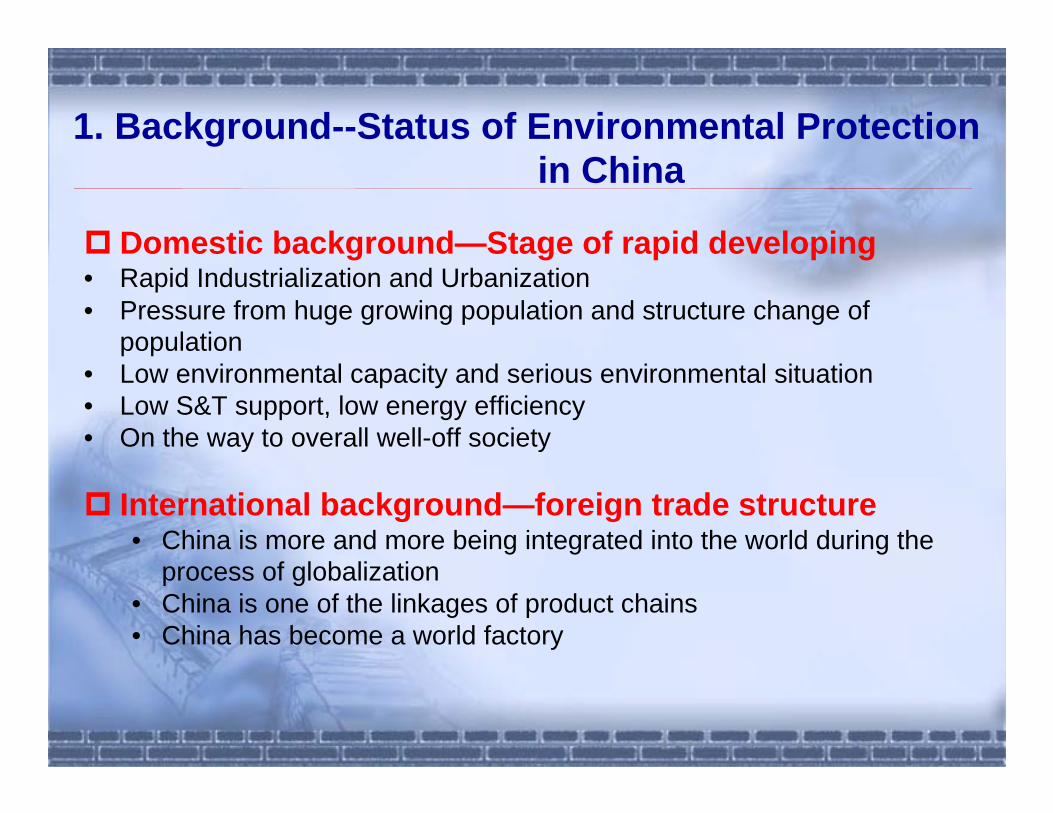
Domestic background—Stage of rapid developing• Rapid Industrialization and Urbanization • Pressure from huge growing population and structure change of
population• Low environmental capacity and serious environmental situation • Low S&T support, low energy efficiency • On the way to overall well-off society
International background—foreign trade structure• China is more and more being integrated into the world during the
process of globalization• China is one of the linkages of product chains• China has become a world factory
1. Background--Status of Environmental Protection in China
1.Background--Status of Environmental Protection in China
1949-2020年人口总数变化趋势
54167
66207
82992
98705
114333
126743136000
145000
0
20000
40000
60000
80000
100000
120000
140000
160000
1949
1950
1955
1960
1965
1970
1975
198019
85
1990
1995
2000
2005
2010
2020
万人
1
0.23
0.17
0.13
0.09
0 0.2 0.4 0.6 0.8 1 1.2
中国
美国
西方工业七国
德、法国
日本
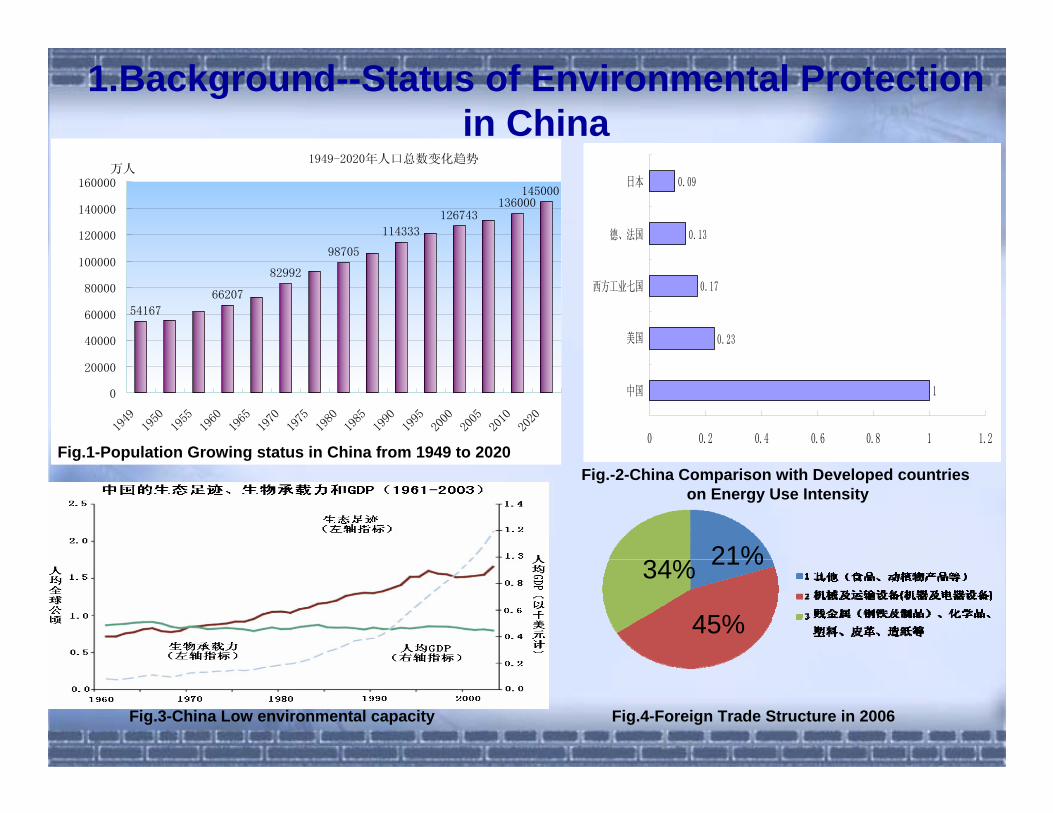
Fig.-2-China Comparison with Developed countrieson Energy Use Intensity
Fig.4-Foreign Trade Structure in 2006
21%
45%
34%
Fig.3-China Low environmental capacity
Fig.1-Population Growing status in China from 1949 to 2020
1.Background--Demand as a Developing member:
Technology Transfer Demand
As a Developing member: Common but Differentiated Responsibility
Environmental Pressures are larger than any other countries in the
world
Resource problems are more than any other countries in the world
To solve problems is difficult than any other countries in the world
2.Efforts and Achievements onPollution Control and Emission Reduction in China
Central government is paying high attentions on environmental protection
Concept of Scientific Development Resource-saving and Environmental Friendly Society Ecological Civilization
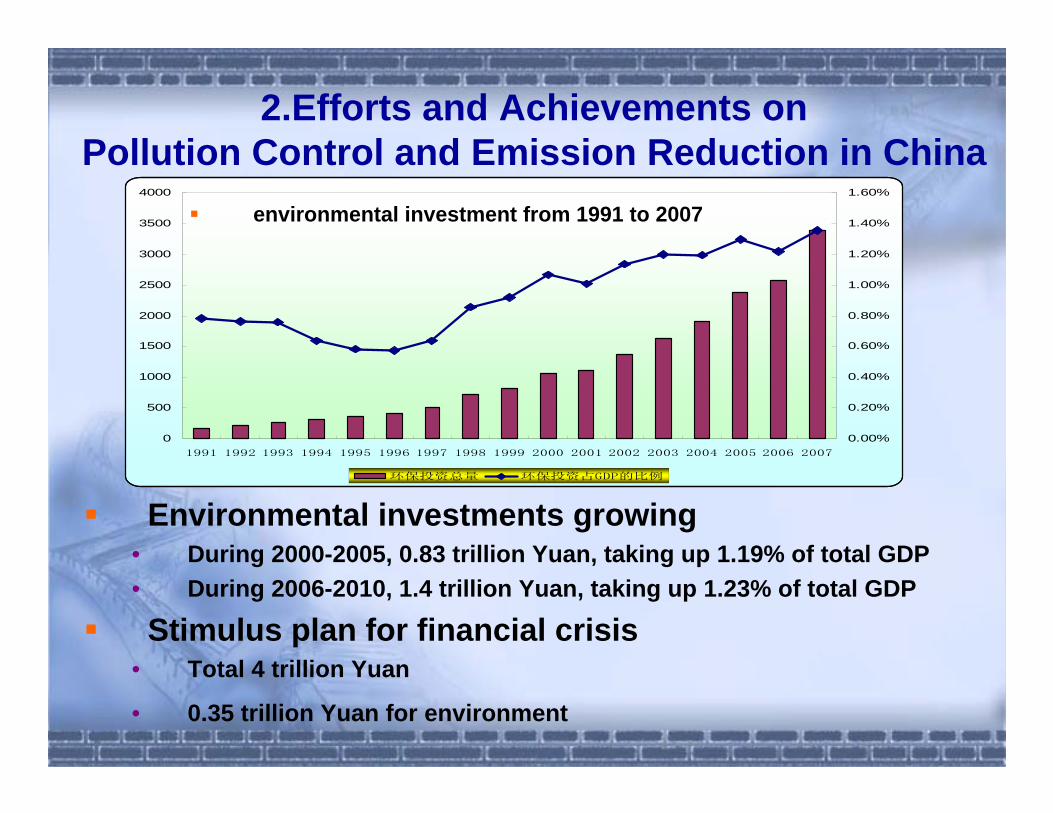
2.Efforts and Achievements on Pollution Control and Emission Reduction in China
Environmental investments growing• During 2000-2005, 0.83 trillion Yuan, taking up 1.19% of total GDP• During 2006-2010, 1.4 trillion Yuan, taking up 1.23% of total GDP
Stimulus plan for financial crisis • Total 4 trillion Yuan
• 0.35 trillion Yuan for environment
0
500
1000
1500
2000
2500
3000
3500
4000
1991 1992 1993 1994 1995 1996 1997 1998 1999 2000 2001 2002 2003 2004 2005 2006 2007
0.00%
0.20%
0.40%
0.60%
0.80%
1.00%
1.20%
1.40%
1.60%
环保投资总量 环保投资占GDP的比例
environmental investment from 1991 to 2007
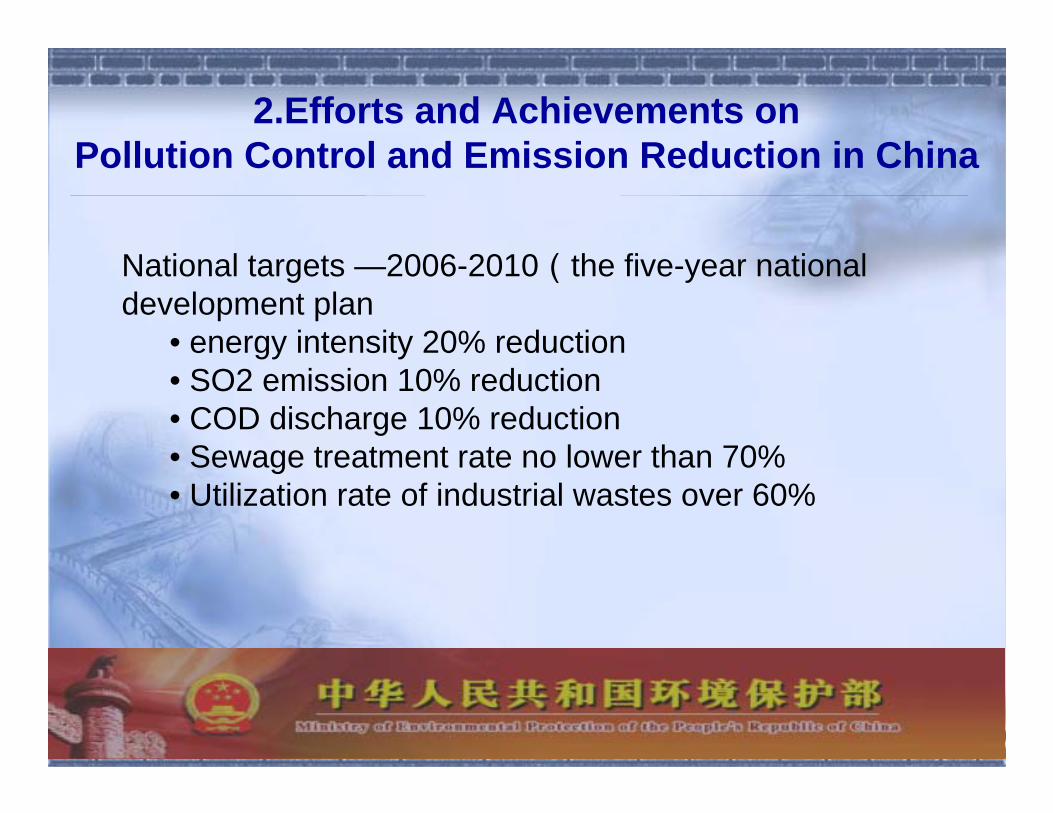
2.Efforts and Achievements on Pollution Control and Emission Reduction in China
National targets —2006-2010(the five-year national development plan
• energy intensity 20% reduction• SO2 emission 10% reduction• COD discharge 10% reduction• Sewage treatment rate no lower than 70%• Utilization rate of industrial wastes over 60%
2.Efforts and Achievements on Pollution Control and Emission Reduction in China
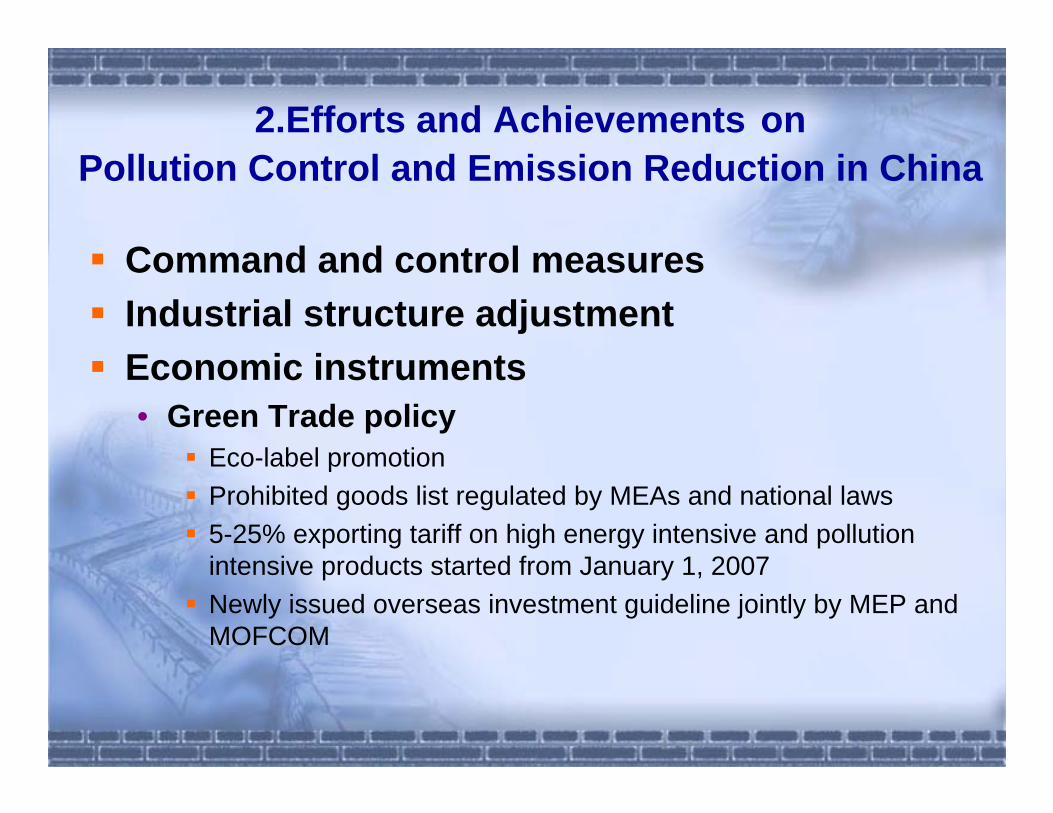
Command and control measures Industrial structure adjustment Economic instruments • Green Trade policy
Eco-label promotionProhibited goods list regulated by MEAs and national laws5-25% exporting tariff on high energy intensive and pollution intensive products started from January 1, 2007Newly issued overseas investment guideline jointly by MEP and MOFCOM
2.Efforts and Achievements onPollution Control and Emission Reduction in China
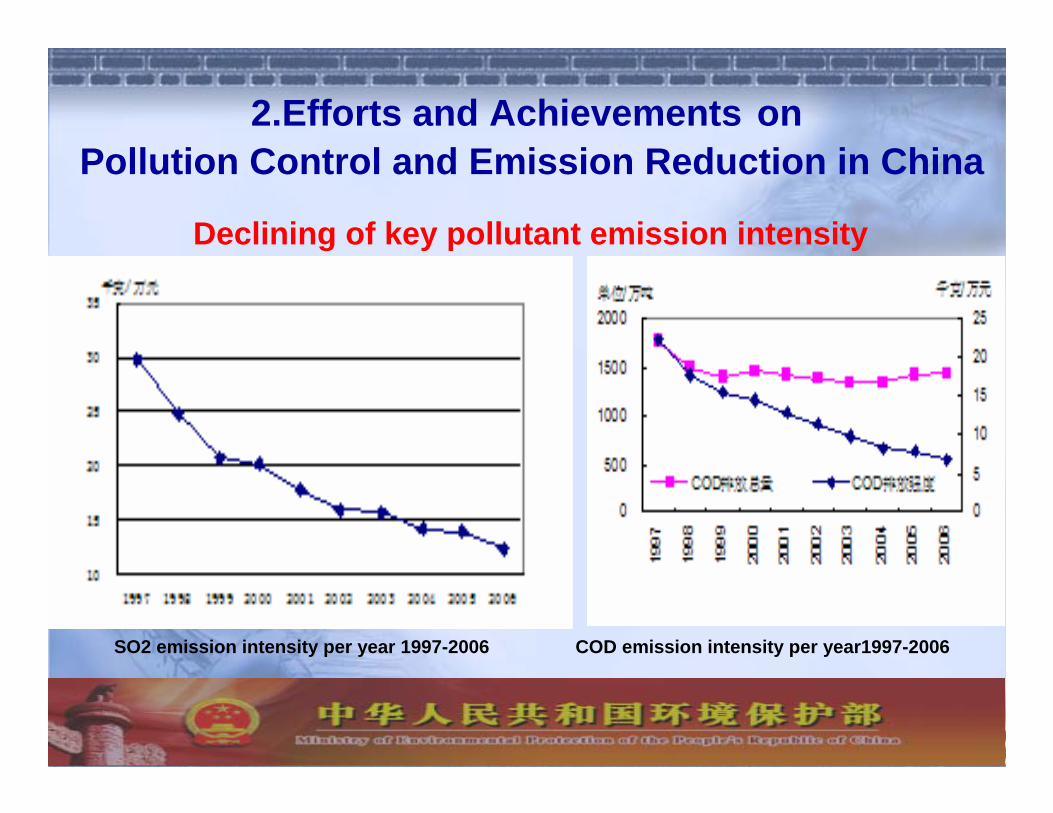
Declining of key pollutant emission intensity
SO2 emission intensity per year 1997-2006 COD emission intensity per year1997-2006
2.Efforts and Achievements on Pollution Control and Emission Reduction in China
0
0.05
0.1
0.15
0.2
0.25
0.3
0.35
0.4
0.45
SO2 NOX TSP
污染
物年
均浓
度(m
g/m
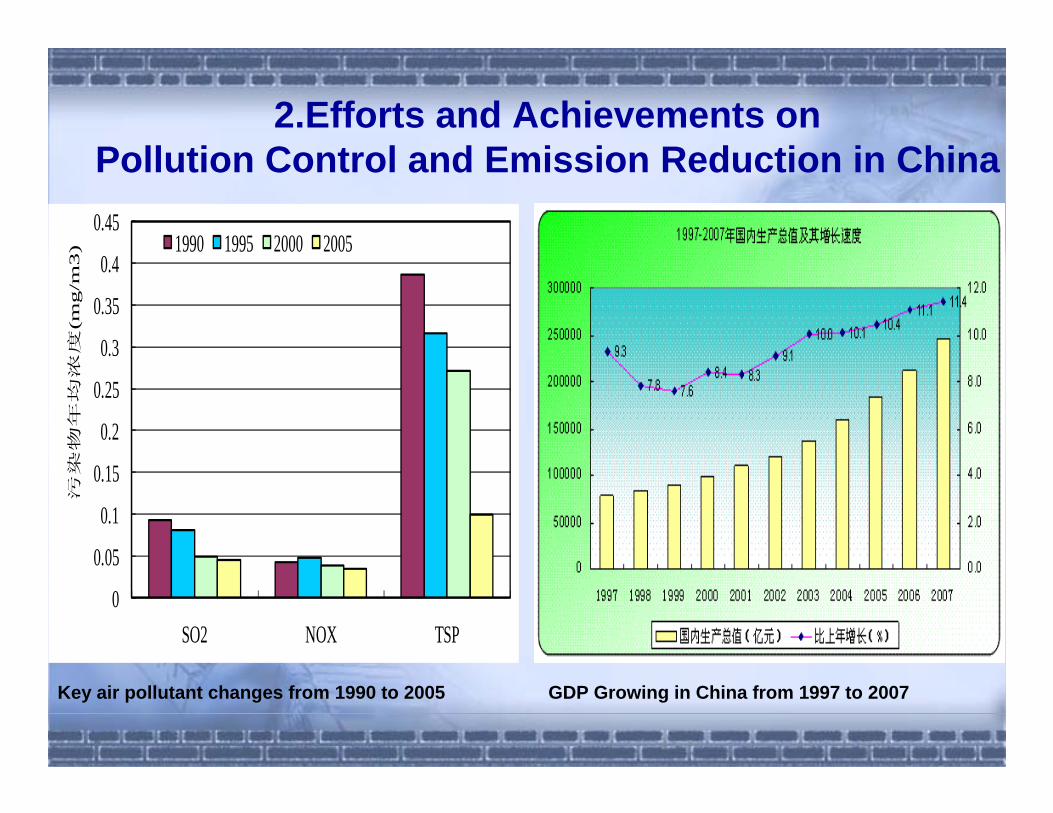
3) 1990 1995 2000 2005
Key air pollutant changes from 1990 to 2005 GDP Growing in China from 1997 to 2007
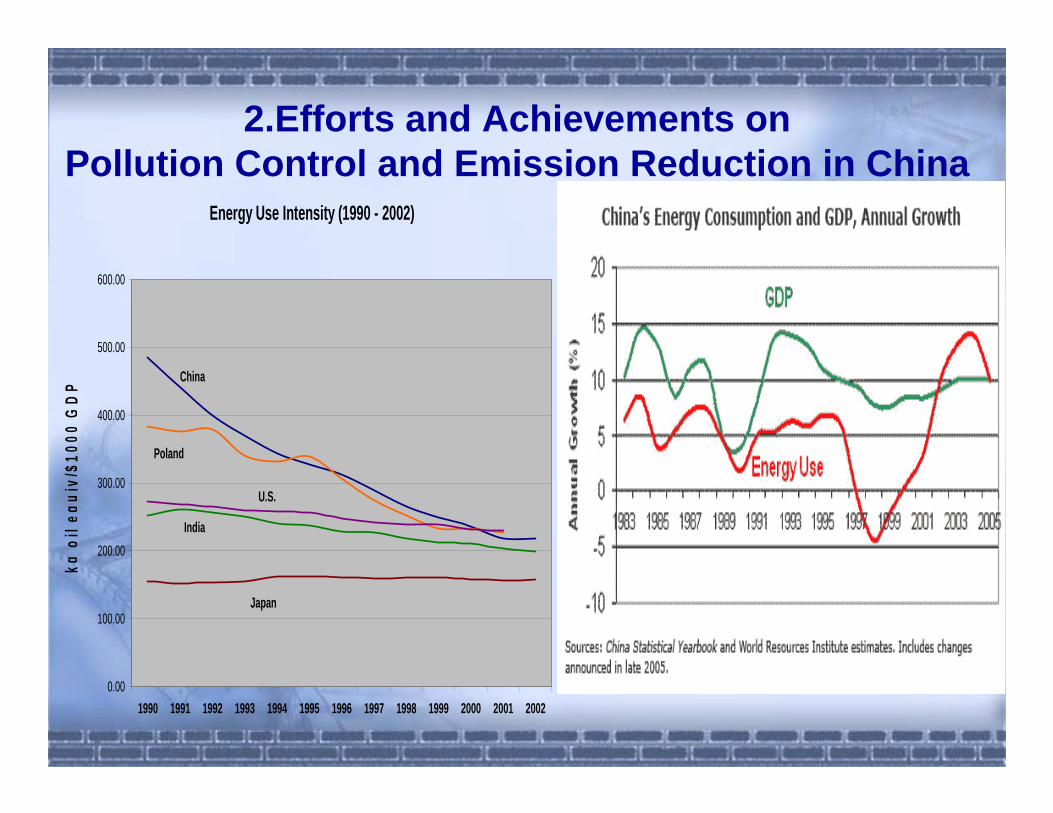
Energy Use Intensity (1990 - 2002)
0.00
100.00
200.00
300.00
400.00
500.00
600.00
1990 1991 1992 1993 1994 1995 1996 1997 1998 1999 2000 2001 2002
kg o
il eq
uiv/
$100
0 G
DP China
Poland
U.S.
India
Japan
2.Efforts and Achievements on Pollution Control and Emission Reduction in China
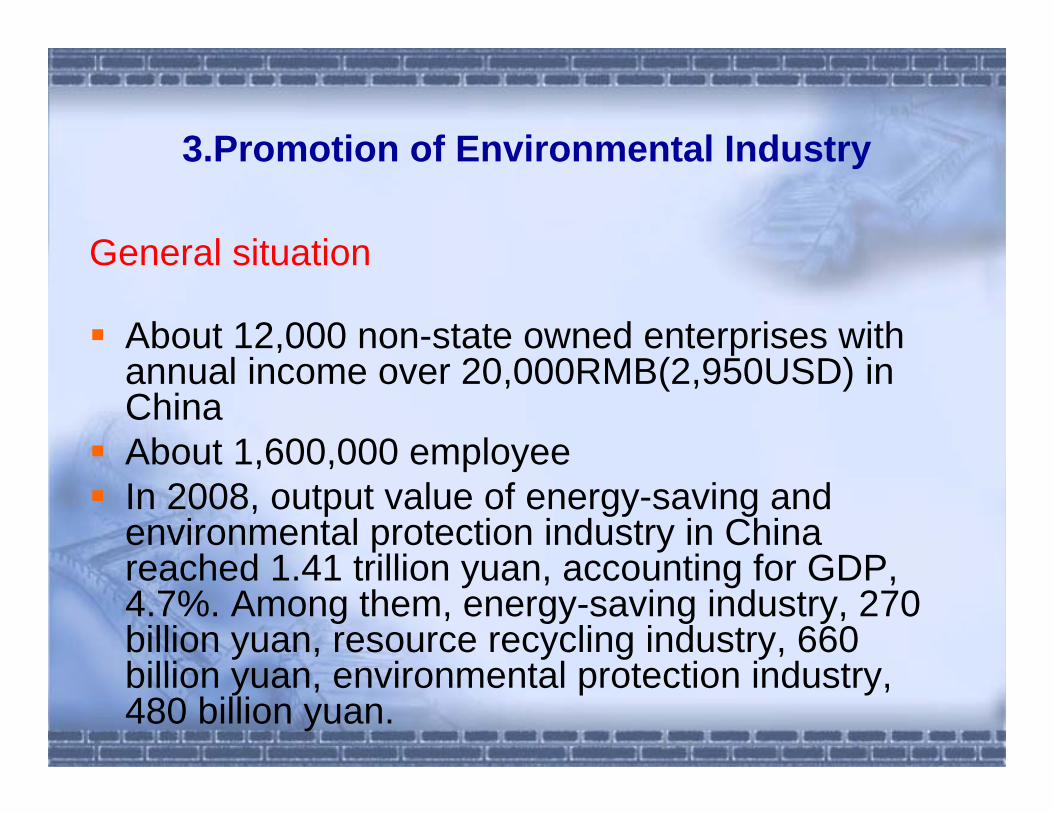
3.Promotion of Environmental Industry
General situation
About 12,000 non-state owned enterprises with annual income over 20,000RMB(2,950USD) in ChinaAbout 1,600,000 employeeIn 2008, output value of energy-saving and environmental protection industry in China reached 1.41 trillion yuan, accounting for GDP, 4.7%. Among them, energy-saving industry, 270 billion yuan, resource recycling industry, 660 billion yuan, environmental protection industry, 480 billion yuan.
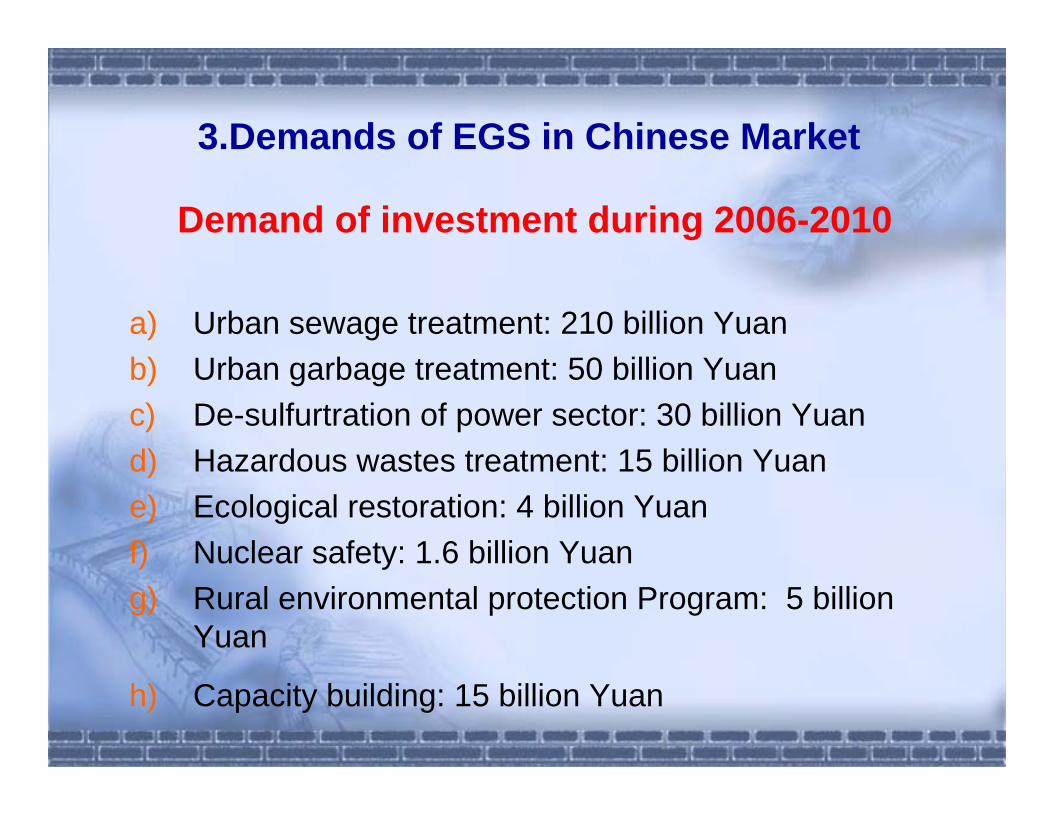
3.Demands of EGS in Chinese Market
Demand of investment during 2006-2010
a) Urban sewage treatment: 210 billion Yuanb) Urban garbage treatment: 50 billion Yuan c) De-sulfurtration of power sector: 30 billion Yuand) Hazardous wastes treatment: 15 billion Yuane) Ecological restoration: 4 billion Yuanf) Nuclear safety: 1.6 billion Yuang) Rural environmental protection Program: 5 billion
Yuan
h) Capacity building: 15 billion Yuan
3.Demands of EGS in Chinese Market
Demand for indoor environmental quality improvement • Building, painting and decoration materials• Furnatures
Demand for global environment• MEAs implementation
UNFCCCMontreal Protecal Etc
4.Gain Co-benefits Following the Trends of Green Economy
Contents • National Climate Change Plan (NCCP)• Concept of Co-benefits and co-control• International Promotion Program
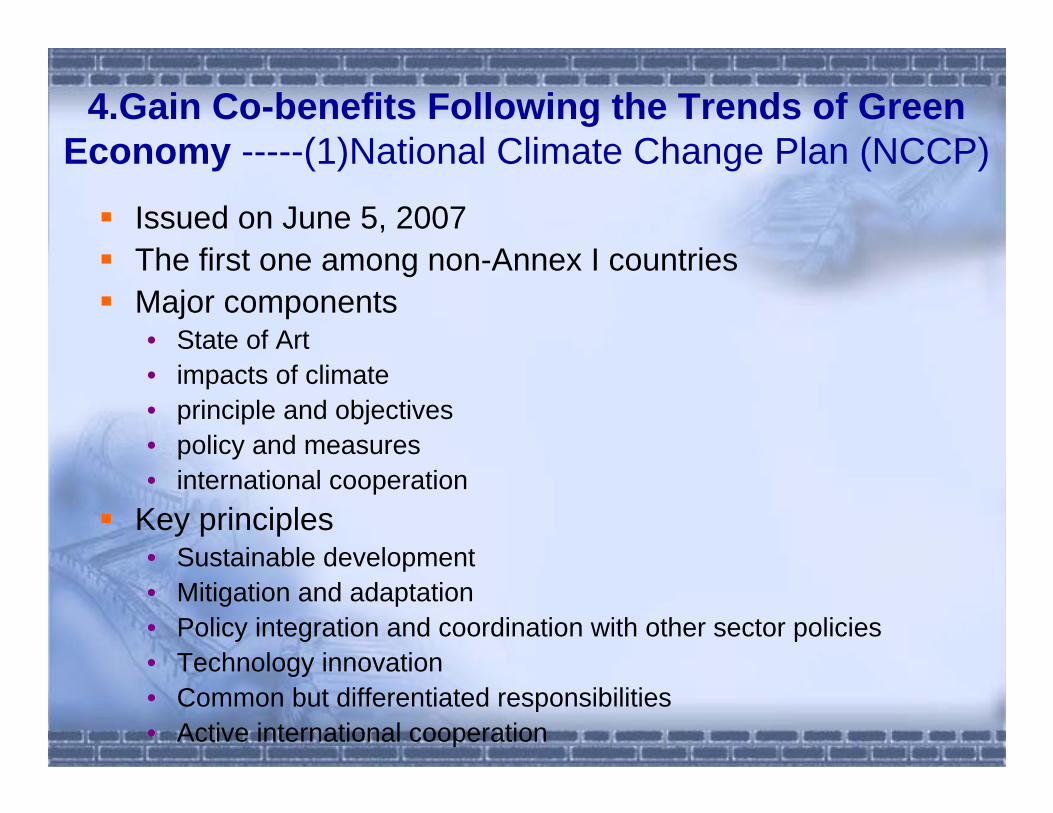
4.Gain Co-benefits Following the Trends of Green Economy -----(1)National Climate Change Plan (NCCP)
Issued on June 5, 2007 The first one among non-Annex I countriesMajor components• State of Art• impacts of climate • principle and objectives• policy and measures• international cooperation
Key principles• Sustainable development • Mitigation and adaptation • Policy integration and coordination with other sector policies• Technology innovation• Common but differentiated responsibilities • Active international cooperation
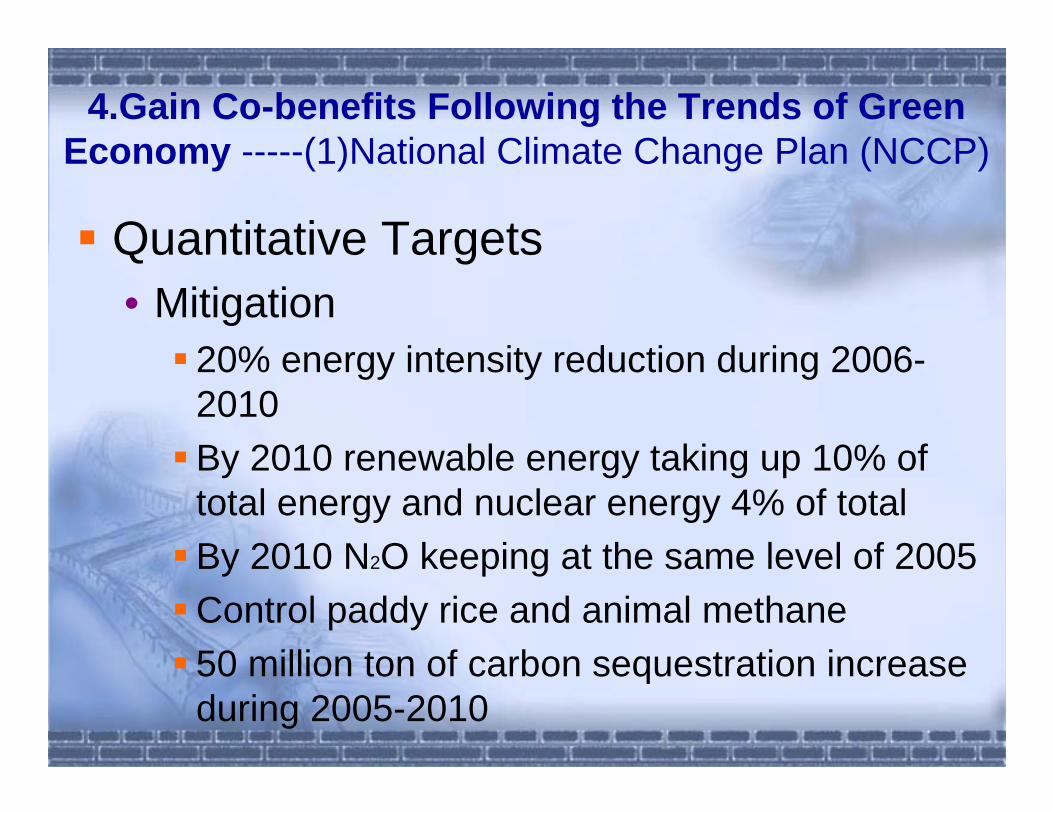
4.Gain Co-benefits Following the Trends of Green Economy -----(1)National Climate Change Plan (NCCP)
Quantitative Targets • Mitigation
20% energy intensity reduction during 2006-2010By 2010 renewable energy taking up 10% of total energy and nuclear energy 4% of total By 2010 N2O keeping at the same level of 2005Control paddy rice and animal methane 50 million ton of carbon sequestration increase during 2005-2010
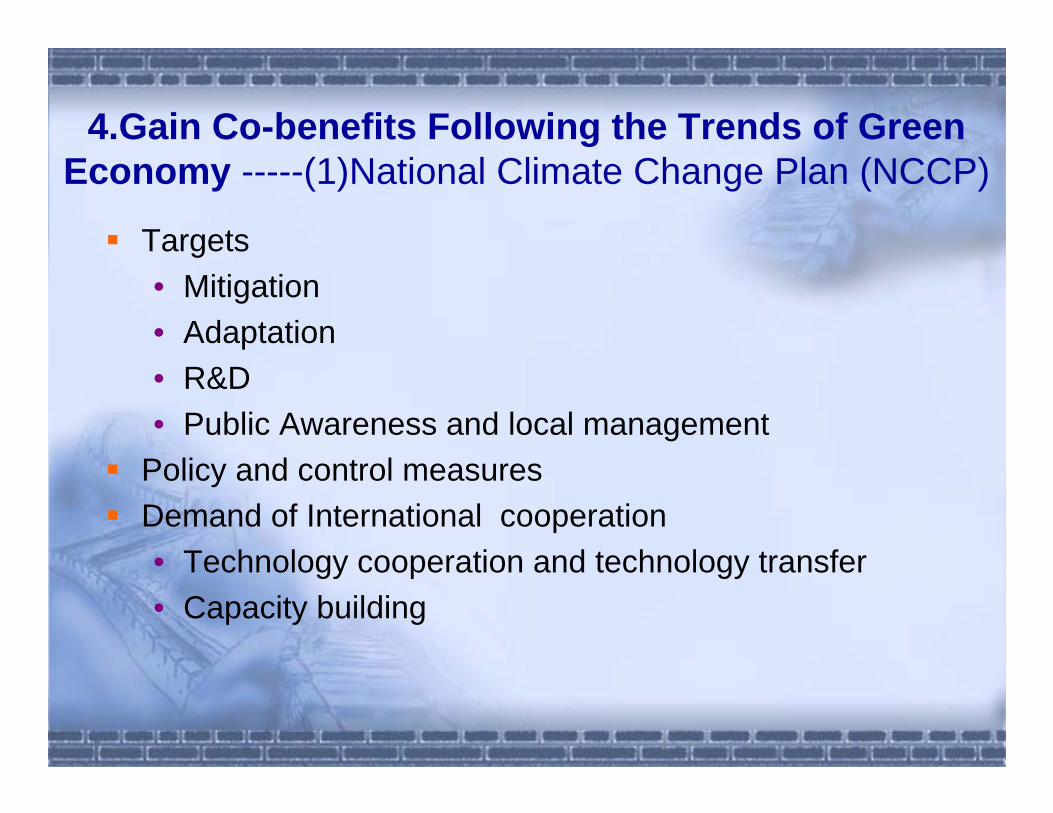
4.Gain Co-benefits Following the Trends of Green Economy -----(1)National Climate Change Plan (NCCP)
Targets • Mitigation • Adaptation• R&D• Public Awareness and local management
Policy and control measuresDemand of International cooperation • Technology cooperation and technology transfer• Capacity building
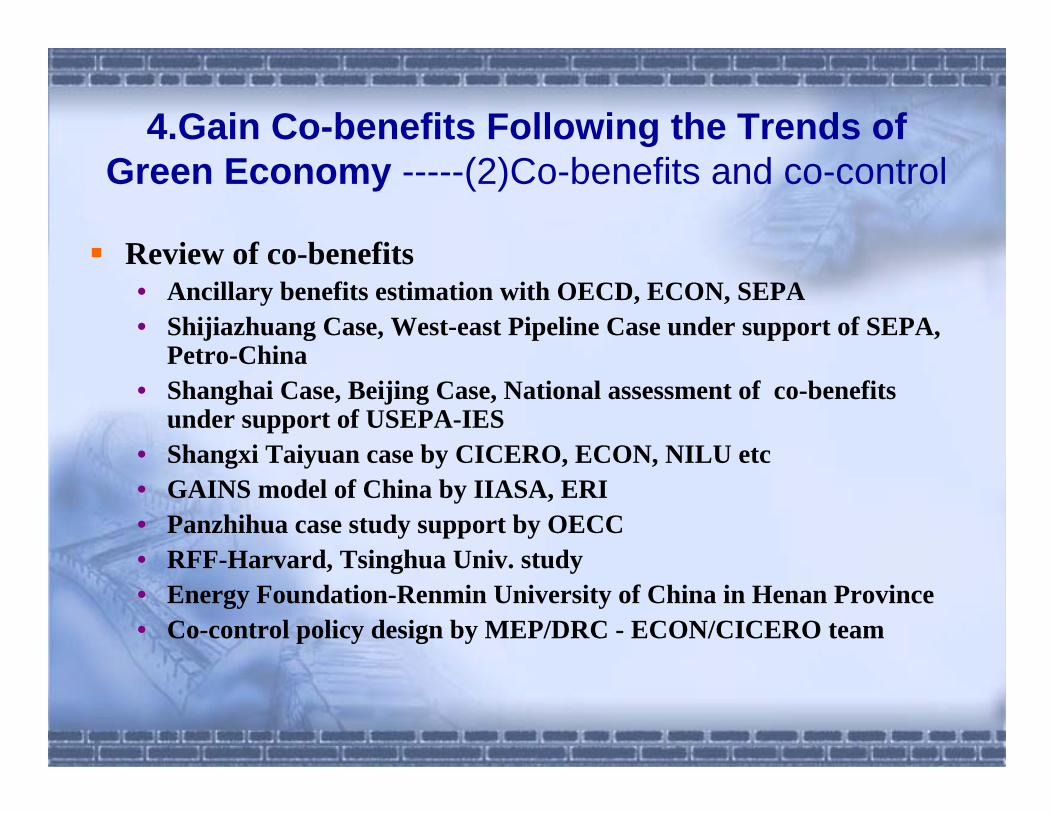
4.Gain Co-benefits Following the Trends of Green Economy -----(2)Co-benefits and co-control
Review of co-benefits • Ancillary benefits estimation with OECD, ECON, SEPA• Shijiazhuang Case, West-east Pipeline Case under support of SEPA,
Petro-China • Shanghai Case, Beijing Case, National assessment of co-benefits
under support of USEPA-IES• Shangxi Taiyuan case by CICERO, ECON, NILU etc • GAINS model of China by IIASA, ERI• Panzhihua case study support by OECC• RFF-Harvard, Tsinghua Univ. study• Energy Foundation-Renmin University of China in Henan Province • Co-control policy design by MEP/DRC - ECON/CICERO team
4.Gain Co-benefits Following the Trends of Green Economy -----(2)Co-benefits and co-control
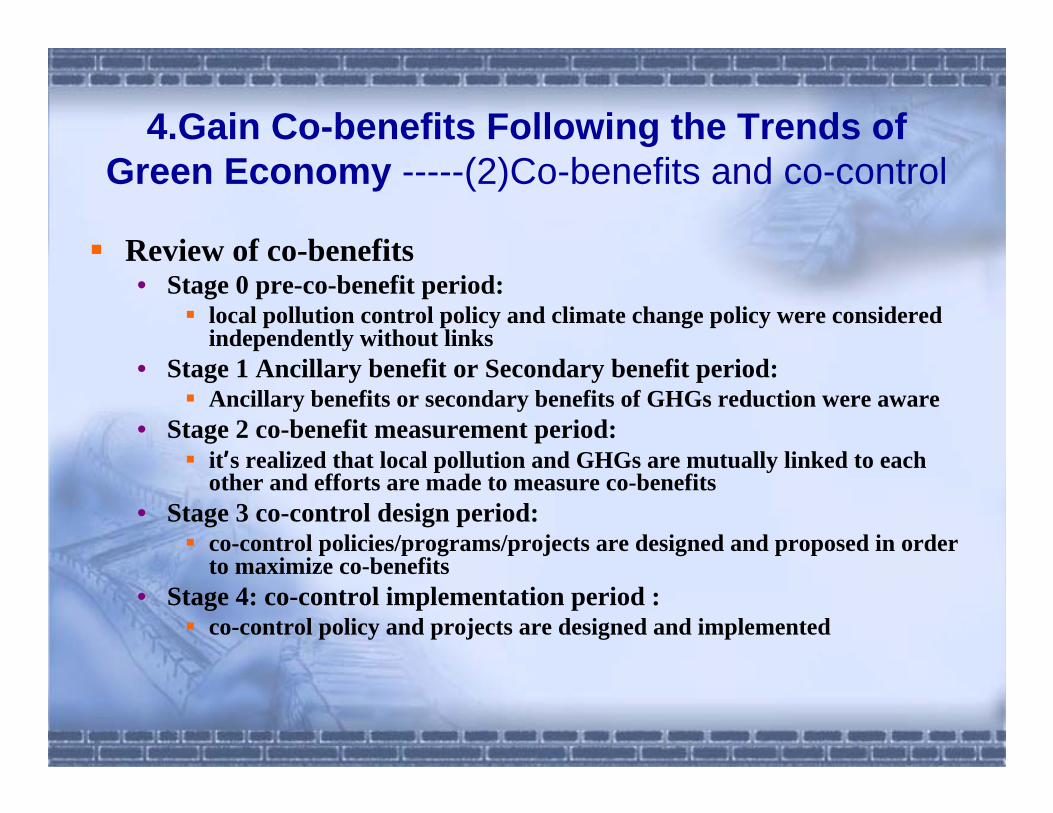
Review of co-benefits • Stage 0 pre-co-benefit period:
local pollution control policy and climate change policy were considered independently without links
• Stage 1 Ancillary benefit or Secondary benefit period: Ancillary benefits or secondary benefits of GHGs reduction were aware
• Stage 2 co-benefit measurement period: it’s realized that local pollution and GHGs are mutually linked to each other and efforts are made to measure co-benefits
• Stage 3 co-control design period: co-control policies/programs/projects are designed and proposed in order to maximize co-benefits
• Stage 4: co-control implementation period :co-control policy and projects are designed and implemented
4.Gain Co-benefits Following the Trends of Green Economy -----(2)Co-benefits and co-control
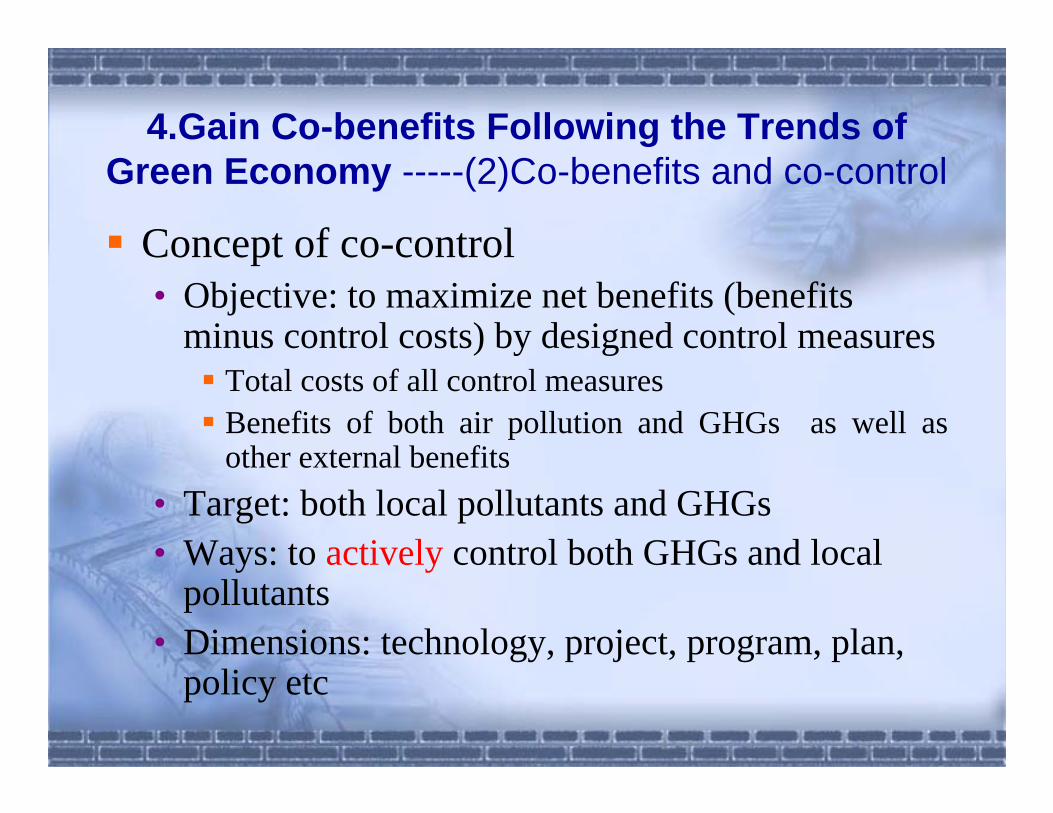
Concept of co-control• Objective: to maximize net benefits (benefits
minus control costs) by designed control measures Total costs of all control measures Benefits of both air pollution and GHGs as well as other external benefits
• Target: both local pollutants and GHGs• Ways: to actively control both GHGs and local
pollutants • Dimensions: technology, project, program, plan,
policy etc
4.Gain Co-benefits Following the Trends of Green Economy -----(2)Co-benefits and co-control
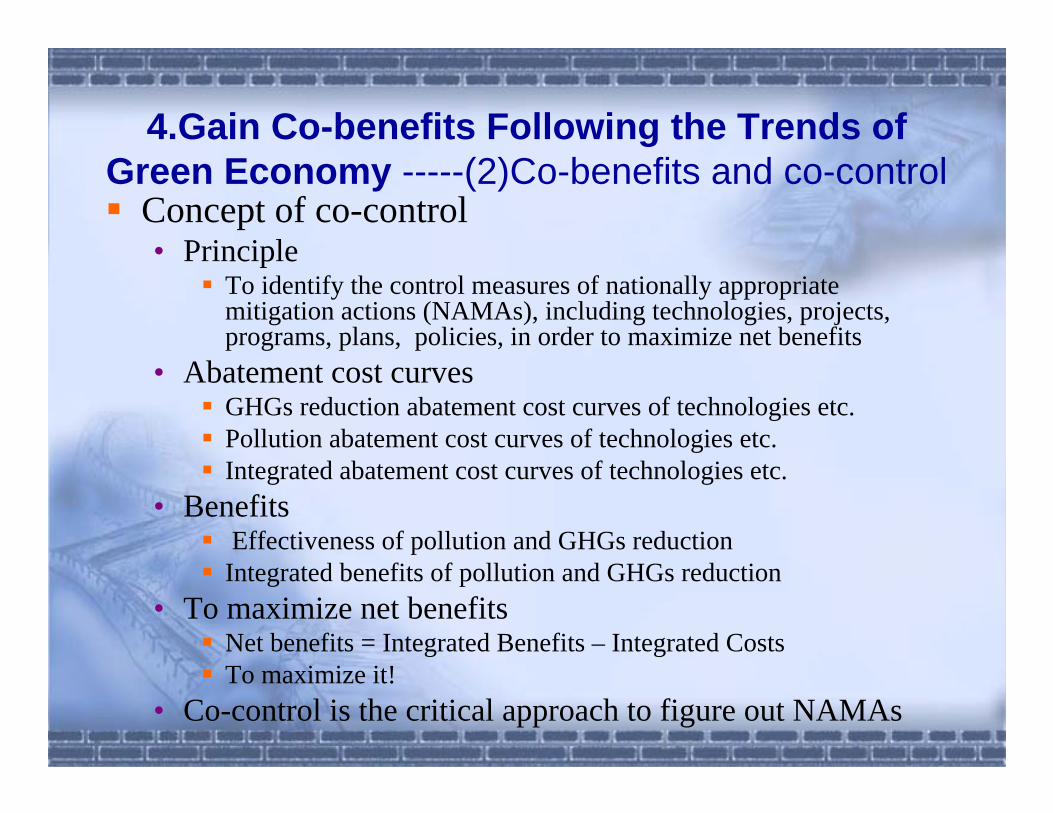
Concept of co-control• Principle
To identify the control measures of nationally appropriate mitigation actions (NAMAs), including technologies, projects, programs, plans, policies, in order to maximize net benefits
• Abatement cost curves GHGs reduction abatement cost curves of technologies etc. Pollution abatement cost curves of technologies etc.Integrated abatement cost curves of technologies etc.
• Benefits Effectiveness of pollution and GHGs reduction
Integrated benefits of pollution and GHGs reduction• To maximize net benefits
Net benefits = Integrated Benefits – Integrated CostsTo maximize it!
• Co-control is the critical approach to figure out NAMAs
4.Gain Co-benefits Following the Trends of Green Economy -----(2)Co-benefits and co-control
International Promotion Program• China-Norway co-benefits study• USEPA-IES study• OECC-IGES Panzhihua case study
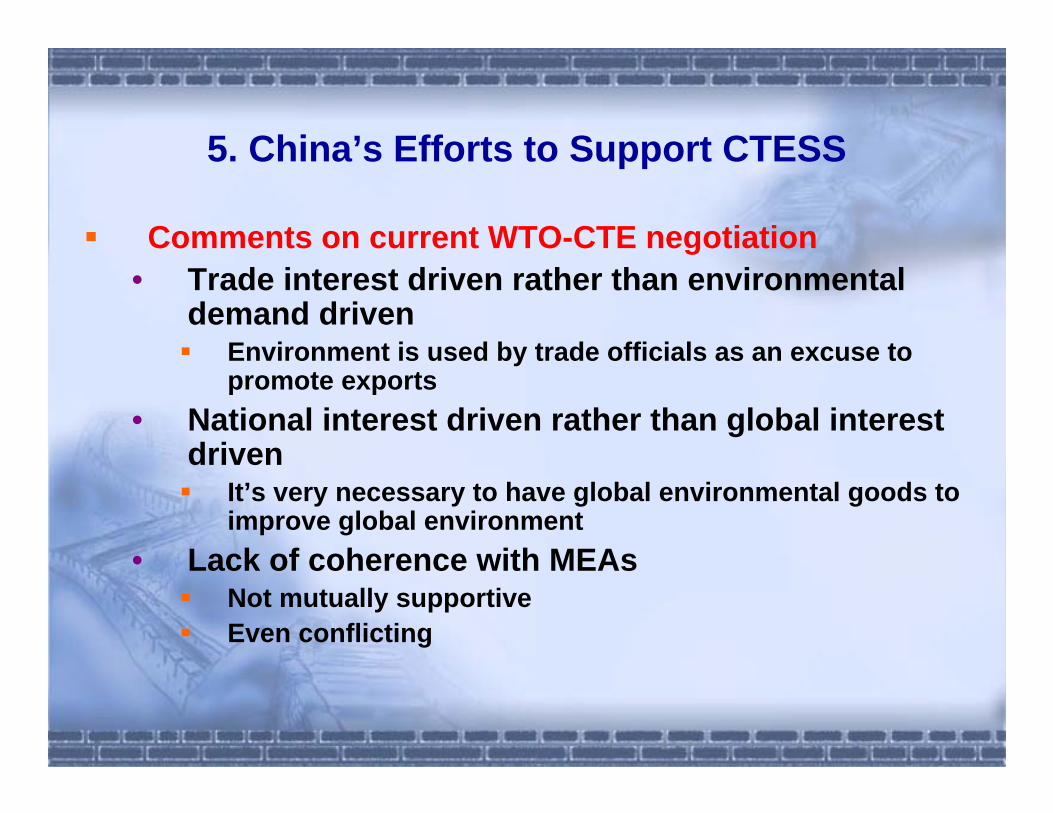
5. China’s Efforts to Support CTESS
Comments on current WTO-CTE negotiation• Trade interest driven rather than environmental
demand drivenEnvironment is used by trade officials as an excuse to promote exports
• National interest driven rather than global interest driven
It’s very necessary to have global environmental goods to improve global environment
• Lack of coherence with MEAs Not mutually supportive Even conflicting
5. China’s Efforts to Support CTESS
Definite environmental industries for producing EGS based on the demand of environmental challenges at the whole spectrum
• The EGS for improving indoor-environment• The EGS for improving outdoor, local and
regional environment (conventional ones)• The EGS for improving global-environment
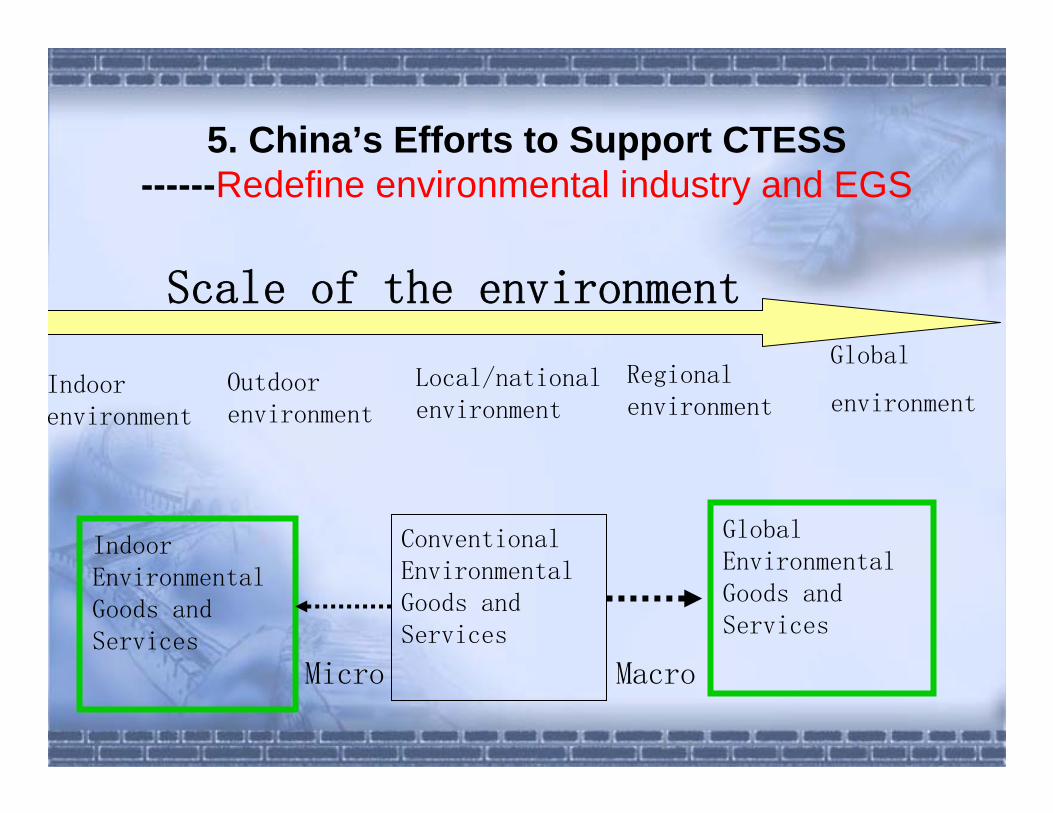
5. China’s Efforts to Support CTESS------Redefine environmental industry and EGS
Conventional Environmental Goods and Services
Indoor Environmental Goods and Services
Global Environmental Goods and Services
Indoor environment
Outdoor environment
Global
environment
Micro Macro
Scale of the environment
Regional environment
Local/national environment
Thank you!